
In Openshift Console Cluster Utilization Graph what is "total requested"
Hi,
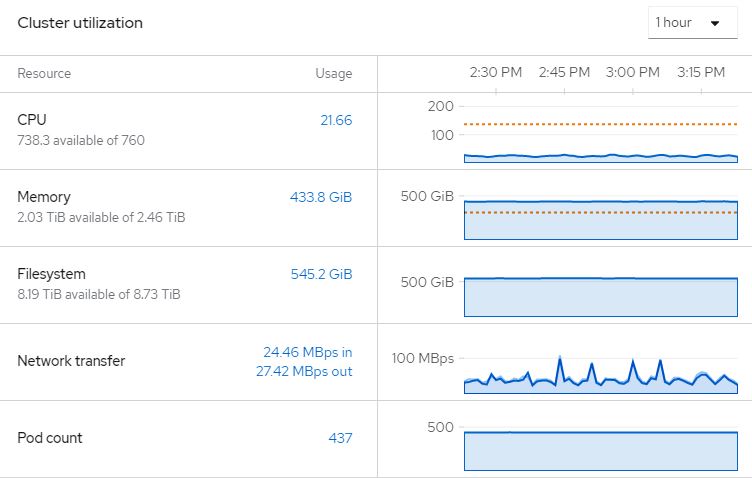
I attached a snapshot of our Openshift Console GUI.
The CPU shows ~22 vCPU used but I see a dotted line in the graph that if I move my mouse over it shows "136.6 total requested".
The same is true with Memory. It shows ~434G used but the dotted line graph shows "311 total requested".
I'm confused what the total requested values are? In the case of CPU the used is much lower than total requested. The opposite is true of memory where the used is much higher than total requested.
I'm trying to get a clear view on how much CPU / Memory / Disk our application is using. We only have the one application on this cluster.
Responses