
Subscription Watch
What is Subscription Watch and Why should I use it?
Subscription Watch is a capability in Red Hat’s subscription tools which provides unified, aggregated reporting of the usage of Red Hat technology, in any environment (Physical, Virtual, Public cloud, Private cloud, Edge).
By doing such, you are able to understand your:
- Usage - How much technology am I using?
- Capacity - How much technology have I purchased?
- Utilization - percentage of capacity I have exhausted by deploying technology.
Subscription Watch is available at console.redhat.com and is available for all customers and partners.
The video below covers more about why Red Hat built Subscription Watch , its sibling feature, Simple Content Access, and how both of the capabilities qualitatively improve your subscription experience.
Additionally, the video below convers some of the modern improvements to the Red Hat subscription experience.
Modernizing the Registration Experience
Getting started with Subscription Watch (or 'what is this chart actually telling me')
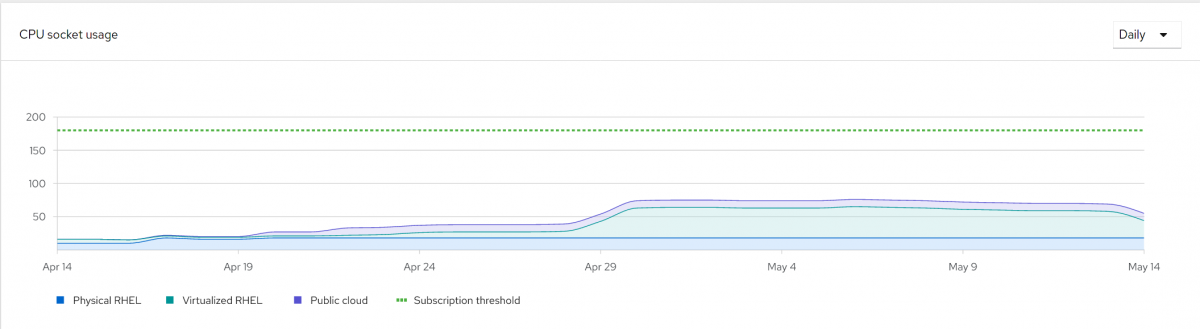
First, let's look at report from an account to see how usage, utilization, and capacity are visualized:
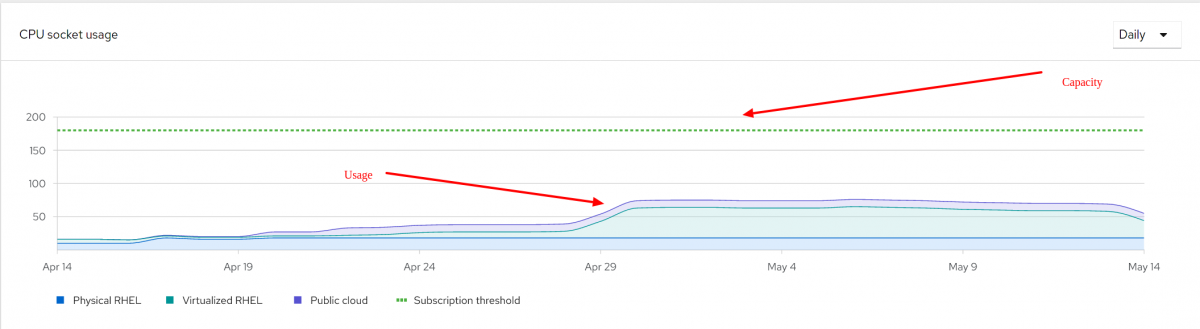
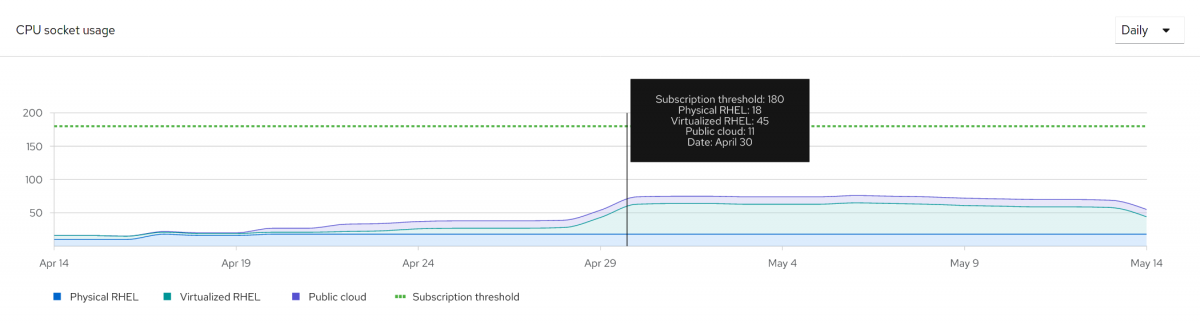
In these charts, I can see that this account has (on 30-Apr) a capacity (Subscription Threshold) of 180 sockets of RHEL, and usage of 74 sockets of RHEL (18 Physical, 45 Virtual, and 11 on the Public Cloud). The utilization of RHEL is thus 41%. Accurately representing this data is of utmost importance to Subscription Watch, as inaccuracies hinder adoption and more importantly, give the user incorrect information.
How do we generate these graphs?
We take a 5 step approach to representing usage, utilization, and capacity
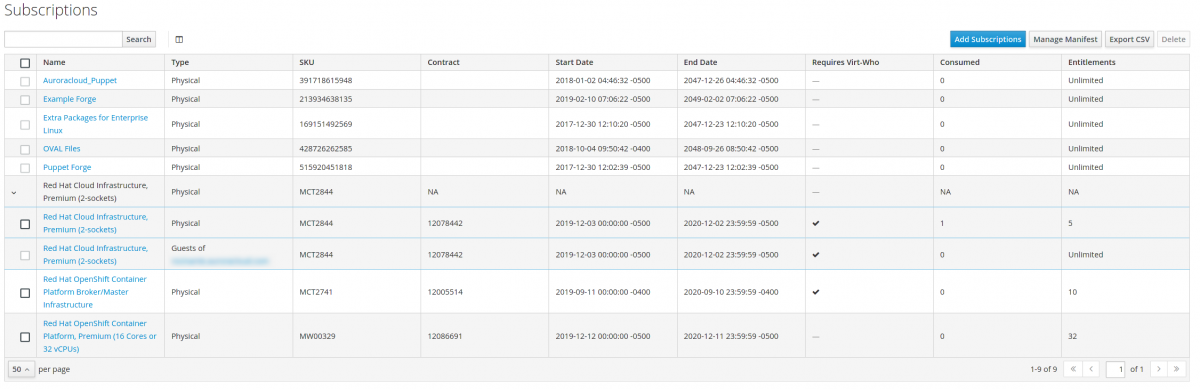
Step 0 - Understand that capacity provided by the subscriptions (Understand)
In order to draw the capacity line, Subscription Watch sums all of the subscriptions for a product. For instance, in this example above, we add all of the RHEL subscriptions which provide SOCKETS. In the case of Red Hat OpenShift Container Platform, we add all the subscriptions which provide both SOCKETS and CORES, as OpenShift has been sold in both units of measure.
Step 1 - Find the technology (Fingerprint)
In this step, we identify Red Hat technology when it is found in use. Think of it as: "If I could sit an administrator in front of a system running your technology, how would they positively confirm it is installed?" This can be (but is not limited to):
- Specific product certificates
- Presence of specific files
- Running a specific command.
In the case of Red Hat Enterprise Linux, we identify the product via its product certificates in /etc/pki/product. For OpenShift, we use both product certificates AND reported clusters from OpenShift Cluster Manager. The client tools (such as subscription-manager and insights-client) gather this information
Step 2 - Measure the technology and its use-cases (Count)
How is the technology sold? What is its unit-of-measure? Using the client tools (subscription-manager, insights-client), server tools (Satellite, Discovery), or hosted/SaaS tools (Red Hat Subscription Management, OpenShift Cluster Manager, etc), we gather information such as sockets, cores, memory, topology, host/guest mapping so that your technology can be measured properly
Additionally, use-case information which generally aren't system facts also needs to be gathered. Information such as:
- Technical use case information (e.g. RHEL used as a Server)
- Business use case information (e.g for Disaster Recovery purposes)
- Operational use case information (e.g Premium vs Standard, L3 only versus L1-L3)
Step 3 - Interpret your technology through the lens of the business model (Interpret)
If there are additional constraints or rules beyond just a strict counting of technology units, we interpret and rationalize those.
Example: RHEL has virtual datacenter (vDC) subscriptions, which support multiple guests running on a hypervisor. In this example, we use additional data gathered in the count section (host/guest mapping) to only count the product usage of the hypervisor when it is supporting multiple guests, in lieu of counting each guest individually.
Step 4 - Show the user a report that is easily understood (Visualize)
With steps 0-3 complete, we can now show the user a report that is sensible, stamped out at the granularity (daily, monthly, etc) that makes sense.
What Operational Changes do I have to make in order to use Subscription Watch?
Subscription Watch is a unified, account-wide dashboard. To show an accurate account-wide view, Subscription Watch requires an accurate account-wide inventory to be submitted.
Are you an Red Hat Subscription Management(RHSM) or Connected OpenShift Container Platform 4 user? If yes, no work is required on your part. Inventory from both of these platforms is automatically synchronized to Subscription Watch. Simply log into Subscription Watch
Red Hat Satellite user?
Red Hat Satellite, being explicitly designed to be an on-premise tool, requires additional configuration to ensure its inventory is uploaded to Subscription Watch. Satellite users can use either the Insights client OR the Satellite Inventory Upload Plug-in
Which of the two should you use?
- The Insights client is ideal as its provides inventory for Subscription Watch AND configures a system for the Insights apps. The investment in getting the Insights client supports all of the following services
- The Satellite Inventory Plugin is useful when the Insights client cannot be deployed or when a Satellite is disconnected (and cannot directly connect to console.redhat.com). The Satellite plugin also is the ONLY on-premise tool which can report host/guest mapping data (which is normally submitted via
virt-who) to Subscription Watch. You will NOT have accurate utilization reported in Subscription Watch if you are a Satellite user, you have subscriptions that require virt-who, and you do NOT use the Satellite inventory plugin.
Unsure what subscriptions in your Satellite require virt-who? These can be viewed in the Satellite UI, via Content -> Subscriptions
NOTE: It is a valid configuration to use BOTH tools simultaneously. If a system is reported by multiple tools, it is counted only once.
Further Reading
There are a number of documents which are worth reading to further your knowledge and understanding of Simple Content Access and Subscription Watch:
Comments