
Automation Controller Administration Guide
Administrator Guide for Automation Controller
Abstract
Preface
The automation controller Administration Guide describes the administration of automation controller through custom scripts, management jobs, and more. Written for DevOps engineers and administrators, the automation controller Administration Guide assumes a basic understanding of the systems requiring management with automation controllers easy-to-use graphical interface.
Making open source more inclusive
Red Hat is committed to replacing problematic language in our code, documentation, and web properties. We are beginning with these four terms: master, slave, blacklist, and whitelist. Because of the enormity of this endeavor, these changes will be implemented gradually over several upcoming releases. For more details, see our CTO Chris Wright’s message.
Providing feedback on Red Hat documentation
If you have a suggestion to improve this documentation, or find an error, please contact technical support at https://access.redhat.com to create an issue on the Ansible Automation Platform Jira project using the docs-product component.
Chapter 1. Automation controller licensing, updates and support
Automation controller is provided as part of your annual Red Hat Ansible Automation Platform subscription.
Ansible is an open source software project and is licensed under the GNU General Public License version 3, as described in the Ansible Source Code
You must have valid subscriptions attached before installing Ansible Automation Platform.
For more information, see Attaching Subscriptions.
1.1. Trial and evaluation
You require a license to run automation controller. You can start by using a free trial license.
- Trial licenses for Ansible Automation Platform are available at: http://ansible.com/license
- Support is not included in a trial license or during an evaluation of the automation controller software.
1.2. Subscription Types
Red Hat Ansible Automation Platform is provided at various levels of support and number of machines as an annual subscription.
Standard:
- Manage any size environment
- Enterprise 8x5 support and SLA
- Maintenance and upgrades included
- Review the SLA at Product Support Terms of Service
- Review the Red Hat Support Severity Level Definitions
Premium:
- Manage any size environment, including mission-critical environments
- Premium 24x7 support and SLA
- Maintenance and upgrades included
- Review the SLA at Product Support Terms of Service
- Review the Red Hat Support Severity Level Definitions
All subscription levels include regular updates and releases of automation controller, Ansible, and any other components of the Platform.
For more information, contact Ansible through the Red Hat Customer Portal or at http://www.ansible.com/contact-us/.
1.3. Node counting in licenses
The automation controller license defines the number of Managed Nodes that can be managed as part of a Red Hat Ansible Automation Platform subscription.
A typical license says "License Count: 500", which sets the maximum number of Managed Nodes at 500.
For more information on managed node requirements for licensing, see https://access.redhat.com/articles/3331481.
Ansible does not recycle node counts or reset automated hosts.
1.4. Attaching Subscriptions
You must have valid Ansible Automation Platform subscriptions attached before installing Ansible Automation Platform.
Attaching subscriptions is unnecessary if your Red Hat account has enabled Simple Content Access Mode. However, you must register to Red Hat Subscription Management (RHSM) or Red Hat Satellite before installing Ansible Automation Platform.
Procedure
To find the
pool_idof your subscription, enter the following command:# subscription-manager list --available --all | grep "Ansible Automation Platform" -B 3 -A 6
The command returns the following:
Subscription Name: Red Hat Ansible Automation Platform, Premium (5000 Managed Nodes)
Provides: Red Hat Ansible Engine
Red Hat Single Sign-On
Red Hat Ansible Automation Platform
SKU: MCT3695
Contract: ********
Pool ID: ********************
Provides Management: No
Available: 4999
Suggested: 1
To attach this subscription, enter the following command:
# subscription-manager attach --pool=<pool_id>
If all nodes have attached, then the repositories are found.
To check whether the subscription attached successfully, enter the following command:
# subscription-manager list --consumed
To remove this subscription, enter the following command:
#subscription-manager remove --pool=<pool_id>
1.5. Component licenses
To view the license information for the components included in automation controller, refer to /usr/share/doc/automation-controller-<version>/README.
where <version> refers to the version of automation controller you have installed.
To view a specific license, refer to /usr/share/doc/automation-controller-<version>/*.txt.
where * is the license file name to which you are referring.
Chapter 2. Start, stop, and restart automation controller
Automation controller ships with an administrator utility script, automation-controller-service. The script can start, stop, and restart all automation controller services running on the current single automation controller node. The script includes the message queue components and the database if it is an integrated installation.
External databases must be explicitly managed by the administrator. You can find the services script in /usr/bin/automation-controller-service, which can be invoked with the following command:
root@localhost:~$ automation-controller-service restart
In clustered installs, the automation-controller-service restart does not include PostgreSQL as part of the services that are restarted. This is because it exists external to automation controller, and PostgreSQL does not always need to be restarted. Use systemctl restart automation-controller to restart services on clustered environments instead.
You must also restart each cluster node for certain changes to persist as opposed to a single node for a localhost install.
For more information on clustered environments, see the Clustering section.
You can also invoke the services script using distribution-specific service management commands. Distribution packages often provide a similar script, sometimes as an init script, to manage services. For more information, see your distribution-specific service management system.
When running automation controller in a container, do not use the automation-controller-service script. Restart the pod using the container environment instead.
Chapter 3. Custom Inventory Scripts
Inventory scripts have been discontinued.
For more information, see Export old inventory scripts in the Automation controller User Guide.
If you use custom inventory scripts, migrate to sourcing these scripts from a project. For more information, see Inventory File Importing, and Inventory sources in the Automation controller User Guide.
If you are setting up an inventory file, see Editing the Red Hat Ansible Automation Platform installer inventory file and find examples specific to your setup.
If you are migrating to execution environments, see:
- Upgrading to execution environments.
- Creating and consuming execution environments.
- Automation mesh design patterns.
- Mesh Topology in the Ansible Automation Platform Upgrade and Migration Guide to validate your topology.
For more information about automation mesh on a VM-based installation, see the Red Hat Ansible Automation Platform automation mesh guide for VM-based installations.
For more information about automation mesh on an operator-based installation, see the Red Hat Ansible Automation Platform automation mesh for operator-based installations.
If you already have a mesh topology set up and want to view node type, node health, and specific details about each node, see Topology Viewer.
Chapter 4. Inventory File Importing
Automation controller enables you to choose an inventory file from source control, rather than creating one from scratch. This function is the same as for custom inventory scripts, except that the contents are obtained from source control instead of editing their contents in a browser. This means that the files are non-editable, and as inventories are updated at the source, the inventories within the projects are also updated accordingly, including the group_vars and host_vars files or directory associated with them. SCM types can consume both inventory files and scripts. Both inventory files and custom inventory types use scripts.
Imported hosts have a description of imported by default. This can be overridden by setting the _awx_description variable on a given host. For example, if importing from a sourced .ini file, you can add the following host variables:
[main]
127.0.0.1 _awx_description="my host 1"
127.0.0.2 _awx_description="my host 2"
Similarly, group descriptions also default to imported, but can also be overridden by _awx_description.
To use old inventory scripts in source control, see Export old inventory scripts in the Automation controller User Guide.
4.1. Custom Dynamic Inventory Scripts
A custom dynamic inventory script stored in version control can be imported and run. This makes it much easier to make changes to an inventory script. Rather than having to copy and paste a script into automation controller, it is pulled directly from source control and then executed. The script must handle any credentials required for its task. You are responsible for installing any Python libraries required by the script. (Custom dynamic inventory scripts have the same requirement.) This applies to both user-defined inventory source scripts and SCM sources as they are both exposed to Ansible virtualenv requirements related to playbooks.
You can specify environment variables when you edit the SCM inventory source. For some scripts, this is sufficient. However, this is not a secure way to store secret information that gives access to cloud providers or inventory.
A better way is to create a new credential type for the inventory script you are going to use. The credential type must specify all the necessary types of inputs. Then, when you create a credential of this type, the secrets are stored in an encrypted form. If you apply that credential to the inventory source, the script has access to those inputs.
For more information, see Custom Credential Types in the Automation controller User Guide.
4.2. SCM Inventory Source Fields
The source fields used are:
-
source_project: the project to use. -
source_path: the relative path inside the project indicating a directory or a file. If left blank, "" is still a relative path indicating the root directory of the project. -
source_vars: if set on a "file" type inventory source then they are passed to the environment variables when running.
Additionally:
- An update of the project automatically triggers an inventory update where it is used.
- An update of the project is scheduled immediately after creation of the inventory source.
- Neither inventory nor project updates are blocked while a related job is running.
-
In cases where you have a large project (around 10 GB), disk space on
/tmpcan be an issue.
You can specify a location manually in the automation controller UI from the Create Inventory Source page. Refer to Adding a source for instructions on creating an inventory source.
When you update a project, refresh the listing to use the latest SCM information. If no inventory sources use a project as an SCM inventory source, then the inventory listing might not be refreshed on update.
For inventories with SCM sources, the Job Details page for inventory updates displays a status indicator for the project update and the name of the project.
The status indicator links to the project update job.
The project name links to the project.
You can perform an inventory update while a related job is running.
4.2.1. Supported File Syntax
Automation controller uses the ansible-inventory module from Ansible to process inventory files, and supports all valid inventory syntax that automation controller requires.
Chapter 5. Multi-Credential Assignment
Automation controller provides support for assigning zero or more credentials to a job template.
5.1. Background
Before automation controller v3.3, job templates had the following requirements with respect to credentials:
- All job templates (and jobs) were required to have exactly one Machine/SSH or Vault credential (or one of both).
- All job templates (and jobs) could have zero or more "extra" credentials.
-
Extra credentials represented "Cloud" and "Network" credentials that could be used to provide authentication to external services through environment variables, for example,
AWS_ACCESS_KEY_ID.
This model required a variety of disjoint interfaces for specifying credentials on a job template and it lacked the ability to associate multiple Vault credentials with a playbook run, a use case supported by Ansible core from Ansible 2.4 onwards.
This model also poses a stumbling block for certain playbook execution workflows, such as having to attach a "dummy" Machine/SSH credential to the job template to satisfy the requirement.
5.2. Important Changes
All automation controller 4.4 Job templates have a single interface for credential assignment.
From the API endpoint:
GET /api/v2/job_templates/N/credentials/
You can associate and disassociate credentials using POST requests, similar to the behavior in the deprecated extra_credentials endpoint:
POST /api/v2/job_templates/N/credentials/ {'associate': true, 'id': 'X'}
POST /api/v2/job_templates/N/credentials/ {'disassociate': true, 'id': 'Y'}
With this model, a job template is considered valid even when there are no credentials assigned to it. This model also provides users the ability to assign multiple Vault credentials to a job template.
5.3. Launch Time Considerations
Before automation controller v3.3, job templates used a configurable attribute, ask_credential_on_launch. This value was used at launch time to determine which missing credential values were necessary for launch. This was a way to specify a Machine or SSH credential to satisfy the minimum credential requirement.
Under the unified credential list model, this attribute still exists, but it no longer requires a credential. Now when ask_credential_on_launch is true, it signifies that you can specify a list of credentials at launch time to override those defined on the job template. For example:
POST /api/v2/job_templates/N/launch/ {'credentials': [A, B, C]}`
If ask_credential_on_launch is false, it signifies that custom credentials provided in the POST /api/v2/job_templates/N/launch/ are ignored.
Under this model, the only purpose for ask_credential_on_launch is to signal API clients to prompt the user for (optional) changes at launch time.
5.4. Multi-Vault Credentials
Because you can assign multiple credentials to a job, you can specify multiple Vault credentials to decrypt when your job template runs. This functionality mirrors the support for Managing vault passwords.
Vault credentials now have an optional field, vault_id, which is similar to the --vault-id argument of ansible-playbook.
Use the following procedure to run a playbook which makes use of multiple vault passwords:
Procedure
- Create a Vault credential in automation controller for each vault password.
- Specify the Vault ID as a field on the credential and input the password (which is encrypted and stored).
- Assign multiple vault credentials to the job template using the new credentials endpoint:
POST /api/v2/job_templates/N/credentials/

{
    'associate': true,
    'id': X
}
Alternatively, you can perform the same assignment in the automation controller UI in the Create Credential page:
In this example, the credential created specifies the secret to be used by its Vault Identifier ("first") and password pair. When this credential is used in a Job Template, as in the following example, it only decrypts the secret associated with the "first" Vault ID:
If you have a playbook that is set up the traditional way with all the secrets in one big file without distinction, then leave the Vault Identifier field blank when setting up the Vault credential.
5.4.1. Prompted Vault Credentials
For passwords for Vault credentials that are marked with Prompt on launch, the launch endpoint of any related Job Templates communicate necessary Vault passwords using the passwords_needed_to_start parameter:
GET /api/v2/job_templates/N/launch/
{
    'passwords_needed_to_start': [
        'vault_password.X',
        'vault_password.Y',
    ]
}
Where X and Y are primary keys of the associated Vault credentials:
POST /api/v2/job_templates/N/launch/
{
    'credential_passwords': {
        'vault_password.X': 'first-vault-password'
        'vault_password.Y': 'second-vault-password'
    }
}
5.4.2. Linked credentials
Instead of uploading sensitive credential information into automation controller, you can link credential fields to external systems and use them to run your playbooks.
For more information, see Secret Management System in the Automation controller User Guide.
Chapter 6. Management Jobs
Management Jobs assist in the cleaning of old data from automation controller, including system tracking information, tokens, job histories, and activity streams. You can use this if you have specific retention policies or need to decrease the storage used by your automation controller database.
From the navigation panel, select → .
The following job types are available for you to schedule and launch:
- Cleanup Activity Stream: Remove activity stream history older than a specified number of days
- Cleanup Expired OAuth 2 Tokens: Remove expired OAuth 2 access tokens and refresh tokens
- Cleanup Expired Sessions: Remove expired browser sessions from the database
- Cleanup Job Details: Remove job history older than a specified number of days
6.1. Removing Old Activity Stream Data
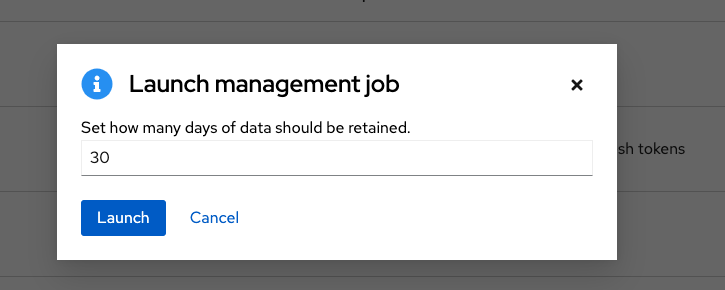
To remove older activity stream data, click the launch
![]() icon beside Cleanup Activity Stream.
icon beside Cleanup Activity Stream.
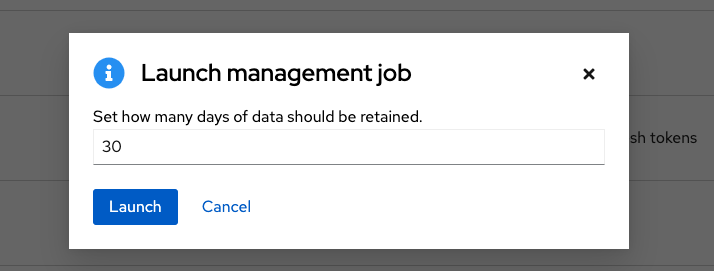
Enter the number of days of data you would like to save and click .
6.1.1. Scheduling deletion
Use the following procedure to review or set a schedule for purging data marked for deletion:
Procedure
For a particular cleanup job, click the Schedules tab.
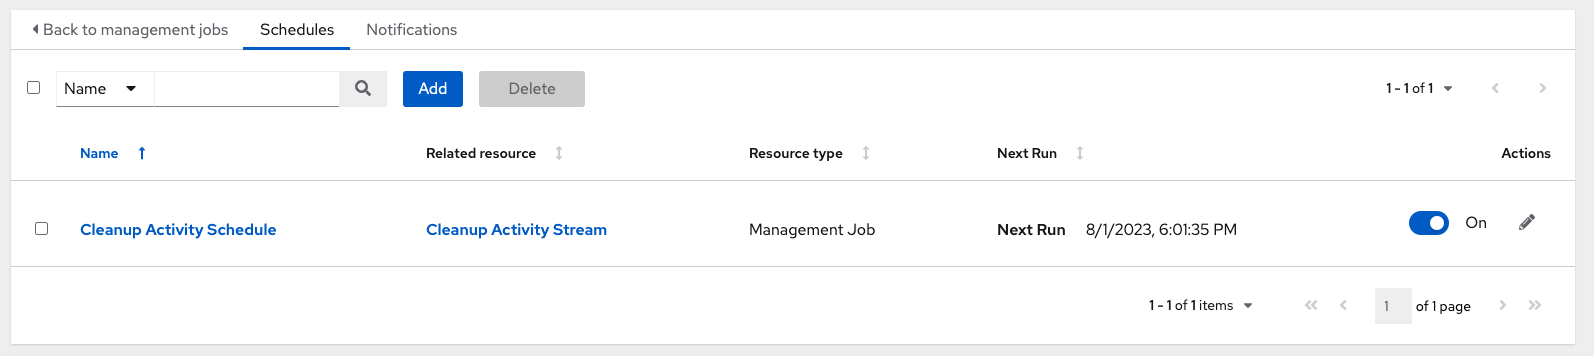
Note that you can turn this scheduled management job on and off using the ON/OFF toggle button.
- Click the name of the job, "Cleanup Activity Schedule" in this example, to review the schedule settings.
Click to modify them. You can also click to create a new schedule for this management job.
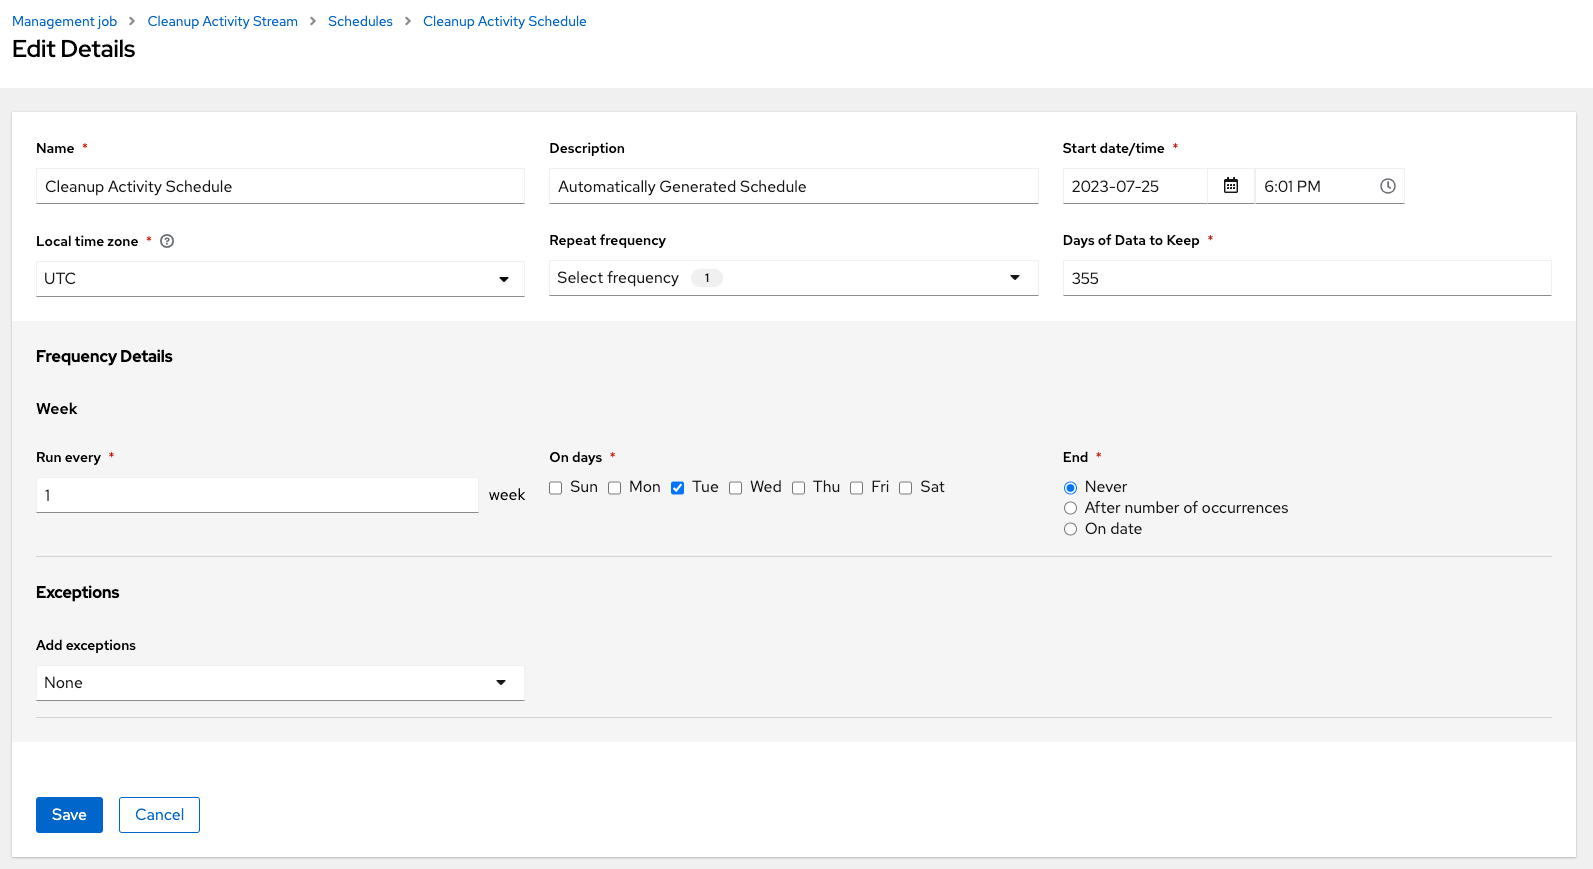
Enter the appropriate details into the following fields and click Save:
- Name required
- Start Date required
- Start Time required
- Local time zone the entered Start Time should be in this timezone.
- Repeat frequency the appropriate options display as the update frequency is modified including data you do not want to include by specifying exceptions.
- Days of Data to Keep required - specify how much data you want to retain.
The Details tab displays a description of the schedule and a list of the scheduled occurrences in the selected Local Time Zone.
Jobs are scheduled in UTC. Repeating jobs that run at a specific time of day can move relative to a local timezone when Daylight Saving Time shifts occur.
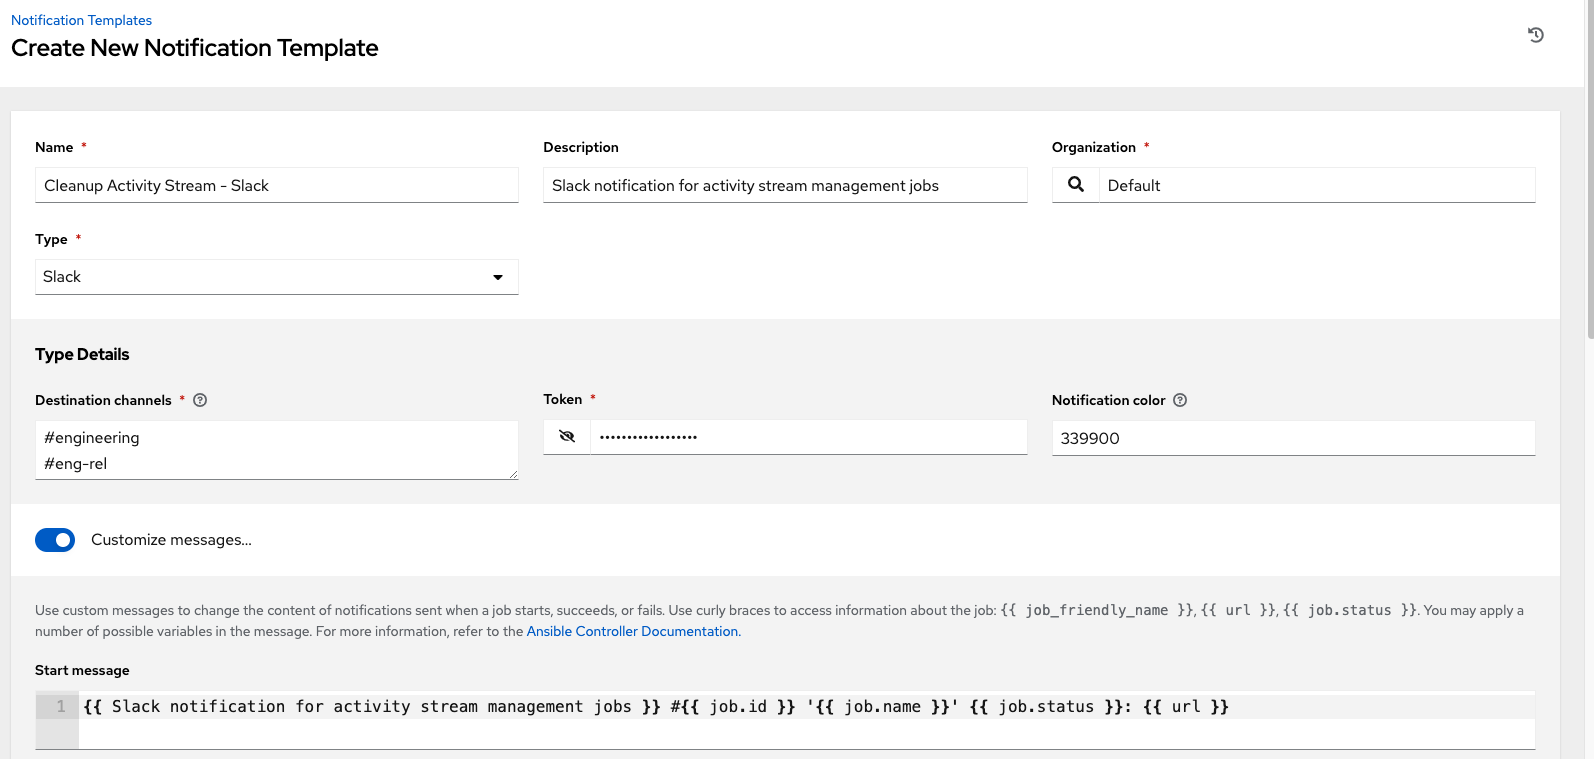
6.1.2. Setting notifications
Use the following procedure to review or set notifications associated with a management job:
Procedure
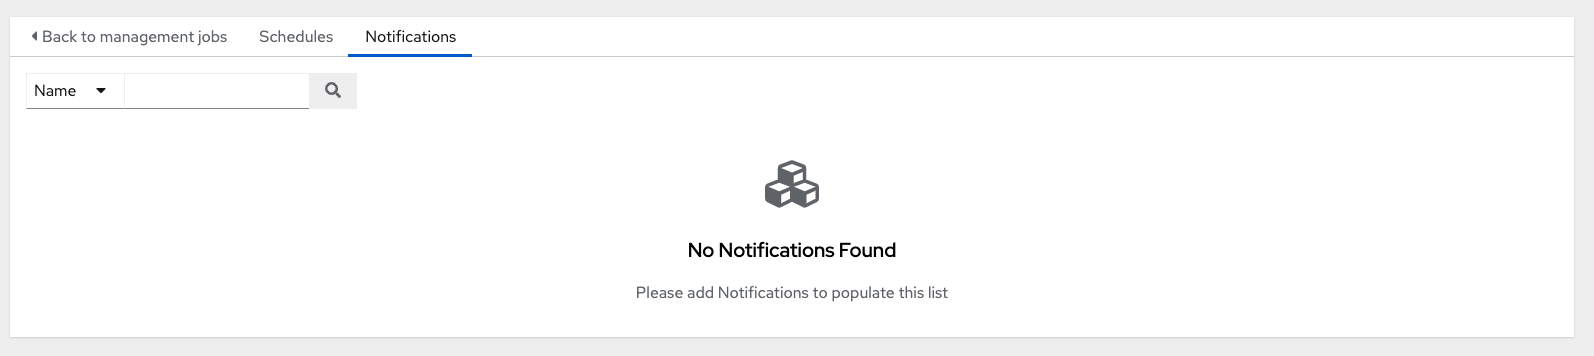
- For a particular cleanup job, select the Notifications tab.
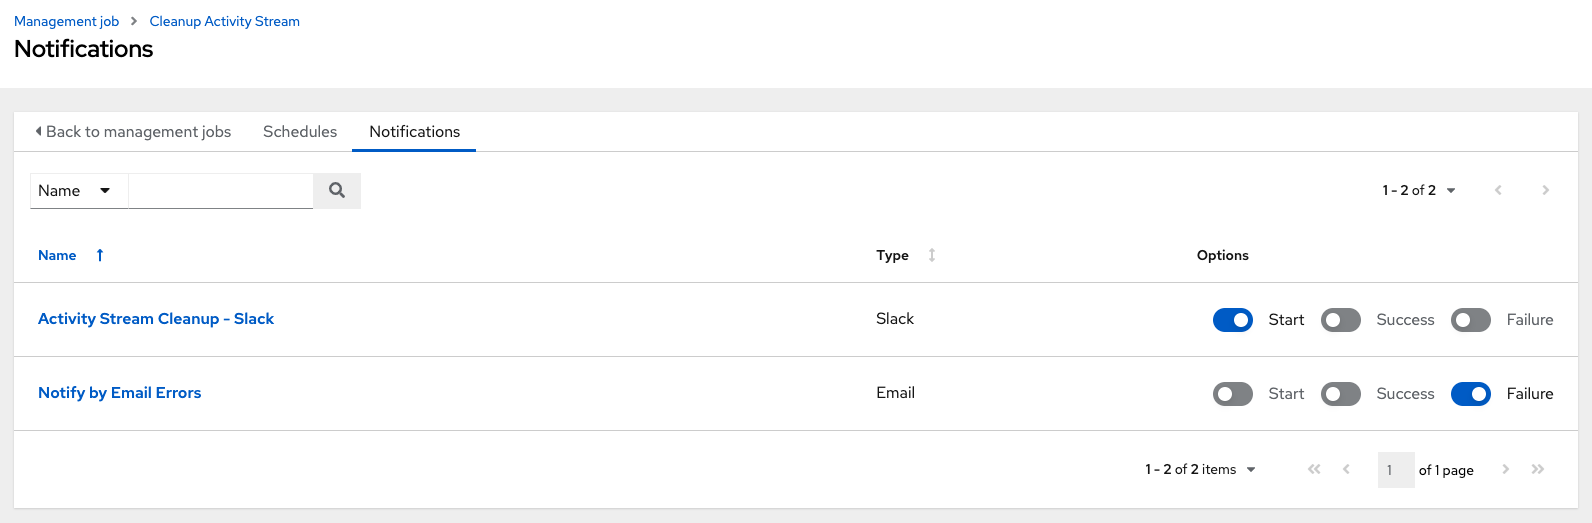
If none exist, for more information, see Notifications in the Automation controller User Guide.
The following shows an example of a notification with details specified:
6.2. Cleanup Expired OAuth2 Tokens
To remove expired OAuth2 tokens, click the launch
![]() icon next to Cleanup Expired OAuth2 Tokens.
icon next to Cleanup Expired OAuth2 Tokens.
You can review or set a schedule for cleaning up expired OAuth2 tokens by performing the same procedure described for activity stream management jobs.
For more information, see Scheduling deletion.
You can also set or review notifications associated with this management job the same way as described in setting notifications for activity stream management jobs.
For more information, see Notifications in the Automation controller User Guide.
6.2.1. Cleanup Expired Sessions
To remove expired sessions, click the launch
![]() icon beside Cleanup Expired Sessions.
icon beside Cleanup Expired Sessions.
You can review or set a schedule for cleaning up expired sessions by performing the same procedure described for activity stream management jobs. For more information, see Scheduling deletion.
You can also set or review notifications associated with this management job the same way as described in Notifications for activity stream management jobs.
For more information, see Notifications in the Automation controller User Guide.
6.2.2. Removing Old Job History
To remove job history older than a specified number of days, click the launch
![]() icon beside Cleanup Job Details.
icon beside Cleanup Job Details.
Enter the number of days of data you would like to save and click .
The initial job run for an automation controller resource, such as Projects, or Job Templates, are excluded from Cleanup Job Details, regardless of retention value.
You can review or set a schedule for cleaning up old job history by performing the same procedure described for activity stream management jobs.
For more information, see Scheduling deletion.
You can also set or review notifications associated with this management job in the same way as described in Notifications for activity stream management jobs, or for more information, see Notifications in the Automation controller User Guide.
Chapter 7. Clustering
Clustering is sharing load between hosts. Each instance must be able to act as an entry point for UI and API access. This must enable the automation controller administrators to use load balancers in front of as many instances as they want and keep good data visibility.
Load balancing is optional, and it is entirely possible to have ingress on one or all instances as needed.
Each instance must be able to join the automation controller cluster and expand its ability to run jobs. This is a simple system where jobs can run anywhere rather than be directed on where to run. Also, you can group clustered instances into different pools or queues, called Instance groups.
Ansible Automation Platform supports container-based clusters by using Kubernetes, meaning you can install new automation controller instances on this platform without any variation or diversion in functionality. You can create instance groups to point to a Kubernetes container. For more information, see the Container and instance groups section.
Supported operating systems
The following operating systems are supported for establishing a clustered environment:
- Red Hat Enterprise Linux 8 or later
Isolated instances are not supported in conjunction with running automation controller in OpenShift.
7.1. Setup considerations
Learn about the initial setup of clusters. To upgrade an existing cluster, see Upgrade Planning in the Ansible Automation Platform Upgrade and Migration Guide.
Note the following important considerations in the new clustering environment:
- PostgreSQL is a standalone instance and is not clustered. Automation controller does not manage replica configuration or database failover (if the user configures standby replicas).
- When you start a cluster, the database node must be a standalone server, and PostgreSQL must not be installed on one of the automation controller nodes.
-
PgBouncer is not recommended for connection pooling with automation controller. Automation controller relies on
pg_notifyfor sending messages across various components, and therefore, PgBouncer cannot readily be used in transaction pooling mode. - The maximum supported instances in a cluster is 20.
- All instances must be reachable from all other instances and they must be able to reach the database. It is also important for the hosts to have a stable address or hostname (depending on how the automation controller host is configured).
- All instances must be geographically collocated, with reliable low-latency connections between instances.
-
To upgrade to a clustered environment, your primary instance must be part of the
defaultgroup in the inventory and it needs to be the first host listed in thedefaultgroup. - Manual projects must be manually synced to all instances by the customer, and updated on all instances at once.
-
The
inventoryfile for platform deployments should be saved or persisted. If new instances are to be provisioned, the passwords and configuration options, as well as host names, must be made available to the installer.
7.2. Install and configure
Provisioning new instances involves updating the inventory file and re-running the setup playbook. It is important that the inventory file contains all passwords and information used when installing the cluster or other instances might be reconfigured. The inventory file contains a single inventory group, automationcontroller.
All instances are responsible for various housekeeping tasks related to task scheduling, such as determining where jobs are supposed to be launched and processing playbook events, as well as periodic cleanup.
[automationcontroller]
hostA
hostB
hostC
[instance_group_east]
hostB
hostC
[instance_group_west]
hostC
hostD
If no groups are selected for a resource, then the automationcontroller group is used, but if any other group is selected, then the automationcontroller group is not used in any way.
The database group remains for specifying an external PostgreSQL. If the database host is provisioned separately, this group must be empty:
[automationcontroller]
hostA
hostB
hostC
[database]
hostDB
When a playbook runs on an individual controller instance in a cluster, the output of that playbook is broadcast to all of the other nodes as part of automation controller’s websocket-based streaming output functionality. You must handle this data broadcast using internal addressing by specifying a private routable address for each node in your inventory:
[automationcontroller]
hostA routable_hostname=10.1.0.2
hostB routable_hostname=10.1.0.3
hostC routable_hostname=10.1.0.4
routable_hostname
For more information about routable_hostname, see General variables in the Red Hat Ansible Automation Platform Installation Guide.
Previous versions of automation controller used the variable name rabbitmq_host. If you are upgrading from a previous version of the platform, and you previously specified rabbitmq_host in your inventory, rename rabbitmq_host to routable_hostname before upgrading.
7.2.1. Instances and ports used by automation controller and automation hub
Ports and instances used by automation controller and also required by the on-premise automation hub node are as follows:
- Port 80, 443 (normal automation controller and automation hub ports)
- Port 22 (ssh - ingress only required)
- Port 5432 (database instance - if the database is installed on an external instance, it must be opened to automation controller instances)
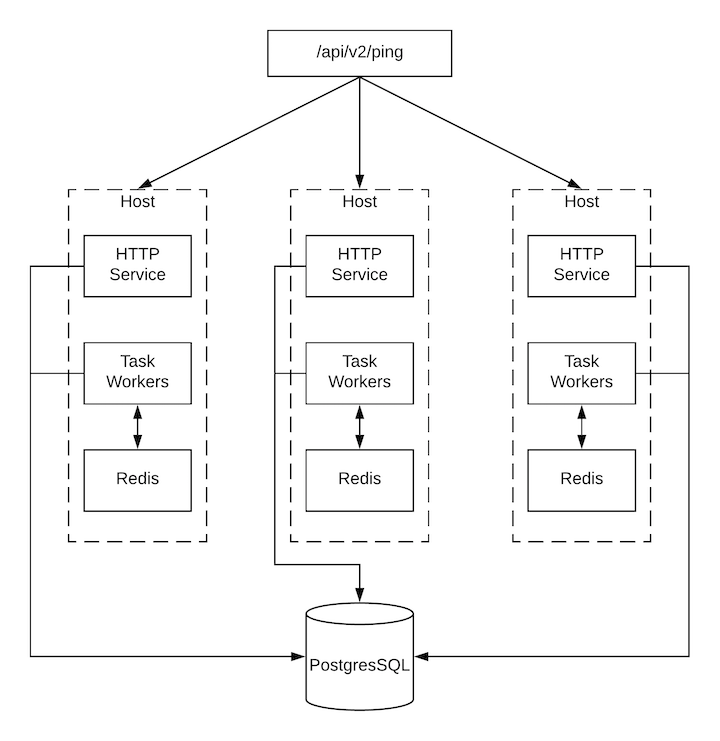
7.3. Status and monitoring by browser API
Automation controller reports as much status as it can using the browser API at /api/v2/ping to validate the health of the cluster. This includes the following:
- The instance servicing the HTTP request
- The timestamps of the last heartbeat of all other instances in the cluster
- Instance Groups and Instance membership in those groups
View more details about Instances and Instance Groups, including running jobs and membership information at /api/v2/instances/ and /api/v2/instance_groups/.
7.4. Instance services and failure behavior
Each automation controller instance is made up of the following different services working collaboratively:
- HTTP services
- This includes the automation controller application itself as well as external web services.
- Callback receiver
- Receives job events from running Ansible jobs.
- Dispatcher
- The worker queue that processes and runs all jobs.
- Redis
- This key value store is used as a queue for event data propagated from ansible-playbook to the application.
- Rsyslog
- The log processing service used to deliver logs to various external logging services.
Automation controller is configured so that if any of these services or their components fail, then all services are restarted. If these fail often in a short span of time, then the entire instance is placed offline in an automated fashion to allow remediation without causing unexpected behavior.
For backing up and restoring a clustered environment, see the Backup and restore clustered environments section.
7.5. Job runtime behavior
The way jobs are run and reported to a normal user of automation controller does not change. On the system side, note the following differences:
When a job is submitted from the API interface it is pushed into the dispatcher queue. Each automation controller instance connects to and receives jobs from that queue using a scheduling algorithm. Any instance in the cluster is just as likely to receive the work and execute the task. If an instance fails while executing jobs, then the work is marked as permanently failed.
- Project updates run successfully on any instance that could potentially run a job. Projects synchronize themselves to the correct version on the instance immediately before running the job. If the required revision is already locally checked out and Galaxy or Collections updates are not required, then a sync cannot be performed.
-
When the synchronization happens, it is recorded in the database as a project update with a
launch_type = syncandjob_type = run. Project syncs do not change the status or version of the project; instead, they update the source tree only on the instance where they run. -
If updates are required from Galaxy or Collections, a sync is performed that downloads the required roles, consuming more space in your
/tmp file. In cases where you have a large project (around 10 GB), disk space on/tmpcan be an issue.
7.5.1. Job runs
By default, when a job is submitted to the automation controller queue, it can be picked up by any of the workers. However, you can control where a particular job runs, such as restricting the instances from which a job runs on.
To support taking an instance offline temporarily, there is a property enabled defined on each instance. When this property is disabled, no jobs are assigned to that instance. Existing jobs finish, but no new work is assigned.
Troubleshooting
When you issue a cancel request on a running automation controller job, automation controller issues a SIGINT to the ansible-playbook process. While this causes Ansible to stop dispatching new tasks and exit, in many cases, module tasks that were already dispatched to remote hosts will run to completion. This behavior is similar to pressing Ctrl-c during a command-line Ansible run.
With respect to software dependencies, if a running job is canceled, the job is removed but the dependencies remain.
7.6. Deprovisioning instances
Re-running the setup playbook does not automatically deprovision instances since clusters do not currently distinguish between an instance that was taken offline intentionally or due to failure. Instead, shut down all services on the automation controller instance and then run the deprovisioning tool from any other instance.
Procedure
-
Shut down the instance or stop the service with the command:
automation-controller-service stop. Run the following deprovision command from another instance to remove it from the automation controller cluster:
$ awx-manage deprovision_instance --hostname=<name used in inventory file>
Example
awx-manage deprovision_instance --hostname=hostB
Deprovisioning instance groups in automation controller does not automatically deprovision or remove instance groups. For more information, see the Deprovisioning instance groups section.
Chapter 8. Instance and container groups
Automation controller enables you to execute jobs through Ansible playbooks run directly on a member of the cluster or in a namespace of an OpenShift cluster with the necessary service account provisioned. This is called a container group. You can execute jobs in a container group only as-needed per playbook. For more information, see Container groups.
For execution environments, see Execution environments in the Automation controller User Guide.
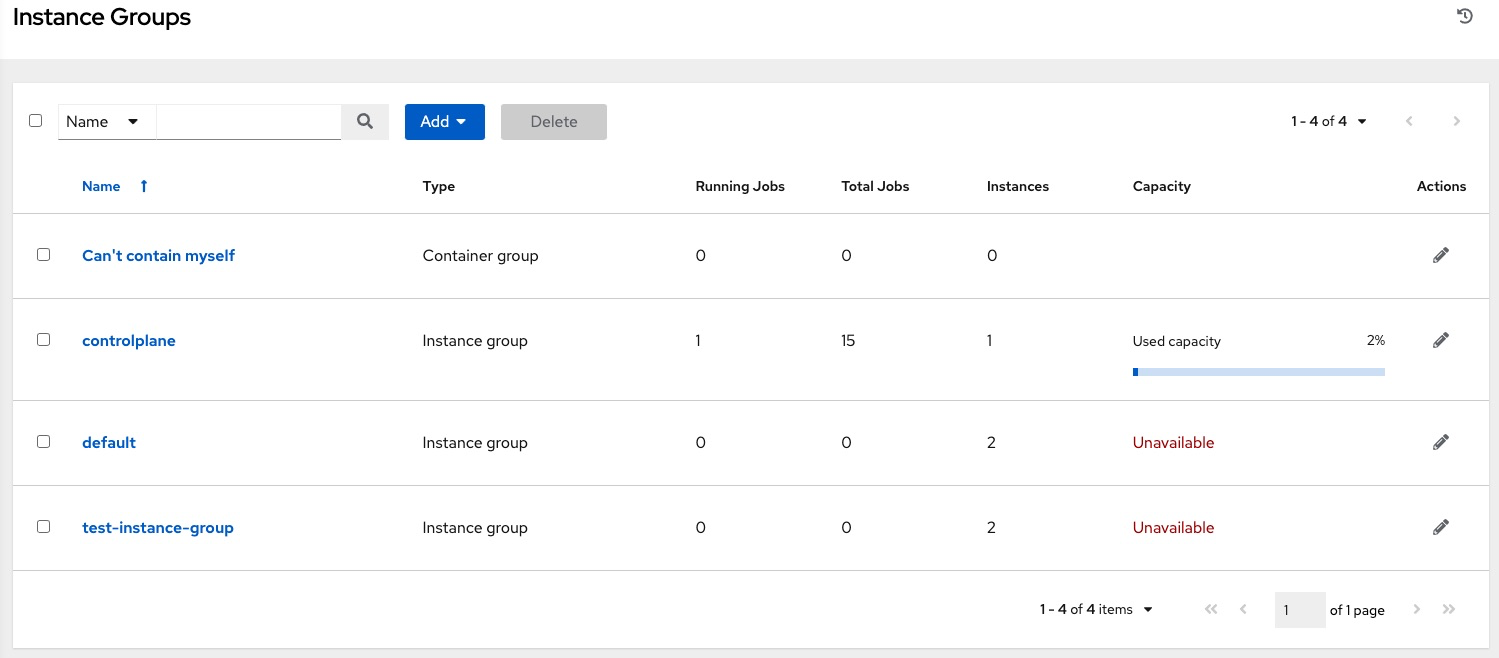
8.1. Instance groups
Instances can be grouped into one or more instance groups. Instance groups can be assigned to one or more of the following listed resources:
- Organizations
- Inventories
- Job templates
When a job associated with one of the resources executes, it is assigned to the instance group associated with the resource. During the execution process, instance groups associated with job templates are checked before those associated with inventories. Instance groups associated with inventories are checked before those associated with organizations. Therefore, instance group assignments for the three resources form the hierarchy:
Job Template > Inventory > Organization
Consider the following when working with instance groups:
-
You can define other groups and group instances in those groups. These groups must be prefixed with
instance_group_. Instances are required to be in theautomationcontrollerorexecution_nodesgroup alongside otherinstance_group_groups. In a clustered setup, at least one instance must be present in theautomationcontrollergroup, which appears ascontrolplanein the API instance groups. For more information and example scenarios, see Group policies forautomationcontroller. You cannot modify the
controlplaneinstance group, and attempting to do so results in a permission denied error for any user.Therefore, the Disassociate option is not available in the Instances tab of
controlplane.-
A
defaultAPI instance group is automatically created with all nodes capable of running jobs. This is like any other instance group but if a specific instance group is not associated with a specific resource, then the job execution always falls back to the default instance group. The default instance group always exists, and you cannot delete or rename it. -
Do not create a group named
instance_group_default. - Do not name any instance the same as a group name.
8.1.1. Group policies for automationcontroller
Use the following criteria when defining nodes:
-
Nodes in the
automationcontrollergroup can definenode_typehostvar to behybrid(default) orcontrol. -
Nodes in the
execution_nodes groupcan definenode_typehostvar to beexecution(default) orhop.
You can define custom groups in the inventory file by naming groups with instance_group_* where * becomes the name of the group in the API. You can also create custom instance groups in the API after the install has finished.
The current behavior expects a member of an instance_group_* to be part of automationcontroller or execution_nodes group.
Example
[automationcontroller]
126-addr.tatu.home ansible_host=192.168.111.126  node_type=control

[automationcontroller:vars]
peers=execution_nodes

[execution_nodes]

[instance_group_test]
110-addr.tatu.home ansible_host=192.168.111.110 receptor_listener_port=8928
After you run the installer, the following error appears:
TASK [ansible.automation_platform_installer.check_config_static : Validate mesh topology] ***
fatal: [126-addr.tatu.home -> localhost]: FAILED! => {"msg": "The host '110-addr.tatu.home' is not present in either [automationcontroller] or [execution_nodes]"}
To fix this, move the box 110-addr.tatu.home to an execution_node group:
[automationcontroller]
126-addr.tatu.home ansible_host=192.168.111.126  node_type=control

[automationcontroller:vars]
peers=execution_nodes

[execution_nodes]
110-addr.tatu.home ansible_host=192.168.111.110 receptor_listener_port=8928

[instance_group_test]
110-addr.tatu.home
This results in:
TASK [ansible.automation_platform_installer.check_config_static : Validate mesh topology] ***
ok: [126-addr.tatu.home -> localhost] => {"changed": false, "mesh": {"110-addr.tatu.home": {"node_type": "execution", "peers": [], "receptor_control_filename": "receptor.sock", "receptor_control_service_name": "control", "receptor_listener": true, "receptor_listener_port": 8928, "receptor_listener_protocol": "tcp", "receptor_log_level": "info"}, "126-addr.tatu.home": {"node_type": "control", "peers": ["110-addr.tatu.home"], "receptor_control_filename": "receptor.sock", "receptor_control_service_name": "control", "receptor_listener": false, "receptor_listener_port": 27199, "receptor_listener_protocol": "tcp", "receptor_log_level": "info"}}}
After you upgrade from automation controller 4.0 or earlier, the legacy instance_group_ member likely has the awx code installed. This places that node in the automationcontroller group.
8.1.2. Configure instance groups from the API
You can create instance groups by POSTing to /api/v2/instance_groups as a system administrator.
Once created, you can associate instances with an instance group using:
HTTP POST /api/v2/instance_groups/x/instances/ {'id': y}`An instance that is added to an instance group automatically reconfigures itself to listen on the group’s work queue. For more information, see the following section Instance group policies.
8.1.3. Instance group policies
You can configure automation controller instances to automatically join instance groups when they come online by defining a policy. These policies are evaluated for every new instance that comes online.
Instance group policies are controlled by the following three optional fields on an Instance Group:
-
policy_instance_percentage: This is a number between 0 - 100. It guarantees that this percentage of active automation controller instances are added to this instance group. As new instances come online, if the number of instances in this group relative to the total number of instances is less than the given percentage, then new ones are added until the percentage condition is satisfied. -
policy_instance_minimum: This policy attempts to keep at least this many instances in the instance group. If the number of available instances is lower than this minimum, then all instances are placed in this instance group. -
policy_instance_list: This is a fixed list of instance names to always include in this instance group.
The Instance Groups list view from the automation controller user interface (UI) provides a summary of the capacity levels for each instance group according to instance group policies:
Additional resources
For more information, see the Managing Instance Groups section of the Automation controller User Guide.
8.1.4. Notable policy considerations
Take the following policy considerations into account:
-
Both
policy_instance_percentageandpolicy_instance_minimumset minimum allocations. The rule that results in more instances assigned to the group takes effect. For example, if you have apolicy_instance_percentageof 50% and apolicy_instance_minimumof 2 and you start 6 instances, 3 of them are assigned to the instance group. If you reduce the number of total instances in the cluster to 2, then both of them are assigned to the instance group to satisfypolicy_instance_minimum. This enables you to set a lower limit on the amount of available resources. - Policies do not actively prevent instances from being associated with multiple instance groups, but this can be achieved by making the percentages add up to 100. If you have 4 instance groups, assign each a percentage value of 25 and the instances are distributed among them without any overlap.
8.1.5. Pinning instances manually to specific groups
If you have a special instance which needs to be exclusively assigned to a specific instance group but do not want it to automatically join other groups by "percentage" or "minimum" policies:
Procedure
-
Add the instance to one or more instance groups'
policy_instance_list. -
Update the instance’s
managed_by_policyproperty to beFalse.
This prevents the instance from being automatically added to other groups based on percentage and minimum policy. It only belongs to the groups you have manually assigned it to:
HTTP PATCH /api/v2/instance_groups/N/
{
"policy_instance_list": ["special-instance"]
}
HTTP PATCH /api/v2/instances/X/
{
"managed_by_policy": False
}
8.1.6. Job runtime behavior
When you run a job associated with an instance group, note the following behaviors:
- If you divide a cluster into separate instance groups, then the behavior is similar to the cluster as a whole. If you assign two instances to a group then either one is as likely to receive a job as any other in the same group.
- As automation controller instances are brought online, it effectively expands the work capacity of the system. If you place those instances into instance groups, then they also expand that group’s capacity. If an instance is performing work and it is a member of multiple groups, then capacity is reduced from all groups for which it is a member. De-provisioning an instance removes capacity from the cluster wherever that instance was assigned. For more information, see the Deprovisioning instance groups section for more detail.
Not all instances are required to be provisioned with an equal capacity.
8.1.7. Control where a job runs
If you associate instance groups with a job template, inventory, or organization, a job run from that job template is not eligible for the default behavior. This means that if all of the instances inside of the instance groups associated with these three resources are out of capacity, the job remains in the pending state until capacity becomes available.
The order of preference in determining which instance group to submit the job to is as follows:
- Job template
- Inventory
- Organization (by way of project)
If you associate instance groups with the job template, and all of these are at capacity, then the job is submitted to instance groups specified on the inventory, and then the organization. Jobs must execute in those groups in preferential order as resources are available.
You can still associate the global default group with a resource, like any of the custom instance groups defined in the playbook. You can use this to specify a preferred instance group on the job template or inventory, but still enable the job to be submitted to any instance if those are out of capacity.
Examples
-
If you associate
group_awith a job template and also associate thedefaultgroup with its inventory, you enable thedefaultgroup to be used as a fallback in casegroup_agets out of capacity. - In addition, it is possible to not associate an instance group with one resource but designate another resource as the fallback. For example, not associating an instance group with a job template and having it fall back to the inventory or the organization’s instance group.
This presents the following two examples:
- Associating instance groups with an inventory (omitting assigning the job template to an instance group) ensures that any playbook run against a specific inventory runs only on the group associated with it. This is useful in the situation where only those instances have a direct link to the managed nodes.
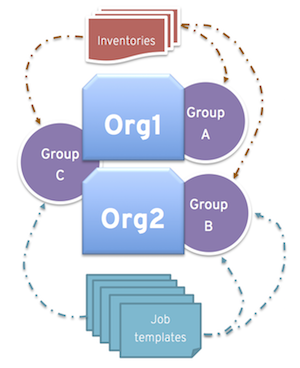
An administrator can assign instance groups to organizations. This enables the administrator to segment out the entire infrastructure and guarantee that each organization has capacity to run jobs without interfering with any other organization’s ability to run jobs.
An administrator can assign multiple groups to each organization, similar to the following scenario:
- There are three instance groups: A, B, and C. There are two organizations: Org1 and Org2.
- The administrator assigns group A to Org1, group B to Org2 and then assigns group C to both Org1 and Org2 as an overflow for any extra capacity that may be needed.
- The organization administrators are then free to assign inventory or job templates to whichever group they want, or let them inherit the default order from the organization.
Arranging resources this way offers you flexibility. You can also create instance groups with only one instance, enabling you to direct work towards a very specific Host in the automation controller cluster.
8.1.8. Instance group capacity limits
There is external business logic that can drive the need to limit the concurrency of jobs sent to an instance group, or the maximum number of forks to be consumed.
For traditional instances and instance groups, you might want to enable two organizations to run jobs on the same underlying instances, but limit each organization’s total number of concurrent jobs. This can be achieved by creating an instance group for each organization and assigning the value for max_concurrent_jobs.
For automation controller groups, automation controller is generally not aware of the resource limits of the OpenShift cluster. You can set limits on the number of pods on a namespace, or only resources available to schedule a certain number of pods at a time if no auto-scaling is in place. In this case, you can adjust the value for max_concurrent_jobs.
Another parameter available is max_forks. This provides additional flexibility for capping the capacity consumed on an instance group or container group. You can use this if jobs with a wide variety of inventory sizes and "forks" values are being run. This enables you to limit an organization to run up to 10 jobs concurrently, but consume no more than 50 forks at a time:
max_concurrent_jobs: 10
max_forks: 50
If 10 jobs that use 5 forks each are run, an eleventh job waits until one of these finishes to run on that group (or be scheduled on a different group with capacity).
If 2 jobs are running with 20 forks each, then a third job with a task_impact of 11 or more waits until one of these finishes to run on that group (or be scheduled on a different group with capacity).
For container groups, using the max_forks value is useful given that all jobs are submitted using the same pod_spec with the same resource requests, irrespective of the "forks" value of the job. The default pod_spec sets requests and not limits, so the pods can "burst" above their requested value without being throttled or reaped. By setting the max_forks value, you can help prevent a scenario where too many jobs with large forks values get scheduled concurrently and cause the OpenShift nodes to be oversubscribed with multiple pods using more resources than their requested value.
To set the maximum values for the concurrent jobs and forks in an instance group, see Creating an instance group in the Automation controller User Guide.
8.1.9. Deprovisioning instance groups
Re-running the setup playbook does not deprovision instances since clusters do not currently distinguish between an instance that you took offline intentionally or due to failure. Instead, shut down all services on the automation controller instance and then run the deprovisioning tool from any other instance.
Procedure
Shut down the instance or stop the service with the following command:
automation-controller-service stop
Run the following deprovision command from another instance to remove it from the controller cluster registry:
awx-manage deprovision_instance --hostname=<name used in inventory file>
Example
awx-manage deprovision_instance --hostname=hostB
Deprovisioning instance groups in automation controller does not automatically deprovision or remove instance groups, even though re-provisioning often causes these to be unused. They can still show up in API endpoints and stats monitoring. You can remove these groups with the following command:
awx-manage unregister_queue --queuename=<name>
Removing an instance’s membership from an instance group in the inventory file and re-running the setup playbook does not ensure that the instance is not added back to a group. To be sure that an instance is not added back to a group, remove it through the API and also remove it in your inventory file. You can also stop defining instance groups in the inventory file. You can manage instance group topology through the automation controller UI. For more information about managing instance groups in the UI, see Managing Instance Groups in the Automation controller User Guide.
If you have isolated instance groups created in older versions of automation controller (3.8.x and earlier) and want to migrate them to execution nodes to make them compatible for use with the automation mesh architecture, see Migrate isolated instances to execution nodes in the Ansible Automation Platform Upgrade and Migration Guide.
8.2. Container groups
Ansible Automation Platform supports container groups, which enable you to execute jobs in automation controller regardless of whether automation controller is installed as a standalone, in a virtual environment, or in a container. Container groups act as a pool of resources within a virtual environment. You can create instance groups to point to an OpenShift container, which are job environments that are provisioned on-demand as a pod that exists only for the duration of the playbook run. This is known as the ephemeral execution model and ensures a clean environment for every job run.
In some cases, you might want to set container groups to be "always-on", which you can configure through the creation of an instance.
Container groups upgraded from versions prior to automation controller 4.0 revert back to default and remove the old pod definition, clearing out all custom pod definitions in the migration.
Container groups are different from execution environments in that execution environments are container images and do not use a virtual environment. For more information, see Execution environments in the Automation controller User Guide.
8.2.1. Creating a container group
A ContainerGroup is a type of InstanceGroup that has an associated credential that enables you to connect to an OpenShift cluster.
Prerequisites
- A namespace that you can launch into. Every cluster has a "default" namespace, but you can use a specific namespace.
- A service account that has the roles that enable it to launch and manage pods in this namespace.
-
If you are using execution environments in a private registry, and have a container registry credential associated with them in automation controller, the service account also needs the roles to get, create, and delete secrets in the namespace. If you do not want to give these roles to the service account, you can pre-create the
ImagePullSecretsand specify them on the pod spec for theContainerGroup. In this case, the execution environment must not have a container registry credential associated, or automation controller attempts to create the secret for you in the namespace. - A token associated with that service account. An OpenShift or Kubernetes Bearer Token.
- A CA certificate associated with the cluster.
The following procedure explains how to create a service account in an OpenShift cluster or Kubernetes, to be used to run jobs in a container group through automation controller. After the service account is created, its credentials are provided to automation controller in the form of an OpenShift or Kubernetes API Bearer Token credential.
Procedure
-
To create a service account, download and use the sample service account,
containergroup saand modify it as needed to obtain the credentials. Apply the configuration from
containergroup-sa.yml:oc apply -f containergroup-sa.yml
Get the secret name associated with the service account:
export SA_SECRET=$(oc get sa containergroup-service-account -o json | jq '.secrets[0].name' | tr -d '"')
Get the token from the secret:
oc get secret $(echo ${SA_SECRET}) -o json | jq '.data.token' | xargs | base64 --decode > containergroup-sa.tokenGet the CA certificate:
oc get secret $SA_SECRET -o json | jq '.data["ca.crt"]' | xargs | base64 --decode > containergroup-ca.crt
-
Use the contents of
containergroup-sa.tokenandcontainergroup-ca.crtto provide the information for the OpenShift or Kubernetes API Bearer Token required for the container group.
To create a container group:
Procedure
- Use the automation controller UI to create an OpenShift or Kubernetes API Bearer Token credential to use with your container group. For more information, see Creating a credential in the Automation controller User Guide.
- From the navigation panel select → .
- Click and select Create Container Group.
- Enter a name for your new container group and select the credential previously created to associate it to the container group.
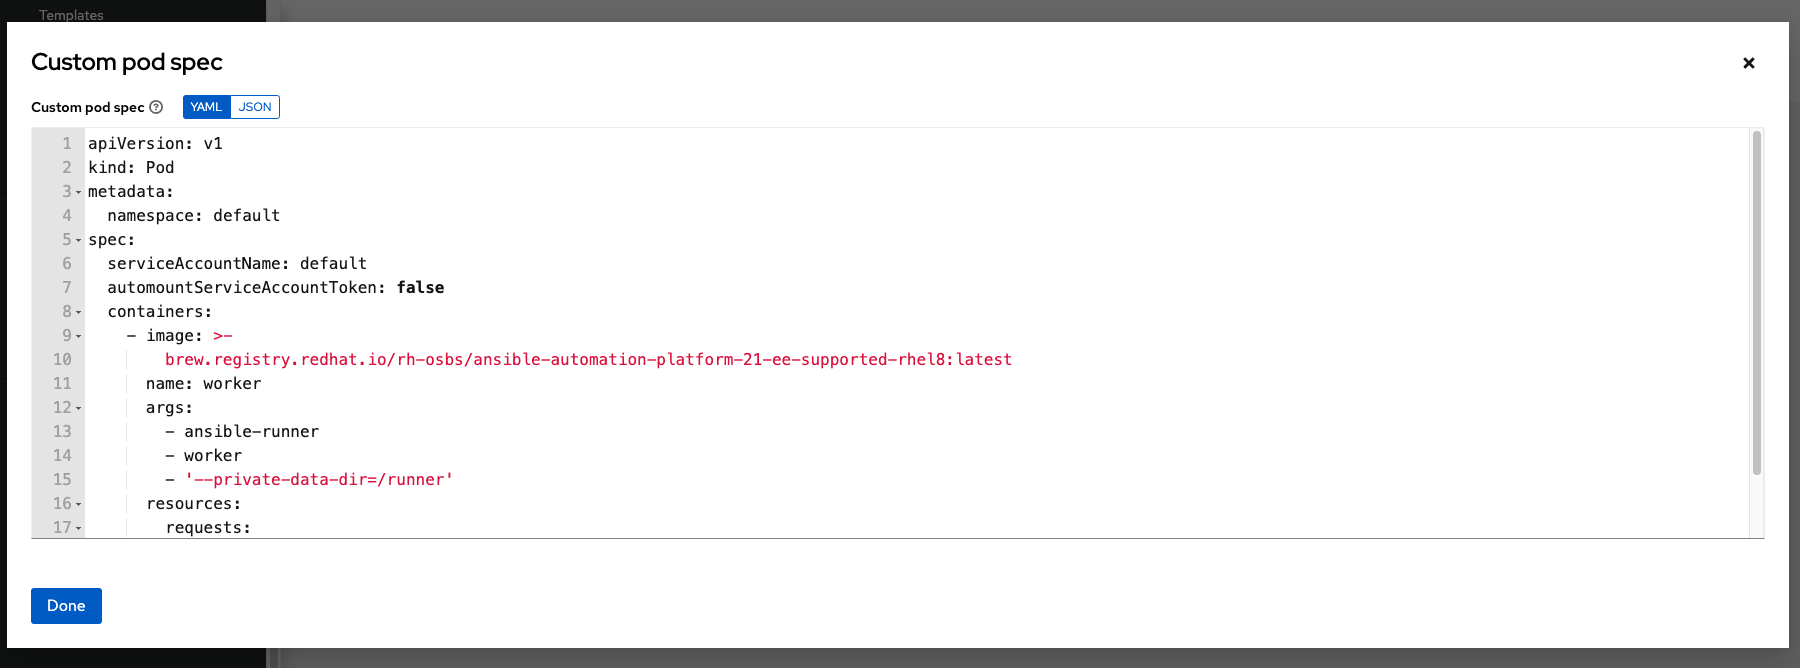
8.2.2. Customizing the pod specification
Ansible Automation Platform provides a simple default pod specification, however, you can provide a custom YAML or JSON document that overrides the default pod specification. This field uses any custom fields such as ImagePullSecrets, that can be "serialized" as valid pod JSON or YAML. A full list of options can be found in the Pods and Services section of the OpenShift documentation.
Procedure
To customize the pod specification, specify the namespace in the Pod Spec Override field by using the toggle to enable and expand the Pod Spec Override field.
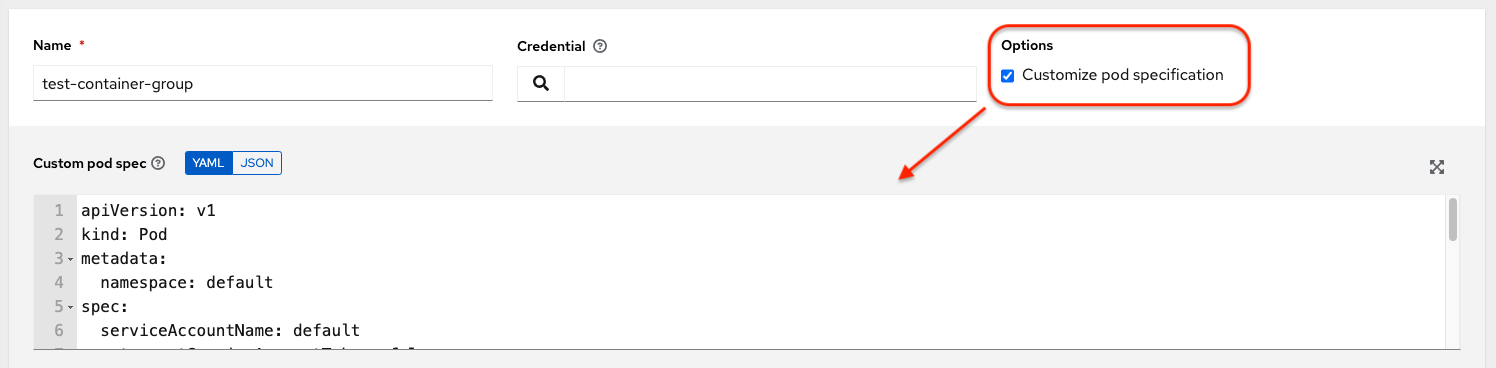
- Click .
You can provide additional customizations, if needed. Click to view the entire customization window:
The image when a job launches is determined by which execution environment is associated with the job. If you associate a container registry credential with the execution environment, then automation controller attempts to make an ImagePullSecret to pull the image. If you prefer not to give the service account permission to manage secrets, you must pre-create the ImagePullSecret and specify it on the pod specification, and omit any credential from the execution environment used.
For more information, see the Allowing Pods to Reference Images from Other Secured Registries section of the Red Hat Container Registry Authentication article.
Once you have created the container group successfully, the Details tab of the newly created container group remains, which enables you to review and edit your container group information. This is the same menu that is opened if you click the
![]() icon from the Instance Group link. You can also edit Instances and review Jobs associated with this instance group.
icon from the Instance Group link. You can also edit Instances and review Jobs associated with this instance group.
Container groups and instance groups are labeled accordingly.
8.2.3. Verifying container group functions
To verify the deployment and termination of your container:
Procedure
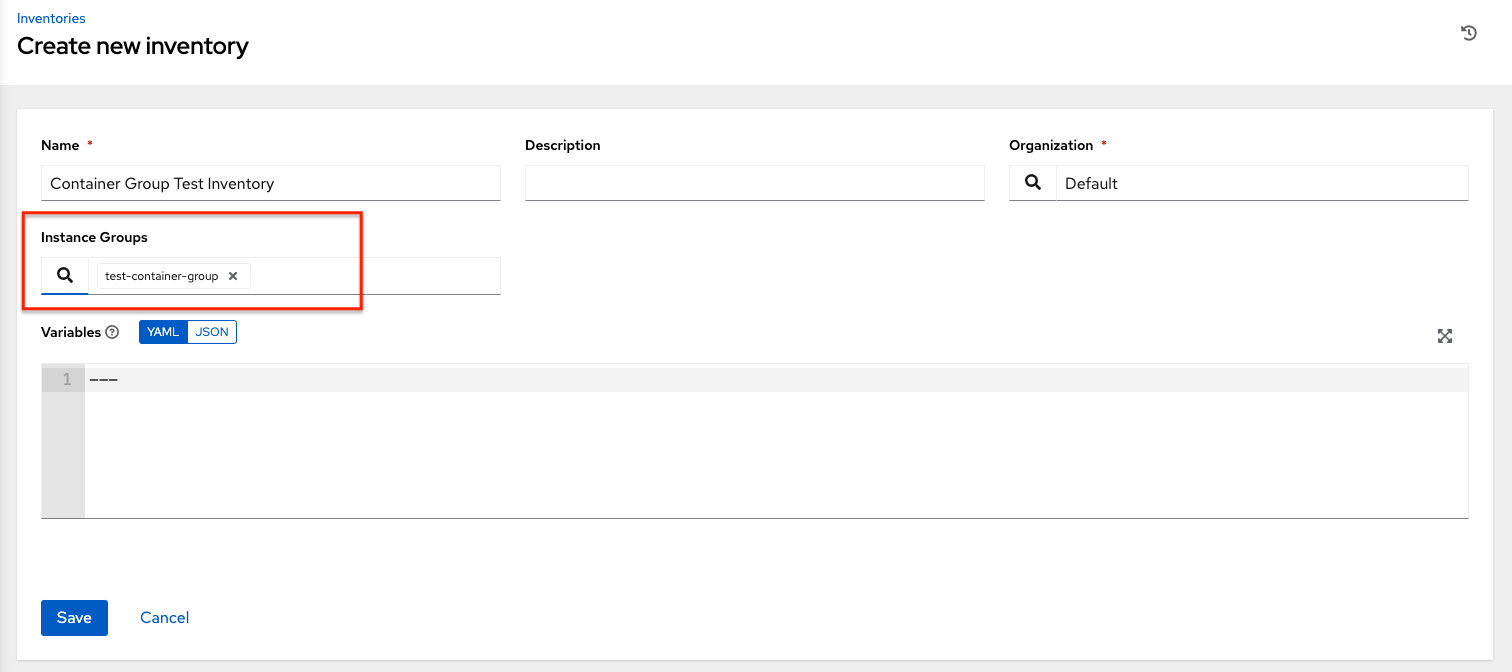
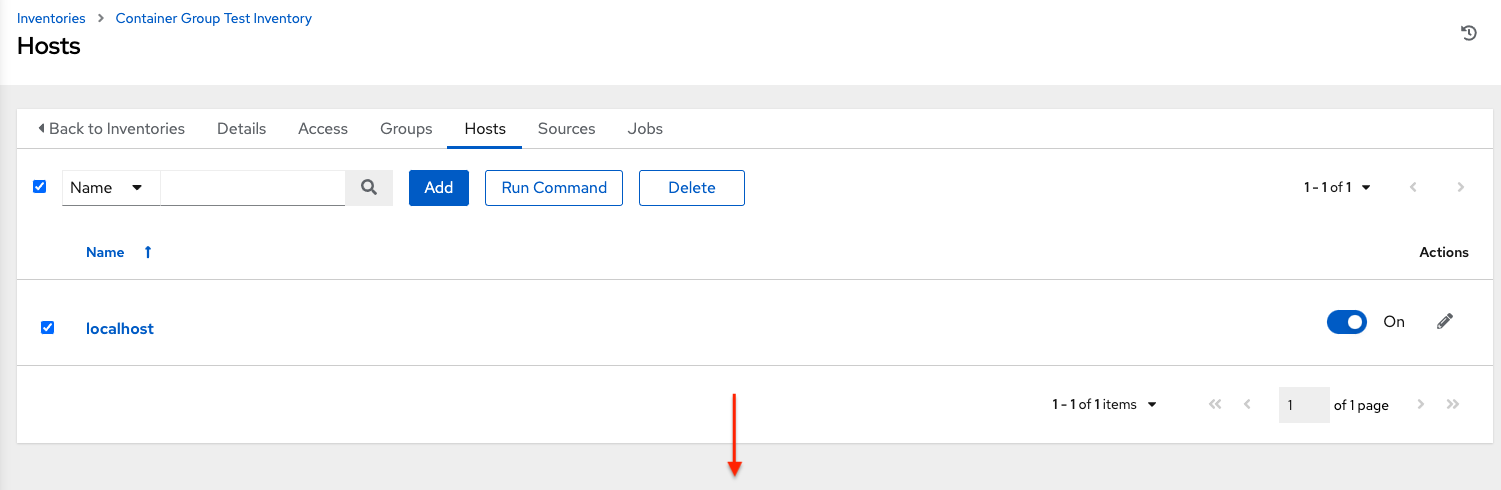
Create a mock inventory and associate the container group to it by populating the name of the container group in the Instance Group field. For more information, see Add a new inventory in the Automation controller User Guide.
Create the
localhosthost in the inventory with variables:{'ansible_host': '127.0.0.1', 'ansible_connection': 'local'}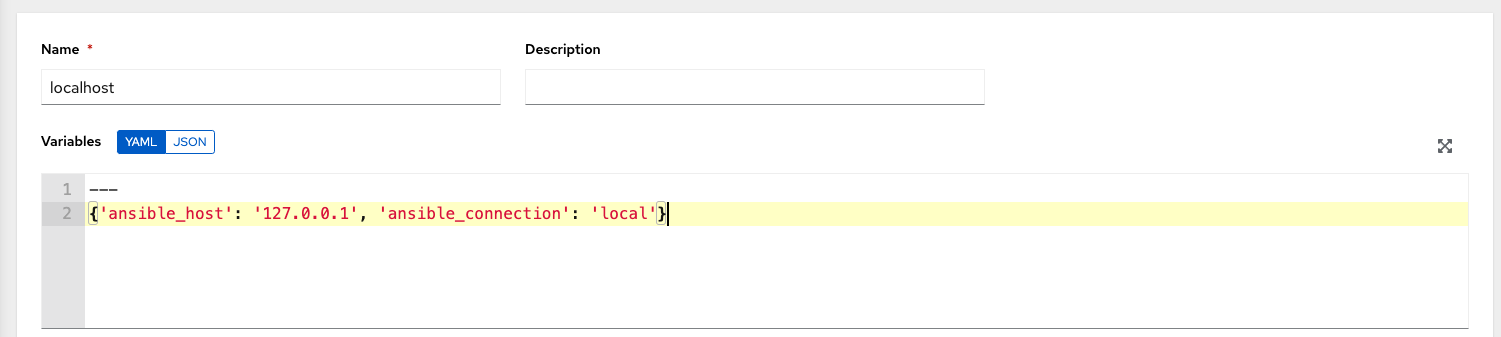
Launch an ad hoc job against the localhost using the ping or setup module. Even though the Machine Credential field is required, it does not matter which one is selected for this test:
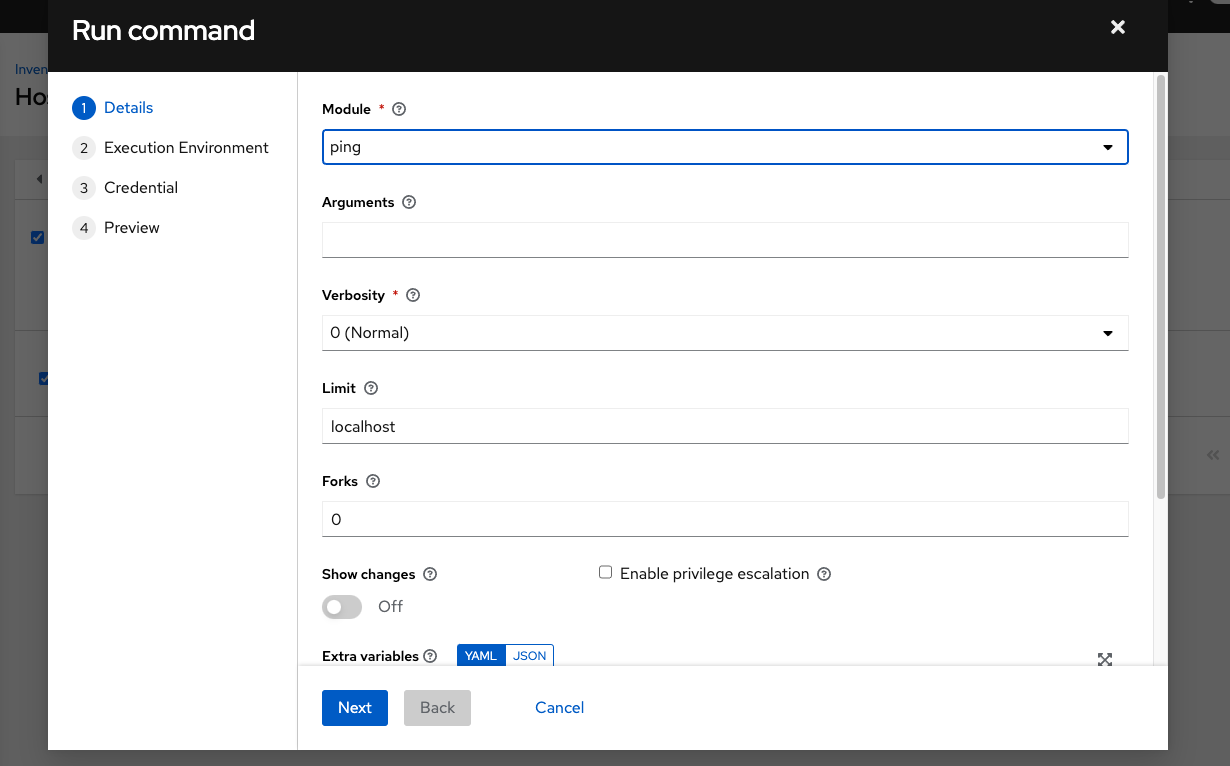
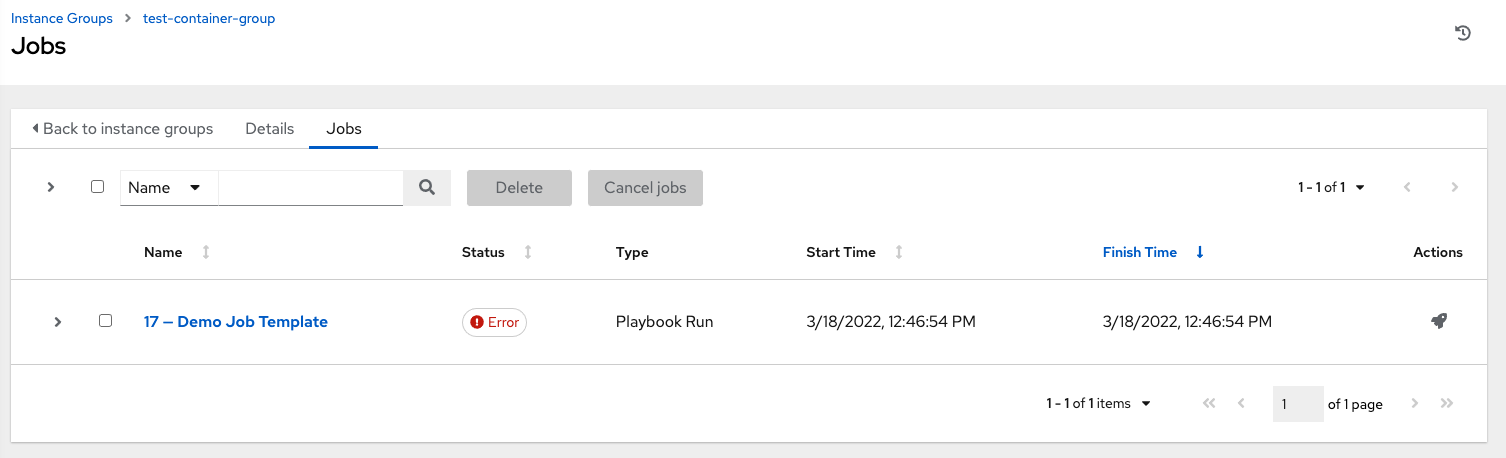
You can see in the Jobs details view that the container was reached successfully using one of the ad hoc jobs.
If you have an OpenShift UI, you can see pods appear and disappear as they deploy and terminate. Alternatively, you can use the CLI to perform a get pod operation on your namespace to watch these same events occurring in real-time.
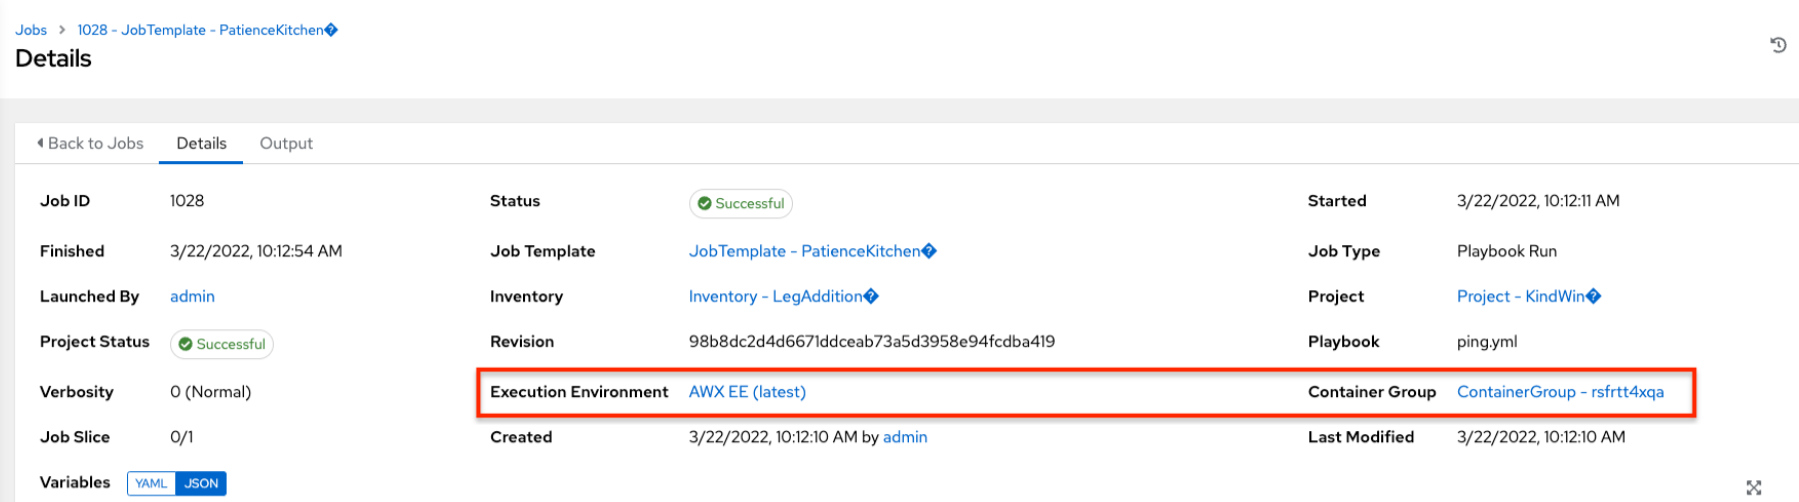
8.2.4. View container group jobs
When you run a job associated with a container group, you can see the details of that job in the Details view along with its associated container group and the execution environment that spun up.
8.2.5. Kubernetes API failure conditions
When running a container group and the Kubernetes API responds that the resource quota has been exceeded, automation controller keeps the job in pending state. Other failures result in the traceback of the Error Details field showing the failure reason, similar to the following example:
Error creating pod: pods is forbidden: User "system: serviceaccount: aap:example" cannot create resource "pods" in API group "" in the namespace "aap"
8.2.6. Container capacity limits
Capacity limits and quotas for containers are defined by objects in the Kubernetes API:
-
To set limits on all pods within a given namespace, use the
LimitRangeobject. For more information see the Quotas and Limit Ranges section of the OpenShift documentation. - To set limits directly on the pod definition launched by automation controller, see Customizing the pod specification and the Compute Resources section of the OpenShift documentation.
Container groups do not use the capacity algorithm that normal nodes use. You need to set the number of forks at the job template level. If you configure forks in automation controller, that setting is passed along to the container.
Chapter 9. Managing Capacity With Instances
Scaling your automation mesh is available on OpenShift deployments of Red Hat Ansible Automation Platform and is possible through adding or removing nodes from your cluster dynamically, using the Instances resource of the automation controller UI, without running the installation script.
Instances serve as nodes in your mesh topology. Automation mesh enables you to extend the footprint of your automation. The location where you launch a job can be different from the location where the ansible-playbook runs.
To manage instances from the automation controller UI, you must have System Administrator or System Auditor permissions.
In general, the more processor cores (CPU) and memory (RAM) a node has, the more jobs that can be scheduled to run on that node at once.
For more information, see Automation controller capacity determination and job impact.
9.1. Prerequisites
The automation mesh is dependent on hop and execution nodes running on Red Hat Enterprise Linux (RHEL). Your Red Hat Ansible Automation Platform subscription grants you ten Red Hat Enterprise Linux licenses that can be used for running components of Ansible Automation Platform.
For additional information about Red Hat Enterprise Linux subscriptions, see Registering the system and managing subscriptions in the Red Hat Enterprise Linux documentation.
The following steps prepare the RHEL instances for deployment of the automation mesh.
- You require a Red Hat Enterprise Linux operating system. Each node in the mesh requires a static IP address, or a resolvable DNS hostname that automation controller can access.
- Ensure that you have the minimum requirements for the RHEL virtual machine before proceeding. For more information, see the Red Hat Ansible Automation Platform system requirements.
Deploy the RHEL instances within the remote networks where communication is required. For information about creating virtual machines, see Creating Virtual Machines in the Red Hat Enterprise Linux documentation. Remember to scale the capacity of your virtual machines sufficiently so that your proposed tasks can run on them.
- RHEL ISOs can be obtained from access.redhat.com.
- RHEL cloud images can be built using Image Builder from console.redhat.com.
9.2. Pulling the secret
If you are using the default execution environment (provided with automation controller) to run on remote execution nodes, you must add a pull secret in the automation controller that contains the credential for pulling the execution environment image.
To do this, create a pull secret on the automation controller namespace and configure the ee_pull_credentials_secret parameter in the Operator as follows:
Procedure
Create a secret:
oc create secret generic ee-pull-secret \
     --from-literal=username=<username> \
     --from-literal=password=<password> \
     --from-literal=url=registry.redhat.io


oc edit automationcontrollers <instance name>
Add
ee_pull_credentials_secret ee-pull-secretto the specification:spec.ee_pull_credentials_secret=ee-pull-secret
To manage instances from the automation controller UI, you must have System Administrator or System Auditor permissions.
9.3. Setting up Virtual Machines for use in an automation mesh
Procedure
SSH into each of the RHEL instances and perform the following steps. Depending on your network access and controls, SSH proxies or other access models might be required.
Use the following command:
ssh [username]@[host_ip_address]
For example, for an Ansible Automation Platform instance running on Amazon Web Services.
ssh ec2-user@10.0.0.6
- Create or copy an SSH key that can be used to connect from the hop node to the execution node in later steps. This can be a temporary key used just for the automation mesh configuration, or a long-lived key. The SSH user and key are used in later steps.
Enable your RHEL subscription with
baseosandappstreamrepositories. Ansible Automation Platform RPM repositories are only available through subscription-manager, not the Red Hat Update Infrastructure (RHUI). If you attempt to use any other Linux footprint, including RHEL with RHUI, this causes errors.sudo subscription-manager register --auto-attach
If Simple Content Access is enabled for your account, use:
sudo subscription-manager register
For more information about Simple Content Access, see Getting started with simple content access.
Enable Ansible Automation Platform subscriptions and the proper Red Hat Ansible Automation Platform channel:
# subscription-manager repos --enable ansible-automation-platform-2.4-for-rhel-8-x86_64-rpms for RHEL 8

# subscription-manager repos --enable ansible-automation-platform-2.4-for-rhel-9-x86_64-rpms for RHEL 9
Ensure the packages are up to date:
sudo dnf upgrade -y
Install the ansible-core packages:
sudo dnf install -y ansible-core
9.4. Managing instances
To expand job capacity, create a standalone execution node that can be added to run alongside a deployment of automation controller. These execution nodes are not part of the automation controller Kubernetes cluster. The control nodes run in the cluster connect and submit work to the execution nodes through Receptor. These execution nodes are registered in automation controller as type execution instances, meaning they are only used to run jobs, not dispatch work or handle web requests as control nodes do.
Hop nodes can be added to sit between the control plane of automation controller and standalone execution nodes. These hop nodes are not part of the Kubernetes cluster and are registered in automation controller as an instance of type hop, meaning they only handle inbound and outbound traffic for otherwise unreachable nodes in different or more strict networks.
The following procedure demonstrates how to set the node type for the hosts.
Procedure
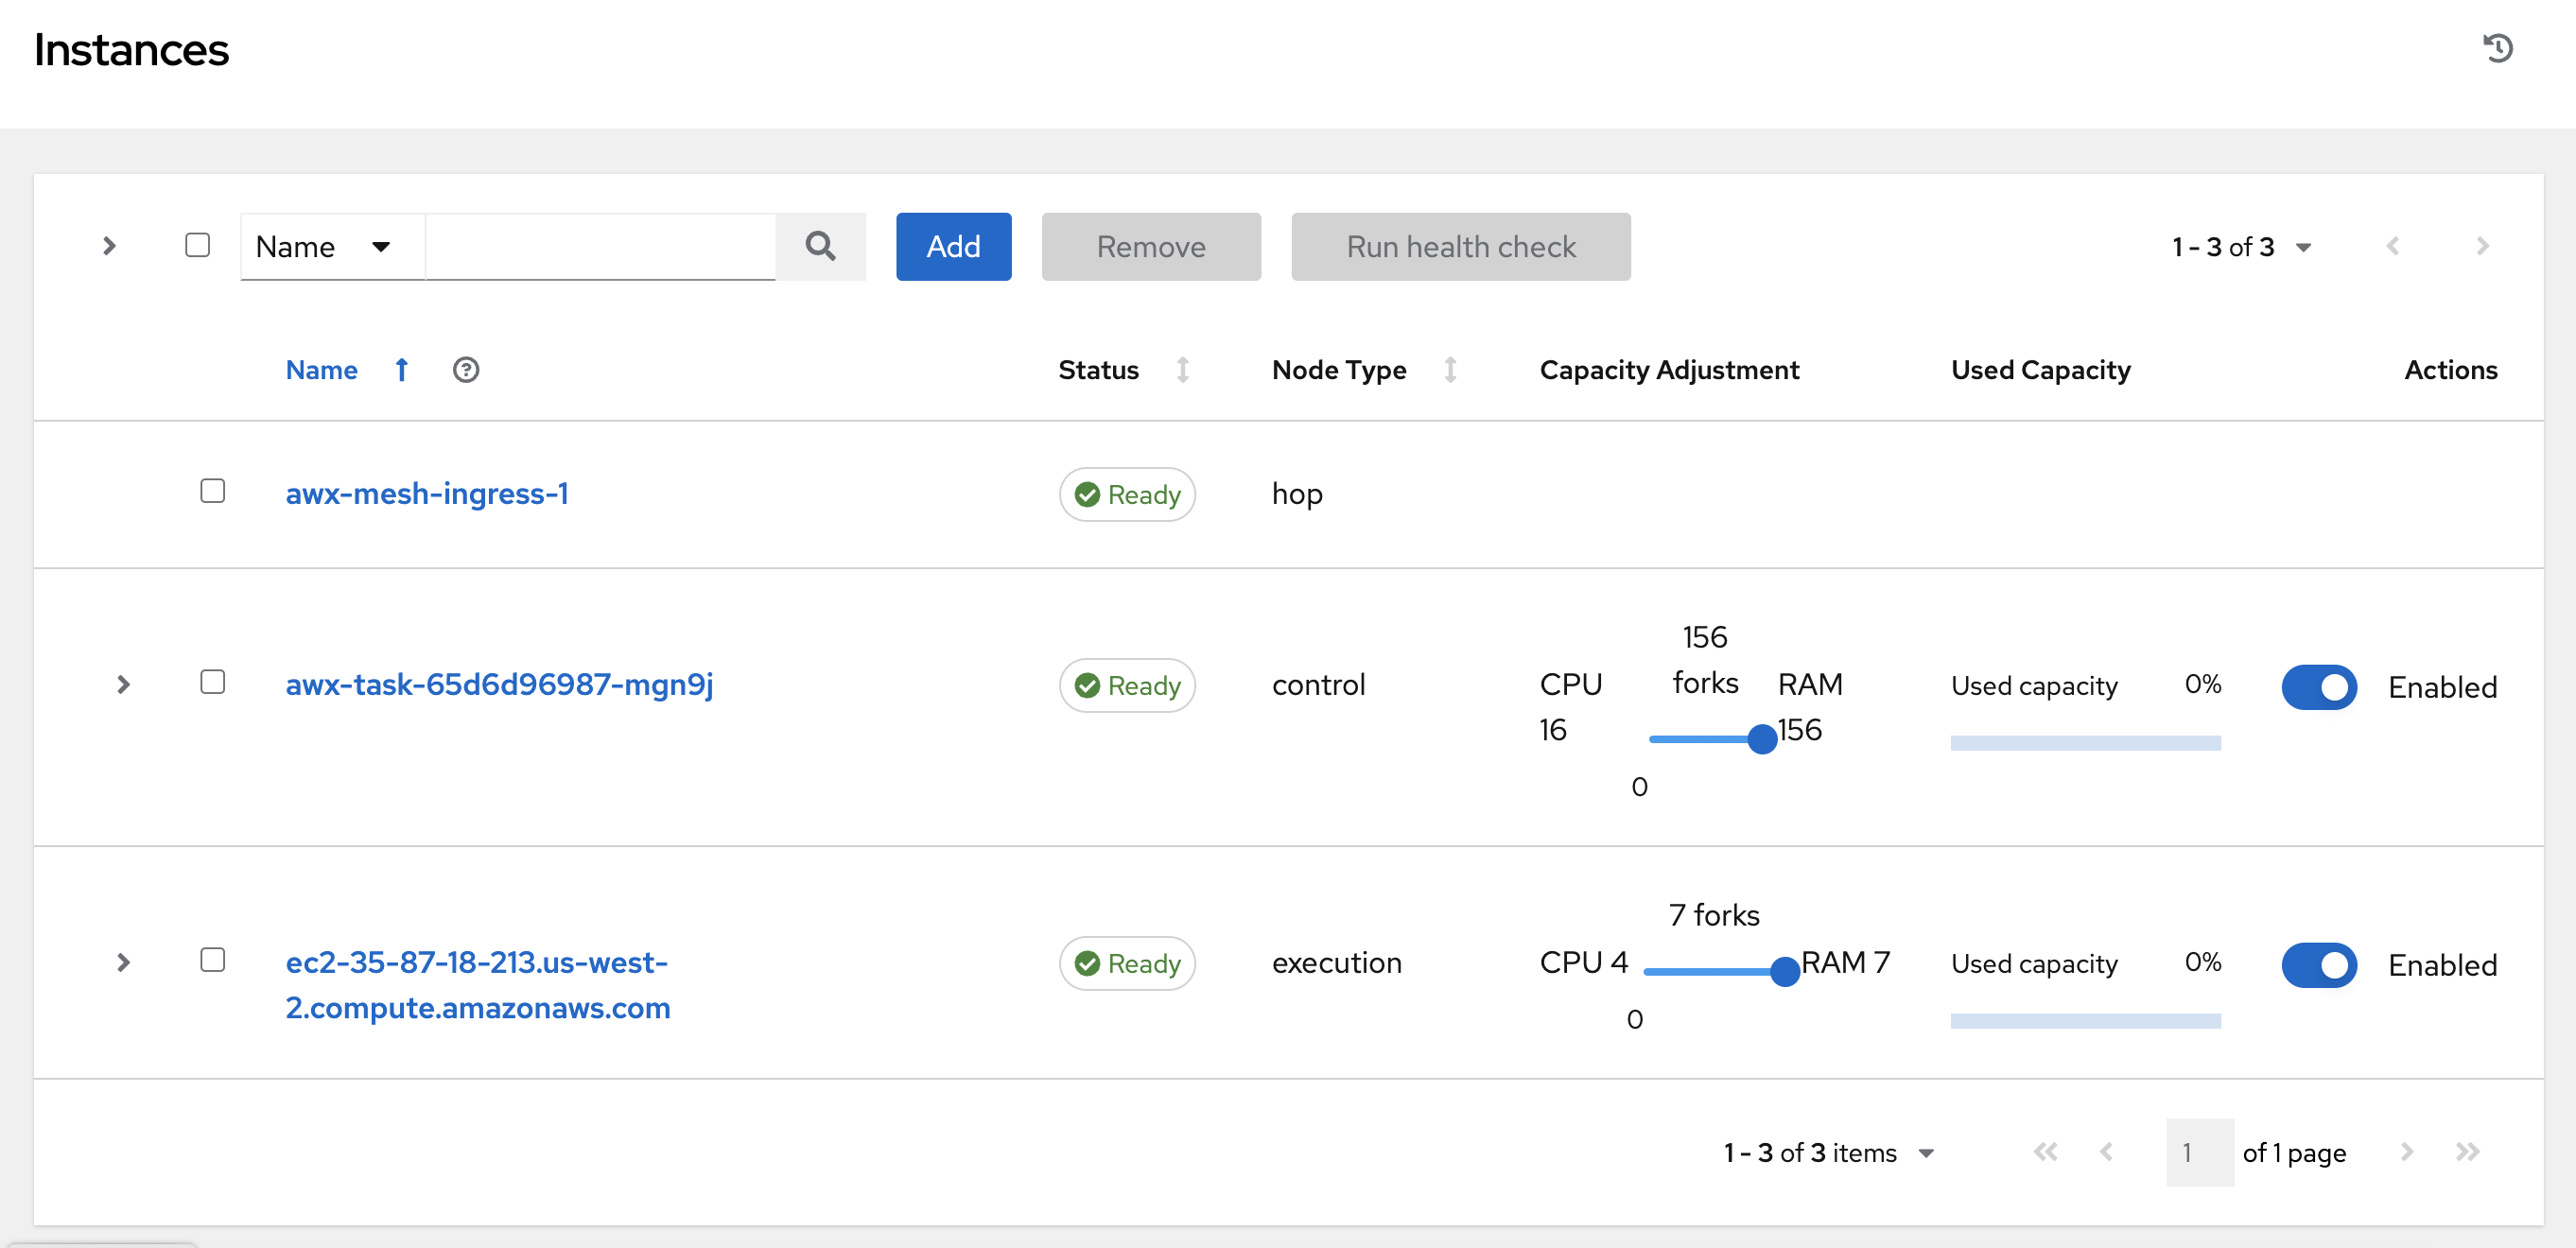
- From the navigation panel, select → .
On the Instances list page, click . The Create new Instance window opens.
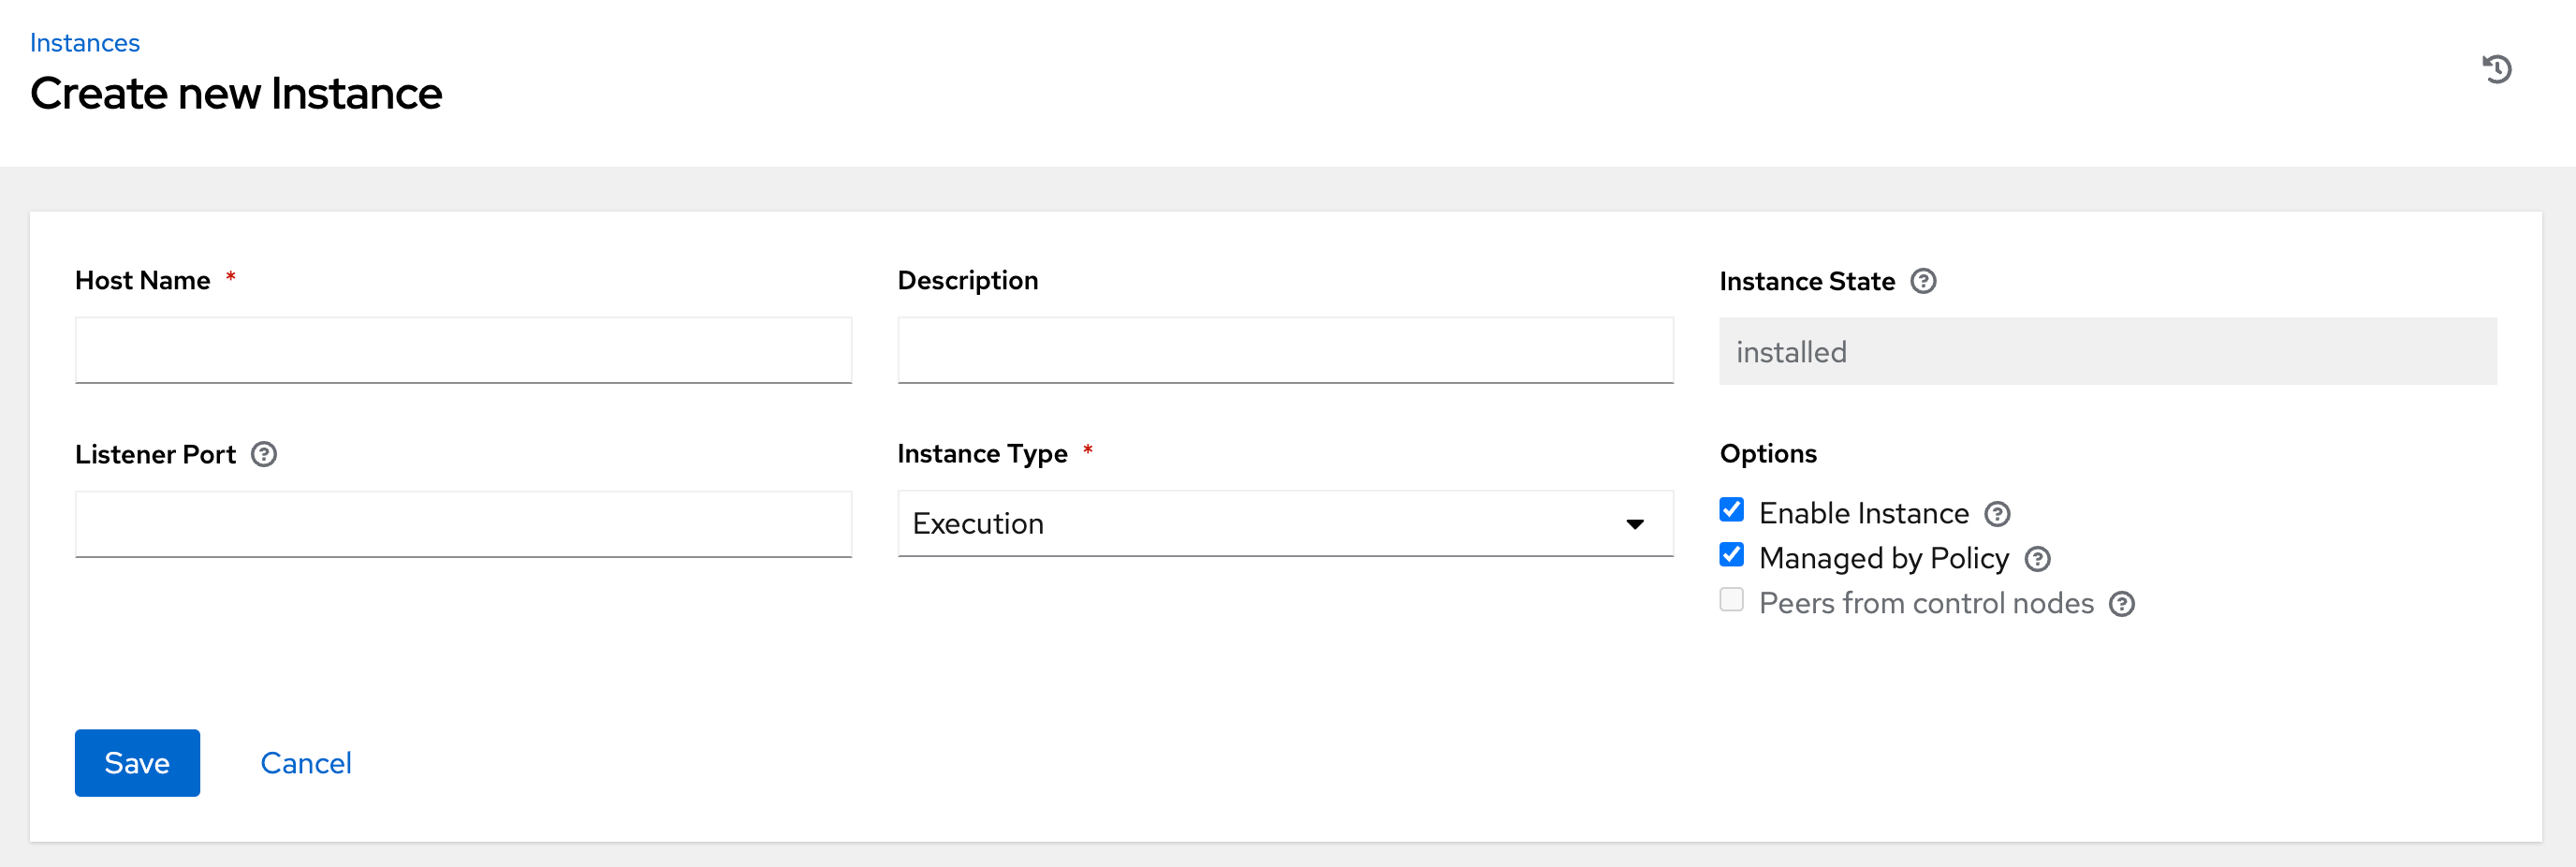
An instance requires the following attributes:
Host Name: (required) Enter a fully qualified domain name (public DNS) or IP address for your instance. This field is equivalent to
hostnamefor installer-based deployments.NoteIf the instance uses private DNS that cannot be resolved from the control cluster, DNS lookup routing fails, and the generated SSL certificates is invalid. Use the IP address instead.
- Optional: Description: Enter a description for the instance.
- Instance State: This field is auto-populated, indicating that it is being installed, and cannot be modified.
-
Listener Port: This port is used for the receptor to listen on for incoming connections. You can set the port to one that is appropriate for your configuration. This field is equivalent to
listener_portin the API. The default value is 27199, though you can set your own port value. Instance Type: Only
executionandhopnodes can be created. Operator based deployments do not support Control or Hybrid nodes.Options:
- Enable Instance: Check this box to make it available for jobs to run on an execution node.
- Check the Managed by Policy box to enable policy to dictate how the instance is assigned.
Check the Peers from control nodes box to enable control nodes to peer to this instance automatically. For nodes connected to automation controller, check the Peers from Control nodes box to create a direct communication link between that node and automation controller. For all other nodes:
- If you are not adding a hop node, make sure Peers from Control is checked.
- If you are adding a hop node, make sure Peers from Control is not checked.
- For execution nodes that communicate with hop nodes, do not check this box.
To peer an execution node with a hop node, click the
 icon next to the Peers field.
The Select Peers window is displayed.
Peer the execution node to the hop node.
Click .
To view a graphical representation of your updated topology, see Topology viewer.
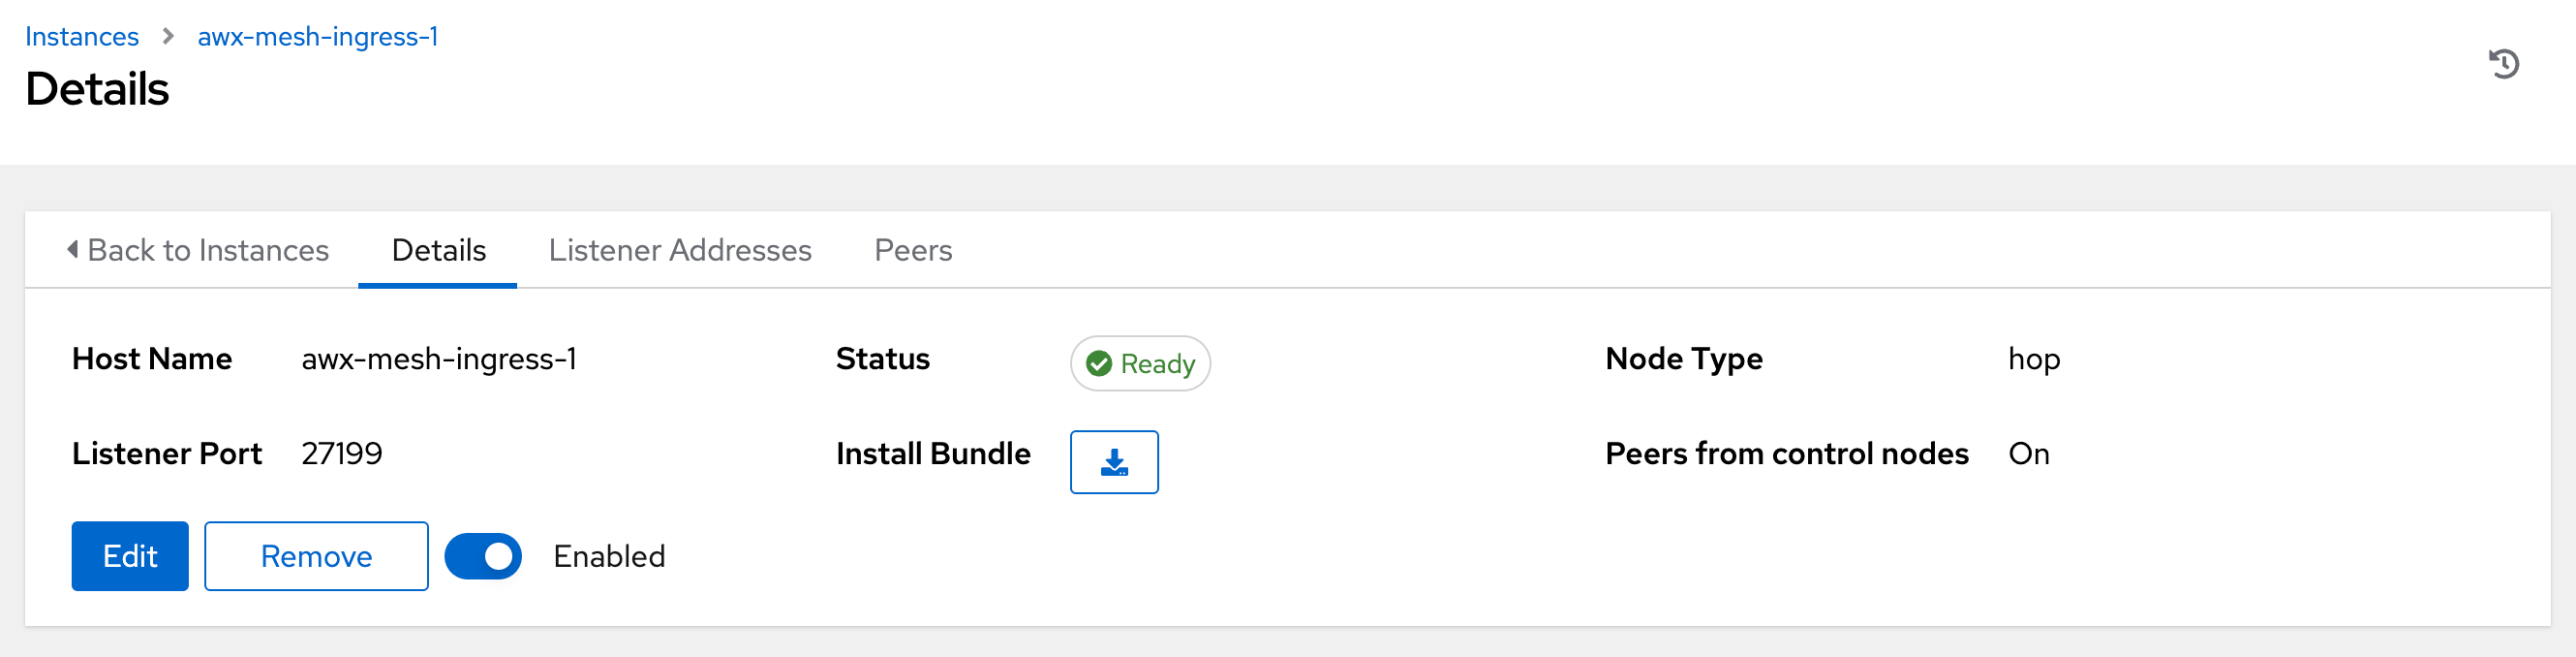
NoteExecute the following steps from any computer that has SSH access to the newly created instance.
Click the
 icon next to Install Bundle to download the tar file that includes this new instance and the files necessary to install the created node into the automation mesh.
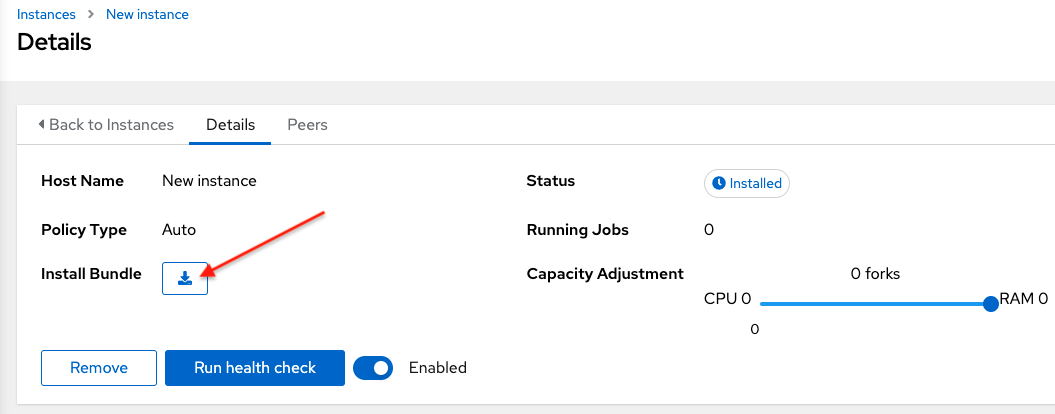
The install bundle contains TLS certificates and keys, a certificate authority, and a proper Receptor configuration file.
receptor-ca.crt
work-public-key.pem
receptor.key
install_receptor.yml
inventory.yml
group_vars/all.yml
requirements.yml
Extract the downloaded
tar.gzInstall Bundle from the location where you downloaded it. To ensure that these files are in the correct location on the remote machine, the install bundle includes theinstall_receptor.ymlplaybook. The playbook requires the Receptor collection. Run the following command to download the collection:ansible-galaxy collection install -r requirements.yml
Before running the
ansible-playbookcommand, edit the following fields in theinventory.ymlfile:all: hosts: remote-execution: ansible_host: 10.0.0.6 ansible_user: <username> # user provided ansible_ssh_private_key_file: ~/.ssh/<id_rsa>-
Ensure
ansible_hostis set to the IP address or DNS of the node. -
Set
ansible_userto the username running the installation. -
Set
ansible_ssh_private_key_fileto contain the filename of the private key used to connect to the instance. -
The content of the
inventory.ymlfile serves as a template and contains variables for roles that are applied during the installation and configuration of a receptor node in a mesh topology. You can modify some of the other fields, or replace the file in its entirety for advanced scenarios. For more information, see Role Variables.
-
Ensure
For a node that uses a private DNS, add the following line to
inventory.yml:ansible_ssh_common_args: <your ssh ProxyCommand setting>
This instructs the
install-receptor.ymlplaybook to use the proxy command to connect through the local DNS node to the private node.- When the attributes are configured, click . The Details page of the created instance opens.
- Save the file to continue.
The system that is going to run the install bundle to setup the remote node and run
ansible-playbookrequires theansible.receptorcollection to be installed:ansible-galaxy collection install ansible.receptor
or
ansible-galaxy install -r requirements.yml
-
Installing the receptor collection dependency from the
requirements.ymlfile consistently retrieves the receptor version specified there. Additionally, it retrieves any other collection dependencies that might be needed in the future. - Install the receptor collection on all nodes where your playbook will run, otherwise an error occurs.
-
Installing the receptor collection dependency from the
If
receptor_listener_portis defined, the machine also requires an available open port on which to establish inbound TCP connections, for example, 27199. Run the following command to open port 27199 for receptor communication:sudo firewall-cmd --permanent --zone=public --add-port=27199/tcp
Run the following playbook on the machine where you want to update your automation mesh:
ansible-playbook -i inventory.yml install_receptor.yml
After this playbook runs, your automation mesh is configured.
To remove an instance from the mesh, see Removing instances.
Chapter 10. Topology viewer
The topology viewer enables you to view node type, node health, and specific details about each node if you already have a mesh topology deployed.
To access the topology viewer from the automation controller UI, you must have System Administrator or System Auditor permissions.
For more information about automation mesh on a VM-based installation, see the Red Hat Ansible Automation Platform automation mesh guide for VM-based installations.
For more information about automation mesh on an operator-based installation, see the Red Hat Ansible Automation Platform automation mesh for operator-based installations.
10.1. Accessing the topology viewer
Use the following procedure to access the topology viewer from the automation controller UI.
Procedure
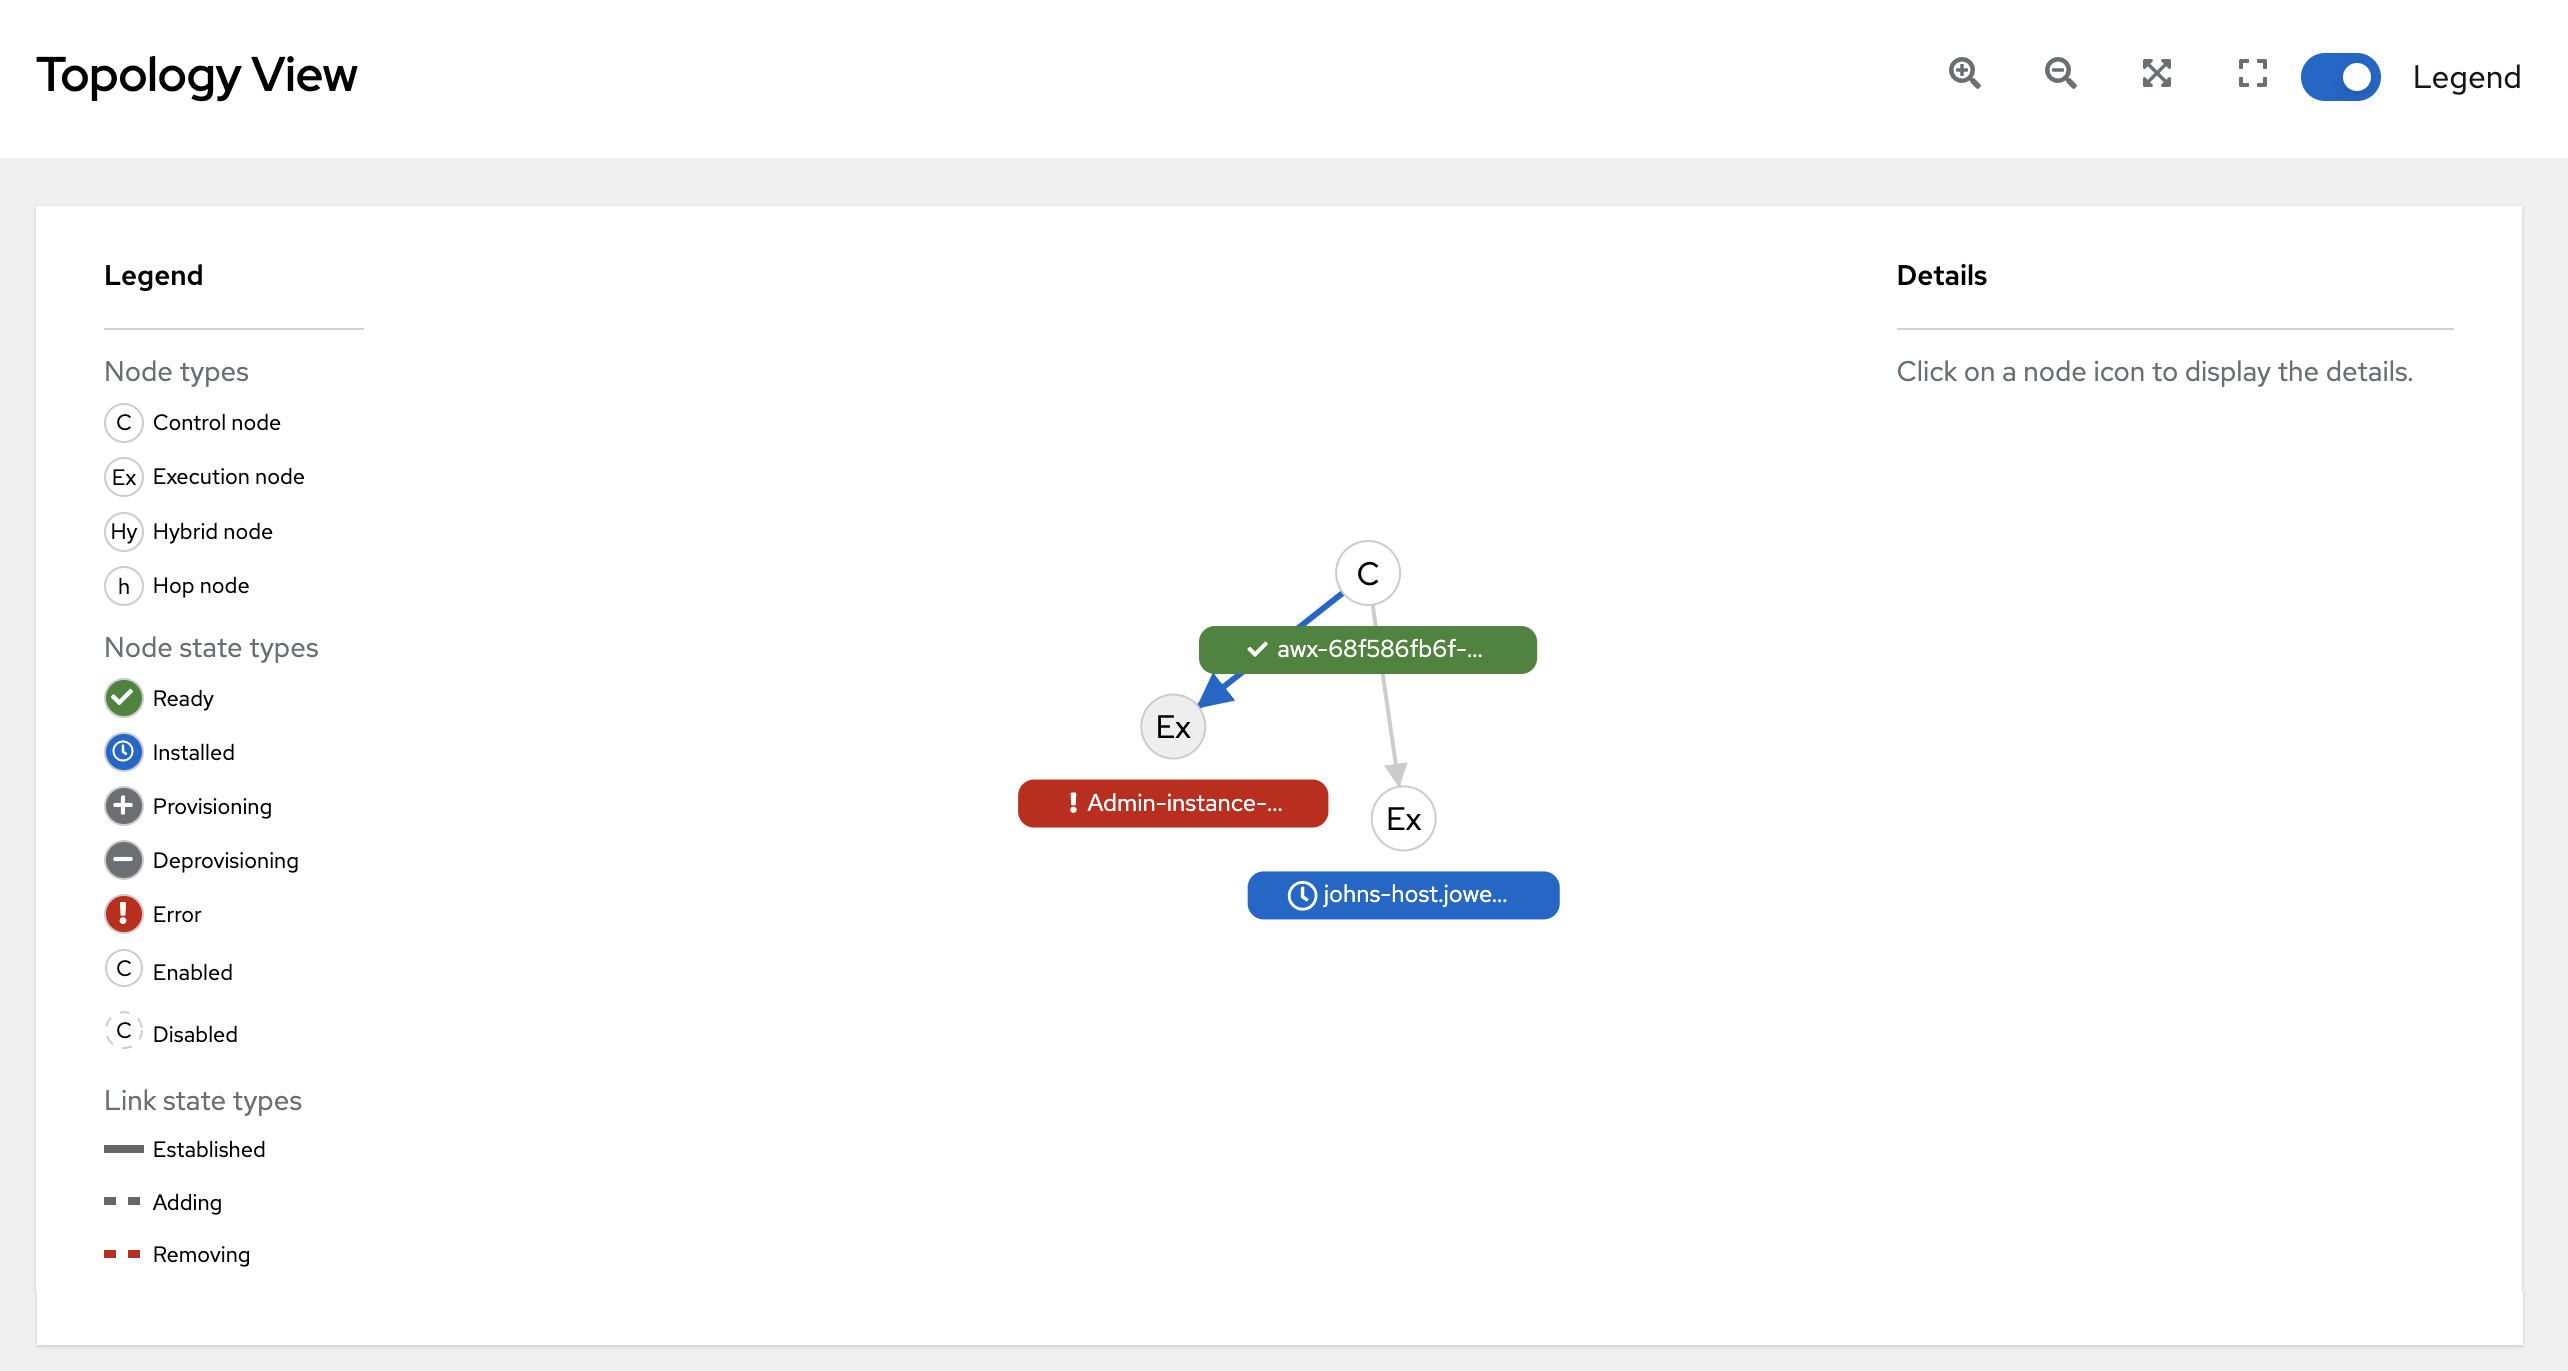
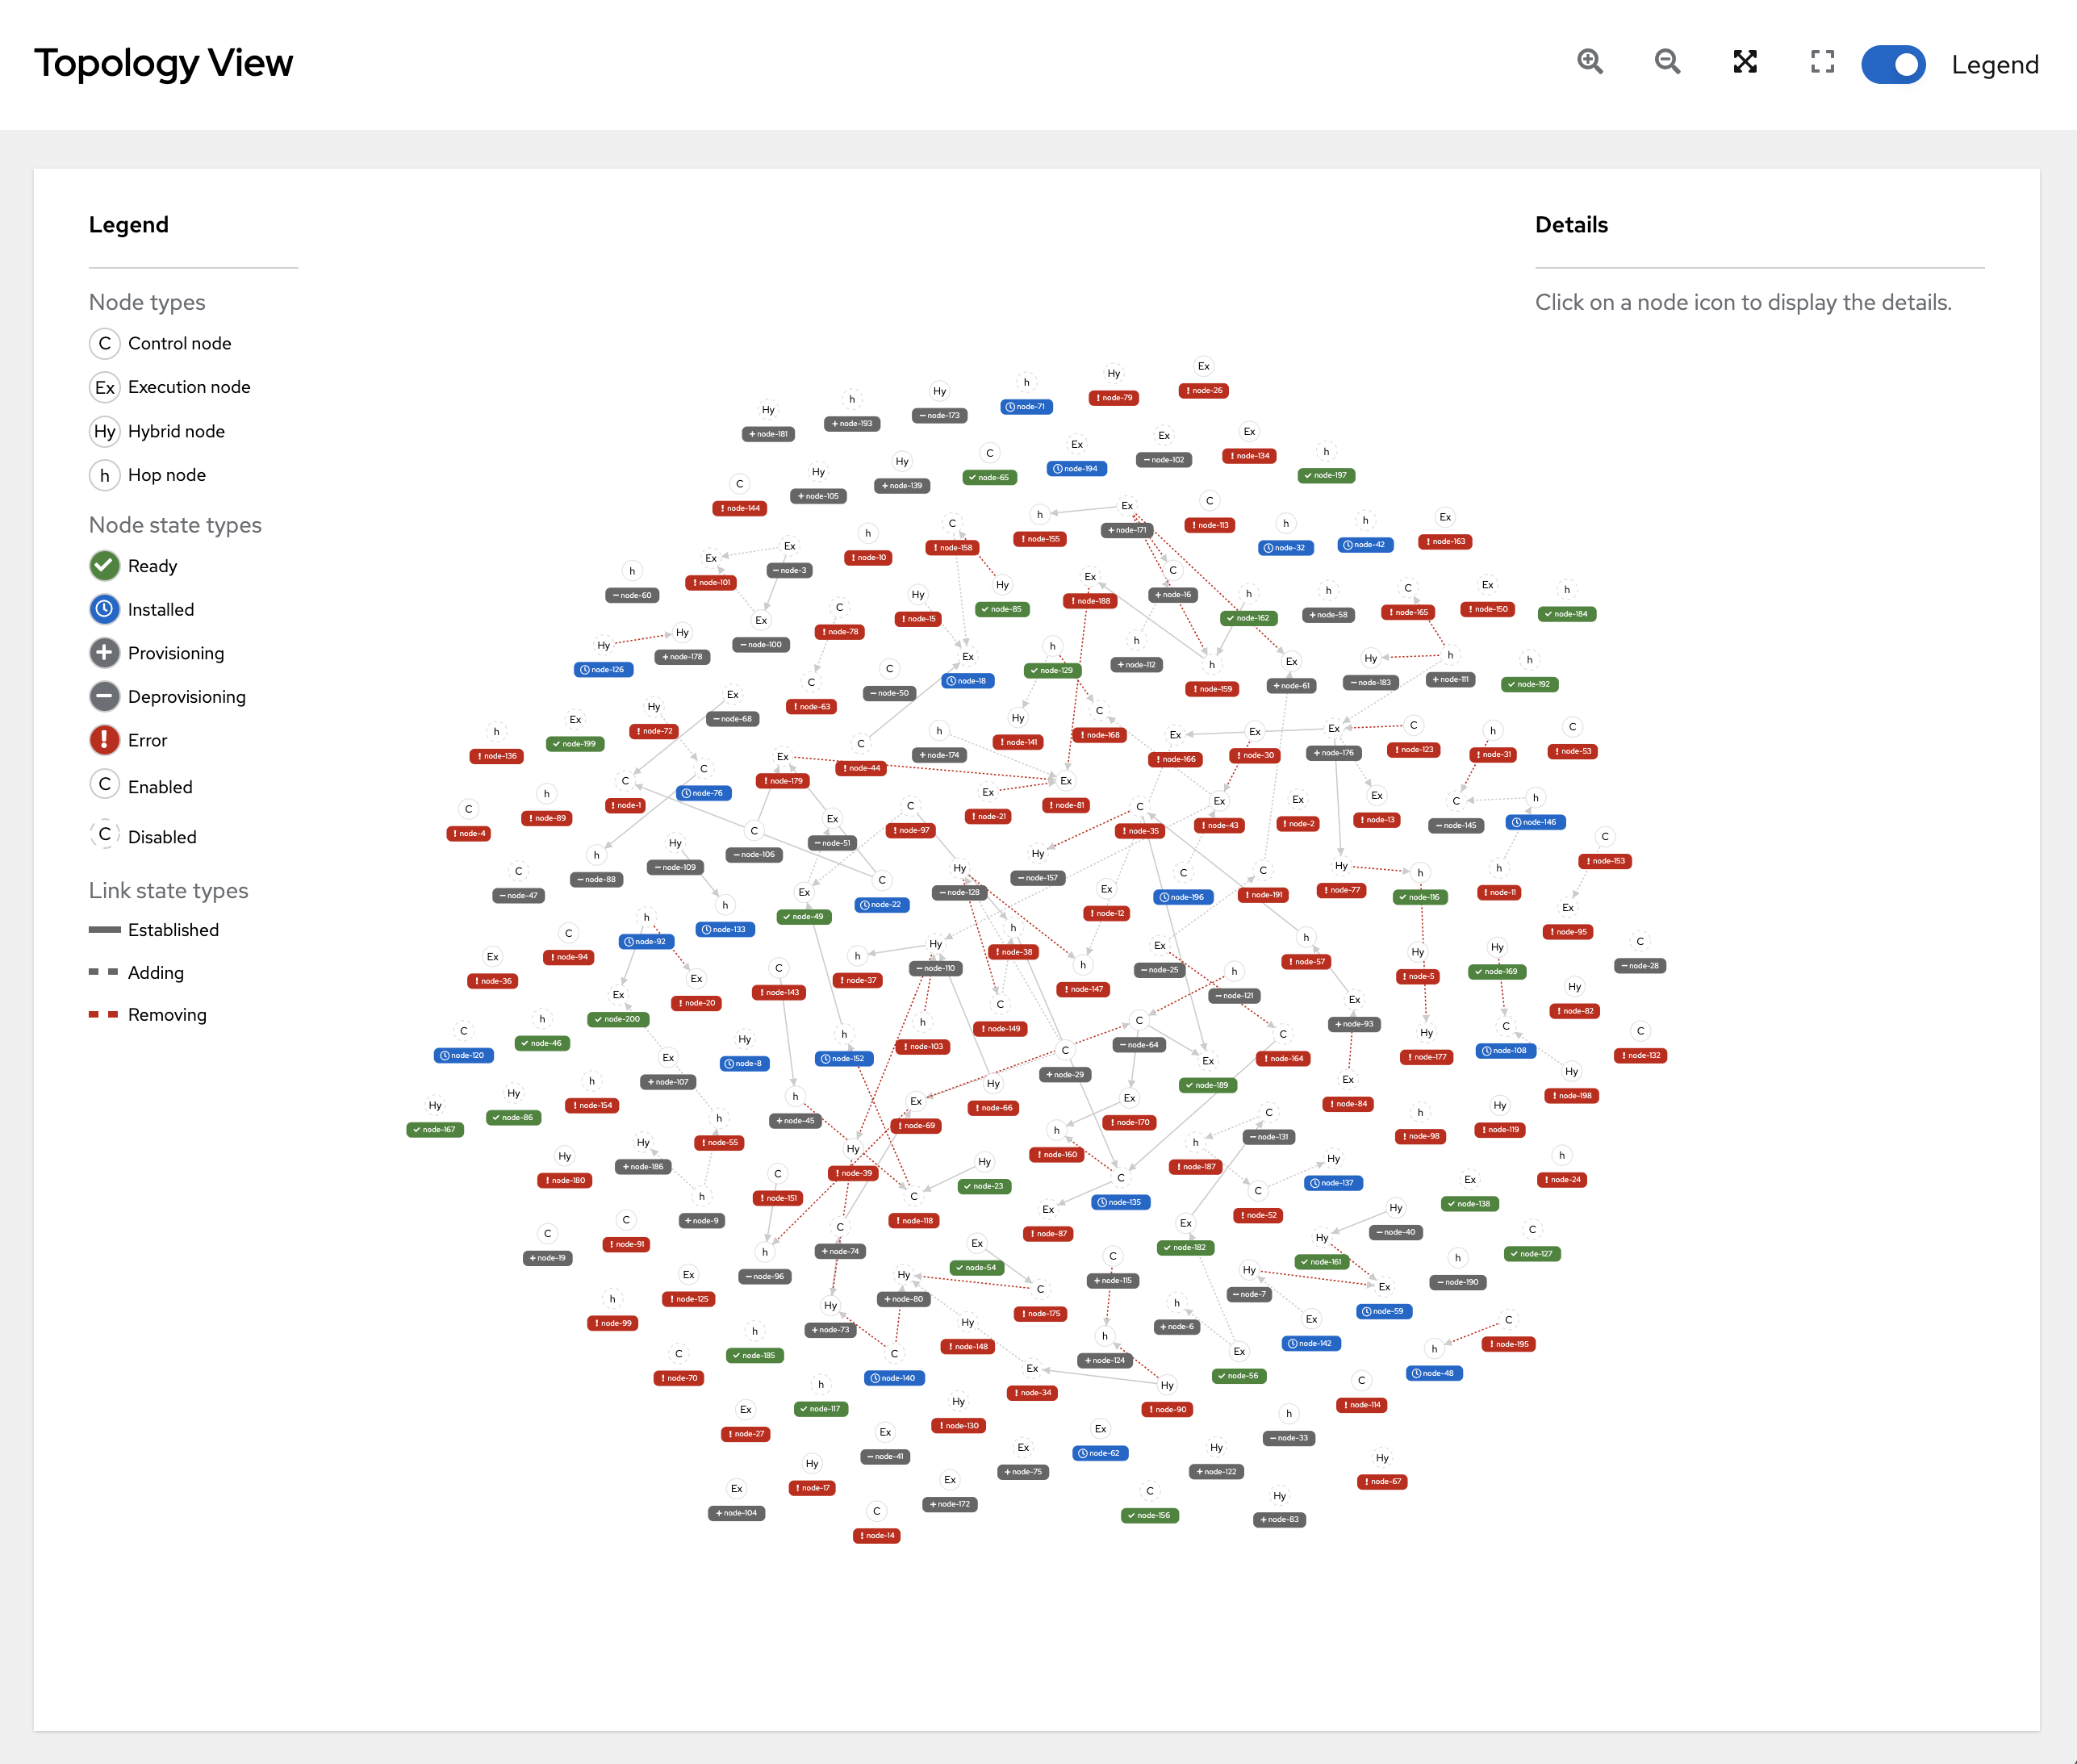
From the navigation panel, select → . The Topology View opens and displays a graphical representation of how each receptor node links together.
To adjust the zoom levels, or manipulate the graphic views, use the control icons: zoom-in (
 ), zoom-out (
 ), expand (
 ), and reset (
 ) on the toolbar.
You can also click and drag to pan around; and scroll using your mouse or trackpad to zoom. The fit-to-screen feature automatically scales the graphic to fit on the screen and repositions it in the center. It is particularly useful when you want to see a large mesh in its entirety.
To reset the view to its default view, click the Reset zoom (
) icon.
Refer to the Legend to identify the type of nodes that are represented.
For VM-based installations, see Control and execution planes
For operator-based installations, see Control and execution planes
for more information on each type of node.
NoteIf the Legend is not present, use the toggle on the top bar to enable it.
The Legend shows the
node status <node_statuses>by color, which is indicative of the health of the node. An Error status in the Legend includes the Unavailable state (as displayed in the Instances list view) plus any future error conditions encountered in later versions of automation controller.The following link statuses are also shown in the Legend:
- Established: This is a link state that indicates a peer connection between nodes that are either ready, unavailable, or disabled.
- Adding: This is a link state indicating a peer connection between nodes that were selected to be added to the mesh topology.
- Removing: This is a link state indicating a peer connection between nodes that were selected to be removed from the topology.
Hover over a node and the connectors highlight to show its immediate connected nodes (peers) or click on a node to retrieve details about it, such as its hostname, node type, and status.
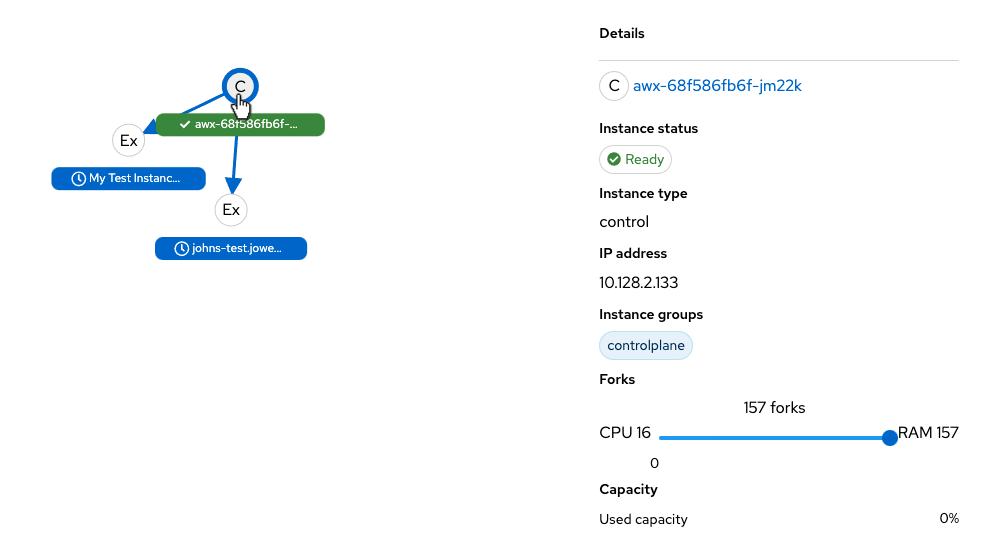
Click on the link for instance hostname from the details displayed to be redirected to its Details page that provides more information about that node, most notably for information about an
Errorstatus, as in the following example.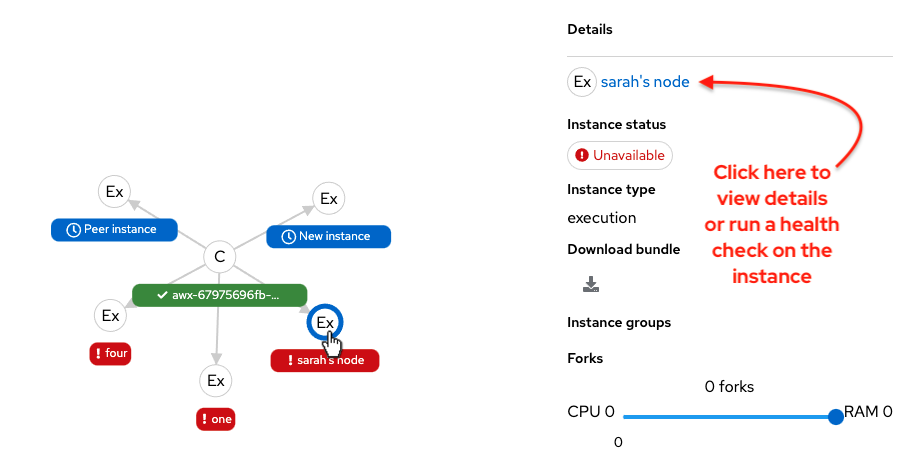
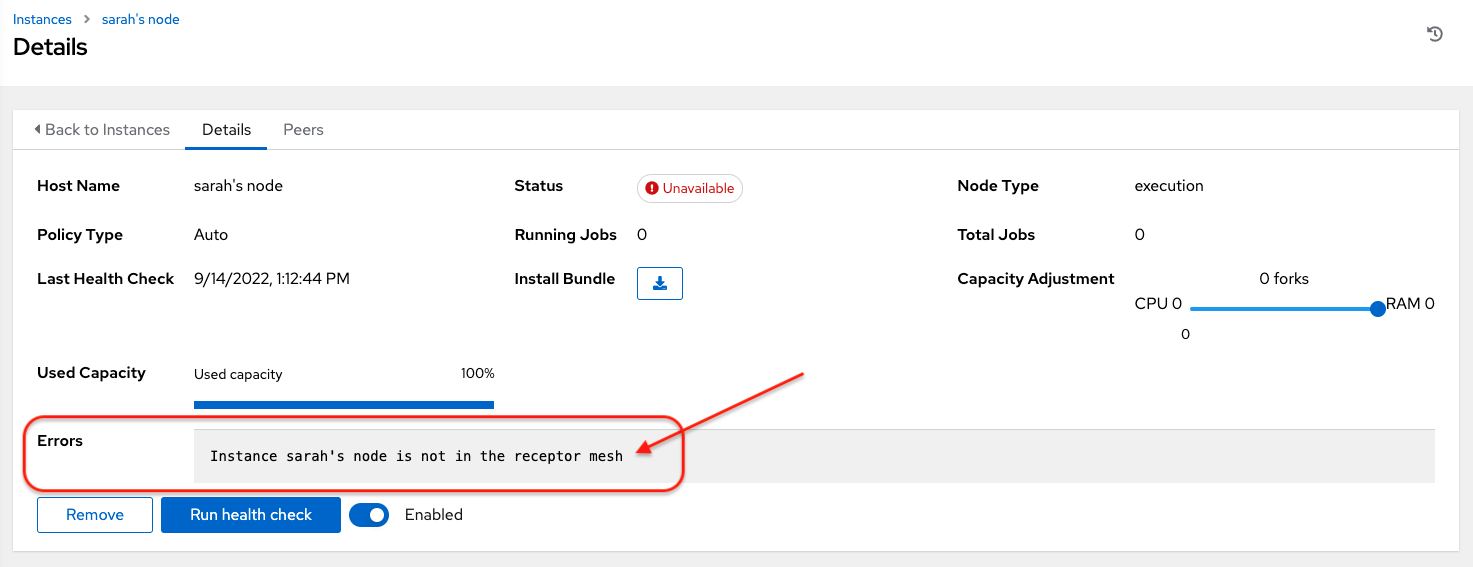
You can use the Details page to remove the instance, run a health check on the instance on an as-needed basis, or unassign jobs from the instance. By default, jobs can be assigned to each node. However, you can disable it to exclude the node from having any jobs running on it.
For more information on creating new nodes and scaling the mesh, see Managing Capacity with Instances.
Chapter 11. Automation controller logfiles
Automation controller logfiles can be accessed from two centralized locations:
-
/var/log/tower/ -
/var/log/supervisor/
In the /var/log/tower/ directory, you can view logfiles captured by:
- tower.log: Captures the log messages such as runtime errors that occur when the job is executed.
- callback_receiver.log: Captures callback receiver logs that handles callback events when running ansible jobs.
- dispatcher.log: Captures log messages for the automation controller dispatcher worker service.
- job_lifecycle.log: Captures details of the job run, whether it is blocked, and what condition is blocking it.
- management_playbooks.log: Captures the logs of management playbook runs, and isolated job runs such as copying the metadata.
- rsyslog.err: Captures rsyslog errors authenticating with external logging services when sending logs to them.
- task_system.log: Captures the logs of tasks that automation controller is running in the background, such as adding cluster instances and logs related to information gathering or processing for analytics.
- tower_rbac_migrations.log: Captures the logs for rbac database migration or upgrade.
- tower_system_tracking_migrations.log: Captures the logs of the controller system tracking migration or upgrade.
- wsbroadcast.log: Captures the logs of websocket connections in the controller nodes.
In the /var/log/supervisor/ directory, you can view logfiles captured by:
-
awx-callback-receiver.log: Captures the log of callback receiver that handles callback events when running ansible jobs, managed by
supervisord. - awx-daphne.log: Captures the logs of Websocket communication of WebUI.
- awx-dispatcher.log: Captures the logs that occur when dispatching a task to an automation controller instance, such as when running a job.
-
awx-rsyslog.log: Captures the logs for the
rsyslogservice. - awx-uwsgi.log: Captures the logs related to uWSGI, which is an application server.
- awx-wsbroadcast.log: Captures the logs of the websocket service that is used by automation controller.
-
failure-event-handler.stderr.log: Captures the standard errors for
/usr/bin/failure-event-handlersupervisord’s subprocess. -
supervisord.log: Captures the logs related to
supervisorditself. - wsrelay.log: Captures the communication logs within the websocket relay server.
- ws_heartbeat.log: Captures the periodic checks on the health of services running on the host.
- rsyslog_configurer.log: Captures rsyslog configuration activity associated with authenticating with external logging services.
The /var/log/supervisor/ directory includes stdout files for all services as well.
You can expect the following log paths to be generated by services used by automation controller (and Ansible Automation Platform):
- /var/log/nginx/
- /var/lib/pgsql/data/pg_log/
- /var/log/redis/
Troubleshooting
Error logs can be found in the following locations:
-
Automation controller server errors are logged in
/var/log/tower. -
Supervisors logs can be found in
/var/log/supervisor/. - Nginx web server errors are logged in the httpd error log.
-
Configure other automation controller logging needs in
/etc/tower/conf.d/.
Explore client-side issues using the JavaScript console built into most browsers and report any errors to Ansible through the Red Hat Customer portal at: https://access.redhat.com/.
Chapter 12. Logging and Aggregation
Logging provides the capability to send detailed logs to third-party external log aggregation services. Services connected to this data feed serve as a means of gaining insight into automation controller use or technical trends. The data can be used to analyze events in the infrastructure, monitor for anomalies, and correlate events in one service with events in another.
The types of data that are most useful to automation controller are job fact data, job events or job runs, activity stream data, and log messages. The data is sent in JSON format over a HTTP connection using minimal service-specific adjustments engineered in a custom handler or through an imported library.
The version of rsyslog that is installed by automation controller does not include the following rsyslog modules:
- rsyslog-udpspoof.x86_64
- rsyslog-libdbi.x86_64
After installing automation controller, you must only use the automation controller provided rsyslog package for any logging outside of automation controller that might have previously been done with the RHEL provided rsyslog package.
If you already use rsyslog for logging system logs on the automation controller instances, you can continue to use rsyslog to handle logs from outside of automation controller by running a separate rsyslog process (using the same version of rsyslog that automation controller uses), and pointing it to a separate /etc/rsyslog.conf file.
Use the /api/v2/settings/logging/ endpoint to configure how the automation controller rsyslog process handles messages that have not yet been sent in the event that your external logger goes offline:
-
LOG_AGGREGATOR_MAX_DISK_USAGE_GB: Specifies the amount of data to store (in gigabytes) during an outage of the external log aggregator (defaults to 1). Equivalent to thersyslogd queue.maxdiskspacesetting. -
LOG_AGGREGATOR_MAX_DISK_USAGE_PATH: Specifies the location to store logs that should be retried after an outage of the external log aggregator (defaults to/var/lib/awx). Equivalent to thersyslogd queue.spoolDirectorysetting.
For example, if Splunk goes offline, rsyslogd stores a queue on the disk until Splunk comes back online. By default, it stores up to 1GB of events (while Splunk is offline) but you can increase that to more than 1GB if necessary, or change the path where you save the queue.
12.1. Loggers
The following are special loggers (except for awx, which constitutes generic server logs) that provide large amounts of information in a predictable structured or semi-structured format, using the same structure as if obtaining the data from the API:
-
job_events: Provides data returned from the Ansible callback module. -
activity_stream: Displays the record of changes to the objects within the application. -
system_tracking: Provides fact data gathered by Ansiblesetupmodule, that is,gather_facts: truewhen job templates are run with Enable Fact Cache selected. -
awx: Provides generic server logs, which include logs that would normally be written to a file. It contains the standard metadata that all logs have, except it only has the message from the log statement.
These loggers only use the log-level of INFO, except for the awx logger, which can be any given level.
Additionally, the standard automation controller logs are deliverable through this same mechanism. It should be apparent how to enable or disable each of these five sources of data without manipulating a complex dictionary in your local settings file, and how to adjust the log-level consumed from the standard automation controller logs.
From the navigation panel, select . Then select Logging settings from the list of System options to configure the logging components in automation controller.
12.1.1. Log message schema
Common schema for all loggers:
-
cluster_host_id: Unique identifier of the host within the automation controller cluster. -
level: Standard python log level, roughly reflecting the significance of the event. All of the data loggers as a part of 'level' useINFOlevel, but the other automation controller logs use different levels as appropriate. -
logger_name: Name of the logger we use in the settings, for example, "activity_stream". -
@timestamp: Time of log. -
path: File path in code where the log was generated.
12.1.2. Activity stream schema
This uses the fields common to all loggers listed in Log message schema.
It has the following additional fields:
-
actor: Username of the user who took the action documented in the log. -
changes: JSON summary of what fields changed, and their old or new values. -
operation: The basic category of the changes logged in the activity stream, for instance, "associate". -
object1: Information about the primary object being operated on, consistent with what is shown in the activity stream. -
object2: If applicable, the second object involved in the action.
This logger reflects the data being saved into job events, except when they would otherwise conflict with expected standard fields from the logger, in which case the fields are nested. Notably, the field host on the job_event model is given as event_host. There is also a sub-dictionary field, event_data within the payload, which contains different fields depending on the specifics of the Ansible event.
This logger also includes the common fields in Log message schema.
12.1.3. Scan / fact / system tracking data schema
These contain detailed dictionary-type fields that are either services, packages, or files.
services: For services scans, this field is included and has keys based on the name of the service.NotePeriods are not allowed by elastic search in names, and are replaced with "_" by the log formatter.
-
package: Included for log messages from package scans. -
files: Included for log messages from file scans. -
host: Name of the host the scan applies to. -
inventory_id: The inventory id the host is inside of.
This logger also includes the common fields in Log message schema.
12.1.4. Job status changes
This is a lower-volume source of information about changes in job states compared to job events, and captures changes to types of unified jobs other than job template based jobs.
This logger also includes the common fields in Log message schema and fields present on the job model.
12.1.5. Automation controller logs
This logger also includes the common fields in Log message schema.
In addition, this contains a msg field with the log message. Errors contain a separate traceback field. From the navigation panel, select . Then select Logging settings from the list of System options and use the ENABLE EXTERNAL LOGGING option to enable or disable the logging components.
12.1.6. Logging Aggregator Services
The logging aggregator service works with the following monitoring and data analysis systems:
12.1.6.1. Splunk
Automation controller’s Splunk logging integration uses the Splunk HTTP Collector. When configuring a SPLUNK logging aggregator, add the full URL to the HTTP Event Collector host, as in the following example:
https://<yourcontrollerfqdn>/api/v2/settings/logging

{
    "LOG_AGGREGATOR_HOST": "https://<yoursplunk>:8088/services/collector/event",
    "LOG_AGGREGATOR_PORT": null,
    "LOG_AGGREGATOR_TYPE": "splunk",
    "LOG_AGGREGATOR_USERNAME": "",
    "LOG_AGGREGATOR_PASSWORD": "$encrypted$",
    "LOG_AGGREGATOR_LOGGERS": [
        "awx",
        "activity_stream",
        "job_events",
        "system_tracking"
    ],
    "LOG_AGGREGATOR_INDIVIDUAL_FACTS": false,
    "LOG_AGGREGATOR_ENABLED": true,
    "LOG_AGGREGATOR_CONTROLLER_UUID": ""
}
The Splunk HTTP Event Collector listens on port 8088 by default, so you must provide the full HEC event URL (with the port number) for LOG_AGGREGATOR_HOST for incoming requests to be processed successfully.
Typical values are shown in the following example:
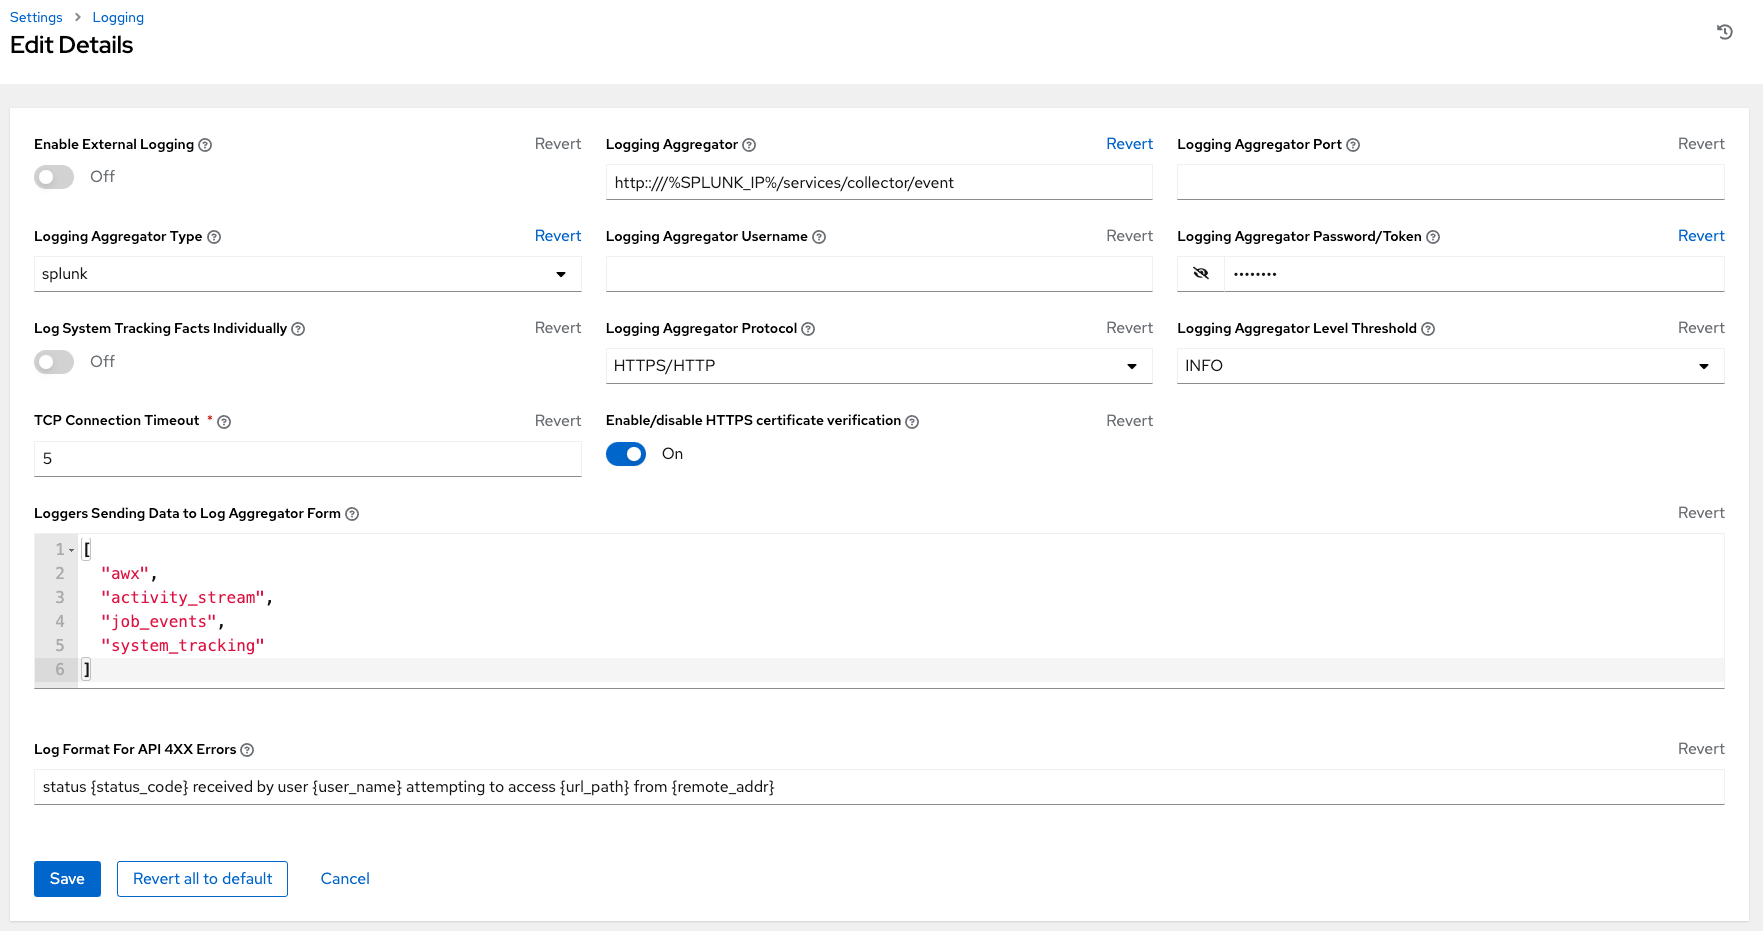
For more information on configuring the HTTP Event Collector, see the Splunk documentation.
12.1.6.2. Loggly
For more information on sending logs through Loggly’s HTTP endpoint, see the Loggly documentation.
Loggly uses the URL convention shown in the Logging Aggregator field in the following example:
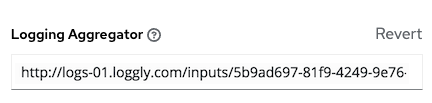
12.1.6.3. Sumologic
In Sumologic, create a search criteria containing the JSON files that provide the parameters used to collect the data you need.
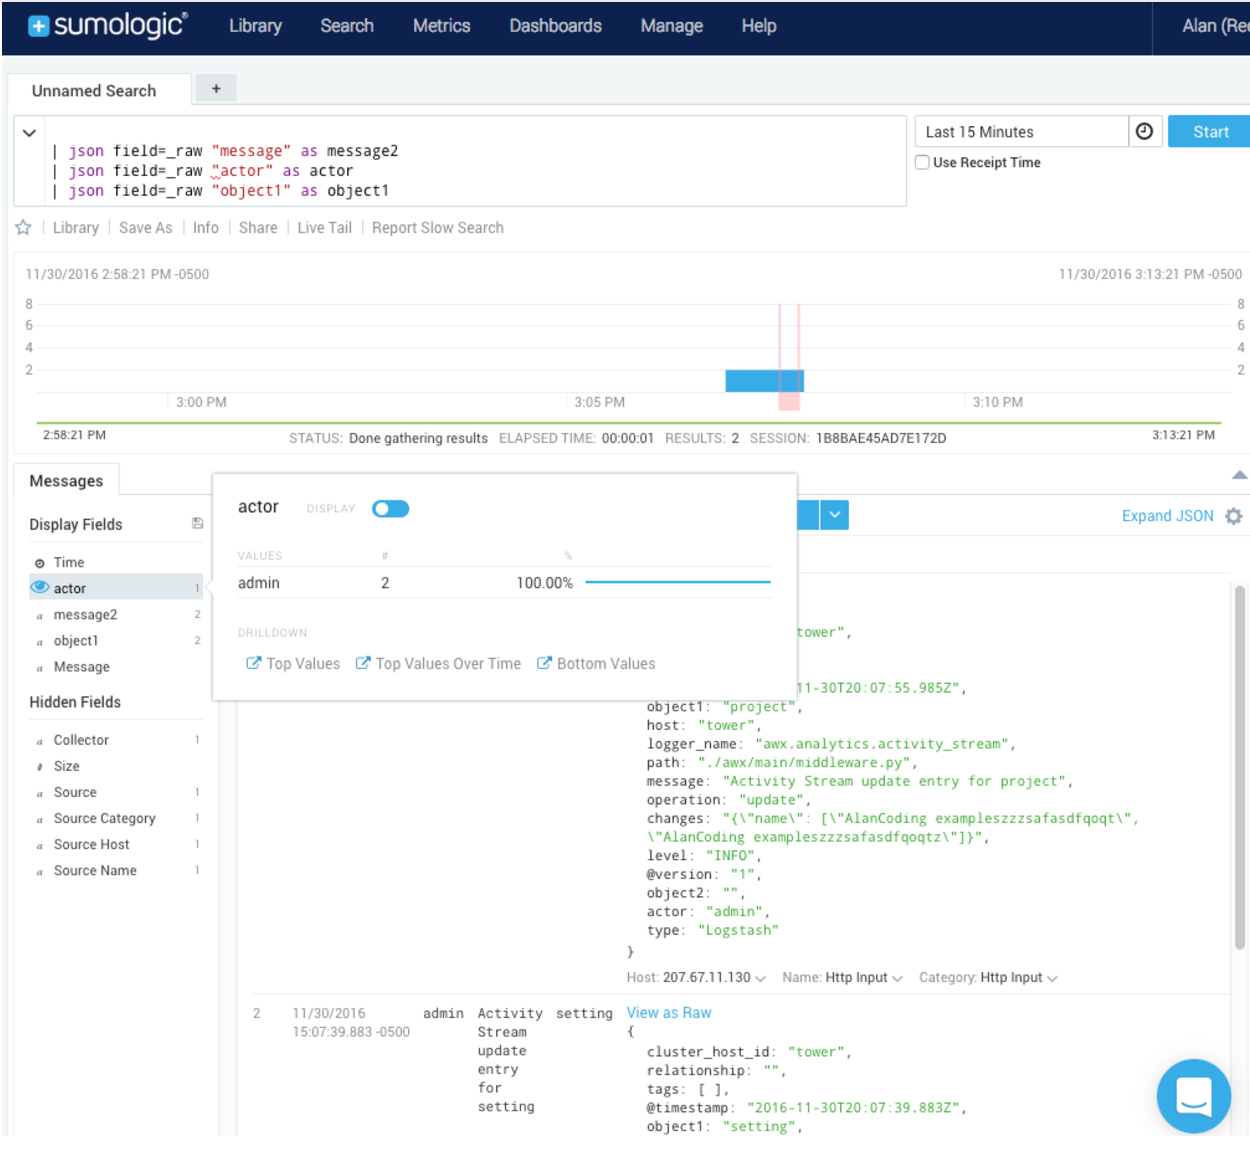
12.1.6.4. Elastic stack (formerly ELK stack)
If you are setting up your own version of the elastic stack, the only change you require is to add the following lines to the logstash logstash.conf file:
filter {
  json {
    source => "message"
  }
}Backward-incompatible changes were introduced with Elastic 5.0.0, and different configurations might be required depending on what version you are using.
12.2. Setting Up Logging
Use the following procedure to set up logging to any of the aggregator types.
Procedure
- From the navigation panel, select .
- Select Logging settings from the list of System options.
- On the Logging settings screen, click .
Set the following configurable options:
- Enable External Logging: Click the toggle button to ON if you want to send logs to an external log aggregator.
- Logging Aggregator: Enter the hostname or IP address that you want to send logs to.
Logging Aggregator Port: Specify the port for the aggregator if it requires one.
NoteWhen the connection type is HTTPS, you can enter the hostname as a URL with a port number, after which, you are not required to enter the port again. However, TCP and UDP connections are determined by the hostname and port number combination, rather than URL. Therefore, in the case of a TCP or UDP connection, supply the port in the specified field. If a URL is entered in the Logging Aggregator field instead, its hostname portion is extracted as the hostname.
Logging Aggregator Type: Click to select the aggregator service from the list:
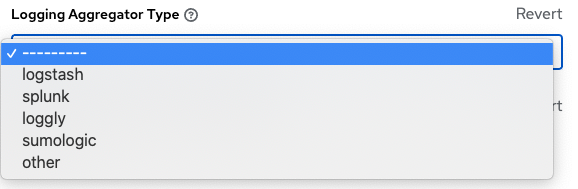
- Logging Aggregator Username: Enter the username of the logging aggregator if required.
- Logging Aggregator Password/Token: Enter the password of the logging aggregator if required.
-
Log System Tracking Facts Individually: Click the tooltip
 icon for additional information, such as whether or not you want to turn it on, or leave it off by default.
- Logging Aggregator Protocol: Click to select a connection type (protocol) to communicate with the log aggregator. Subsequent options vary depending on the selected protocol.
- Logging Aggregator Level Threshold: Select the level of severity you want the log handler to report.
- TCP Connection Timeout: Specify the connection timeout in seconds. This option is only applicable to HTTPS and TCP log aggregator protocols.
- Enable/disable HTTPS certificate verification: Certificate verification is enabled by default for the HTTPS log protocol. Set the toggle to OFF if you do not want the log handler to verify the HTTPS certificate sent by the external log aggregator before establishing a connection.
-
Loggers to Send Data to the Log Aggregator Form: All four types of data are pre-populated by default. Click the tooltip
icon next to the field for additional information on each data type. Delete the data types you do not want.
- Log Format For API 4XX Errors: Configure a specific error message. For more information, see API 4XX Error Configuration.
Review your entries for your chosen logging aggregation. The following example is set up for Splunk:
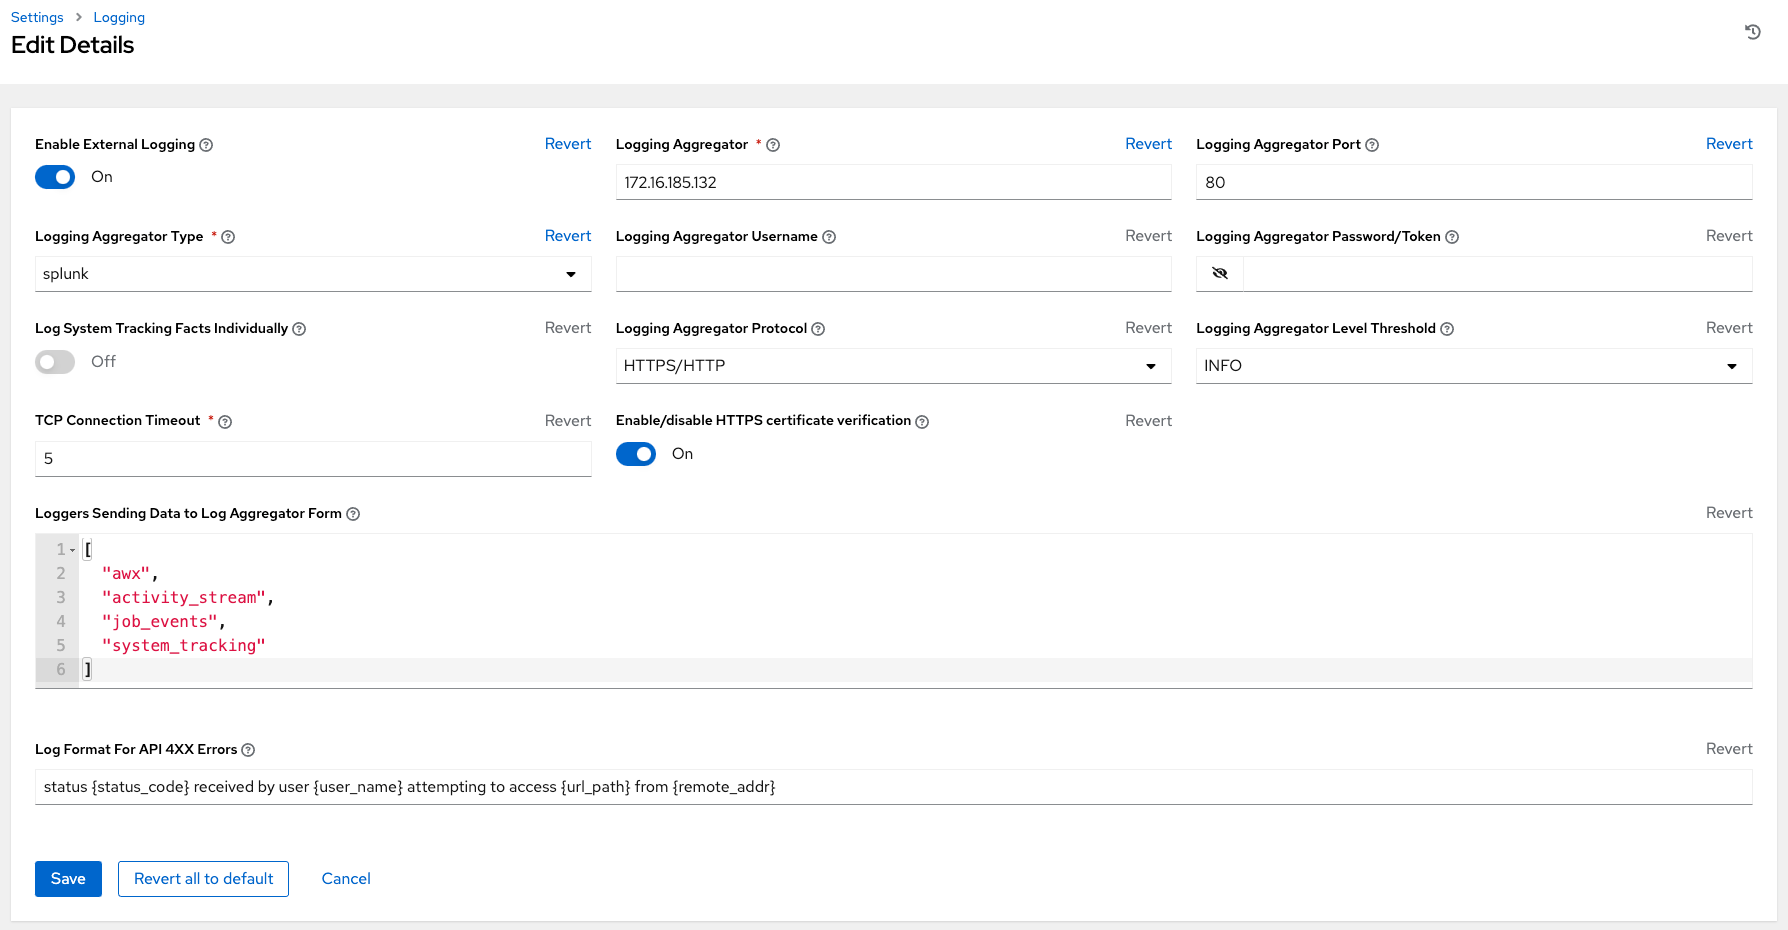
- Click or to abandon the changes.
12.3. API 4XX Error Configuration
When the API encounters an issue with a request, it typically returns an HTTP error code in the 400 range along with an error. When this happens, an error message is generated in the log that follows the following pattern:
' status {status_code} received by user {user_name} attempting to access {url_path} from {remote_addr} 'These messages can be configured as required. Use the following procedure to modify the default API 4XX errors log message format.
Procedure
- From the navigation panel, select then select Logging settings.
- On the Logging settings page, click .
- Modify the field Log Format For API 4XX Errors.
Items surrounded by {} are substituted when the log error is generated. The following variables can be used:
- status_code: The HTTP status code the API is returning.
- user_name: The name of the user that was authenticated when making the API request.
- url_path: The path portion of the URL being called (the API endpoint).
- remote_addr: The remote address received by automation controller.
- error: The error message returned by the API or, if no error is specified, the HTTP status as text.
12.4. Troubleshooting logging
Logging Aggregation
If you have sent a message with the test button to your configured logging service through http or https, but did not receive the message, check the /var/log/tower/rsyslog.err log file. This is where errors are stored if they occurred when authenticating rsyslog with an http or https external logging service. Note that if there are no errors, this file does not exist.
API 4XX Errors
You can include the API error message for 4XX errors by modifying the log format for those messages. Refer to the API 4XX Error Configuration.
LDAP
You can enable logging messages for the LDAP adapter. For more information, see API 4XX Error Configuration.
SAML
You can enable logging messages for the SAML adapter the same way you can enable logging for LDAP. Refer to the Enabling logging for LDAP section for more detail.
Chapter 13. Metrics
A metrics endpoint, /api/v2/metrics/ is available in the API that produces instantaneous metrics about automation controller, which can be consumed by system monitoring software such as the open source project Prometheus.
The types of data shown at the metrics/ endpoint are Content-type: text/plain and application/json.
This endpoint contains useful information, such as counts of how many active user sessions there are, or how many jobs are actively running on each automation controller node.
You can configure Prometheus to scrape these metrics from automation controller by hitting the automation controller metrics endpoint and storing this data in a time-series database.
Clients can later use Prometheus in conjunction with other software such as Grafana or Metricbeat to visualize that data and set up alerts.
13.1. Setting up Prometheus
To set up and use Prometheus, you must install Prometheus on a virtual machine or container.
For more information, see the First steps with Prometheus documentation.
Procedure
In the Prometheus configuration file (typically
prometheus.yml), specify a<token_value>, a valid username and password for an automation controller user that you have created, and a<controller_host>.NoteAlternatively, you can provide an OAuth2 token (which can be generated at
/api/v2/users/N/personal_tokens/). By default, the configuration assumes a user with username=adminand password=password.Using an OAuth2 Token, created at the
/api/v2/tokensendpoint to authenticate Prometheus with automation controller, the following example provides a valid scrape configuration if the URL for your automation controller’s metrics endpoint ishttps://controller_host:443/metrics.scrape_configs - job_name: 'controller' tls_config: insecure_skip_verify: True metrics_path: /api/v2/metrics scrape_interval: 5s scheme: https bearer_token: <token_value> # basic_auth: # username: admin # password: password static_configs: - targets: - <controller_host>For help configuring other aspects of Prometheus, such as alerts and service discovery configurations, see the Prometheus configuration documentation.
If Prometheus is already running, you must restart it to apply the configuration changes by making a POST to the reload endpoint, or by killing the Prometheus process or service.
Use a browser to navigate to your graph in the Prometheus UI at
http://<your_prometheus>:9090/graphand test out some queries. For example, you can query the current number of active automation controller user sessions by executing:awx_sessions_total{type="user"}.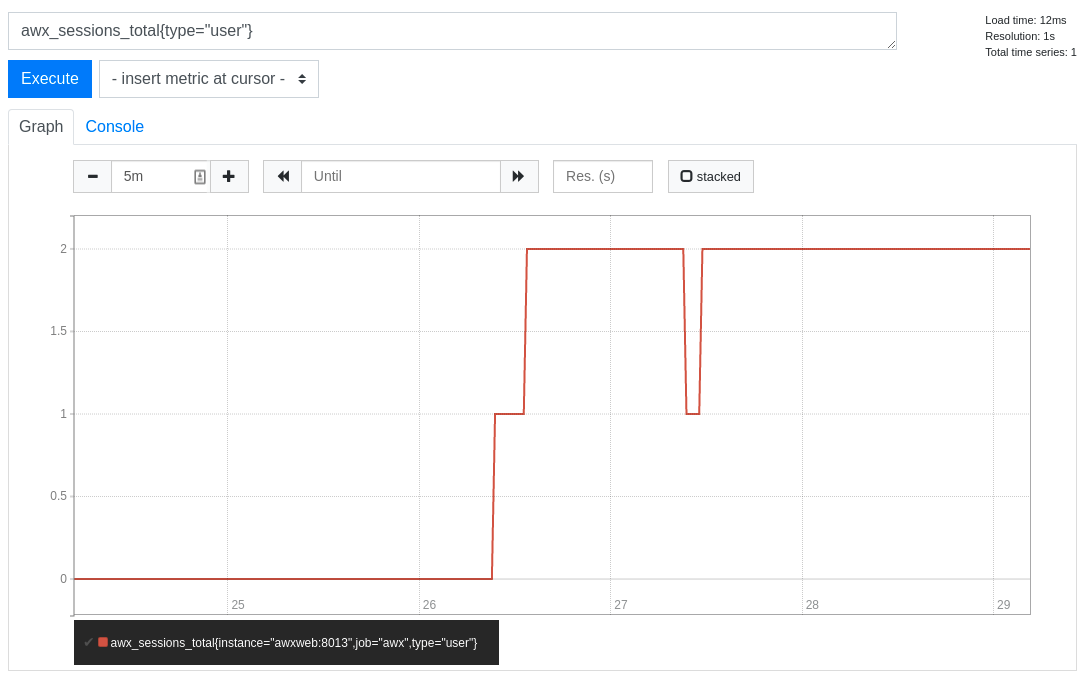
Refer to the metrics endpoint in the automation controller API for your instance (api/v2/metrics) for more ways to query.
Chapter 14. Performance tuning for automation controller
Tune your automation controller to optimize performance and scalability. When planning your workload, ensure that you identify your performance and scaling needs, adjust for any limitations, and monitor your deployment.
Automation controller is a distributed system with multiple components that you can tune, including the following:
- Task system in charge of scheduling jobs
- Control Plane in charge of controlling jobs and processing output
- Execution plane where jobs run
- Web server in charge of serving the API
- Websocket system that serve and broadcast websocket connections and data
- Database used by multiple components
14.1. Capacity Planning for deploying automation controller
Capacity planning for automation controller is planning the scale and characteristics of your deployment so that it has the capacity to run the planned workload. Capacity planning includes the following phases:
- Characterizing your workload
- Reviewing the capabilities of different node types
- Planning the deployment based on the requirements of your workload
14.1.1. Characteristics of your workload
Before planning your deployment, establish the workload that you want to support. Consider the following factors to characterize an automation controller workload:
- Managed hosts
- Tasks per hour per host
- Maximum number of concurrent jobs that you want to support
- Maximum number of forks set on jobs. Forks determine the number of hosts that a job acts on concurrently.
- Maximum API requests per second
- Node size that you prefer to deploy (CPU/Memory/Disk)
14.1.2. Types of nodes in automation controller
You can configure four types of nodes in an automation controller deployment:
- Control nodes
- Hybrid nodes
- Execution nodes
- Hop nodes
14.1.2.1. Benefits of scaling control nodes
Control and hybrid nodes provide control capacity. They provide the ability to start jobs and process their output into the database. Every job is assigned a control node. In the default configuration, each job requires one capacity unit to control. For example, a control node with 100 capacity units can control a maximum of 100 jobs.
Vertically scaling a control node by deploying a larger virtual machine with more resources increases the following capabilities of the control plane:
- The number of jobs that a control node can perform control tasks for, which requires both more CPU and memory.
- The number of job events a control node can process concurrently.
Scaling CPU and memory in the same proportion is recommended, for example, 1 CPU: 4 GB RAM. Even when memory consumption is high, increasing the CPU of an instance can often relieve pressure. The majority of the memory that control nodes consume is from unprocessed events that are stored in a memory-based queue.
Vertically scaling a control node does not automatically increase the number of workers that handle web requests.
An alternative to vertically scaling is horizontally scaling by deploying more control nodes. This allows spreading control tasks across more nodes as well as allowing web traffic to be spread over more nodes, given that you provision a load balancer to spread requests across nodes. Horizontally scaling by deploying more control nodes in many ways can be preferable as it additionally provides for more redundancy and workload isolation in the event that a control node goes down or experiences higher than normal load.
14.1.2.2. Benefits of scaling execution nodes
Execution and hybrid nodes provide execution capacity. The capacity consumed by a job is equal to the number of forks set on the job template or the number of hosts in the inventory, whichever is less, plus one additional capacity unit to account for the main ansible process. For example, a job template with the default forks value of 5 acting on an inventory with 50 hosts consumes 6 capacity units from the execution node it is assigned to.
Vertically scaling an execution node by deploying a larger virtual machine with more resources provides more forks for job execution. This increases the number of concurrent jobs that an instance can run.
In general, scaling CPU alongside memory in the same proportion is recommended. Like control and hybrid nodes, there is a capacity adjustment on each execution node that you can use to align actual use with the estimation of capacity consumption that the automation controller makes. By default, all nodes are set to the top of that range. If actual monitoring data reveals the node to be over-used, decreasing the capacity adjustment can help bring this in line with actual usage.
An alternative to vertically scaling execution nodes is horizontally scaling the execution plane by deploying more virtual machines to be execution nodes. Because horizontally scaling can provide additional isolation of workloads, you can assign different instances to different instance groups. You can then assign these instance groups to organizations, inventories, or job templates. For example, you can configure an instance group that can only be used for running jobs against a certain Inventory. In this scenario, by horizontally scaling the execution plane, you can ensure that lower-priority jobs do not block higher-priority jobs
14.1.2.3. Benefits of scaling hop nodes
Because hop nodes use very low memory and CPU, vertically scaling these nodes does not impact capacity. Monitor the network bandwidth of any hop node that serves as the sole connection between many execution nodes and the control plane. If bandwidth use is saturated, consider changing the network.
Horizontally scaling by adding more hop nodes could provide redundancy in the event that one hop node goes down, which can allow traffic to continue to flow between the control plane and the execution nodes.
14.1.2.4. Ratio of control to execution capacity
Assuming default configuration, the maximum recommended ratio of control capacity to execution capacity is 1:5 in traditional VM deployments. This ensures that there is enough control capacity to run jobs on all the execution capacity available and process the output. Any less control capacity in relation to the execution capacity, and it would not be able to launch enough jobs to use the execution capacity.
There are cases in which you might want to modify this ratio closer to 1:1. For example, in cases where a job produces a high level of job events, reducing the amount of execution capacity in relation to the control capacity helps relieve pressure on the control nodes to process that output.
14.2. Example capacity planning exercise
After you have determined the workload capacity that you want to support, you must plan your deployment based on the requirements of the workload. To help you with your deployment, review the following planning exercise.
For this example, the cluster must support the following capacity:
- 300 managed hosts
- 1,000 tasks per hour per host or 16 tasks per minute per host
- 10 concurrent jobs
- Forks set to 5 on playbooks. This is the default.
- Average event size is 1 Mb
The virtual machines have 4 CPU and 16 GB RAM, and disks that have 3000 IOPs.
14.2.1. Example workload requirements
For this example capacity planning exercise, use the following workload requirements:
Execution capacity
To run the 10 concurrent jobs requires at least 60 units of execution capacity.
- You calculate this by using the following equation: (10 jobs * 5 forks) + (10 jobs * 1 base task impact of a job) = 60 execution capacity
Control capacity
- To control 10 concurrent jobs requires at least 10 units of control capacity.
To calculate the number of events per hour that you need to support 300 managed hosts and 1,000 tasks per hour per host, use the following equation:
- 1000 tasks * 300 managed hosts per hour = 300,000 events per hour at minimum.
- You must run the job to see exactly how many events it produces, because this is dependent on the specific task and verbosity. For example, a debug task printing “Hello World” produces 6 job events with the verbosity of 1 on one host. With a verbosity of 3, it produces 34 job events on one host. Therefore, you must estimate that the task produces at least 6 events. This would produce closer to 3,000,000 events per hour, or approximately 833 events per second.
Determining quantity of execution and control nodes needed
To determine how many execution and control nodes you need, reference the experimental results in the following table that shows the observed event processing rate of a single control node with 5 execution nodes of equal size (API Capacity column). The default “forks” setting of job templates is 5, so using this default, the maximum number of jobs a control node can dispatch to execution nodes makes 5 execution nodes of equal CPU/RAM use 100% of their capacity, arriving to the previously mentioned 1:5 ratio of control to execution capacity.
| Node | API capacity | Default execution capacity | Default control capacity | Mean event processing rate at 100% capacity usage | Mean events processing rate at 50% capacity usage | Mean event processing rate at 40% capacity usage |
|---|---|---|---|---|---|---|
| 4 CPU at 2.5Ghz, 16 GB RAM control node, a maximum of 3000 IOPs disk | approximately 10 requests per second | n/a | 137 jobs | 1100 per second | 1400 per second | 1630 per second |
| 4 CPU at 2.5Ghz, 16 GB RAM execution node, a maximum of 3000 IOPs disk | n/a | 137 | n/a | n/a | n/a | n/a |
| 4 CPU at 2.5Ghz, 16 GB RAM database node, a maximum of 3000 IOPs disk | n/a | n/a | n/a | n/a | n/a | n/a |
Because controlling jobs competes with job event processing on the control node, over-provisioning control capacity can reduce processing times. When processing times are high, you can experience a delay between when the job runs and when you can view the output in the API or UI.
For this example, for a workload on 300 managed hosts, executing 1000 tasks per hour per host, 10 concurrent jobs with forks set to 5 on playbooks, and an average event size 1 Mb, use the following procedure:
- Deploy 1 execution node, 1 control node, 1 database node of 4 CPU at 2.5Ghz, 16 GB RAM, and disks that have approximately 3000 IOPs.
- Keep the default fork setting of 5 on job templates.
- Use the capacity adjustment feature in the instance view of the UI on the control node to reduce the capacity down to 16, the lowest value, to reserve more of the control node’s capacity for processing events.
Additional Resources
- For more information on workloads with high levels of API interaction, see Scaling Automation Controller for API Driven Workloads.
- For more information on managing capacity with instances, see Managing Capacity With Instances.
- For more information on operator-based deployments, see Red Hat Ansible Automation Platform Performance Considerations for Operator Based Installations.
14.3. Performance troubleshooting for automation controller
Users experience many request timeouts (504 or 503 errors), or in general high API latency. In the UI, clients face slow login and long wait times for pages to load. What system is the likely culprit?
- If these issues occur only on login, and you use external authentication, the problem is likely with the integration of your external authentication provider. See Setting up enterprise authentication or seek Red Hat Support.
- For other issues with timeouts or high API latency, see Web server tuning.
Long wait times for job output to load.
- Job output streams from the execution node where the ansible-playbook is actually run to the associated control node. Then the callback receiver serializes this data and writes it to the database. Relevant settings to observe and tune can be found in Settings for managing job event processing and PostgreSQL database configuration and maintenance for automation controller.
- In general, to resolve this symptom it is important to observe the CPU and memory use of the control nodes. If CPU or memory use is very high, you can either horizontally scale the control plane by deploying more virtual machines to be control nodes naturally spreads out work more, or to modify the number of jobs a control node will manage at a time. For more information, see Capacity settings for control and execution nodes for more information.
What can I do to increase the number of jobs that automation controller can run concurrently?
Factors that cause jobs to remain in “pending” state are:
- Waiting for “dependencies” to finish: this includes project updates and inventory updates when “update on launch” behavior is enabled.
- The “allow_simultaneous” setting of the job template: if multiple jobs of the same job template are in “pending” status, check the “allow_simultaneous” setting of the job template (“Concurrent Jobs” checkbox in the UI). If this is not enabled, only one job from a job template can run at a time.
- The “forks” value of your job template: the default value is 5. The amount of capacity required to run the job is roughly the forks value (some small overhead is accounted for). If the forks value is set to a very large number, this will limit what nodes will be able to run it.
- Lack of either control or execution capacity: see “awx_instance_remaining_capacity” metric from the application metrics available on /api/v2/metrics. See Metrics for monitoring automation controller application for more information about how to monitor metrics. See Capacity planning for deploying automation controller for information on how to plan your deployment to handle the number of jobs you are interested in.
Jobs run more slowly on automation controller than on a local machine.
- Some additional overhead is expected, because automation controller might be dispatching your job to a separate node. In this case, automation controller is starting a container and running ansible-playbook there, serializing all output and writing it to a database.
- Project update on launch and inventory update on launch behavior can cause additional delays at job start time.
- Size of projects can impact how long it takes to start the job, as the project is updated on the control node and transferred to the execution node. Internal cluster routing can impact network performance. For more information, see Internal cluster routing.
- Container pull settings can impact job start time. The execution environment is a container that is used to run jobs within it. Container pull settings can be set to “Always”, “Never” or “If not present”. If the container is always pulled, this can cause delays.
- Ensure that all cluster nodes, including execution, control, and the database, have been deployed in instances with storage rated to the minimum required IOPS, because the manner in which automation controller runs ansible and caches event data implicates significant disk I/O. For more information, see Red Hat Ansible Automation Platform system requirements.
Database storage does not stop growing.
- Automation controller has a management job titled “Cleanup Job Details”. By default, it is set to keep 120 days of data and to run once a week. To reduce the amount of data in the database, you can shorten the retention time. For more information, see Removing Old Activity Stream Data.
- Running the cleanup job deletes the data in the database. However, the database must at some point perform its vacuuming operation which reclaims storage. See PostgreSQL database configuration and maintenance for automation controller for more information about database vacuuming.
14.4. Metrics to monitor automation controller
Monitor your automation controller hosts at the system and application levels.
System level monitoring includes the following information:
- Disk I/O
- RAM use
- CPU use
- Network traffic
Application level metrics provide data that the application knows about the system. This data includes the following information:
- How many jobs are running in a given instance
- Capacity information about instances in the cluster
- How many inventories are present
- How many hosts are in those inventories
Using system and application metrics can help you identify what was happening in the application when a service degradation occurred. Information about automation controller’s performance over time helps when diagnosing problems or doing capacity planning for future growth.
14.4.1. Metrics for monitoring automation controller application
For application level monitoring, automation controller provides Prometheus-style metrics on an API endpoint /api/v2/metrics. Use these metrics to monitor aggregate data about job status and subsystem performance, such as for job output processing or job scheduling.
The metrics endpoint includes descriptions of each metric. Metrics of particular interest for performance include:
awx_status_total- Current total of jobs in each status. Helps correlate other events to activity in system.
- Can monitor upticks in errored or failed jobs.
awx_instance_remaining_capacity
- Amount of capacity remaining for running additional jobs.
callback_receiver_event_processing_avg_seconds- colloquially called “job events lag”.
- Running average of the lag time between when a task occurred in ansible and when the user is able to see it. This indicates how far behind the callback receiver is in processing events. When this number is very high, users can consider scaling up the control plane or using the capacity adjustment feature to reduce the number of jobs a control node controls.
callback_receiver_events_insert_db- Counter of events that have been inserted by a node. Can be used to calculate the job event insertion rate over a given time period.
callback_receiver_events_queue_size_redis- Indicator of how far behind callback receiver is in processing events. If too high, Redis can cause the control node to run out of memory (OOM).
14.4.2. System level monitoring
Monitoring the CPU and memory use of your cluster hosts is important because capacity management for instances does not introspect into the actual resource usage of hosts. The resource impact of automation jobs depends on what the playbooks are doing. For example, many cloud or networking modules do most of the processing on the execution node, which runs the Ansible Playbook. The impact on the automation controller is very different than if you were running a native module like “yum” where the work is performed on the target hosts where the execution node spends much of the time during this task waiting on results.
If CPU or memory usage is very high, consider lowering the capacity adjustment (available on the instance detail page) on affected instances in the automation controller. This limits how many jobs are run on or controlled by this instance.
Monitor the disk I/O and use of your system. The manner in which an automation controller node runs Ansible and caches output on the file system, and eventually saves it in the database, creates high levels of disk reads and writes. Identifying poor disk performance early can help prevent poor user experience and system degradation.
Additional resources
- For more information about configuring monitoring, see Metrics.
- Additional insights into automation usage are available when you enable data collection for automation analytics. For more information, see Automation analytics and Red Hat Insights for Red Hat Ansible Automation Platform.
14.5. PostgreSQL database configuration and maintenance for automation controller
To improve the performance of automation controller, you can configure the following configuration parameters in the database:
Maintenance
The VACUUM and ANALYZE tasks are important maintenance activities that can impact performance. In normal PostgreSQL operation, tuples that are deleted or obsoleted by an update are not physically removed from their table; they remain present until a VACUUM is done. Therefore it’s necessary to do VACUUM periodically, especially on frequently-updated tables. ANALYZE collects statistics about the contents of tables in the database, and stores the results in the pg_statistic system catalog. Subsequently, the query planner uses these statistics to help determine the most efficient execution plans for queries. The autovacuuming PostgreSQL configuration parameter automates the execution of VACUUM and ANALYZE commands. Setting autovacuuming to true is a good practice. However, autovacuuming will not occur if there is never any idle time on the database. If it is observed that autovacuuming is not sufficiently cleaning up space on the database disk, then scheduling specific vacuum tasks during specific maintenance windows can be a solution.
Configuration parameters
To improve the performance of the PostgreSQL server, configure the following Grand Unified Configuration (GUC) parameters that manage database memory. You can find these parameters inside the $PDATA directory in the postgresql.conf file, which manages the configurations of the database server.
-
shared_buffers: determines how much memory is dedicated to the server for caching data. The default value for this parameter is 128 MB. When you modify this value, you must set it between 15% and 25% of the machine’s total RAM.
You must restart the database server after changing the value for shared_buffers.
work_mem: provides the amount of memory to be used by internal sort operations and hash tables before disk-swapping. Sort operations are used for order by, distinct, and merge join operations. Hash tables are used in hash joins and hash-based aggregation. The default value for this parameter is 4 MB. Setting the correct value of thework_memparameter improves the speed of a search by reducing disk-swapping.-
Use the following formula to calculate the optimal value of the
work_memparameter for the database server:
-
Use the following formula to calculate the optimal value of the
Total RAM * 0.25 / max_connections
Setting a large work_mem can cause the PostgreSQL server to go out of memory (OOM) if there are too many open connections to the database.
-
max_connections: specifies the maximum number of concurrent connections to the database server. -
maintenance_work_mem: provides the maximum amount of memory to be used by maintenance operations, such as vacuum, create index, and alter table add foreign key operations. The default value for this parameter is 64 MB. Use the following equation to calculate a value for this parameter:
Total RAM * 0.05
Set maintenance_work_mem higher than work_mem to improve performance for vacuuming.
Additional resources
For more information on autovacuuming settings, see Automatic Vacuuming.
14.6. Automation controller tuning
You can configure many automation controller settings by using the automation controller UI, API, and file based settings including:
- Live events in the automation controller UI
- Job event processing
- Control and execution node capacity
- Instance group and container group capacity
- Task management (job scheduling)
- Internal cluster routing
- Web server tuning
14.6.1. Managing live events in the automation controller UI
Events are sent to any node where there is a UI client subscribed to a job. This task is expensive, and becomes more expensive as the number of events that the cluster is producing increases and the number of control nodes increases, because all events are broadcast to all nodes regardless of how many clients are subscribed to particular jobs.
To reduce the overhead of displaying live events in the UI, administrators can choose to either:
- Disable live streaming events.
- Reduce the number of events shown per second or before truncating or hiding events in the UI.
When you disable live streaming of events, they are only loaded on hard refresh to a job’s output detail page. When you reduce the number of events shown per second, this limits the overhead of showing live events, but still provides live updates in the UI without a hard refresh.
14.6.1.1. Disabling live streaming events
Procedure
Disable live streaming events by using one of the following methods:
-
In the API, set
UI_LIVE_UPDATES_ENABLEDto False. - Navigate to your automation controller. Open the Miscellaneous System Settings window. Set the Enable Activity Stream toggle to Off.
-
In the API, set
14.6.1.2. Settings to modify rate and size of events
If you cannot disable live streaming of events because of their size, reduce the number of events that are displayed in the UI. You can use the following settings to manage how many events are displayed:
Settings available for editing in the UI or API:
-
EVENT_STDOUT_MAX_BYTES_DISPLAY: Maximum amount ofstdoutto display (as measured in bytes). This truncates the size displayed in the UI. -
MAX_WEBSOCKET_EVENT_RATE: Number of events to send to clients per second.
Settings available by using file based settings:
-
MAX_UI_JOB_EVENTS: Number of events to display. This setting hides the rest of the events in the list. -
MAX_EVENT_RES_DATA: The maximum size of the ansible callback event’s "res" data structure. The "res" is the full "result" of the module. When the maximum size of ansible callback events is reached, then the remaining output will be truncated. Default value is 700000 bytes. -
LOCAL_STDOUT_EXPIRE_TIME: The amount of time before astdoutfile is expired and removed locally.
Additional resources
For more information on file based settings, see Additional settings for automation controller.
14.6.2. Settings for managing job event processing
The callback receiver processes all the output of jobs and writes this output as job events to the automation controller database. The callback receiver has a pool of workers that processes events in batches. The number of workers automatically increases with the number of CPU available on an instance.
Administrators can override the number of callback receiver workers with the setting JOB_EVENT_WORKERS. Do not set more than 1 worker per CPU, and there must be at least 1 worker. Greater values have more workers available to clear the Redis queue as events stream to the automation controller, but can compete with other processes such as the web server for CPU seconds, uses more database connections (1 per worker), and can reduce the batch size of events each worker commits.
Each worker builds up a buffer of events to write in a batch. The default amount of time to wait before writing a batch is 1 second. This is controlled by the JOB_EVENT_BUFFER_SECONDS setting. Increasing the amount of time the worker waits between batches can result in larger batch sizes.
14.6.3. Capacity settings for control and execution nodes
The following settings impact capacity calculations on the cluster. Set them to the same value on all control nodes by using the following file-based settings.
-
AWX_CONTROL_NODE_TASK_IMPACT: Sets the impact of controlling jobs. You can use it when your control plane exceeds desired CPU or memory usage to control the number of jobs that your control plane can run at the same time. -
SYSTEM_TASK_FORKS_CPUandSYSTEM_TASK_FORKS_MEM: Influence how many resources are estimated to be consumed by each fork of Ansible. By default, 1 fork of Ansible is estimated to use 0.25 of a CPU and 100 Mb of memory.
Additional resources
For information about file-based settings, see Additional settings for automation controller.
14.6.4. Capacity settings for instance group and container group
Use the max_concurrent_jobs and max_forks settings available on instance groups to limit how many jobs and forks can be consumed across an instance group or container group.
-
To calculate the
max_concurrent_jobsyou need on a container group consider thepod_specsetting for that container group. In thepod_spec, you can see the resource requests and limits for the automation job pod. Use the following equation to calculate the maximum concurrent jobs that you need:
((number of worker nodes in kubernetes cluster) * (CPU available on each worker)) / (CPU request on pod_spec) = maximum number of concurrent jobs
For example, if your
pod_specindicates that a pod will request 250 mcpu Kubernetes cluster has 1 worker node with 2 CPU, the maximum number of jobs that you need to start with is 8.-
You can also consider the memory consumption of the forks in the jobs. Calculate the appropriate setting of
max_forkswith the following equation:
-
You can also consider the memory consumption of the forks in the jobs. Calculate the appropriate setting of
((number of worker nodes in kubernetes cluster) * (memory available on each worker)) / (memory request on pod_spec) = maximum number of forks
For example, given a single worker node with 8 Gb of Memory, we determine that the
max forkswe want to run is 81. This way, either 39 jobs with 1 fork can run (task impact is always forks + 1), or 2 jobs with forks set to 39 can run.-
You might have other business requirements that motivate using
max_forksormax_concurrent_jobsto limit the number of jobs launched in a container group.
-
You might have other business requirements that motivate using
14.6.5. Settings for scheduling jobs
The task manager periodically collects tasks that need to be scheduled and determines what instances have capacity and are eligible for running them. The task manager has the following workflow:
- Find and assign the control and execution instances.
- Update the job’s status to waiting.
-
Message the control node through
pg_notifyfor the dispatcher to pick up the task and start running it.
If the scheduling task is not completed within TASK_MANAGER_TIMEOUT seconds (default 300 seconds), the task is terminated early. Timeout issues generally arise when there are thousands of pending jobs.
One way the task manager limits how much work it can do in a single run is the START_TASK_LIMIT setting. This limits how many jobs it can start in a single run. The default is 100 jobs. If more jobs are pending, a new scheduler task is scheduled to run immediately after. Users who are willing to have potentially longer latency between when a job is launched and when it starts, to have greater overall throughput, can consider increasing the START_TASK_LIMIT. To see how long individual runs of the task manager take, use the Prometheus metric task_manager__schedule_seconds, available in /api/v2/metrics.
Jobs elected to begin running by the task manager do not do so until the task manager process exits and commits its changes. The TASK_MANAGER_TIMEOUT setting determines how long a single run of the task manager will run for before committing its changes. When the task manager reaches its timeout, it attempts to commit any progress it made. The task is not actually forced to exit until after a grace period (determined by TASK_MANAGER_TIMEOUT_GRACE_PERIOD) has passed.
14.6.6. Internal Cluster Routing
Automation controller cluster hosts communicate across the network within the cluster. In the inventory file for the traditional VM installer, you can indicate multiple routes to the cluster nodes that are used in different ways:
Example:
[automationcontroller]
controller1 ansible_user=ec2-user ansible_host=10.10.12.11 node_type=hybrid routable_hostname=somehost.somecompany.org
-
controller1is the inventory hostname for the automation controller host. The inventory hostname is what is shown as the instance hostname in the application. This can be useful when preparing for disaster recovery scenarios where you want to use the backup/restore method to restore the cluster to a new set of hosts that have different IP addresses. In this case you can have entries in/etc/hoststhat map these inventory hostnames to IP addresses, and you can use internal IP addresses to mitigate any DNS issues when it comes to resolving public DNS names. -
ansible_host=10.10.12.11indicates how the installer reaches the host, which in this case is an internal IP address. This is not used outside of the installer. -
routable_hostname=somehost.somecompany.orgindicates the hostname that is resolvable for the peers that connect to this node on the receptor mesh. Since it may cross multiple networks, we are using a hostname that will map to an IP address resolvable for the receptor peers.
14.6.7. Web server tuning
Control and Hybrid nodes each serve the UI and API of automation controller. WSGI traffic is served by the uwsgi web server on a local socket. ASGI traffic is served by Daphne. NGINX listens on port 443 and proxies traffic as needed.
To scale automation controller’s web service, follow these best practices:
- Deploy multiple control nodes and use a load balancer to spread web requests over multiple servers.
- Set max connections per automation controller to 100.
To optimize automation controller’s web service on the client side, follow these guidelines:
- Direct user to use dynamic inventory sources instead of individually creating inventory hosts by using the API.
- Use webhook notifications instead of polling for job status.
- Use the bulk APIs for host creation and job launching to batch requests.
- Use token authentication. For automation clients that must make many requests very quickly, using tokens is a best practice, because depending on the type of user, there may be additional overhead when using basic authentication.
Additional resources
- For more information on workloads with high levels of API interaction, see Scaling Automation Controller for API Driven Workloads.
- For more information on bulk API, see Bulk API in Automation Controller.
- For more information on how to generate and use tokens, see Token-Based Authentication.
Chapter 15. Secret handling and connection security
Automation controller handles secrets and connections securely.
15.1. Secret handling
Automation controller manages three sets of secrets:
- User passwords for local automation controller users.
- Secrets for automation controller operational use, such as database password or message bus password.
- Secrets for automation use, such as SSH keys, cloud credentials, or external password vault credentials.
15.1.1. User passwords for local users
Automation controller hashes local automation controller user passwords with the PBKDF2 algorithm using a SHA256 hash. Users who authenticate by external account mechanisms, such as LDAP, SAML, and OAuth, do not have any password or secret stored.
15.1.2. Secret handling for operational use
The operational secrets found in automation controller are as follows:
-
/etc/tower/SECRET_KEY: A secret key used for encrypting automation secrets in the database. If theSECRET_KEYchanges or is unknown, you cannot access encrypted fields in the database. -
/etc/tower/tower.{cert,key}: An SSL certificate and key for the automation controller web service. A self-signed certificate or key is installed by default; you can provide a locally appropriate certificate and key. -
A database password in
/etc/tower/conf.d/postgres.pyand a message bus password in/etc/tower/conf.d/channels.py.
These secrets are stored unencrypted on the automation controller server, because they are all needed to be read by the automation controller service at startup in an automated fashion. All secrets are protected by UNIX permissions, and restricted to root and the automation controller awx service user.
If you need to hide these secrets, the files that these secrets are read from are interpreted by Python. You can adjust these files to retrieve these secrets by some other mechanism anytime a service restarts. This is a customer provided modification that might need to be reapplied after every upgrade. Red Hat Support and Red Hat Consulting have examples of such modifications.
If the secrets system is down, automation controller cannot get the information and can fail in a way that is recoverable once the service is restored. Using some redundancy on that system is highly recommended.
If you believe the SECRET_KEY that automation controller generated for you has been compromised and needs to be regenerated, you can run a tool from the installer that behaves much like the automation controller backup and restore tool.
Ensure that you backup your automation controller database before you generate a new secret key.
To generate a new secret key:
- Follow the procedure described in the Backing up and Restoring section.
Use the inventory from your install (the same inventory with which you run backups and restores), and run the following command:
setup.sh -k.
A backup copy of the previous key is saved in /etc/tower/.
15.1.3. Secret handling for automation use
Automation controller stores a variety of secrets in the database that are either used for automation or are a result of automation.
These secrets include the following:
- All secret fields of all credential types, including passwords, secret keys, authentication tokens, and secret cloud credentials.
- Secret tokens and passwords for external services defined automation controller settings.
- "password" type survey field entries.
To encrypt secret fields, automation controller uses AES in CBC mode with a 256-bit key for encryption, PKCS7 padding, and HMAC using SHA256 for authentication.
The encryption or decryption process derives the AES-256 bit encryption key from the SECRET_KEY, the field name of the model field and the database assigned auto-incremented record ID. Therefore, if any attribute used in the key generation process changes, the automation controller fails to correctly decrypt the secret.
Automation controller is designed so that:
-
The
SECRET_KEYis never readable in playbooks that automation controller launches. - These secrets are never readable by automation controller users.
- No secret field values are ever made available by the automation controller REST API.
If a secret value is used in a playbook, it is recommended that you use no_log on the task so that it is not accidentally logged.
15.2. Connection security
Automation controller allows for connections to internal services, external access, and managed nodes.
15.2.1. Internal services
Automation controller connects to the following services as part of internal operation:
- PostgreSQL database
- The connection to the PostgreSQL database is done by password authentication over TCP, either through localhost or remotely (external database). This connection can use PostgreSQL’s built in support for SSL/TLS, as natively configured by the installer support. SSL/TLS protocols are configured by the default OpenSSL configuration.
- A Redis key or value store
- The connection to Redis is over a local UNIX socket, restricted to the awx service user.
15.2.2. External access
Automation controller is accessed via standard HTTP/HTTPS on standard ports, provided by Nginx. A self-signed certificate or key is installed by default; you can provide a locally appropriate certificate and key. SSL/TLS algorithm support is configured in the /etc/nginx/nginx.conf configuration file. An "intermediate" profile is used by default, that you can configure. You must reapply changes after each update.
15.2.3. Managed nodes
Automation controller connects to managed machines and services as part of automation. All connections to managed machines are done by standard secure mechanisms, such as SSH, WinRM, or SSL/TLS. Each of these inherits configuration from the system configuration for the feature in question, such as the system OpenSSL configuration.
Chapter 16. Security best practices
You can deploy automation controller to automate typical environments securely. However, managing certain operating system environments, automation, and automation platforms, can require additional best practices to ensure security.
To secure Red Hat Enterprise Linux start with the following release-appropriate security guide:
- For Red Hat Enterprise Linux 8, see Security hardening.
- For Red Hat Enterprise Linux 9, see Security hardening.
16.1. Understand the architecture of Ansible Automation Platform and automation controller
Ansible Automation Platform and automation controller comprise a general-purpose, declarative automation platform. That means that once an Ansible playbook is launched (by automation controller, or directly on the command line), the playbook, inventory, and credentials provided to Ansible are considered to be the source of truth. If you want policies around external verification of specific playbook content, job definition, or inventory contents, you must complete these processes before the automation is launched, either by the automation controller web UI, or the automation controller API.
The use of source control, branching, and mandatory code review is best practice for Ansible automation. There are tools that can help create process flow around using source control in this manner.
At a higher level, tools exist that enable creation of approvals and policy-based actions around arbitrary workflows, including automation. These tools can then use Ansible through the automation controller’s API to perform automation.
You must use a secure default administrator password at the time of automation controller installation. For more information, see Change the automation controller Administrator Password.
Automation controller exposes services on certain well-known ports, such as port 80 for HTTP traffic and port 443 for HTTPS traffic. Do not expose automation controller on the open internet, which reduces the threat surface of your installation.
16.1.1. Granting access
Granting access to certain parts of the system exposes security risks. Apply the following practices to help secure access:
16.1.2. Minimize administrative accounts
Minimizing the access to system administrative accounts is crucial for maintaining a secure system. A system administrator or root user can access, edit, and disrupt any system application. Limit the number of people or accounts with root access, where possible. Do not give out sudo to root or awx (the automation controller user) to untrusted users. Note that when restricting administrative access through mechanisms like sudo, restricting to a certain set of commands can still give a wide range of access. Any command that enables execution of a shell or arbitrary shell commands, or any command that can change files on the system, is equal to full root access.
With automation controller, any automation controller "system administrator" or "superuser" account can edit, change, and update an inventory or automation definition in automation controller. Restrict this to the minimum set of users possible for low-level automation controller configuration and disaster recovery only.
16.1.3. Minimize local system access
When you use automation controller with best practices, it does not require local user access except for administrative purposes. Non-administrator users do not have access to the automation controller system.
16.1.4. Remove user access to credentials
If an automation controller credential is only stored in the controller, you can further secure it. You can configure services such as OpenSSH to only permit credentials on connections from specific addresses. Credentials used by automation can be different from credentials used by system administrators for disaster-recovery or other ad hoc management, allowing for easier auditing.
16.1.5. Enforce separation of duties
Different pieces of automation might require access to a system at different levels. For example, you can have low-level system automation that applies patches and performs security baseline checking, while a higher-level piece of automation deploys applications. By using different keys or credentials for each piece of automation, the effect of any one key vulnerability is minimized, while also enabling baseline auditing.
16.2. Available resources
Several resources exist in automation controller and elsewhere to ensure a secure platform. Consider using the following functionalities:
16.2.1. Audit and logging functionality
For any administrative access, it is important to audit and watch for actions. For the system overall, you can do this through the built in audit support and the built-in logging support.
For automation controller, you can do this through the built-in Activity Stream support that logs all changes within automation controller, as well as through the automation logs.
Best practices dictate collecting logging and auditing centrally rather than reviewing it on the local system. You must configure automation controller to use standard IDs or logging and auditing (Splunk) in your environment. automation controller includes built-in logging integrations such as Elastic Stack, Splunk, Sumologic, and Loggly.
Additional resources
For more information, see Logging and Aggregation.
16.2.2. Existing security functionality
Do not disable SELinux or automation controller’s existing multi-tenant containment. Use automation controller’s role-based access control (RBAC) to delegate the minimum level of privileges required to run automation. Use teams in automation controller to assign permissions to groups of users rather than to users individually.
Additional resources
For more information, see Role-Based Access Controls in the Automation controller User Guide.
16.2.3. External account stores
Maintaining a full set of users in automation controller can be a time-consuming task in a large organization. Automation controller supports connecting to external account sources by LDAP, SAML 2.0, and certain OAuth providers. Using this eliminates a source of error when working with permissions.
16.2.4. Django password policies
Automation controller administrators can use Django to set password policies at creation time through AUTH_PASSWORD_VALIDATORS to validate automation controller user passwords. In the custom.py file located at /etc/tower/conf.d of your automation controller instance, add the following code block example:
AUTH_PASSWORD_VALIDATORS = [
    {
        'NAME': 'django.contrib.auth.password_validation.UserAttributeSimilarityValidator',
    },
    {
        'NAME': 'django.contrib.auth.password_validation.MinimumLengthValidator',
        'OPTIONS': {
            'min_length': 9,
        }
    },
    {
        'NAME': 'django.contrib.auth.password_validation.CommonPasswordValidator',
    },
    {
        'NAME': 'django.contrib.auth.password_validation.NumericPasswordValidator',
    },
]
Additional resources
- For more information, see Password validation in Django in addition to the preceding example.
- Ensure that you restart your automation controller instance for the change to take effect. For more information, see Start, stop, and restart automation controller.
Chapter 17. The awx-manage Utility
Use the awx-manage utility to access detailed internal information of automation controller. Commands for awx-manage must run as the awx user only.
17.1. Inventory Import
awx-manage is a mechanism by which an automation controller administrator can import inventory directly into automation controller, for those who cannot use Custom Inventory Scripts.
To use awx-manage properly, you must first create an inventory in automation controller to use as the destination for the import.
For help with awx-manage, run the following command:
awx-manage inventory_import [--help]
The inventory_import command synchronizes an automation controller inventory object with a text-based inventory file, dynamic inventory script, or a directory of one or more, as supported by core Ansible.
When running this command, specify either an --inventory-id or --inventory-name, and the path to the Ansible inventory source (--source).
awx-manage inventory_import --source=/ansible/inventory/ --inventory-id=1
By default, inventory data already stored in automation controller blends with data from the external source.
To use only the external data, specify --overwrite.
To specify that any existing hosts get variable data exclusively from the --source, specify --overwrite_vars.
The default behavior adds any new variables from the external source, overwriting keys that already exist, but preserving any variables that were not sourced from the external data source.
awx-manage inventory_import --source=/ansible/inventory/ --inventory-id=1 --overwrite
Edits and additions to Inventory host variables persist beyond an inventory synchronization as long as --overwrite_vars is not set.
17.2. Cleanup of old data
awx-manage has a variety of commands used to clean old data from automation controller. Automation controller administrators can use the automation controller Management Jobs interface for access or use the command line.
awx-manage cleanup_jobs [--help]
This permanently deletes the job details and job output for jobs older than a specified number of days.
awx-manage cleanup_activitystream [--help]
This permanently deletes any Activity stream data older than a specific number of days.
17.3. Cluster management
For more information on the awx-manage provision_instance and awx-manage deprovision_instance commands, see Clustering.
Do not run other awx-manage commands unless instructed by Ansible Support.
17.4. Token and session management
Automation controller supports the following commands for OAuth2 token management:
17.4.1. create_oauth2_token
Use the following command to create OAuth2 tokens (specify the username for example_user):
$ awx-manage create_oauth2_token --user example_user

New OAuth2 token for example_user: j89ia8OO79te6IAZ97L7E8bMgXCON2
Ensure that you provide a valid user when creating tokens. Otherwise, an error message that you attempted to issue the command without specifying a user, or supplied a username that does not exist, is displayed.
17.4.2. revoke_oauth2_tokens
Use this command to revoke OAuth2 tokens, both application tokens and personal access tokens (PAT). It revokes all application tokens (but not their associated refresh tokens), and revokes all personal access tokens. However, you can also specify a user for whom to revoke all tokens.
To revoke all existing OAuth2 tokens use the following command:
$ awx-manage revoke_oauth2_tokens
To revoke all OAuth2 tokens and their refresh tokens use the following command:
$ awx-manage revoke_oauth2_tokens --revoke_refresh
To revoke all OAuth2 tokens for the user with id=example_user (specify the username for example_user):
$ awx-manage revoke_oauth2_tokens --user example_user
To revoke all OAuth2 tokens and refresh token for the user with id=example_user:
$ awx-manage revoke_oauth2_tokens --user example_user --revoke_refresh
17.4.3. cleartokens
Use this command to clear tokens which have already been revoked.
For more information, see cleartokens in Django’s Oauth Toolkit documentation.
17.4.4. expire_sessions
Use this command to terminate all sessions or all sessions for a specific user.
Consider using this command when a user changes role in an organization, is removed from assorted groups in LDAP/AD, or the administrator wants to ensure the user can no longer execute jobs due to membership in these groups.
$ awx-manage expire_sessions
This command terminates all sessions by default. The users associated with those sessions are logged out. To only expire the sessions of a specific user, you can pass their username using the --user flag (replace example_user with the username in the following example):
$ awx-manage expire_sessions --user example_user
17.4.5. clearsessions
Use this command to delete all sessions that have expired.
For more information, see Clearing the session store in Django’s Oauth Toolkit documentation.
For more information on OAuth2 token management in the UI, see the Applications section of the Automation controller User Guide.
17.5. Analytics gathering
Use this command to gather analytics on-demand outside of the predefined window (the default is 4 hours):
$ awx-manage gather_analytics --ship
For customers with disconnected environments who want to collect usage information about unique hosts automated across a time period, use this command:
awx-manage host_metric --since YYYY-MM-DD --until YYYY-MM-DD --json
The parameters --since and --until specify date ranges and are optional, but one of them has to be present.
The --json flag specifies the output format and is optional.
Chapter 18. Automation controller configuration
You can configure automation controller settings within the Settings screen in the following tabs:
Each tab contains fields with a Reset option, enabling you to revert any value entered back to the default value. Reset All enables you to revert all the values to their factory default values.
Save applies the changes you make, but it does not exit the edit dialog. To return to the Settings page, from the navigation panel select or use the breadcrumbs at the top of the current view.
18.1. Authenticating automation controller
Through the automation controller UI, you can set up a simplified login through various authentication types, such as GitHub, Google, LDAP, RADIUS, and SAML. Once you create and register your developer application with the appropriate service, you can set up authorizations for them.
Procedure
- From the navigation panel, select .
Select from the following Authentication options:
- Azure AD settings
- Github settings
- Google OAuth2 settings
- LDAP Authentication
- RADIUS settings
- TACACS+ settings
Ensure that you include all the required information.
- Click to apply the settings or to abandon the changes.
18.2. Configuring jobs
The Jobs tab enables you to configure the types of modules that can be used by the automation controller’s Ad Hoc Commands feature, set limits on the number of jobs that can be scheduled, define their output size, and other details pertaining to working with jobs in automation controller.
Procedure
- From the navigation panel, select .
Select Jobs settings in the Jobs option. Set the configurable options from the fields provided. Click the tooltip
icon next to the field that you need additional information about.
For more information about configuring Galaxy settings, see the Ansible Galaxy Support section of the Automation controller User Guide.
NoteThe values for all timeouts are in seconds.
- Click to apply the settings and to abandon the changes.
18.3. Configuring system settings
The System tab enables you to complete the following actions:
- Define the base URL for the automation controller host
- Configure alerts
- Enable activity capturing
- Control visibility of users
- Enable certain automation controller features and functionality through a license file
- Configure logging aggregation options
Procedure
- From the navigation panel, select .
Choose from the following System options:
- Miscellaneous System settings: Enable activity streams, specify the default execution environment, define the base URL for the automation controller host, enable automation controller administration alerts, set user visibility, define analytics, specify usernames and passwords, and configure proxies.
- Miscellaneous Authentication settings: Configure options associated with authentication methods (built-in or SSO), sessions (timeout, number of sessions logged in, tokens), and social authentication mapping.
Logging settings: Configure logging options based on the type you choose:

For more information about each of the logging aggregation types, see the Logging and Aggregation section.
Set the configurable options from the fields provided. Click the tooltip
icon next to the field that you need additional information about.
The following is an example of the Miscellaneous System settings:
 Note
NoteThe Allow External Users to Create Oauth2 Tokens setting is disabled by default. This ensures external users cannot create their own tokens. If you enable then disable it, any tokens created by external users in the meantime still exist, and are not automatically revoked.
- Click to apply the settings and to abandon the changes.
18.4. Configuring the user interface
The User Interface tab enables you to set automation controller analytics settings, and configure custom logos and login messages.
Procedure
- From the navigation panel, select .
- Select User Interface settings from the User Interface option.
- Click to configure your preferences.
18.4.1. Configuring usability analytics and data collection
Usability data collection is included with automation controller to collect data to understand how users interact with it, to enhance future releases, and to streamline your user experience.
Only users installing a trial of Red Hat Ansible Automation Platform or a fresh installation of automation controller are opted-in for this data collection.
Automation controller collects user data automatically to help improve the product. You can opt out or control the way automation controller collects data by setting your participation level in the User Interface settings.
Procedure
- From the navigation panel, select .
- Select User Interface settings from the User Interface options.
- Click .
Select the desired level of data collection from the User Analytics Tracking State list:
- Off: Prevents any data collection.
- Anonymous: Enables data collection without your specific user data.
- Detailed: Enables data collection including your specific user data.
- Click to apply the settings or to abandon the changes.
Additional resources
For more information, see the Red Hat Privacy Statement.
18.4.2. Custom logos and images
Automation controller supports the use of a custom logo. You can add a custom logo by uploading an image and supplying a custom login message from the User Interface settings. To access these settings, select from the navigation panel.
For the best results, use a .png file with a transparent background. GIF, PNG, and JPEG formats are supported.
You can add specific information (such as a legal notice or a disclaimer) to a text box in the login modal by adding it to the Custom Login Info text field.
Example
You upload a specific logo and add the following text:
The Ansible Automation Platform login dialog resembles the following:
Select to use the standard automation controller logo.
18.5. Additional settings for automation controller
There are additional advanced settings that can affect automation controller behavior that are not available in the automation controller UI.
For traditional virtual machine based deployments, these settings can be provided to automation controller by creating a file in /etc/tower/conf.d/custom.py. When settings are provided to automation controller through file-based settings, the settings file must be present on all control plane nodes. These include all of the hybrid or control type nodes in the automationcontroller group in the installer inventory.
For these settings to be effective, restart the service with automation-controller-service restart on each node with the settings file. If the settings provided in this file are also visible in the automation controller UI, then they are marked as "Read only" in the UI.
18.6. Obtaining an authorized Ansible automation controller subscription
If you already have a subscription to a Red Hat product, you can acquire an automation controller subscription through that subscription. If you do not have a subscription to Red Hat Ansible Automation Platform and Red Hat Satellite, you can request a trial subscription.
Procedure
- If you have a Red Hat Ansible Automation Platform subscription, use your Red Hat customer credentials when you launch the automation controller to access your subscription information. See Importing a subscription.
If you have a non-Ansible Red Hat or Satellite subscription, access automation controller with one of these methods:
- Enter your username and password on the license page.
- Obtain a subscriptions manifest from the Subscription Allocations page on the Red Hat Customer Portal. For more information, see Obtaining a subscriptions manifest in the Automation controller User Guide.
- If you do not have a Red Hat Ansible Automation Platform subscription, go to Try Red Hat Ansible Automation Platform and request a trial subscription.
Additional resources
To understand what is supported with your subscription, see Automation controller licensing, updates and support. * If you have issues with your subscription, contact your Sales Account Manager or Red Hat Customer Service at: https://access.redhat.com/support/contact/customerService/.
18.6.1. Troubleshooting: Keep your subscription in compliance
Your subscription has two possible statuses:
- Compliant: Indicates that your subscription is appropriate for the number of hosts that you have automated within your subscription count.
- Out of compliance: Indicates that you have exceeded the number of hosts in your subscription.
Compliance is computed as follows:
managed > manifest_limit    =>  non-compliant
managed =< manifest_limit   =>  compliant
Where: managed is the number of unique managed hosts without deletions, and manifest_limit is the number of managed hosts in the subscription manifest.
Other important information displayed are:
- Hosts automated: Host count automated by the job, which consumes the license count.
- Hosts imported: Host count considering unique host names across all inventory sources. This number does not impact hosts remaining.
- Hosts remaining: Total host count minus hosts automated.
- Hosts deleted: Hosts that were deleted, freeing the license capacity.
- Active hosts previously deleted: Number of hosts now active that were previously deleted.
For example, if you have a subscription capacity of 10 hosts:
- Starting with 9 hosts, 2 hosts were added and 3 hosts were deleted, you now have 8 hosts (compliant).
- 3 hosts were automated again, now you have 11 hosts, which puts you over the subscription limit of 10 (non-compliant).
- If you delete hosts, refresh the subscription details to see the change in count and status.
18.6.2. Viewing the host activity
Procedure
In the navigation panel, select to view the activity associated with hosts, such as those that have been automated and deleted.
Each unique hostname is listed and sorted by the user’s preference.
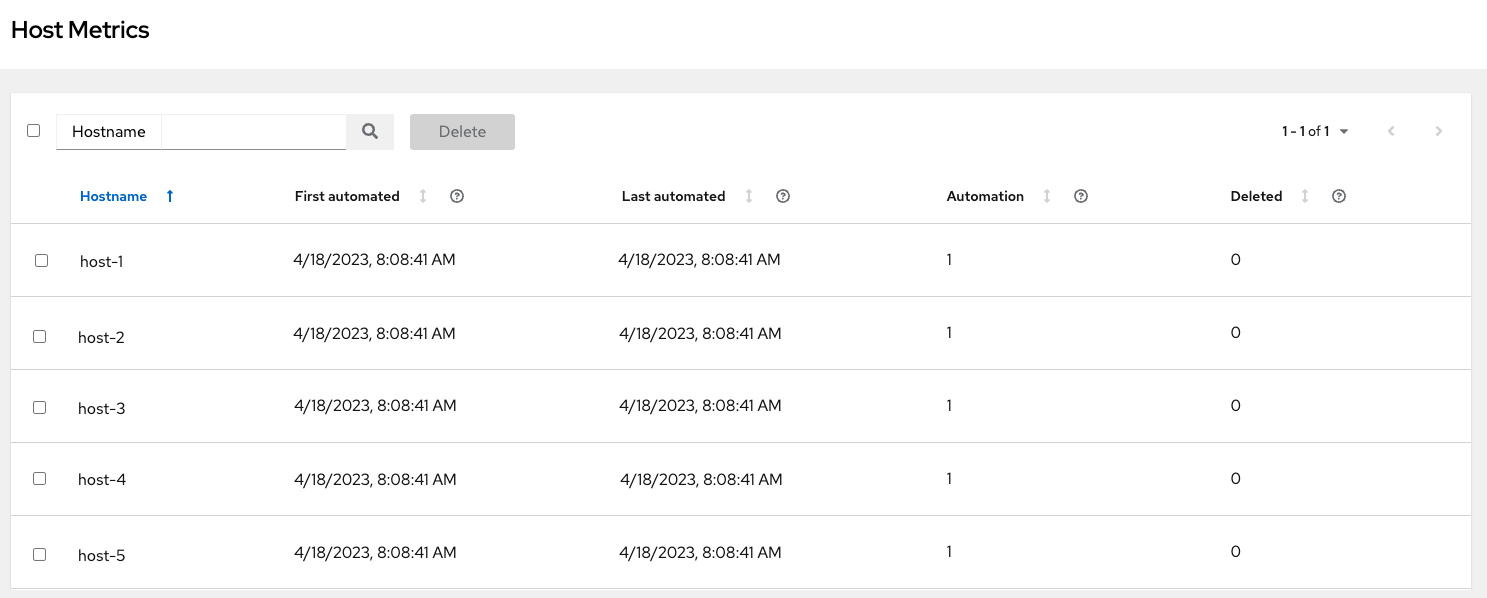 Note
NoteA scheduled task automatically updates these values on a weekly basis and deletes jobs with hosts that were last automated more than a year ago.
Delete unnecessary hosts directly from the Host Metrics view by selecting the desired hosts and clicking .
These are soft-deleted, meaning their records are not removed, but are not being used and thereby not counted towards your subscription.
For more information, see Troubleshooting: Keeping your subscription in compliance in the Automation controller User Guide.
18.6.3. Host metric utilities
Automation controller provides a way to generate a CSV output of the host metric data and host metric summary through the Command Line Interface (CLI). You can also soft delete hosts in bulk through the API.
For more information, see the Host metrics utilities section of the Automation controller User Guide.
Chapter 19. Isolation functionality and variables
Automation controller uses container technology to isolate jobs from each other. By default, only the current project is exposed to the container running a job template.
You might find that you need to customize your playbook runs to expose additional directories.
To fine tune your use of job isolation, there are certain variables that can be set.
By default, automation controller uses the system’s /tmp directory as its staging area. You can change this in the Job Execution Path field on the Jobs settings page, or in the REST API at /api/v2/settings/jobs, using:
AWX_ISOLATION_BASE_PATH = "/opt/tmp"
If there are any additional directories to be exposed from the host to the container that playbooks run in, you can specify those in the Paths to Expose to Isolated Jobs field of the Jobs settings page, or in the REST API at /api/v2/settings/jobs, using:
AWX_ISOLATION_SHOW_PATHS = ['/list/of/', '/paths']
If your playbooks use keys or settings defined in /var/lib/awx/.ssh you must add it to AWX_ISOLATION_SHOW_PATHS.
These fields can be found on the Jobs Settings page.
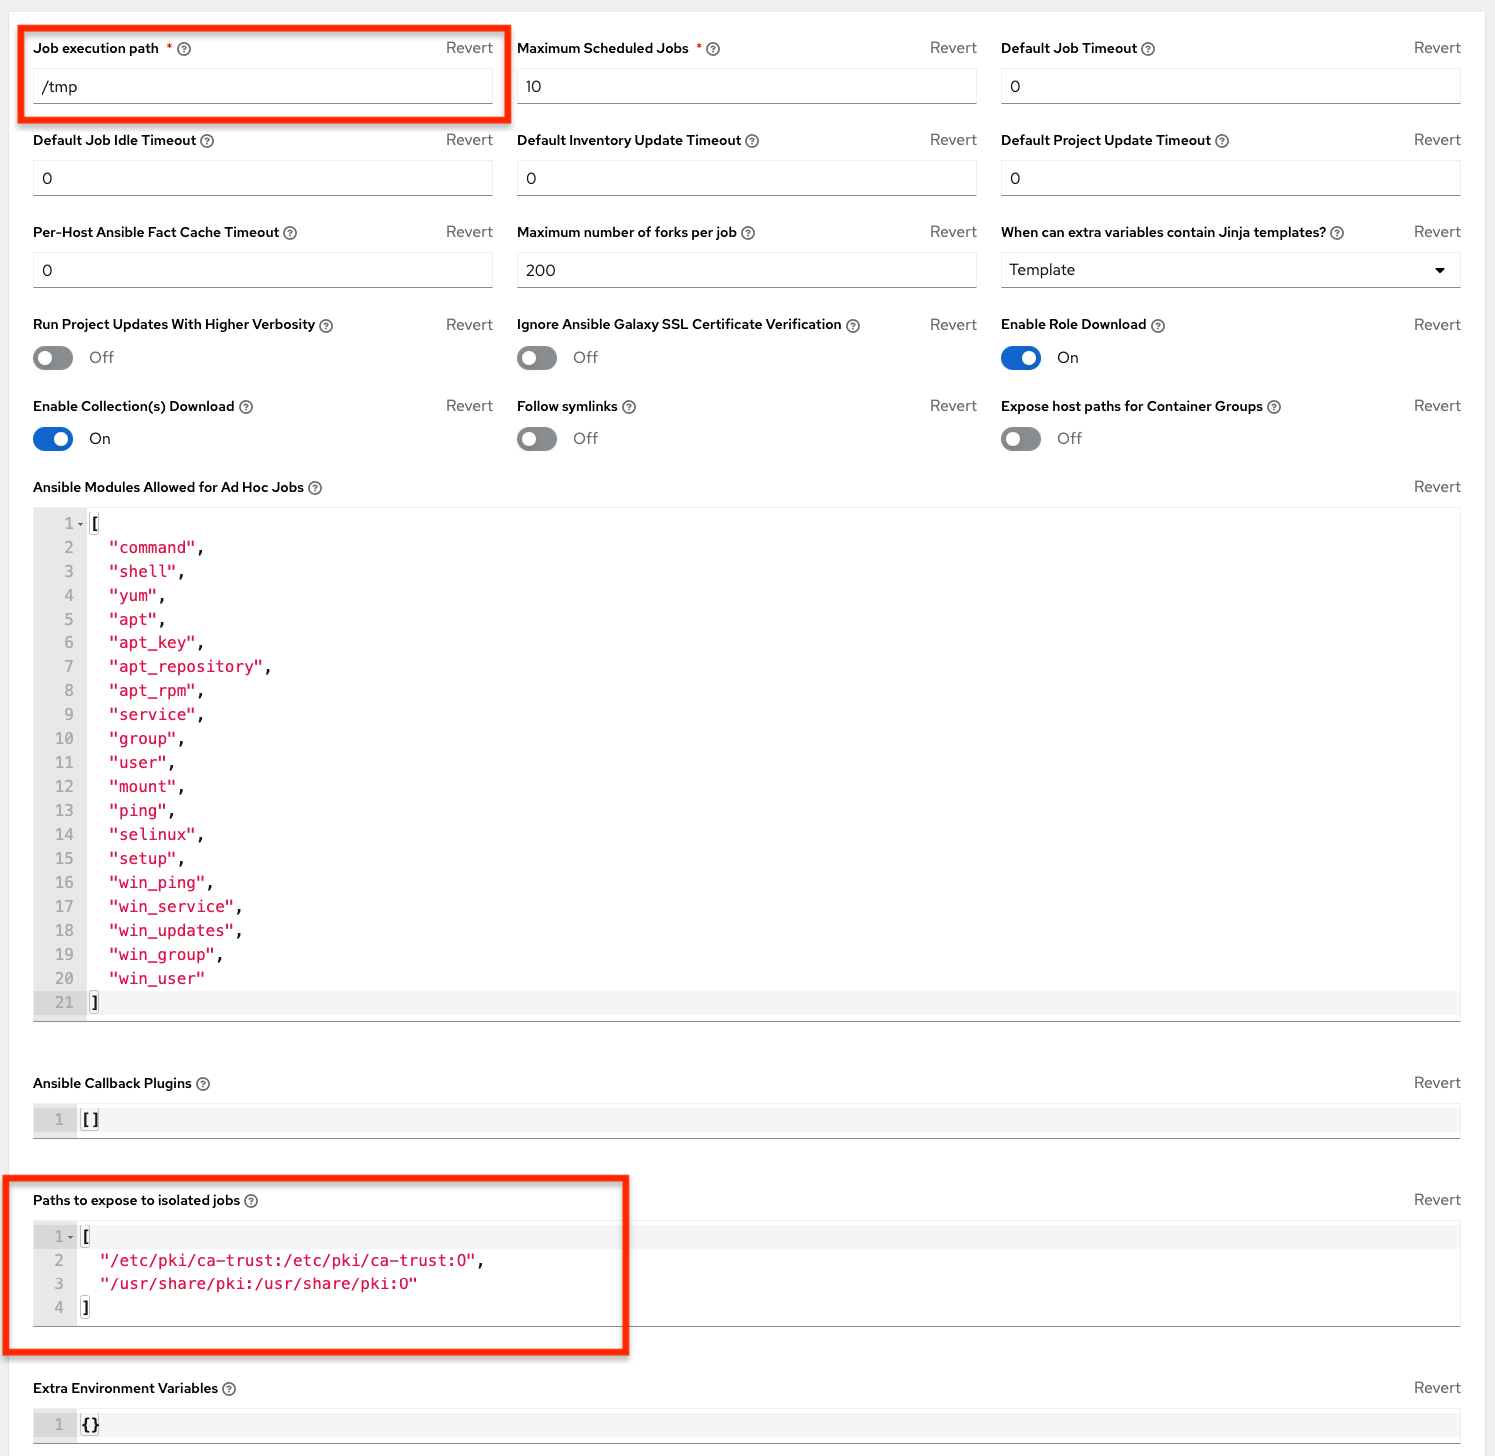
Chapter 20. Token-Based Authentication
OAuth 2 is used for token-based authentication. You can manage OAuth tokens and applications, a server-side representation of API clients used to generate tokens. By including an OAuth token as part of the HTTP authentication header, you can authenticate yourself and adjust the degree of restrictive permissions in addition to the base RBAC permissions.
For more information on the OAuth2 specification, see The OAuth 2.0 Authorization Framework.
For more information on using the manage utility to create tokens, see Token and session management.
20.1. Managing OAuth 2 Applications and Tokens
Applications and tokens can be managed as a top-level resource at /api/<version>/applications and /api/<version>/tokens. These resources can also be accessed respective to the user at /api/<version>/users/N/<resource>. You can create applications by making a POST to either api/<version>/applications or /api/<version>/users/N/applications.
Each OAuth 2 application represents a specific API client on the server side. For an API client to use the API via an application token, it must first have an application and issue an access token. Individual applications are accessible through their primary keys in: /api/<version>/applications/<pk>/.
The following is a typical application:
{
    "id": 1,
    "type": "o_auth2_application",
    "url": "/api/v2/applications/2/",
    "related": {
        "tokens": "/api/v2/applications/2/tokens/"
    },
    "summary_fields": {
        "organization": {
            "id": 1,
            "name": "Default",
            "description": ""
        },
        "user_capabilities": {
            "edit": true,
            "delete": true
        },
        "tokens": {
            "count": 0,
            "results": []
        }
    },
    "created": "2018-07-02T21:16:45.824400Z",
    "modified": "2018-07-02T21:16:45.824514Z",
    "name": "My Application",
    "description": "",
    "client_id": "Ecmc6RjjhKUOWJzDYEP8TZ35P3dvsKt0AKdIjgHV",
    "client_secret": "7Ft7ym8MpE54yWGUNvxxg6KqGwPFsyhYn9QQfYHlgBxai74Qp1GE4zsvJduOfSFkTfWFnPzYpxqcRsy1KacD0HH0vOAQUDJDCidByMiUIH4YQKtGFM1zE1dACYbpN44E",
    "client_type": "confidential",
    "redirect_uris": "",
    "authorization_grant_type": "password",
    "skip_authorization": false,
    "organization": 1
}
Where name is the human-readable identifier of the application. The rest of the fields, like client_id and redirect_uris, are mainly used for OAuth2 authorization, which is covered in Using OAuth 2 Token System for Personal Access Tokens (PAT).
The values for the client_id and client_secret fields are generated during creation and are non-editable identifiers of applications, while organization and authorization_grant_type are required upon creation and become non-editable.
20.1.1. Access Rules for Applications
Access rules for applications are as follows:
- System administrators can view and manipulate all applications in the system.
- Organization administrators can view and manipulate all applications belonging to Organization members.
- Other users can only view, update, and delete their own applications, but cannot create any new applications.
Tokens, on the other hand, are resources used to authenticate incoming requests and mask the permissions of the underlying user.
There are two ways to create a token:
-
POST to the
/api/v2/tokens/endpoint and set theapplicationandscopefields to point to the related application and specify the token scope. -
POST to the
/api/v2/applications/<pk>/tokens/endpoint with thescopefield (the parent application is automatically linked).
Individual tokens are accessible through their primary keys at /api/<version>/tokens/<pk>/.
The following is an example of a typical token:
{
    "id": 4,
    "type": "o_auth2_access_token",
    "url": "/api/v2/tokens/4/",
    "related": {
        "user": "/api/v2/users/1/",
        "application": "/api/v2/applications/1/",
        "activity_stream": "/api/v2/tokens/4/activity_stream/"
},
    "summary_fields": {
        "application": {
            "id": 1,
            "name": "Default application for root",
            "client_id": "mcU5J5uGQcEQMgAZyr5JUnM3BqBJpgbgL9fLOVch"
        },
        "user": {
            "id": 1,
            "username": "root",
            "first_name": "",
            "last_name": ""
        }
    },
    "created": "2018-02-23T14:39:32.618932Z",
    "modified": "2018-02-23T14:39:32.643626Z",
    "description": "App Token Test",
    "user": 1,
    "token": "*************",
    "refresh_token": "*************",
    "application": 1,
    "expires": "2018-02-24T00:39:32.618279Z",
    "scope": "read"
},
For an OAuth 2 token, the only fully editable fields are scope and description. The application field is non-editable on update, and all other fields are entirely non-editable, and are auto-populated during creation, as follows:
-
userfield corresponds to the user the token is created for, and in this case, is also the user creating the token. -
expiresis generated according to the automation controller configuration settingOAUTH2_PROVIDER. -
tokenandrefresh_tokenare auto-generated to be non-clashing random strings.
Both application tokens and personal access tokens are shown at the /api/v2/tokens/ endpoint. The application field in the personal access tokens is always null. This is a good way to differentiate the two types of tokens.
20.1.2. Access rules for tokens
Access rules for tokens are as follows:
- Users can create a token if they are able to view the related application and can also create a personal token for themselves.
- System administrators are able to view and manipulate every token in the system.
- Organization administrators are able to view and manipulate all tokens belonging to Organization members.
- System Auditors can view all tokens and applications.
- Other normal users are only able to view and manipulate their own tokens.
Users can only view the token or refresh the token value at the time of creation.
20.2. Using OAuth 2 Token System for Personal Access Tokens
The easiest and most common way to obtain an OAuth 2 token is to create a personal access token (PAT) at the /api/v2/users/<userid>/personal_tokens/ endpoint, as shown in the following example:
curl -XPOST -k -H "Content-type: application/json" -d '{"description":"Personal controller CLI token", "application":null, "scope":"write"}' https://<USERNAME>:<PASSWORD>@<CONTROLLER_SERVER>/api/v2/users/<USER_ID>/personal_tokens/ | python -m json.tool
You could also pipe the JSON output through jq, if installed.
The following is an example of using the PAT to access an API endpoint using curl:
curl -k -H "Authorization: Bearer <token>" -H "Content-Type: application/json" -X POST -d '{}' https://controller/api/v2/job_templates/5/launch/In automation controller, the OAuth 2 system is built on top of the Django Oauth Toolkit, which provides dedicated endpoints for authorizing, revoking, and refreshing tokens.
These endpoints can be found under the /api/v2/users/<USER_ID>/personal_tokens/ endpoint, which also provides examples on typical use of those endpoints. These special OAuth 2 endpoints only support use of the x-www-form-urlencoded Content-type, so none of the api/o/* endpoints accept application/json.
You can also request tokens using the /api/o/token endpoint by specifying null for the application type.
Alternatively, see Adding tokens for users through the UI, and configuring the expiration of an access token and its associated refresh token (if applicable).
20.2.1. Token scope mask over RBAC system
The scope of an OAuth 2 token is a space-separated string composed of valid scope keywords, "read" and "write". These keywords are configurable and used to specify permission level of the authenticated API client. Read and write scopes provide a mask layer over the Role-Based Access Control (RBAC) permission system of automation controller. A "write" scope gives the authenticated user the full permissions the RBAC system provides, while a "read" scope gives the authenticated user only the read permissions the RBAC system provides. Note that "write" implies "read" as well.
For example, if you have administrative permissions to a job template, you can view, modify, launch, and delete the job template if authenticated through session or basic authentication.
In contrast, if you are authenticated using an OAuth 2 token, and the related token scope is "read", you can only view, but not manipulate or launch the job template, despite being an administrator.
If the token scope is "write" or "read write", you can take full advantage of the job template as its administrator.
To acquire and use a token, first you must create an application token.
Procedure
-
Make an application with
authorization_grant_typeset topassword. HTTP POST the following to the
/api/v2/applications/endpoint (supplying your own organization ID):{ "name": "Admin Internal Application", "description": "For use by secure services & clients. ", "client_type": "confidential", "redirect_uris": "", "authorization_grant_type": "password", "skip_authorization": false, "organization": <organization-id> }Make a token and POST to the
/api/v2/tokens/endpoint, using:{ "description": "My Access Token", "application": <application-id>, "scope": "write" }This returns a <token-value> that you can use to authenticate with for future requests (this is not shown again).
- Use the token to access a resource. The following uses curl as an example:
curl -H "Authorization: Bearer <token-value>" -H "Content-Type: application/json" -X GET https://<controller>/api/v2/users/
The -k flag might be required if you have not set up a Certificate Authority yet and are using SSL.
To revoke a token, you can use DELETE on the Details page for that token, using that token’s ID.
For example:
curl -ku <user>:<password> -X DELETE https://<controller>/api/v2/tokens/<pk>/
Similarly, using a token:
curl -H "Authorization: Bearer <token-value>" -X DELETE https://<controller>/api/v2/tokens/<pk>/ -k
20.3. Application Functions
Several OAuth 2 utility endpoints are used for authorization, token refresh, and revoke. The /api/o/ endpoints are not meant to be used in browsers and do not support HTTP GET. The endpoints prescribed here strictly follow RFC specifications for OAuth 2, so use that for detailed reference.
The following are examples of the typical use of these endpoints in automation controller, in particular, when creating an application using various grant types:
20.3.1. Application using authorization code grant type
The application authorization code grant type should be used when access tokens must be issued directly to an external application or service.
You can only use the authorization code type to acquire an access token when using an application. When integrating an external web application with automation controller, that web application might need to create OAuth2 Tokens on behalf of users in that other web application. Creating an application in automation controller with the authorization code grant type is the preferred way to do this because:
- This allows an external application to obtain a token from automation controller for a user, using their credentials.
- Compartmentalized tokens issued for a particular application enables those tokens to be easily managed. For example, revoking all tokens associated with that application without having to revoke all tokens in the system.
Example
To create an application named AuthCodeApp with the authorization-code grant type, perform a POST to the /api/v2/applications/ endpoint:
{
    "name": "AuthCodeApp",
    "user": 1,
    "client_type": "confidential",
    "redirect_uris": "http://<controller>/api/v2",
    "authorization_grant_type": "authorization-code",
    "skip_authorization": false
}

.. _`Django-oauth-toolkit simple test application`: http://django-oauth-toolkit.herokuapp.com/consumer/
The workflow that occurs when you issue a GET to the authorize endpoint from the client application with the response_type, client_id, redirect_uris, and scope:
-
Automation controller responds with the authorization code and status to the
redirect_urispecified in the application. -
The client application then makes a POST to the
api/o/token/endpoint on automation controller with thecode,client_id,client_secret,grant_type, andredirect_uri. -
Automation controller responds with the
access_token,token_type,refresh_token, andexpires_in.
For more information, and to test this flow, see Test Your Authorization Server in the Django OAuth Toolkit.
You can specify the number of seconds an authorization code remains valid on the System settings page:
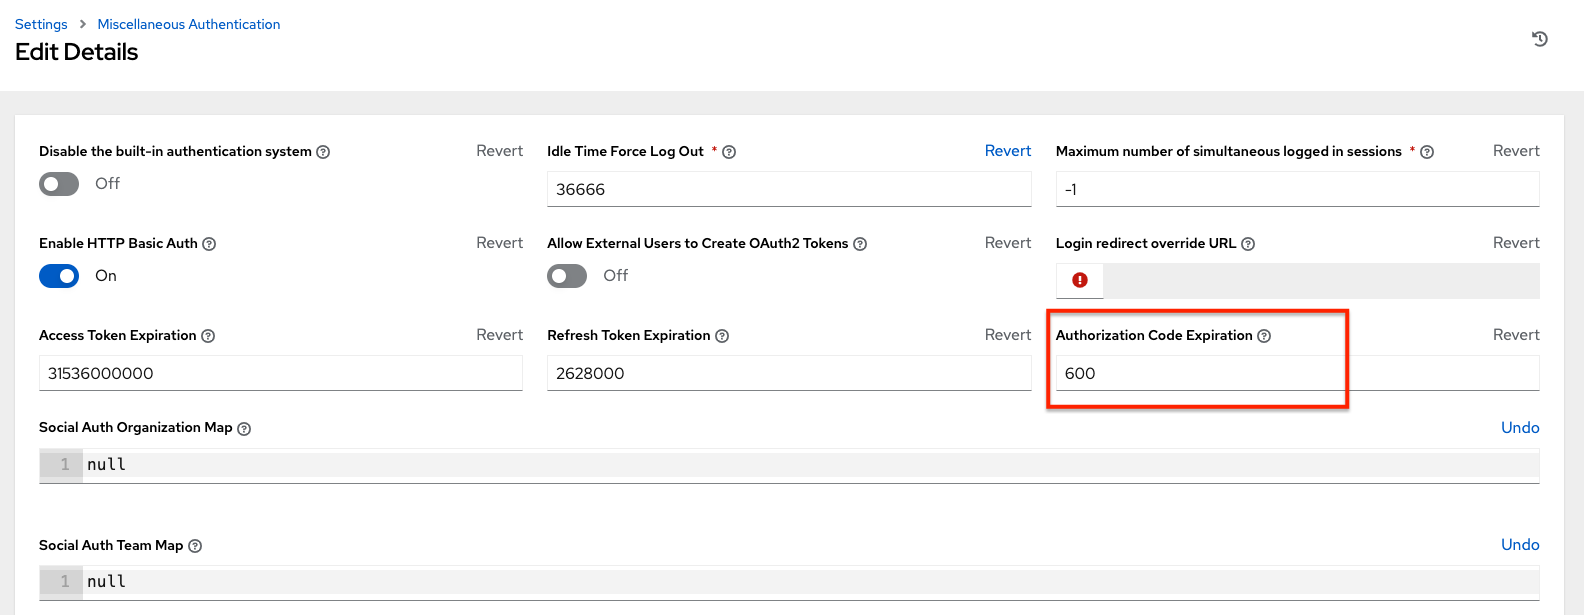
Requesting an access token after this duration fails.
The duration defaults to 600 seconds (10 minutes), based on the RFC6749 recommendation.
The best way to set up application integrations using the Authorization Code grant type is to allowlist the origins for those cross-site requests. More generally, you must allowlist the service or application you are integrating with automation controller, for which you want to provide access tokens.
To do this, have your Administrator add this allowlist to their local automation controller settings in /etc/tower/conf.d/custom.py:
CORS_ORIGIN_ALLOW_ALL = True
CORS_ALLOWED_ORIGIN_REGEXES = [
    r"http://django-oauth-toolkit.herokuapp.com*",
    r"http://www.example.com*"
]
Where http://django-oauth-toolkit.herokuapp.com and http://www.example.com are applications requiring tokens with which to access automation controller.
20.3.2. Application using password grant type
The password grant type or Resource owner password-based grant type is ideal for users who have native access to the web application and must be used when the client is the Resource owner. The following supposes an application, "Default Application" with grant type password:
{
    "id": 6,
    "type": "application",
    ...
    "name": "Default Application",
    "user": 1,
    "client_id": "gwSPoasWSdNkMDtBN3Hu2WYQpPWCO9SwUEsKK22l",
    "client_secret": "fI6ZpfocHYBGfm1tP92r0yIgCyfRdDQt0Tos9L8a4fNsJjQQMwp9569eIaUBsaVDgt2eiwOGe0bg5m5vCSstClZmtdy359RVx2rQK5YlIWyPlrolpt2LEpVeKXWaiybo",
    "client_type": "confidential",
    "redirect_uris": "",
    "authorization_grant_type": "password",
    "skip_authorization": false
}
Logging in is not required for password grant type, so you can use curl to acquire a personal access token through the /api/v2/tokens/ endpoint:
curl -k --user <user>:<password> -H "Content-type: application/json" \
-X POST \
--data '{
    "description": "Token for Nagios Monitoring app",
    "application": 1,
    "scope": "write"
}' \
https://<controller>/api/v2/tokens/
The special OAuth 2 endpoints only support using the x-www-form-urlencoded Content-type, so as a result, none of the api/o/* endpoints accept application/json.
Upon success, a response displays in JSON format containing the access token, refresh token, and other information:
HTTP/1.1 200 OK
Server: nginx/1.12.2
Date: Tue, 05 Dec 2017 16:48:09 GMT
Content-Type: application/json
Content-Length: 163
Connection: keep-alive
Content-Language: en
Vary: Accept-Language, Cookie
Pragma: no-cache
Cache-Control: no-store
Strict-Transport-Security: max-age=15768000

{"access_token": "9epHOqHhnXUcgYK8QanOmUQPSgX92g", "token_type": "Bearer", "expires_in": 315360000000, "refresh_token": "jMRX6QvzOTf046KHee3TU5mT3nyXsz", "scope": "read"}
20.4. Application Token Functions
The refresh and revoke functions associated with tokens, for tokens at the /api/o/ endpoints can currently only be carried out with application tokens.
20.4.1. Refresh an existing access token
The following example shows an existing access token with a refresh token provided:
{
    "id": 35,
    "type": "access_token",
    ...
    "user": 1,
    "token": "omMFLk7UKpB36WN2Qma9H3gbwEBSOc",
    "refresh_token": "AL0NK9TTpv0qp54dGbC4VUZtsZ9r8z",
    "application": 6,
    "expires": "2017-12-06T03:46:17.087022Z",
    "scope": "read write"
}
The /api/o/token/ endpoint is used for refreshing the access token:
curl -X POST \
    -d "grant_type=refresh_token&refresh_token=AL0NK9TTpv0qp54dGbC4VUZtsZ9r8z" \
    -u "gwSPoasWSdNkMDtBN3Hu2WYQpPWCO9SwUEsKK22l:fI6ZpfocHYBGfm1tP92r0yIgCyfRdDQt0Tos9L8a4fNsJjQQMwp9569eIaUBsaVDgt2eiwOGe0bg5m5vCSstClZmtdy359RVx2rQK5YlIWyPlrolpt2LEpVeKXWaiybo" \
    http://<controller>/api/o/token/ -i
Where refresh_token is provided by refresh_token field of the preceding access token.
The authentication information is of format <client_id>:<client_secret>, where client_id and client_secret are the corresponding fields of the underlying related application of the access token.
The special OAuth 2 endpoints only support using the x-www-form-urlencoded Content-type, so as a result, none of the api/o/* endpoints accept application/json.
On success, a response displays in JSON format containing the new (refreshed) access token with the same scope information as the previous one:
HTTP/1.1 200 OK
Server: nginx/1.12.2
Date: Tue, 05 Dec 2017 17:54:06 GMT
Content-Type: application/json
Content-Length: 169
Connection: keep-alive
Content-Language: en
Vary: Accept-Language, Cookie
Pragma: no-cache
Cache-Control: no-store
Strict-Transport-Security: max-age=15768000

{"access_token": "NDInWxGJI4iZgqpsreujjbvzCfJqgR", "token_type": "Bearer", "expires_in": 315360000000, "refresh_token": "DqOrmz8bx3srlHkZNKmDpqA86bnQkT", "scope": "read write"}
The refresh operation replaces the existing token by deleting the original and then immediately creating a new token with the same scope and related application as the original one.
Verify that the new token is present and the old one is deleted in the /api/v2/tokens/ endpoint.
20.4.2. Revoke an access token
You can revoke an access token by using the /api/o/revoke-token/ endpoint.
Revoking an access token by this method is the same as deleting the token resource object, but it enables you to delete a token by providing its token value, and the associated client_id (and client_secret if the application is confidential). For example:
curl -X POST -d "token=rQONsve372fQwuc2pn76k3IHDCYpi7" \
-u "gwSPoasWSdNkMDtBN3Hu2WYQpPWCO9SwUEsKK22l:fI6ZpfocHYBGfm1tP92r0yIgCyfRdDQt0Tos9L8a4fNsJjQQMwp9569eIaUBsaVDgt2eiwOGe0bg5m5vCSstClZmtdy359RVx2rQK5YlIWyPlrolpt2LEpVeKXWaiybo" \
http://<controller>/api/o/revoke_token/ -i
-
The special OAuth 2 endpoints only support using the
x-www-form-urlencodedContent-type, so as a result, none of theapi/o/*endpoints acceptapplication/json. -
The Allow External Users to Create Oauth2 Tokens (
ALLOW_OAUTH2_FOR_EXTERNAL_USERSin the API) setting is disabled by default. External users refer to users authenticated externally with a service such as LDAP, or any of the other SSO services. This setting ensures external users cannot create their own tokens. If you enable then disable it, any tokens created by external users in the meantime will still exist, and are not automatically revoked.
Alternatively, to revoke OAuth2 tokens, you can use the manage utility, see Revoke oauth2 tokens.
This setting can be configured at the system-level in the UI:
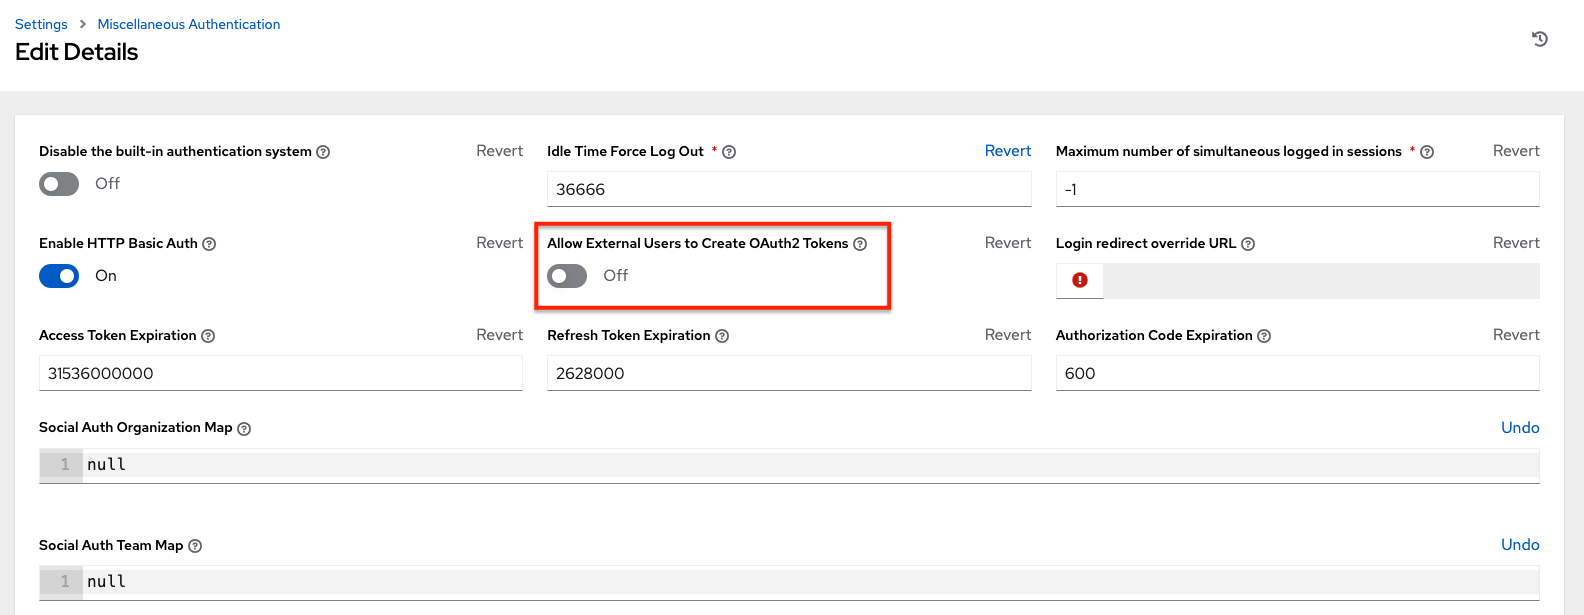
On success, a response of 200 OK is displayed. Verify the deletion by checking whether the token is present in the /api/v2/tokens/ endpoint.
Chapter 21. Setting up social authentication
Authentication methods simplify logins for end users, offering single sign-ons by using existing login information to sign in to a third party website rather than creating a new login account specifically for that website.
You can configure account authentication in the User Interface and save it to the PostgreSQL database.
You can configure account authentication in automation controller to centrally use OAuth2, while you can configure enterprise-level account authentication for SAML, RADIUS, or even LDAP as a source for authentication information.
For websites, such as Microsoft Azure, Google, or GitHub, which give account information, account information is often implemented by using the OAuth standard.
OAuth is a secure authorization protocol. It is commonly used in conjunction with account authentication to grant third party applications a "session token" allowing them to make API calls to providers on the user’s behalf.
Security Assertion Markup Language (SAML) is an XML-based, open-standard data format for exchanging account authentication and authorization data between an identity provider and a service provider.
The RADIUS distributed client/server system enables you to secure networks against unauthorized access. You can implement this in network environments requiring high levels of security while maintaining network access for remote users.
Additional resources
For more information, see the Automation controller configuration section.
21.1. GitHub settings
To set up social authentication for GitHub, you must obtain an OAuth2 key and secret for a web application. To do this, you must first register the new application with GitHub at https://github.com/settings/developers.
To register the application, you must supply it with your homepage URL, which is the Callback URL shown in the Details tab of the GitHub default settings page. The OAuth2 key (Client ID) and secret (Client Secret) are used to supply the required fields in the UI.
Procedure
- From the navigation panel, select .
- On the Settings page, select GitHub settings from the list of Authentication options.
Select the GitHub Default tab if not already selected.
The GitHub OAuth2 Callback URL field is already pre-populated and non-editable. When the application is registered, GitHub displays the Client ID and Client Secret.
- Click and copy and paste the GitHub Client ID into the GitHub OAuth2 Key field.
- Copy and paste the GitHub Client Secret into the GitHub OAuth2 Secret field.
- For more information on completing the mapping fields, see Organization mapping and Team mapping.
- Click .
Verification
To verify that the authentication was configured correctly, logout of automation controller. The login screen now displays the GitHub logo to enable logging in with those credentials.
![]()
21.1.1. GitHub Organization settings
When defining account authentication with either an organization or a team within an organization, you should use the specific organization and team settings. Account authentication can be limited by an organization and by a team within an organization.
You can also choose to permit all by specifying non-organization or non-team based settings.
You can limit users who can login to the controller by limiting only those in an organization or on a team within an organization.
To set up social authentication for a GitHub Organization, you must obtain an OAuth2 key and secret for a web application. To do this, you must first register your organization-owned application at https://github.com/organizations/<yourorg>/settings/applications.
To register the application, you must supply it with your Authorization callback URL, which is the Callback URL shown in the Details page. Each key and secret must belong to a unique application and cannot be shared or reused between different authentication backends. The OAuth2 key (Client ID) and secret (Client Secret) are used to supply the required fields in the UI.
Procedure
- From the navigation panel, select .
- On the Settings page, select GitHub settings from the list of Authentication options.
Select the GitHub Organization tab.
The GitHub Organization OAuth2 Callback URL field is already pre-populated and non-editable.
When the application is registered, GitHub displays the Client ID and Client Secret.
- Click and copy and paste GitHub’s Client ID into the GitHub Organization OAuth2 Key field.
- Copy and paste GitHub’s Client Secret into the GitHub Organization OAuth2 Secret field.
- Enter the name of your GitHub organization, as used in your organization’s URL, for example, https://github.com/<yourorg>/ in the GitHub Organization Name field.
- For more information on completing the mapping fields, see Organization mapping and Team mapping.
- Click .
Verification
To verify that the authentication was configured correctly, logout of automation controller. The login screen displays the GitHub Organization logo to enable logging in with those credentials.
![]()
21.1.2. GitHub Team settings
To set up social authentication for a GitHub Team, you must obtain an OAuth2 key and secret for a web application. To do this, you must first register your team-owned application at https://github.com/organizations/<yourorg>/settings/applications. To register the application, you must supply it with your Authorization callback URL, which is the Callback URL shown in the Details page. Each key and secret must belong to a unique application and cannot be shared or reused between different authentication backends. The OAuth2 key (Client ID) and secret (Client Secret) are used to supply the required fields in the UI.
Procedure
- Find the numeric team ID using the GitHub API. The Team ID is used to supply a required field in the UI.
- From the navigation panel, select .
- On the Settings page, select GitHub settings from the list of Authentication options.
Click the GitHub Team tab.
The GitHub Team OAuth2 Callback URL field is already pre-populated and non-editable. When the application is registered, GitHub displays the Client ID and Client Secret.
- Click and copy and paste GitHub’s Client ID into the GitHub Team OAuth2 Key field.
- Copy and paste GitHub’s Client Secret into the GitHub Team OAuth2 Secret field.
- Copy and paste GitHub’s team ID in the GitHub Team ID field.
- For more information on completing the mapping fields, see Organization mapping and Team mapping.
- Click
Verification
To verify that the authentication was configured correctly, logout of automation controller. The login screen displays the GitHub Team logo to enable logging in with those credentials.
![]()
21.1.3. GitHub Enterprise settings
To set up social authentication for a GitHub Enterprise, you must obtain a GitHub Enterprise URL, an API URL, OAuth2 key and secret for a web application.
To obtain the URLs, refer to the GitHub Enterprise administration documentation.
To obtain the key and secret, you must first register your enterprise-owned application at https://github.com/organizations/<yourorg>/settings/applications.
To register the application, you must supply it with your Authorization callback URL, which is the Callback URL shown in the Details page. Because it is hosted on site and not github.com, you must specify which authentication adapter it communicates with.
Each key and secret must belong to a unique application and cannot be shared or reused between different authentication backends. The OAuth2 key (Client ID) and secret (Client Secret) are used to supply the required fields in the UI.
Procedure
- From the navigation panel, select .
- On the Settings page, select GitHub settings from the list of Authentication options.
Click the GitHub Enterprise tab.
The GitHub Enterprise OAuth2 Callback URL field is already pre-populated and non-editable. When the application is registered, GitHub displays the Client ID and Client Secret.
- Click to configure GitHub Enterprise settings.
- In the GitHub Enterprise URL field, enter the hostname of the GitHub Enterprise instance, for example, https://github.example.com.
- In the GitHub Enterprise API URL field, enter the API URL of the GitHub Enterprise instance, for example, https://github.example.com/api/v3.
- Copy and paste GitHub’s Client ID into the GitHub Enterprise OAuth2 Key field.
- Copy and paste GitHub’s Client Secret into the GitHub Enterprise OAuth2 Secret field.
- For more information on completing the mapping fields, see Organization mapping and Team mapping.
- Click .
Verification
To verify that the authentication was configured correctly, logout of automation controller. The login screen displays the GitHub Enterprise logo to enable logging in with those credentials.
![]()
21.1.4. GitHub Enterprise Organization settings
To set up social authentication for a GitHub Enterprise Organization, you must obtain a GitHub Enterprise Organization URL, an Organization API URL, an Organization OAuth2 key and secret for a web application.
To obtain the URLs, refer to the GitHub documentation on GitHub Enterprise administration.
To obtain the key and secret, you must first register your enterprise organization-owned application at https://github.com/organizations/<yourorg>/settings/applications
To register the application, you must supply it with your Authorization callback URL, which is the Callback URL shown in the Details page.
Because it is hosted on site and not github.com, you must specify which authentication adapter it communicates with.
Each key and secret must belong to a unique application and cannot be shared or reused between different authentication backends. The OAuth2 key (Client ID) and secret (Client Secret) are used to supply the required fields in the UI.
Procedure
- From the navigation panel, select .
- On the Settings page, select GitHub settings from the list of Authentication options.
Click the GitHub Enterprise Organization tab.
The GitHub Enterprise Organization OAuth2 Callback URL field is already pre-populated and non-editable. When the application is registered, GitHub displays the Client ID and Client Secret.
- Click to configure GitHub Enterprise Organization settings.
- In the GitHub Enterprise Organization URL field, enter the hostname of the GitHub Enterprise Organization instance, for example, https://github.orgexample.com.
- In the GitHub Enterprise Organization API URL field, enter the API URL of the GitHub Enterprise Organization instance, for example, https://github.orgexample.com/api/v3.
- Copy and paste GitHub’s Client ID into the GitHub Enterprise Organization OAuth2 Key field.
- Copy and paste GitHub’s Client Secret into the GitHub Enterprise Organization OAuth2 Secret field.
- Enter the name of your GitHub Enterprise organization, as used in your organization’s URL, for example, https://github.com/<yourorg>/ in the GitHub Enterprise Organization Name field.
- For more information on completing the mapping fields, see Organization mapping and Team mapping.
- Click .
Verification
To verify that the authentication was configured correctly, logout of automation controller. The login screen displays the GitHub Enterprise Organization logo to enable logging in with those credentials.
![]()
21.1.5. GitHub Enterprise Team settings
To set up social authentication for a GitHub Enterprise team, you must obtain a GitHub Enterprise Organization URL, an Organization API URL, an Organization OAuth2 key and secret for a web application.
To obtain the URLs, refer to the GitHub documentation on GitHub Enterprise administration.
To obtain the key and secret, you must first register your enterprise team-owned application at https://github.com/organizations/<yourorg>/settings/applications.
To register the application, you must supply it with your Authorization callback URL, which is the Callback URL shown in the Details page. Because it is hosted on site and not github.com, you must specify which authentication adapter it communicates with.
Each key and secret must belong to a unique application and cannot be shared or reused between different authentication backends. The OAuth2key (Client ID) and secret (Client Secret) are used to supply the required fields in the UI.
Procedure
- Find the numeric team ID using the GitHub API. The Team ID will be used to supply a required field in the UI.
- From the navigation panel, select .
- On the Settings page, select GitHub settings from the list of Authentication options.
Click the GitHub Enterprise Team tab.
The GitHub Enterprise Team OAuth2 Callback URL field is already pre-populated and non-editable. When the application is registered, GitHub displays the Client ID and Client Secret.
- Click to configure GitHub Enterprise Team settings.
- In the GitHub Enterprise Team URL field, enter the hostname of the GitHub Enterprise team instance, for example, https://github.teamexample.com.
- In the GitHub Enterprise Team API URL field, enter the API URL of the GitHub Enterprise team instance, for example, https://github.teamexample.com/api/v3.
- Copy and paste GitHub’s Client ID into the GitHub Enterprise Team OAuth2 Key field.
- Copy and paste GitHub’s Client Secret into the GitHub Enterprise Team OAuth2 Secret field.
- Copy and paste GitHub’s team ID in the GitHub Enterprise Team ID field.
- For more information on completing the mapping fields, see Organization mapping and Team mapping.
- Click .
Verification
To verify that the authentication was configured correctly, logout of automation controller. The login screen displays the GitHub Enterprise Teams logo to enable logging in with those credentials.
![]()
21.2. Google OAuth2 settings
To set up social authentication for Google, you must obtain an OAuth2 key and secret for a web application. To do this, you must first create a project and set it up with Google.
For instructions, see Setting up OAuth 2.0 in the Google API Console Help documentation.
If you have already completed the setup process, you can access those credentials by going to the Credentials section of the Google API Manager Console. The OAuth2 key (Client ID) and secret (Client secret) are used to supply the required fields in the UI.
Procedure
- From the navigation panel, select .
On the Settings page, select Google OAuth 2 settings from the list of Authentication options.
The Google OAuth2 Callback URL field is already pre-populated and non-editable.
The following fields are also pre-populated. If not, use the credentials Google supplied during the web application setup process, and look for the values with the same format as the ones shown in the example below:
- Click Edit and copy and paste Google’s Client ID into the Google OAuth2 Key field.
Copy and paste Google’s Client secret into the Google OAuth2 Secret field.
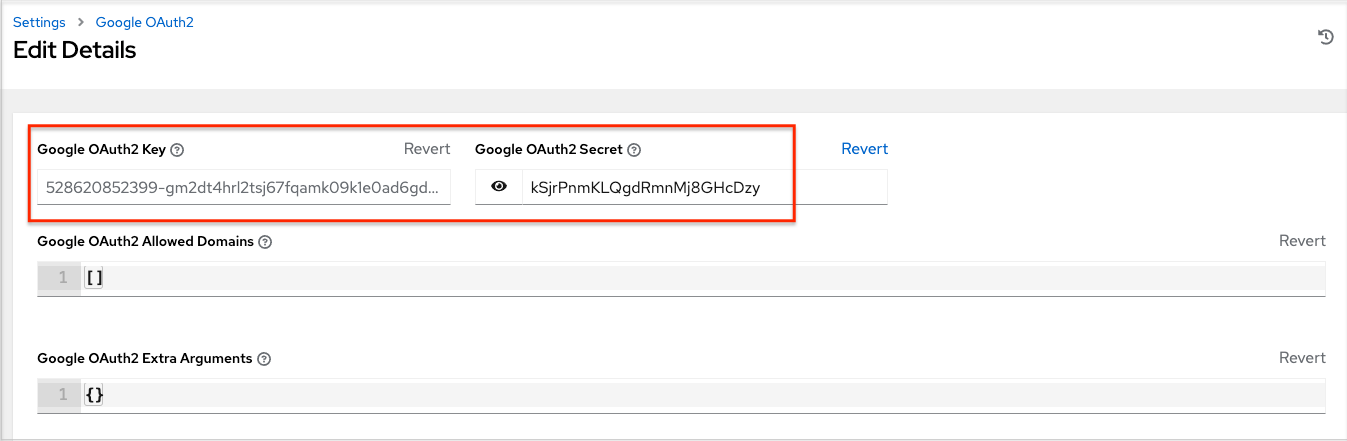
- To complete the remaining optional fields, refer to the tooltips in each of the fields for instructions and required format.
- For more information on completing the mapping fields, see Organization mapping and Team mapping.
- Click .
Verification
To verify that the authentication was configured correctly, logout of automation controller. The login screen displays the Google logo to indicate it as an alternate method of logging into automation controller.
![]()
21.3. Organization mapping
You must control which users are placed into which automation controller organizations based on their username and email address (distinguishing your organization administrators and users from social or enterprise-level authentication accounts).
Dictionary keys are organization names. Organizations are created, if not already present, and if the license permits multiple organizations. Otherwise, the single default organization is used regardless of the key.
Values are dictionaries defining the options for each organization’s membership. For each organization, you can specify which users are automatically users of the organization and also which users can administer the organization.
admins: None, True/False, string or list/tuple of strings:
- If None, organization administrators are not updated.
- If True, all users using account authentication are automatically added as administrators of the organization.
- If False, no account authentication users are automatically added as administrators of the organization.
-
If a string or list of strings, specifies the usernames and emails for users to be added to the organization, strings beginning and ending with
/are compiled into regular expressions. The modifiersi(case-insensitive) andm(multi-line) can be specified after the ending/.
remove_admins: True/False. Defaults to True:
- When True, a user who does not match is removed from the organization’s administrative list.
- users: None, True/False, string or list/tuple of strings. The same rules apply as for admins.
- remove_users: True/False. Defaults to True. The same rules apply as for remove_admins.
{
    "Default": {
        "users": true
    },
    "Test Org": {
        "admins": ["admin@example.com"],
        "users": true
    },
    "Test Org 2": {
        "admins": ["admin@example.com", "/^controller-[^@]+?@.*$/i"],
        "users": "/^[^@].*?@example\\.com$/"
    }
}
Organization mappings can be specified separately for each account authentication backend. If defined, these configurations take precedence over the global configuration above.
SOCIAL_AUTH_GOOGLE_OAUTH2_ORGANIZATION_MAP = {}
SOCIAL_AUTH_GITHUB_ORGANIZATION_MAP = {}
SOCIAL_AUTH_GITHUB_ORG_ORGANIZATION_MAP = {}
SOCIAL_AUTH_GITHUB_TEAM_ORGANIZATION_MAP = {}
SOCIAL_AUTH_SAML_ORGANIZATION_MAP = {}
21.4. Team mapping
Team mapping is the mapping of team members (users) from social authentication accounts. Keys are team names (which are created if not present). Values are dictionaries of options for each team’s membership, where each can contain the following parameters:
- organization: String. The name of the organization to which the team belongs. The team is created if the combination of organization and team name does not exist. The organization is created first if it does not exist. If the license does not permit multiple organizations, the team is always assigned to the single default organization.
users: None, True/False, string or list/tuple of strings.
- If None, team members are not updated.
- If True, all social authentication users are added as team members.
- If False, all social authentication users are removed as team members.
-
If a string or list of strings, specifies expressions used to match users, the user is added as a team member if the username or email matches. Strings beginning and ending with
/are compiled into regular expressions. The modifiersi(case-insensitive) andm(multi-line) can be specified after the ending/.
remove: True/False. Defaults to True. When True, a user who does not match the preceding rules is removed from the team.
{
    "My Team": {
        "organization": "Test Org",
        "users": ["/^[^@]+?@test\\.example\\.com$/"],
        "remove": true
    },
    "Other Team": {
        "organization": "Test Org 2",
        "users": ["/^[^@]+?@test\\.example\\.com$/"],
        "remove": false
    }
}
Team mappings can be specified separately for each account authentication backend, based on which of these you set up. When defined, these configurations take precedence over the preceding global configuration.
SOCIAL_AUTH_GOOGLE_OAUTH2_TEAM_MAP = {}
SOCIAL_AUTH_GITHUB_TEAM_MAP = {}
SOCIAL_AUTH_GITHUB_ORG_TEAM_MAP = {}
SOCIAL_AUTH_GITHUB_TEAM_TEAM_MAP = {}
SOCIAL_AUTH_SAML_TEAM_MAP = {}
Uncomment the following line, that is, set SOCIAL_AUTH_USER_FIELDS to an empty list, to prevent new user accounts from being created.
SOCIAL_AUTH_USER_FIELDS = []
Only users who have previously logged in to automation controller using social or enterprise-level authentication, or have a user account with a matching email address can then login.
Chapter 22. Setting up enterprise authentication
Set up authentication for the following enterprise systems:
For LDAP authentication, see Setting up LDAP Authentication.
SAML, RADIUS, and TACACS+ users are categorized as "Enterprise" users. The following rules apply to Enterprise users:
- Enterprise users can only be created through the first successful login attempt from the remote authentication backend.
- Enterprise users cannot be created or authenticated if non-enterprise users with the same name have already been created in automation controller.
- Automation controller passwords of enterprise users must always be empty and cannot be set by any user if they are enterprise backend-enabled.
If enterprise backends are disabled, an enterprise user can be converted to a normal automation controller user by setting the password field.
WarningThis operation is irreversible, as the converted automation controller user can no longer be treated as an enterprise user.
22.1. Microsoft Azure active directory authentication
To set up enterprise authentication for Microsoft Azure Active Directory (AD), you need to obtain an OAuth2 key and secret by registering your organization-owned application from Azure at: https://docs.microsoft.com/en-us/azure/active-directory/develop/quickstart-register-app.
Each key and secret must belong to a unique application and cannot be shared or reused between different authentication backends. To register the application, you must supply it with your webpage URL, which is the Callback URL shown in the Authentication tab of the Settings screen.
Procedure
- From the navigation panel, select .
Select Azure AD settings from the list of Authentication options.
NoteThe Azure AD OAuth2 Callback URL field is already pre-populated and non-editable. Once the application is registered, Microsoft Azure displays the Application ID and Object ID.
Click , copy and paste Microsoft Azure’s Application ID to the Azure AD OAuth2 Key field.
Following Microsoft Azure AD’s documentation for connecting your application to Microsoft Azure Active Directory, supply the key (shown at one time only) to the client for authentication.
- Copy and paste the secret key created for your Microsoft Azure AD application to the Azure AD OAuth2 Secret field of the Settings - Authentication screen.
- For more information on completing the Microsoft Azure AD OAuth2 Organization Map and Microsoft Azure AD OAuth2 Team Map fields, see Organization mapping and Team Mapping.
- Click .
Verification
To verify that the authentication is configured correctly, log out of automation controller and the login screen displays the Microsoft Azure logo to enable logging in with those credentials:
Additional resources
For application registering basics in Microsoft Azure AD, see the What is the Microsoft identity platform? overview.
22.2. RADIUS authentication
You can configure automation controller to centrally use RADIUS as a source for authentication information.
Procedure
- From the navigation panel, select .
- Select RADIUS settings from the list of Authentication options.
- Click and enter the host or IP of the RADIUS server in the RADIUS Server field. If you leave this field blank, RADIUS authentication is disabled.
- Enter the port and secret information in the next two fields.
- Click .
22.3. SAML authentication
SAML enables the exchange of authentication and authorization data between an Identity Provider (IdP - a system of servers that provide the Single Sign On service) and a service provider, in this case, automation controller.
You can configure automation controller to communicate with SAML to authenticate (create/login/logout) automation controller users. You can embed User, Team, and Organization membership in the SAML response to automation controller.
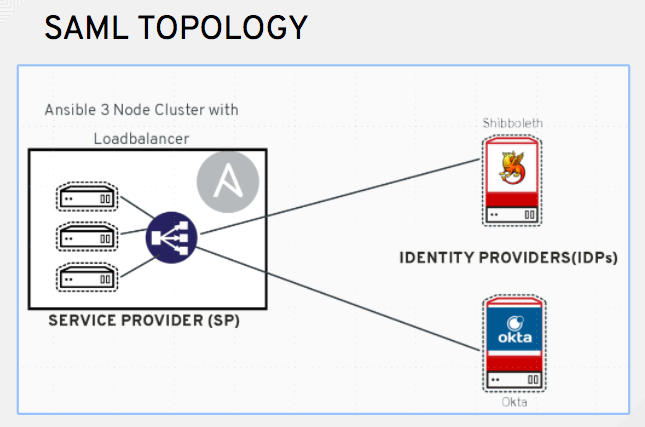
The following instructions describe automation controller as the service provider. To authenticate users through RHSSO (keycloak), see Red Hat Single Sign On Integration with the Automation Controller.
Procedure
- From the navigation panel, select .
Select SAML settings from the list of Authentication options.
NoteThe SAML Assertion Consume Service (ACS) URL and SAML Service Provider Metadata URL fields are pre-populated and are non-editable. Contact the IdP administrator and provide the information contained in these fields.
Click and set the SAML Service Provider Entity ID to be the same as the Base URL of the automation controller host field, found in the Miscellaneous System settings screen. You can view it through the API in the
/api/v2/settings/system, under theCONTROLLER_BASE_URLvariable. You can set the Entity ID to any one of the individual automation controller cluster nodes, but it is good practice to set it to the URL of the service provider. Ensure that the Base URL matches the FQDN of the load balancer, if used.NoteThe Base URL is different for each node in a cluster. A load balancer often sits in front of automation controller cluster nodes to provide a single entry point, the automation controller Cluster FQDN. The SAML service provider must be able establish an outbound connection and route to the automation controller Cluster Node or the automation controller Cluster FQDN that you set in the SAML Service Provider Entity ID.
In the following example, the service provider is the automation controller cluster, and therefore, the ID is set to the automation controller Cluster FQDN:
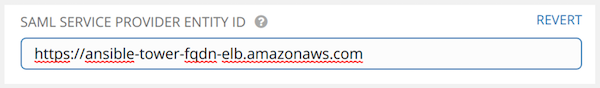
Create a server certificate for the Ansible cluster. Typically when an Ansible cluster is configured, the automation controller nodes are configured to handle HTTP traffic only and the load balancer is an SSL Termination Point. In this case, an SSL certificate is required for the load balancer, and not for the individual automation controller Cluster Nodes. You can enable or disable SSL per individual automation controller node, but you must disable it when using an SSL terminated load balancer. Use a non-expiring self signed certificate to avoid periodically updating certificates. This way, authentication does not fail in case someone forgets to update the certificate.
NoteThe SAML Service Provider Public Certificate field must contain the entire certificate, including the
-----BEGIN CERTIFICATE-----and-----END CERTIFICATE-----.If you are using a CA bundle with your certificate, include the entire bundle in this field.
Example
-----BEGIN CERTIFICATE-----
... cert text ...
-----END CERTIFICATE-----
Create an optional private key for the controller to use as a service provider and enter it in the SAML Service Provider Private Key field.
Example
-----BEGIN PRIVATE KEY-----
... key text ...
-----END PRIVATE KEY-----
Provide the IdP with details about the automation controller cluster during the SSO process in the SAML Service Provider Organization Info field:
{ "en-US": { "url": "http://www.example.com", "displayname": "Example", "name": "example" } }ImportantYou must complete these fields to configure SAML correctly within automation controller.
Provide the IdP with the technical contact information in the SAML Service Provider Technical Contact field. Do not remove the contents of this field:
{
"givenName": "Some User",
"emailAddress": "suser@example.com"
}
Provide the IdP with the support contact information in the SAML Service Provider Support Contact field. Do not remove the contents of this field:
{
"givenName": "Some User",
"emailAddress": "suser@example.com"
}
In the SAML Enabled Identity Providers field, provide information on how to connect to each IdP listed. The following example shows what automation controller expects SAML attributes to be:
Username(urn:oid:0.9.2342.19200300.100.1.1)
Email(urn:oid:0.9.2342.19200300.100.1.3)
FirstName(urn:oid:2.5.4.42)
LastName(urn:oid:2.5.4.4)
If these attributes are not known, map existing SAML attributes to
Username,Email,FirstName, andLastName.Configure the required keys for each IdP:
-
attr_user_permanent_id- The unique identifier for the user. It can be configured to match any of the attributes sent from the IdP. It is normally set toname_idif theSAML:nameidattribute is sent to the automation controller node. It can be the username attribute or a custom unique identifier. -
entity_id- The Entity ID provided by the IdP administrator. The administrator creates a SAML profile for automation controller and it generates a unique URL. -
url- The Single Sign On (SSO) URL that automation controller redirects the user to, when SSO is activated. x509_cert- The certificate provided by the IdP administrator that is generated from the SAML profile created on the IdP. Remove the---BEGIN CERTIFICATE---and---END CERTIFICATE---headers, then enter the certificate as one non-breaking string.Multiple SAML IdPs are supported. Some IdPs might provide user data using attribute names that differ from the default OIDs. The SAML NameID is a special attribute used by some IdPs to tell the service provider (the automation controller cluster) what the unique user identifier is. If it is used, set the
attr_user_permanent_idtoname_idas shown in the following example. Other attribute names can be overridden for each IdP:"myidp": { "entity_id": "https://idp.example.com", "url": "https://myidp.example.com/sso", "x509cert": "" }, "onelogin": { "entity_id": "https://app.onelogin.com/saml/metadata/123456", "url": "https://example.onelogin.com/trust/saml2/http-post/sso/123456", "x509cert": "", "attr_user_permanent_id": "name_id", "attr_first_name": "User.FirstName", "attr_last_name": "User.LastName", "attr_username": "User.email", "attr_email": "User.email" } }WarningDo not create a SAML user that shares the same email with another user (including a non-SAML user). Doing so results in the accounts being merged. Note that this same behavior exists for system administrators. Therefore, a SAML login with the same email address as the system administrator can login with system administrator privileges. To avoid this, you can remove (or add) administrator privileges based on SAML mappings.
-
- Optional: Provide the SAML Organization Map. For more information, see Organization mapping and Team mapping.
You can configure automation controller to look for particular attributes that contain Team and Organization membership to associate with users when they log into automation controller. The attribute names are defined in the SAML Organization Attribute Mapping and the SAML Team Attribute Mapping fields.
Example SAML Organization Attribute Mapping
The following is an example SAML attribute that embeds user organization membership in the attribute
member-of:<saml2:AttributeStatement> <saml2:Attribute FriendlyName="member-of" Name="member-of" NameFormat="urn:oasis:names:tc:SAML:2.0:attrname-format:unspecified"> <saml2:AttributeValue>Engineering</saml2:AttributeValue> <saml2:AttributeValue>IT</saml2:AttributeValue> <saml2:AttributeValue>HR</saml2:AttributeValue> <saml2:AttributeValue>Sales</saml2:AttributeValue> </saml2:Attribute> <saml2:Attribute FriendlyName="admin-of" Name="admin-of" NameFormat="urn:oasis:names:tc:SAML:2.0:attrname-format:unspecified"> <saml2:AttributeValue>Engineering</saml2:AttributeValue> </saml2:Attribute> </saml2:AttributeStatement>The following is the corresponding automation controller configuration:
{ "saml_attr": "member-of", "saml_admin_attr": "admin-of", "remove": true, "remove_admins": false }-
saml_attr: The SAML attribute name where the organization array can be found andremoveis set totrueto remove a user from all organizations before adding the user to the list of organizations. To keep the user in the organizations they are in while adding the user to the organizations in the SAML attribute, setremovetofalse. saml_admin_attr: Similar to thesaml_attrattribute, but instead of conveying organization membership, this attribute conveys administrator organization permissions.Example SAML Team Attribute Mapping
The following example is another SAML attribute that contains a team membership in a list:
<saml:AttributeStatement> <saml:Attribute xmlns:x500="urn:oasis:names:tc:SAML:2.0:profiles:attribute:X500" x500:Encoding="LDAP" NameFormat="urn:oasis:names:tc:SAML:2.0:attrname-format:uri" Name="urn:oid:1.3.6.1.4.1.5923.1.1.1.1" FriendlyName="eduPersonAffiliation"> <saml:AttributeValue xsi:type="xs:string">member</saml:AttributeValue> <saml:AttributeValue xsi:type="xs:string">staff</saml:AttributeValue> </saml:Attribute> </saml:AttributeStatement> { "saml_attr": "eduPersonAffiliation", "remove": true, "team_org_map": [ { "team": "member", "organization": "Default1" }, { "team": "staff", "organization": "Default2" } ] }-
saml_attr: The SAML attribute name where the team array can be found. -
remove: Setremovetotrueto remove the user from all teams before adding the user to the list of teams. To keep the user in the teams they are in while adding the user to the teams in the SAML attribute, setremovetofalse. team_org_map: An array of dictionaries of the form{ "team": "<AWX Team Name>", "organization": "<AWX Org Name>" }that defines mapping from controller Team → automation controller organization. You need this because the same named team can exist in multiple organizations in automation controller. The organization to which a team listed in a SAML attribute belongs to is ambiguous without this mapping.You can create an alias to override both teams and organizations in the SAML Team Attribute Mapping field. This option is useful in cases when the SAML backend sends out complex group names, as show in the following example:
{
 "remove": false,
 "team_org_map": [
  {
   "team": "internal:unix:domain:admins",
   "organization": "Default",
   "team_alias": "Administrators"
  },
  {
   "team": "Domain Users",
   "organization_alias": "OrgAlias",
   "organization": "Default"
  }
 ],
 "saml_attr": "member-of"
}
Once the user authenticates, automation controller creates organization and team aliases.
-
- Optional: Provide team membership mapping in the SAML Team Map field. For more information, see Organization mapping and Team Mapping.
Optional: Provide security settings in the SAML Security Config field. This field is the equivalent to the
SOCIAL_AUTH_SAML_SECURITY_CONFIGfield in the API. For more information, see OneLogin’s SAML Python Toolkit.Automation controller uses the
python-social-authlibrary when users log in through SAML. This library relies on thepython-samllibrary to make the settings available for the next two optional fields, SAML Service Provider extra configuration data and SAML IDP to extra_data attribute mapping.-
The SAML Service Provider extra configuration data field is equivalent to the
SOCIAL_AUTH_SAML_SP_EXTRAin the API. For more information, see OneLogin’s SAML Python Toolkit to learn about the valid service provider extra (SP_EXTRA) parameters. -
The SAML IDP to extra_data attribute mapping field is equivalent to the
SOCIAL_AUTH_SAML_EXTRA_DATAin the API. For more information, see Python’s SAML Advanced Settings documentation. The SAML User Flags Attribute Mapping field enables you to map SAML roles and attributes to special user flags. The following attributes are valid in this field:
-
is_superuser_role: Specifies one or more SAML roles which grants a user the superuser flag. -
is_superuser_attr: Specifies a SAML attribute which grants a user the superuser flag. -
is_superuser_value: Specifies one or more values required foris_superuser_attrthat is required for the user to be a superuser. -
remove_superusers: Boolean indicating if the superuser flag should be removed for users or not. This defaults totrue. -
is_system_auditor_role: Specifies one or more SAML roles which will grant a user the system auditor flag. -
is_system_auditor_attr: Specifies a SAML attribute which will grant a user the system auditor flag. -
is_system_auditor_value: Specifies one or more values required foris_system_auditor_attrthat is required for the user to be a system auditor. remove_system_auditors: Boolean indicating if thesystem_auditorflag should be removed for users or not. This defaults totrue.The
roleandvaluefields are lists and are 'OR' logic. If you specify two roles: [ "Role 1", "Role 2" ] and the SAML user has either role, the logic considers them to have the required role for the flag. This is the same with thevaluefield, if you specify: [ "Value 1", "Value 2"] and the SAML user has either value for their attribute the logic considers their attribute value to have matched.If you specify
roleandattrfor eithersuperuserorsystem_auditor, the settings forattrtake precedence over a role. System administrators and System auditor roles are evaluated at login for a SAML user. If you grant a SAML user one of these roles through the UI and not through the SAML settings, the roles are removed on the user’s next login unless theremoveflag is set tofalse. Theremoveflag, iffalse, never enables the SAML adapter to remove the corresponding flag from a user. The following table describes how the logic works:Has one or more roles Has attrHas one or more attr ValuesRemove flag Previous Flag Is flagged No
No
N/A
True
False
No
No
No
N/A
False
False
No
No
No
N/A
True
True
No
No
No
N/A
False
True
Yes
Yes
No
N/A
True
False
Yes
Yes
No
N/A
False
False
Yes
Yes
No
N/A
True
True
Yes
Yes
No
N/A
False
False
Yes
No
Yes
Yes
True
True
Yes
No
Yes
Yes
True
False
Yes
No
Yes
Yes
False
False
Yes
No
Yes
Yes
True
True
Yes
No
Yes
Yes
False
True
Yes
No
Yes
No
True
False
No
No
Yes
No
False
False
No
No
Yes
No
True
True
No
No
Yes
No
False
True
Yes
No
Yes
Unset
True
False
Yes
No
Yes
Unset
False
False
Yes
No
Yes
Unset
True
True
Yes
No
Yes
Unset
False
True
Yes
Yes
Yes
Yes
True
False
Yes
Yes
Yes
Yes
False
False
Yes
Yes
Yes
Yes
True
True
Yes
Yes
Yes
Yes
False
True
Yes
Yes
Yes
No
True
False
No
Yes
Yes
No
False
False
No
Yes
Yes
No
True
True
No
Yes
Yes
No
False
True
Yes
Yes
Yes
Unset
True
False
Yes
Yes
Yes
Unset
False
False
Yes
Yes
Yes
Unset
True
True
Yes
Yes
Yes
Unset
False
True
Yes
Each time a SAML user authenticates to automation controller, these checks are performed and the user flags are altered as needed. If
System AdministratororSystem Auditoris set for a SAML user within the UI, the SAML adapter overrides the UI setting based on the preceding rules. If you prefer that the user flags for SAML users do not get removed when a SAML user logs in, you can set theremove_flag tofalse. With theremoveflag set tofalse, a user flag set totruethrough either the UI, API or SAML adapter is not removed. However, if a user does not have the flag, and the preceding rules determine the flag should be added, it is added, even if the flag isfalse.Example
{
    "is_superuser_attr": "blueGroups",
    "is_superuser_role": ["is_superuser"],
    "is_superuser_value": ["cn=My-Sys-Admins,ou=memberlist,ou=mygroups,o=myco.com"],
    "is_system_auditor_attr": "blueGroups",
    "is_system_auditor_role": ["is_system_auditor"],
    "is_system_auditor_value": ["cn=My-Auditors,ou=memberlist,ou=mygroups,o=myco.com"]
}
-
-
The SAML Service Provider extra configuration data field is equivalent to the
- Click .
Verification
To verify that the authentication is configured correctly, load the auto-generated URL found in the SAML Service Provider Metadata URL into a browser. If you do not get XML output, you have not configured it correctly.
Alternatively, logout of automation controller and the login screen displays the SAML logo to indicate it as a alternate method of logging into automation controller:
22.3.1. Configuring transparent SAML logins
For transparent logins to work, you must first get IdP-initiated logins to work.
Procedure
-
Set the
RelayStateon the IdP to the key of the IdP definition in the SAML Enabled Identity Providers field. When this is working, specify the redirect URL for non-logged-in users to somewhere other than the default automation controller login page by using the Login redirect override URL field in the Miscellaneous Authentication settings window of the menu. You must set this to
/sso/login/saml/?idp=<name-of-your-idp>for transparent SAML login, as shown in the following example: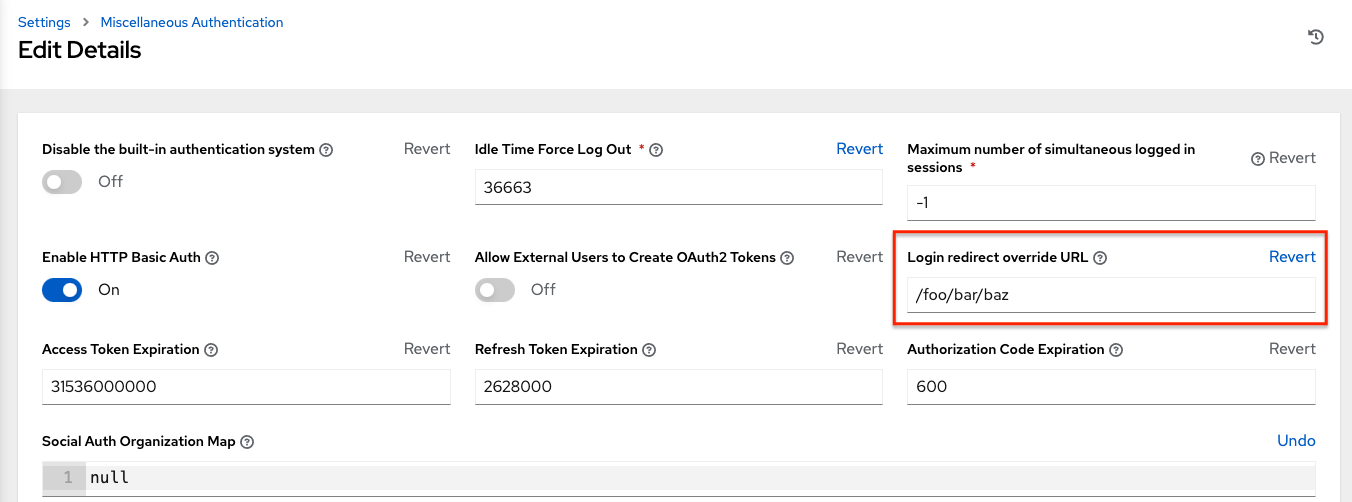 Note
NoteThis example shows a typical IdP format, but might not be the correct format for your particular case. You might need to reach out to your IdP for the correct transparent redirect URL as that URL is not the same for all IdPs.
-
After you configure transparent SAML login, to log in using local credentials or a different SSO, go directly to
https://<your-tower-server>/login. This provides the standard automation controller login page, including SSO authentication options, enabling you to log in with any configured method.
22.3.2. Enable logging for SAML
You can enable logging messages for the SAML adapter in the same way that you can enable logging for LDAP.
For more information, see the Enabling logging for LDAP section.
22.4. TACACS Plus authentication
Terminal Access Controller Access-Control System Plus (TACACS+) is a protocol that handles remote authentication and related services for networked access control through a centralized server. TACACS+ provides authentication, authorization and accounting (AAA) services, in which you can configure automation controller to use as a source for authentication.
This feature is deprecated and will be removed in a future release.
Procedure
- From the navigation panel, select .
- Select TACACs+ settings from the list of Authentication options.
Click and enter the following information:
- TACACS+ Server: Provide the hostname or IP address of the TACACS+ server with which to authenticate. If you leave this field blank, TACACS+ authentication is disabled.
- TACACS+ Port: TACACS+ uses port 49 by default, which is already pre-populated.
- TACACS+ Secret: The secret key for TACACS+ authentication server.
- TACACS+ Auth Session Timeout: The session timeout value in seconds. The default is 5 seconds.
- TACACS+ Authentication Protocol: The protocol used by the TACACS+ client. The options are ascii or pap.
- Click .
22.5. Generic OIDC authentication
OpenID Connect (OIDC) uses the OAuth 2.0 framework. It enables third-party applications to verify the identity and obtain basic end-user information. The main difference between OIDC and SAML is that SAML has a service provider (SP)-to-IdP trust relationship, whereas OIDC establishes the trust with the channel (HTTPS) that is used to obtain the security token. To obtain the credentials needed to set up OIDC with automation controller, see the documentation from the IdP of your choice that has OIDC support.
Procedure
- From the navigation panel, select .
- Select Generic OIDC settings from the list of Authentication options.
Click and enter the following information:
- OIDC Key: The client ID from your third-party IdP.
- OIDC Secret: The client secret from your IdP.
- OIDC Provider URL: The URL for your OIDC provider.
- Verify OIDC Provider Certificate: Use the toggle to enable or disable the OIDC provider SSL certificate verification.
Click .
NoteTeam and organization mappings for OIDC are currently not supported. The OIDC adapter does authentication only and not authorization. It is only capable of authenticating whether this user is who they say they are. It does not authorize what this user is enabled to do. Configuring generic OIDC creates the UserID appended with an ID or key to differentiate the same user ID originating from two different sources and therefore, considered different users. So you get an ID of just the user name and the second is the username-<random number>.
Verification
To verify that the authentication is configured correctly, logout of automation controller and the login screen displays the OIDC logo to indicate it as a alternative method of logging into automation controller:
![]()
Chapter 23. LDAP authentication
Administrators use the Lightweight Directory Access Protocol (LDAP) as a source for account authentication information for automation controller users. User authentication is provided, but not the synchronization of user permissions and credentials. Organization membership and team membership can be synchronized by the organization administrator.
23.1. Setting up LDAP authentication
When configured, a user who logs in with an LDAP username and password automatically has an automation controller account created for them. They can be automatically placed into organizations as either regular users or organization administrators.
Users created in the user interface (Local) take precedence over those logging into automation controller for their first time with an alternative authentication solution. You must delete the local user if you want to re-use with another authentication method, such as LDAP.
Users created through an LDAP login cannot change their username, given name, surname, or set a local password for themselves. You can also configure this to restrict editing of other field names.
If the LDAP server you want to connect to has a certificate that is self-signed or signed by a corporate internal certificate authority (CA), you must add the CA certificate to the system’s trusted CAs. Otherwise, connection to the LDAP server results in an error that the certificate issuer is not recognized. For more information, see Importing a certificate authority in automation controller for LDAPS integration. If prompted, use your Red Hat customer credentials to login.
Procedure
- Create a user in LDAP that has access to read the entire LDAP structure.
Use the
ldapsearchcommand to test if you can make successful queries to the LDAP server. You can install this tool from automation controller’s system command line, and by using other Linux and OSX systems.Example
ldapsearch -x -H ldap://win -D "CN=josie,CN=Users,DC=website,DC=com" -b "dc=website,dc=com" -w Josie4Cloud
In this example,
CN=josie,CN=users,DC=website,DC=comis the distinguished name of the connecting user.NoteThe
ldapsearchutility is not automatically pre-installed with automation controller. However, you can install it from theopenldap-clientspackage.- From the navigation panel, select in the automation controller UI.
Select LDAP settings in the list of Authentication options.
You do not need multiple LDAP configurations per LDAP server, but you can configure many LDAP servers from this page, otherwise, leave the server at Default.
The equivalent API endpoints show
AUTH_LDAP_*repeated:AUTH_LDAP_1_*,AUTH_LDAP_2_*,AUTH_LDAP_5_*to denote server designations.To enter or change the LDAP server address, click and enter in the LDAP Server URI field by using the same format as the one pre-populated in the text field.
NoteYou can specify multiple LDAP servers by separating each with spaces or commas. Click the
icon to comply with the correct syntax and rules.
- Enter the password to use for the binding user in the LDAP Bind Password text field. For more information about LDAP variables, see Ansible automation hub variables.
Click to select a group type from the LDAP Group Type list.
The LDAP group types that are supported by automation controller use the underlying django-auth-ldap library. To specify the parameters for the selected group type, see Step 15.
- The LDAP Start TLS is disabled by default. To enable TLS when the LDAP connection is not using SSL/TLS, set the toggle to On.
Enter the distinguished name in the LDAP Bind DN text field to specify the user that automation controller uses to connect (Bind) to the LDAP server.
-
If that name is stored in key
sAMAccountName, the LDAP User DN Template is populated from(sAMAccountName=%(user)s). Active Directory stores the username tosAMAccountName. For OpenLDAP, the key isuidand the line becomes(uid=%(user)s).
-
If that name is stored in key
-
Enter the distinguished group name to enable users within that group to access automation controller in the LDAP Require Group field, using the same format as the one shown in the text field,
CN=controller Users,OU=Users,DC=website,DC=com. - Enter the distinguished group name to prevent users within that group from accessing automation controller in the LDAP Deny Group field, using the same format as the one shown in the text field.
Enter where to search for users while authenticating in the LDAP User Search field by using the same format as the one shown in the text field. In this example, use:
[
"OU=Users,DC=website,DC=com",
"SCOPE_SUBTREE",
"(cn=%(user)s)"
]
The first line specifies where to search for users in the LDAP tree. In the earlier example, the users are searched recursively starting from
DC=website,DC=com.The second line specifies the scope where the users should be searched:
- SCOPE_BASE: Use this value to indicate searching only the entry at the base DN, resulting in only that entry being returned.
- SCOPE_ONELEVEL: Use this value to indicate searching all entries one level under the base DN, but not including the base DN and not including any entries under that one level under the base DN.
SCOPE_SUBTREE: Use this value to indicate searching of all entries at all levels under and including the specified base DN.
The third line specifies the key name where the user name is stored.
For many search queries, use the following correct syntax:
[
  [
  "OU=Users,DC=northamerica,DC=acme,DC=com",
  "SCOPE_SUBTREE",
  "(sAMAccountName=%(user)s)"
  ],
  [
  "OU=Users,DC=apac,DC=corp,DC=com",
  "SCOPE_SUBTREE",
  "(sAMAccountName=%(user)s)"
  ],
  [
  "OU=Users,DC=emea,DC=corp,DC=com",
  "SCOPE_SUBTREE",
  "(sAMAccountName=%(user)s)"
  ]
]
In the LDAP Group Search text field, specify which groups to search and how to search them. In this example, use:
[
"dc=example,dc=com",
"SCOPE_SUBTREE",
"(objectClass=group)"
 ]
- The first line specifies the BASE DN where the groups should be searched.
- The second line specifies the scope and is the same as that for the user directive.
-
The third line specifies what the
objectClassof a group object is in the LDAP that you are using.
Enter the user attributes in the LDAP User Attribute Map the text field. In this example, use:
{
"first_name": "givenName",
"last_name": "sn",
"email": "mail"
}
The earlier example retrieves users by surname from the key
sn. You can use the same LDAP query for the user to decide what keys they are stored under.Depending on the selected LDAP Group Type, different parameters are available in the LDAP Group Type Parameters field to account for this.
LDAP_GROUP_TYPE_PARAMSis a dictionary that is converted by automation controller tokwargsand passed to the LDAP Group Type class selected. There are two common parameters used by any of the LDAP Group Type;name_attrandmember_attr. Wherename_attr defaultsto cn andmember_attrdefaults to member:{"name_attr": "cn", "member_attr": "member"}To find what parameters a specific LDAP Group Type expects, see the django_auth_ldap documentation around the classes
initparameters.Enter the user profile flags in the LDAP User Flags by Group text field. The following example uses the syntax to set LDAP users as "Superusers" and "Auditors":
{ "is_superuser": "cn=superusers,ou=groups,dc=website,dc=com", "is_system_auditor": "cn=auditors,ou=groups,dc=website,dc=com" }- For more information about completing the mapping fields, LDAP Organization Map and LDAP Team Map, see the LDAP Organization and team mapping section.
- Click .
Automation controller does not actively synchronize users, but they are created during their initial login. To improve performance associated with LDAP authentication, see Preventing LDAP attributes from updating on each login.
23.1.1. LDAP organization and team mapping
You can control which users are placed into which automation controller organizations based on LDAP attributes (mapping out between your organization administrators, users and LDAP groups).
Keys are organization names. Organizations are created if not present. Values are dictionaries defining the options for each organization’s membership. For each organization, you can specify what groups are automatically users of the organization and also what groups can administer the organization.
admins: none, true, false, string or list/tuple of strings:
-
If
none, organization administrators are not updated based on LDAP values. -
If
true, all users in LDAP are automatically added as administrators of the organization. -
If
false, no LDAP users are automatically added as administrators of the organization. - If a string or list of strings specifies the group DNs that are added to the organization if they match any of the specified groups.
remove_admins: True/False. Defaults to False:
-
When
true, a user who is not a member of the given group is removed from the organization’s administrative list.
users: none, true, false, string or list/tuple of strings. The same rules apply as for administrators.
remove_users: true or false. Defaults to false. The same rules apply as for administrators.
Example
{
"LDAP Organization": {
  "admins": "cn=engineering_admins,ou=groups,dc=example,dc=com",
  "remove_admins": false,
  "users": [
    "cn=engineering,ou=groups,dc=example,dc=com",
    "cn=sales,ou=groups,dc=example,dc=com",
    "cn=it,ou=groups,dc=example,dc=com"
  ],
  "remove_users": false
},
"LDAP Organization 2": {
  "admins": [
    "cn=Administrators,cn=Builtin,dc=example,dc=com"
  ],
  "remove_admins": false,
  "users": true,
"remove_users": false
}
}
When mapping between users and LDAP groups, keys are team names and are created if not present. Values are dictionaries of options for each team’s membership, where each can contain the following parameters:
organization: string. The name of the organization to which the team belongs. The team is created if the combination of organization and team name does not exist. The organization is first created if it does not exist.
users: none, true, false, string, or list/tuple of strings:
-
If
none, team members are not updated. -
If
trueorfalse, all LDAP users are added or removed as team members. - If a string or list of strings specifies the group DNs, the user is added as a team member if the user is a member of any of these groups.
remove: true or false. Defaults to false. When true, a user who is not a member of the given group is removed from the team.
Example
{
"LDAP Engineering": {
  "organization": "LDAP Organization",
  "users": "cn=engineering,ou=groups,dc=example,dc=com",
  "remove": true
},
"LDAP IT": {
  "organization": "LDAP Organization",
  "users": "cn=it,ou=groups,dc=example,dc=com",
  "remove": true
},
"LDAP Sales": {
  "organization": "LDAP Organization",
  "users": "cn=sales,ou=groups,dc=example,dc=com",
  "remove": true
}
}
23.1.2. Enabling logging for LDAP
To enable logging for LDAP, you must set the level to DEBUG in the Settings configuration window:
Procedure
- From the navigation panel, select .
- Select Logging settings from the list of System options.
- Click .
- Set the Logging Aggregator Level Threshold field to DEBUG.
- Click .
23.1.3. Preventing LDAP attributes from updating on each login
By default, when an LDAP user authenticates, all user-related attributes are updated in the database on each login. In some environments, you can skip this operation due to performance issues. To avoid it, you can disable the option AUTH_LDAP_ALWAYS_UPDATE_USER.
Set this option to false to not update the LDAP user’s attributes. Attributes are only updated the first time the user is created.
Procedure
Create a custom file under
/etc/tower/conf.d/custom-ldap.pywith the following contents. If you have multiple nodes, execute it on all nodes:AUTH_LDAP_ALWAYS_UPDATE_USER = False
Restart automation controller on all nodes:
automation-controller-service restart
With this option set to
False, no changes to LDAP user’s attributes are pushed to automation controller. Note that new users are created and their attributes are pushed to the database on their first login.
By default, an LDAP user gets their attributes updated in the database upon each login. For a playbook that runs multiple times with an LDAP credential, those queries can be avoided.
Verification
Check the PostgreSQL for slow queries related to the LDAP authentication.
Additional resources
For more information, see AUTH_LDAP_ALWAYS_UPDATE_USER of the Django documentation.
23.1.4. Importing a certificate authority in automation controller for LDAPS integration
You can authenticate to the automation controller server by using LDAP, but if you change to using LDAPS (LDAP over SSL/TLS) to authenticate, it fails with one of the following errors:
2020-04-28 17:25:36,184 WARNING django_auth_ldap Caught LDAPError while authenticating e079127: SERVER_DOWN({'info': 'error:14090086:SSL routines:ssl3_get_server_certificate:certificate verify failed (unable to get issuer certificate)', 'desc': "Can't contact LDAP server"},)2020-06-02 11:48:24,840 WARNING django_auth_ldap Caught LDAPError while authenticating reinernippes: SERVER_DOWN({'desc': "Can't contact LDAP server", 'info': 'error:14090086:SSL routines:ssl3_get_server_certificate:certificate verify failed (certificate has expired)'},)
By default, django_auth_ldap verifies SSL connections before starting an LDAPS transaction. When you receive a certificate verify failed error, this means that the django_auth_ldap could not verify the certificate. When the SSL/TLS connection cannot be verified, the connection attempt is halted.
Procedure
To import an LDAP CA, run the following commands:
cp ldap_server-CA.crt /etc/pki/ca-trust/source/anchors/
update-ca-trust
Run these two commands on all automation controller nodes in a clustered setup.
23.1.5. Referrals
Active Directory uses "referrals" in case the queried object is not available in its database. This does not work correctly with the django LDAP client and it helps to disable referrals.
Disable LDAP referrals by adding the following lines to your /etc/tower/conf.d/custom.py file:
AUTH_LDAP_GLOBAL_OPTIONS = {
    ldap.OPT_REFERRALS: False,
}
23.1.6. Changing the default timeout for authentication
You can change the default length of time, in seconds, that your supplied token is valid in the Settings screen of the automation controller UI.
Procedure
- From the navigation panel, select .
- Select Miscellaneous Authentication settings from the list of System options.
- Click .
- Enter the timeout period in seconds in the Idle Time Force Log Out text field.
- Click .
If you access automation controller and have trouble logging in, clear your web browser’s cache. In situations such as this, it is common for the authentication token to be cached during the browser session. You must clear it to continue.
Chapter 24. User Authentication with Kerberos
User authentication using Active Directory (AD), also referred to as authentication through Kerberos, is supported through automation controller.
24.1. Set up the Kerberos packages
First set up the Kerberos packages in automation controller so that you can successfully generate a Kerberos ticket.
Use the following commands to install the packages:
yum install krb5-workstation
yum install krb5-devel
yum install krb5-libs
When installed, edit the /etc/krb5.conf file, as follows, to provide the address of the AD, the domain, and additional information:
[logging]
 default = FILE:/var/log/krb5libs.log
 kdc = FILE:/var/log/krb5kdc.log
 admin_server = FILE:/var/log/kadmind.log

[libdefaults]
 default_realm = WEBSITE.COM
 dns_lookup_realm = false
 dns_lookup_kdc = false
 ticket_lifetime = 24h
 renew_lifetime = 7d
 forwardable = true

[realms]
 WEBSITE.COM = {
  kdc = WIN-SA2TXZOTVMV.website.com
  admin_server = WIN-SA2TXZOTVMV.website.com
 }

[domain_realm]
 .website.com = WEBSITE.COM
 website.com = WEBSITE.COM
When the configuration file has been updated, use the following commands to authenticate and get a valid token:
[root@ip-172-31-26-180 ~]# kinit username
Password for username@WEBSITE.COM:
[root@ip-172-31-26-180 ~]#
Check if you have a valid ticket.
[root@ip-172-31-26-180 ~]# klist
Ticket cache: FILE:/tmp/krb5cc_0
Default principal: username@WEBSITE.COM

Valid starting     Expires            Service principal
01/25/23 11:42:56  01/25/23 21:42:53  krbtgt/WEBSITE.COM@WEBSITE.COM
  renew until 02/01/23 11:42:56
[root@ip-172-31-26-180 ~]#
When you have a valid ticket, you can check to ensure that everything is working as expected from the command line.
To test this, your inventory should resemble the following:
[windows]
win01.WEBSITE.COM

[windows:vars]
ansible_user = username@WEBSITE.COM
ansible_connection = winrm
ansible_port = 5986
You must also:
- Ensure that the hostname is the proper client hostname matching the entry in AD and is not the IP address.
-
In the username declaration, ensure that the domain name (the text after
@) is properly entered with regard to upper- and lower-case letters, as Kerberos is case sensitive. - For automation controller, you must also ensure that the inventory looks the same.
If you encounter a Server not found in Kerberos database error message, and your inventory is configured using FQDNs (not IP addresses), ensure that the service principal name is not missing or mis-configured.
Playbooks should run as expected. You can test this by running the playbook as the awx user.
When you have verified that playbooks work properly, you can integrate with automation controller.
Generate the Kerberos ticket as the awx user. Automation controller automatically picks up the generated ticket for authentication.
The python kerberos package must be installed. Ansible is designed to check if the kerberos package is installed and, if so, it uses kerberos authentication.
24.2. Active Directory and Kerberos Credentials
Active Directory only:
- If you are only planning to run playbooks against Windows machines with AD usernames and passwords as machine credentials, you can use the "user@<domain>" format for the username.
With Kerberos:
- If Kerberos is installed, you can create a machine credential with the username and password, using the "user@<domain>" format for the username.
24.3. Working with Kerberos Tickets
Ansible defaults to automatically managing Kerberos tickets when both the username and password are specified in the machine credential for a host that is configured for Kerberos. A new ticket is created in a temporary credential cache for each host, before each task executes (to minimize the chance of ticket expiration). The temporary credential caches are deleted after each task, and do not interfere with the default credential cache.
To disable automatic ticket management, that is, to use an existing SSO ticket or call kinit manually to populate the default credential cache, set ansible_winrm_kinit_mode=manual in the inventory.
Automatic ticket management requires a standard kinit binary on the control host system path. To specify a different location or binary name, set the ansible_winrm_kinit_cmd inventory variable to the fully-qualified path to an MIT krbv5 kinit-compatible binary.
Chapter 25. Sessions limits
Setting a session limit enables administrators to limit the number of simultaneous sessions per user or per IP address.
25.1. Working with session limits
In automation controller, a session is created for each browser that a user logs in with. This forces the user to log out of any extra sessions after they exceed the administrator-defined maximum.
Session limits can be important, depending on your setup.
Example
You only want a single user on your system with a single login per device (where the user can log in on their work laptop, phone, or home computer). In this case, you want to create a session limit equal to 1 (one). If the user logs in on their laptop, for example, then logs in using their phone, their laptop session expires (times out) and only the login on the phone persists. Proactive session limits kick the user out when the session is idle. The default value is -1, which disables the maximum sessions allowed. This means that you can have as many sessions without an imposed limit.
While session counts can be very limited, you can also expand them to cover as many session logins as are needed by your organization.
When a user logs in resulting in other users being logged out, the session limit has been reached and those users who are logged out are notified as to why the logout occurred.
Procedure
- To make changes to your session limits, from the navigation panel, select .
- Select Miscellaneous Authentication settings from the list of System options.
- Click .
Edit the Maximum number of simultaneous logged in sessions setting or use the Browsable API if you are comfortable with making REST requests.
NoteTo make the best use of session limits, disable
AUTH_BASIC_ENABLEDby changing the value tofalse, as it falls outside the scope of session limit enforcement. Alternatively, in the Miscellaneous Authentication settings, toggle the Enable HTTP Basic Auth to off.
Chapter 26. Backup and restore
The ability to backup and restore your system is integrated into the Ansible Automation Platform setup playbook. For more information, see the Backup and restore clustered environments section.
Ensure that you restore to the same version from which it was backed up. However, you must use the most recent minor version of a release to backup or restore your Ansible Automation Platform installation version. For example, if the current Ansible Automation Platform version you are on is 2.0.x, use only the latest 2.0 installer.
Backup and restore only works on PostgreSQL versions supported by your current platform version. For more information, see Red Hat Ansible Automation Platform system requirements in the Red Hat Ansible Automation Platform Installation Guide.
The Ansible Automation Platform setup playbook is invoked as setup.sh from the path where you unpacked the platform installer tarball. It uses the same inventory file used by the install playbook. The setup script takes the following arguments for backing up and restoring:
-
-b: Perform a database backup rather than an installation. -
-r: Perform a database restore rather than an installation.
As the root user, call setup.sh with the appropriate parameters and the Ansible Automation Platform backup or restored as configured:
root@localhost:~# ./setup.sh -b
root@localhost:~# ./setup.sh -r
Backup files are created on the same path that setup.sh script exists. You can change it by specifying the following EXTRA_VARS:
root@localhost:~# ./setup.sh -e 'backup_dest=/path/to/backup_dir/' -b
A default restore path is used unless you provide EXTRA_VARS with a non-default path, as shown in the following example:
root@localhost:~# ./setup.sh -e 'restore_backup_file=/path/to/nondefault/backup.tar.gz' -r
Optionally, you can override the inventory file used by passing it as an argument to the setup script:
setup.sh -i <inventory file>
26.1. Backup and restore playbooks
In addition to the install.yml file included with your setup.sh setup playbook, there are also backup.yml and restore.yml files for your backup and restoration needs.
These playbooks serve to backup and restore.
The overall backup, backs up:
- The database
-
The
SECRET_KEYfile
The per-system backups include:
- Custom configuration files
- Manual projects
- The restore backup restores the backed up files and data to a freshly installed and working second instance of automation controller.
When restoring your system, the installer checks to see that the backup file exists before beginning the restoration. If the backup file is not available, your restoration fails.
Ensure that your automation controller hosts are properly set up with SSH keys, user or pass variables in the hosts file, and that the user has sudo access.
26.2. Backup and restoration considerations
Consider the following points when you backup and restore your system:
- Disk space
- Review your disk space requirements to ensure you have enough room to backup configuration files, keys, other relevant files, and the database of the Ansible Automation Platform installation.
- System credentials
-
Confirm you have the required system credentials when working with a local database or a remote database. On local systems, you might need
rootorsudoaccess, depending on how credentials are set up. On remote systems, you might need different credentials to grant you access to the remote system you are trying to backup or restore. - Version
- You must always use the most recent minor version of a release to backup or restore your Ansible Automation Platform installation version. For example, if the current platform version you are on is 2.0.x, use only the latest 2.0 installer.
- File path
-
When using
setup.shin order to do a restore from the default restore file path,/var/lib/awx,-ris still required in order to do the restore, but it no longer accepts an argument. If a non-default restore file path is needed, you must provide this as an extra_var (root@localhost:~# ./setup.sh -e 'restore_backup_file=/path/to/nondefault/backup.tar.gz' -r). - Directory
-
If the backup file is placed in the same directory as the
setup.shinstaller, the restore playbook automatically locates the restore files. In this case, you do not need to use therestore_backup_fileextra var to specify the location of the backup file.
26.3. Backup and restore clustered environments
The procedure for backup and restore for a clustered environment is similar to a single install, except for some of the following considerations:
For more information on installing clustered environments, see the Install and configure section.
- If restoring to a new cluster, ensure that the old cluster is shut down before proceeding because they can conflict with each other when accessing the database.
- Per-node backups are only restored to nodes bearing the same hostname as the backup.
When restoring to an existing cluster, the restore contains the following:
- A dump of the PostgreSQL database
- UI artifacts, included in the database dump
-
An automation controller configuration (retrieved from
/etc/tower) - An automation controller secret key
- Manual projects
26.3.1. Restore to a different cluster
When restoring a backup to a separate instance or cluster, manual projects and custom settings under /etc/tower are retained. Job output and job events are stored in the database, and therefore, not affected.
The restore process does not alter instance groups present before the restore. It does not introduce any new instance groups either. Restored automation controller resources that were associated to instance groups likely need to be reassigned to instance groups present on the new automation controller cluster.
Chapter 27. Usability Analytics and Data Collection
Usability data collection is included with automation controller to collect data to better understand how automation controller users interact with it.
Only users installing a trial of or a fresh installation of are opted-in for this data collection.
Automation controller collects user data automatically to help improve the product. You can opt out or control the way automation controller collects data by setting your participation level in the User Interface settings in the menu.
27.1. Setting up data collection participation
Use the following procedure to set your participation level for data collection.
Procedure
- From the navigation panel, select .
- Select User Interface settings from the User Interface option.
Click .
Select the desired level of data collection from the User Analytics Tracking State list:
- Off: Prevents any data collection.
- Anonymous: Enables data collection without your specific user data.
- Detailed: Enables data collection including your specific user data.
- Click to apply the settings, or to abandon the changes.
For more information, see the Red Hat Privacy Statement.
27.2. Automation Analytics
When you imported your license for the first time, you were given options related to the collection of data that powers Automation Analytics, a cloud service that is part of the Ansible Automation Platform subscription.
For opt-in of Automation Analytics to have any effect, your instance of automation controller must be running on Red Hat Enterprise Linux.
As with Red Hat Insights, Automation Analytics is built to collect the minimum amount of data needed. No credential secrets, personal data, automation variables, or task output is gathered.
For more information, see Details of data collection.
To enable this feature, turn on data collection for Automation Analytics and enter your Red Hat customer credentials in the Miscellaneous System settings of the System configuration list of options in the menu.
You can view the location to which the collection of insights data is uploaded in the Automation Analytics upload URL field on the Details page.
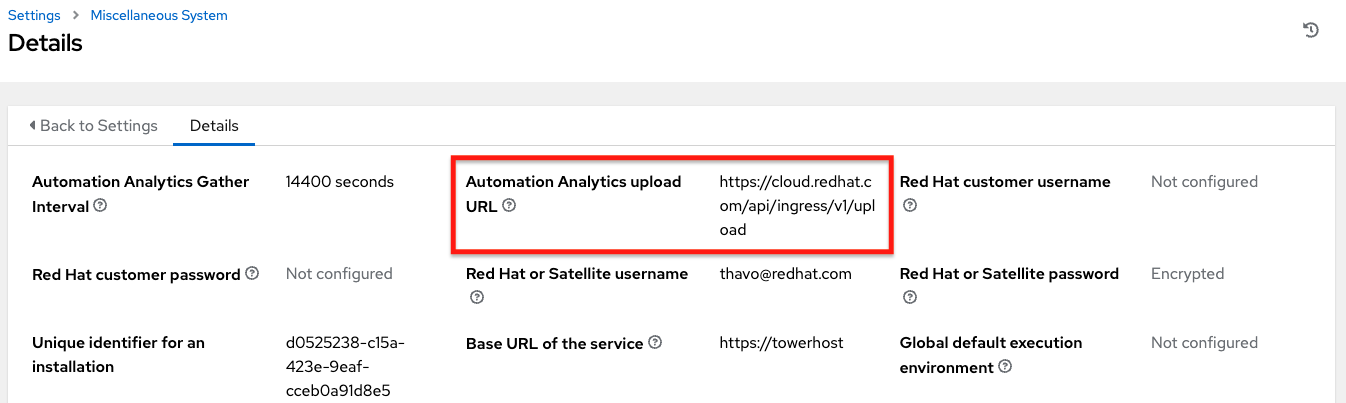
By default, the data is collected every four hours. When you enable this feature, data is collected up to a month in arrears (or until the previous collection). You can turn off this data collection at any time in the Miscellaneous System settings of the System configuration window.
This setting can also be enabled through the API by specifying INSIGHTS_TRACKING_STATE = true in either of these endpoints:
-
api/v2/settings/all -
api/v2/settings/system
The Automation Analytics generated from this data collection can be found on the Red Hat Cloud Services portal.
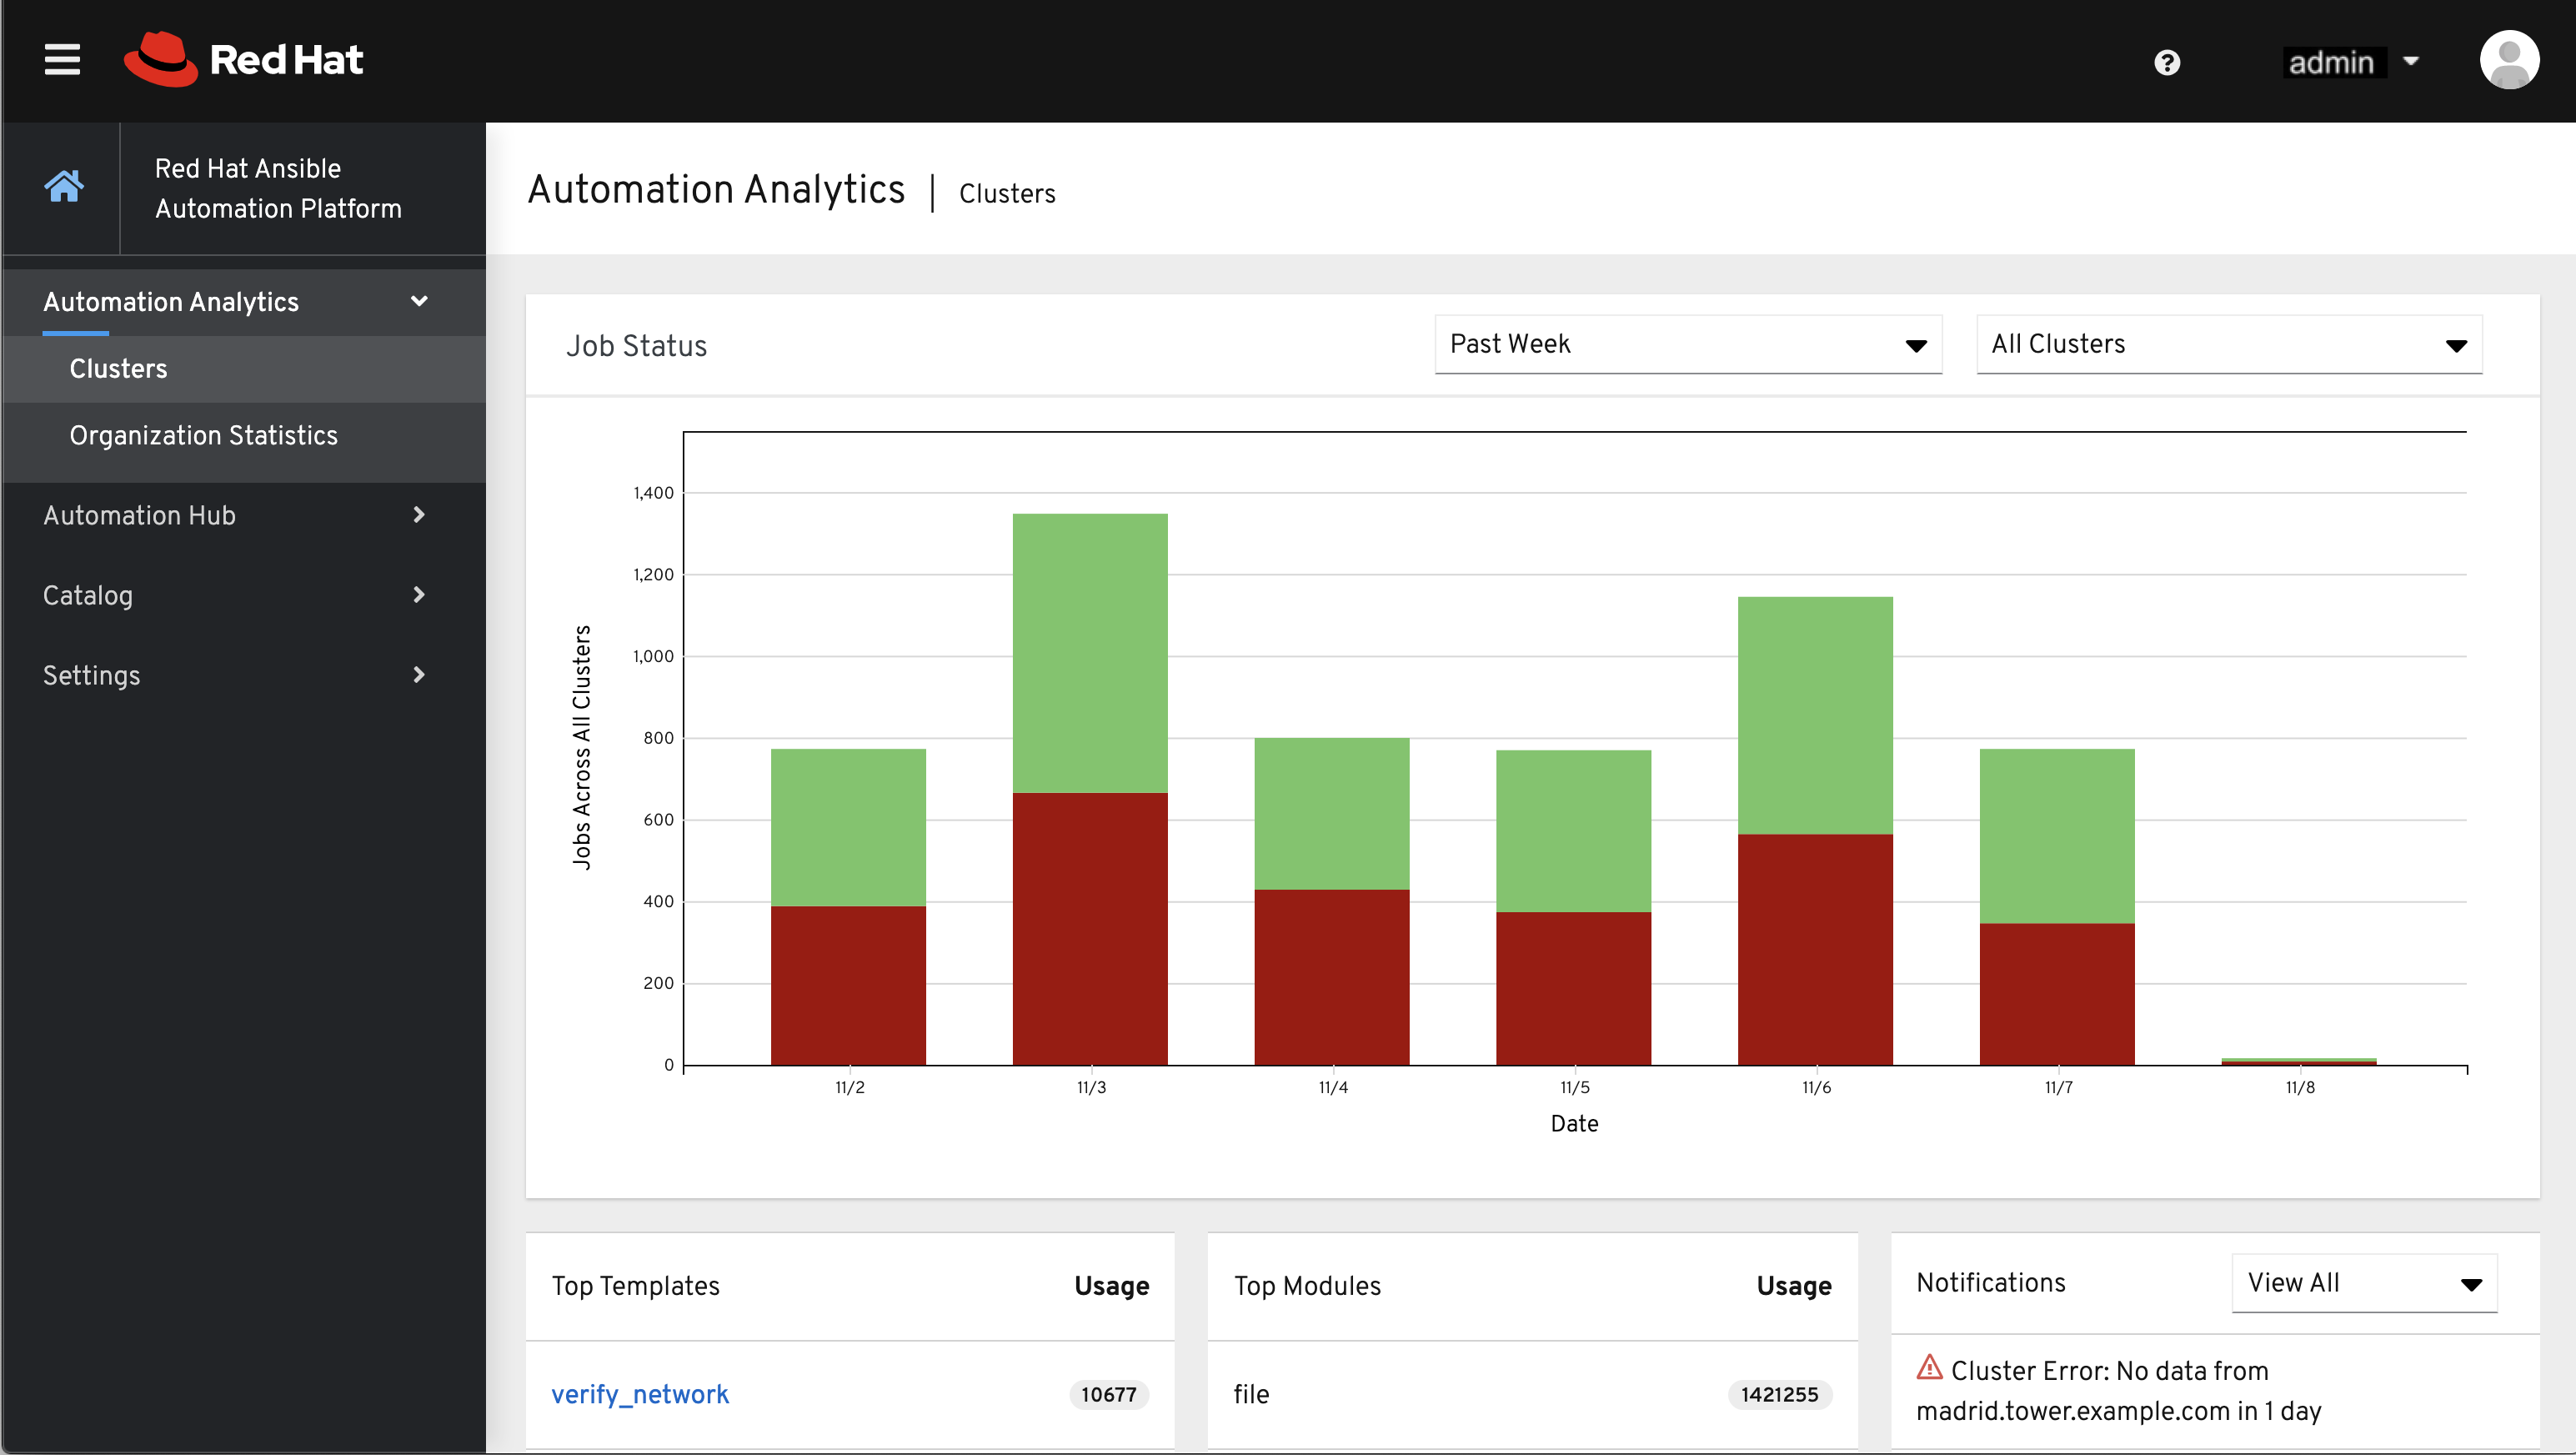
Clusters data is the default view. This graph represents the number of job runs across all automation controller clusters over a period of time. The previous example shows a span of a week in a stacked bar-style chart that is organized by the number of jobs that ran successfully (in green) and jobs that failed (in red).
Alternatively, you can select a single cluster to view its job status information.
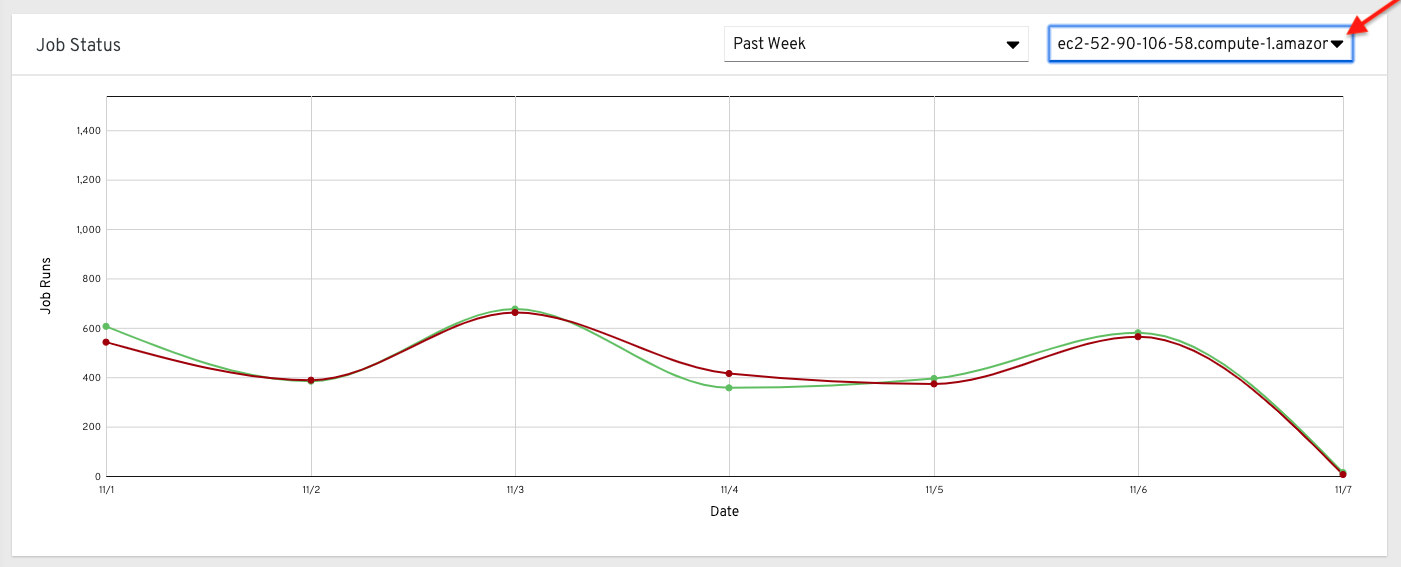
This multi-line chart represents the number of job runs for a single automation controller cluster for a specified period of time. The preceding example shows a span of a week, organized by the number of successfully running jobs (in green) and jobs that failed (in red). You can specify the number of successful and failed job runs for a selected cluster over a span of one week, two weeks, and monthly increments.
On the clouds navigation panel, select to view information for the following:
27.2.1. Use by organization
The following chart represents the number of tasks run inside all jobs by a particular organization.
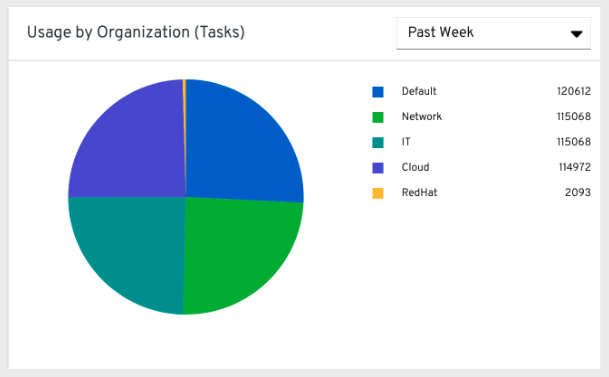
27.2.2. Job runs by organization
This chart represents automation controller use across all automation controller clusters by organization, calculated by the number of jobs run by that organization.
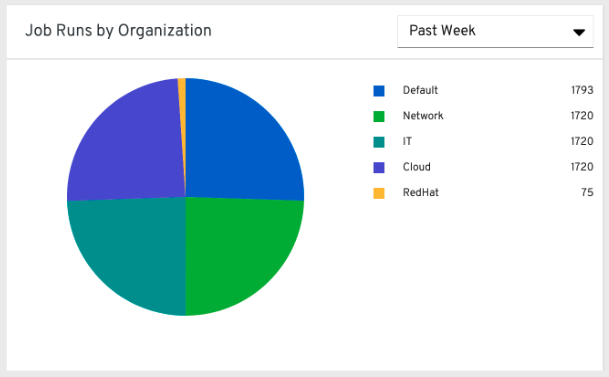
27.2.3. Organization status
This bar chart represents automation controller use by organization and date, which is calculated by the number of jobs run by that organization on a particular date.
Alternatively, you can specify to show the number of job runs per organization in one week, two weeks, and monthly increments.
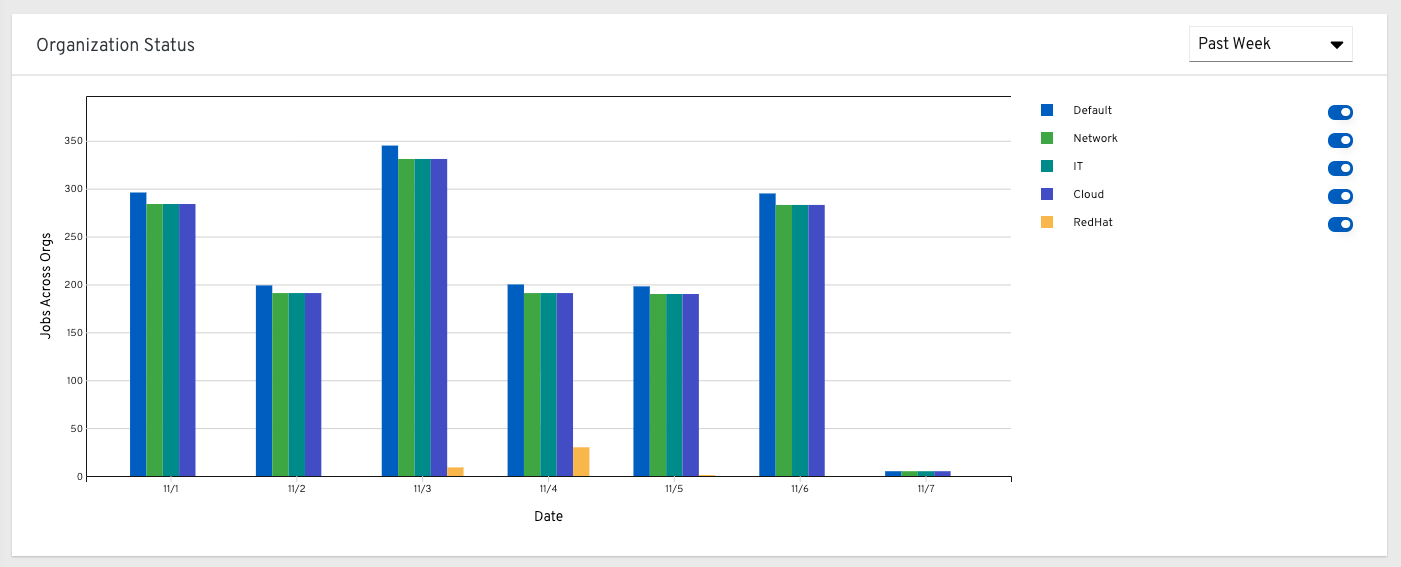
27.3. Details of data collection
Automation Analytics collects the following classes of data from automation controller:
- Basic configuration, such as which features are enabled, and what operating system is being used
- Topology and status of the automation controller environment and hosts, including capacity and health
Counts of automation resources:
- organizations, teams, and users
- inventories and hosts
- credentials (indexed by type)
- projects (indexed by type)
- templates
- schedules
- active sessions
- running and pending jobs
- Job execution details (start time, finish time, launch type, and success)
- Automation task details (success, host id, playbook/role, task name, and module used)
You can use awx-manage gather_analytics (without --ship) to inspect the data that automation controller sends, so that you can satisfy your data collection concerns. This creates a tarball that contains the analytics data that is sent to Red Hat.
This file contains a number of JSON and CSV files. Each file contains a different set of analytics data.
- manifest.json
- config.json
- instance_info.json
- counts.json
- org_counts.json
- cred_type_counts.json
- inventory_counts.json
- projects_by_scm_type.json
- query_info.json
- job_counts.json
- job_instance_counts.json
- unified_job_template_table.csv
- unified_jobs_table.csv
- workflow_job_template_node_table.csv
- workflow_job_node_table.csv
- events_table.csv
27.3.1. manifest.json
manifest.json is the manifest of the analytics data. It describes each file included in the collection, and what version of the schema for that file is included.
The following is an example manifest.json file:
  "config.json": "1.1",
  "counts.json": "1.0",
  "cred_type_counts.json": "1.0",
  "events_table.csv": "1.1",
  "instance_info.json": "1.0",
  "inventory_counts.json": "1.2",
  "job_counts.json": "1.0",
  "job_instance_counts.json": "1.0",
  "org_counts.json": "1.0",
  "projects_by_scm_type.json": "1.0",
  "query_info.json": "1.0",
  "unified_job_template_table.csv": "1.0",
  "unified_jobs_table.csv": "1.0",
  "workflow_job_node_table.csv": "1.0",
  "workflow_job_template_node_table.csv": "1.0"
}
27.3.2. config.json
The config.json file contains a subset of the configuration endpoint /api/v2/config from the cluster. An example config.json is:
{
    "ansible_version": "2.9.1",
    "authentication_backends": [
        "social_core.backends.azuread.AzureADOAuth2",
        "django.contrib.auth.backends.ModelBackend"
    ],
    "external_logger_enabled": true,
    "external_logger_type": "splunk",
    "free_instances": 1234,
    "install_uuid": "d3d497f7-9d07-43ab-b8de-9d5cc9752b7c",
    "instance_uuid": "bed08c6b-19cc-4a49-bc9e-82c33936e91b",
    "license_expiry": 34937373,
    "license_type": "enterprise",
    "logging_aggregators": [
        "awx",
        "activity_stream",
        "job_events",
        "system_tracking"
    ],
    "pendo_tracking": "detailed",
    "platform": {
        "dist": [
            "redhat",
            "7.4",
            "Maipo"
        ],
        "release": "3.10.0-693.el7.x86_64",
        "system": "Linux",
        "type": "traditional"
    },
    "total_licensed_instances": 2500,
    "controller_url_base": "https://ansible.rhdemo.io",
    "controller_version": "3.6.3"
}
Which includes the following fields:
- ansible_version: The system Ansible version on the host
- authentication_backends: The user authentication backends that are available. For more information, see Setting up social authentication or Setting up LDAP authentication.
- external_logger_enabled: Whether external logging is enabled
- external_logger_type: What logging backend is in use if enabled. For more information, see Logging and aggregation.
- logging_aggregators: What logging categories are sent to external logging. For more information, see Logging and aggregation.
- free_instances: How many hosts are available in the license. A value of zero means the cluster is fully consuming its license.
- install_uuid: A UUID for the installation (identical for all cluster nodes)
- instance_uuid: A UUID for the instance (different for each cluster node)
- license_expiry: Time to expiry of the license, in seconds
- license_type: The type of the license (should be 'enterprise' for most cases)
-
pendo_tracking: State of
usability_data_collection - platform: The operating system the cluster is running on
- total_licensed_instances: The total number of hosts in the license
- controller_url_base: The base URL for the cluster used by clients (shown in Automation Analytics)
- controller_version: Version of the software on the cluster
27.3.3. instance_info.json
The instance_info.json file contains detailed information on the instances that make up the cluster, organized by instance UUID.
The following is an example instance_info.json file:
{
    "bed08c6b-19cc-4a49-bc9e-82c33936e91b": {
        "capacity": 57,
        "cpu": 2,
        "enabled": true,
        "last_isolated_check": "2019-08-15T14:48:58.553005+00:00",
        "managed_by_policy": true,
        "memory": 8201400320,
        "uuid": "bed08c6b-19cc-4a49-bc9e-82c33936e91b",
        "version": "3.6.3"
    }
    "c0a2a215-0e33-419a-92f5-e3a0f59bfaee": {
        "capacity": 57,
        "cpu": 2,
        "enabled": true,
        "last_isolated_check": "2019-08-15T14:48:58.553005+00:00",
        "managed_by_policy": true,
        "memory": 8201400320,
        "uuid": "c0a2a215-0e33-419a-92f5-e3a0f59bfaee",
        "version": "3.6.3"
    }
}
Which includes the following fields:
- capacity: The capacity of the instance for executing tasks.
- cpu: Processor cores for the instance
- memory: Memory for the instance
- enabled: Whether the instance is enabled and accepting tasks
- managed_by_policy: Whether the instance’s membership in instance groups is managed by policy, or manually managed
- version: Version of the software on the instance
27.3.4. counts.json
The counts.json file contains the total number of objects for each relevant category in a cluster.
The following is an example counts.json file:
{
    "active_anonymous_sessions": 1,
    "active_host_count": 682,
    "active_sessions": 2,
    "active_user_sessions": 1,
    "credential": 38,
    "custom_inventory_script": 2,
    "custom_virtualenvs": 4,
    "host": 697,
    "inventories": {
        "normal": 20,
        "smart": 1
    },
    "inventory": 21,
    "job_template": 78,
    "notification_template": 5,
    "organization": 10,
    "pending_jobs": 0,
    "project": 20,
    "running_jobs": 0,
    "schedule": 16,
    "team": 5,
    "unified_job": 7073,
    "user": 28,
    "workflow_job_template": 15
}
Each entry in this file is for the corresponding API objects in /api/v2, with the exception of the active session counts.
27.3.5. org_counts.json
The org_counts.json file contains information on each organization in the cluster, and the number of users and teams associated with that organization.
The following is an example org_counts.json file:
{
    "1": {
        "name": "Operations",
        "teams": 5,
        "users": 17
    },
    "2": {
        "name": "Development",
        "teams": 27,
        "users": 154
    },
    "3": {
        "name": "Networking",
        "teams": 3,
        "users": 28
    }
}
27.3.6. cred_type_counts.json
The cred_type_counts.json file contains information on the different credential types in the cluster, and how many credentials exist for each type.
The following is an example cred_type_counts.json file:
{
    "1": {
        "credential_count": 15,
        "managed_by_controller": true,
        "name": "Machine"
    },
    "2": {
        "credential_count": 2,
        "managed_by_controller": true,
        "name": "Source Control"
    },
    "3": {
        "credential_count": 3,
        "managed_by_controller": true,
        "name": "Vault"
    },
    "4": {
        "credential_count": 0,
        "managed_by_controller": true,
        "name": "Network"
    },
    "5": {
        "credential_count": 6,
        "managed_by_controller": true,
        "name": "Amazon Web Services"
    },
    "6": {
        "credential_count": 0,
        "managed_by_controller": true,
        "name": "OpenStack"
    },
27.3.7. inventory_counts.json
The inventory_counts.json file contains information on the different inventories in the cluster.
The following is an example inventory_counts.json file:
{
    "1": {
        "hosts": 211,
        "kind": "",
        "name": "AWS Inventory",
        "source_list": [
            {
                "name": "AWS",
                "num_hosts": 211,
                "source": "ec2"
            }
        ],
        "sources": 1
    },
    "2": {
        "hosts": 15,
        "kind": "",
        "name": "Manual inventory",
        "source_list": [],
        "sources": 0
    },
    "3": {
        "hosts": 25,
        "kind": "",
        "name": "SCM inventory - test repo",
        "source_list": [
            {
                "name": "Git source",
                "num_hosts": 25,
                "source": "scm"
            }
        ],
        "sources": 1
    }
    "4": {
        "num_hosts": 5,
        "kind": "smart",
        "name": "Filtered AWS inventory",
        "source_list": [],
        "sources": 0
    }
}
27.3.8. projects_by_scm_type.json
The projects_by_scm_type.json file provides a breakdown of all projects in the cluster, by source control type.
The following is an example projects_by_scm_type.json file:
{
    "git": 27,
    "hg": 0,
    "insights": 1,
    "manual": 0,
    "svn": 0
}
27.3.9. query_info.json
The query_info.json file provides details on when and how the data collection happened.
The following is an example query_info.json file:
{
    "collection_type": "manual",
    "current_time": "2019-11-22 20:10:27.751267+00:00",
    "last_run": "2019-11-22 20:03:40.361225+00:00"
}
collection_type is one of manual or automatic.
27.3.10. job_counts.json
The job_counts.json file provides details on the job history of the cluster, describing both how jobs were launched, and what their finishing status is.
The following is an example job_counts.json file:
    "launch_type": {
        "dependency": 3628,
        "manual": 799,
        "relaunch": 6,
        "scheduled": 1286,
        "scm": 6,
        "workflow": 1348
    },
    "status": {
        "canceled": 7,
        "failed": 108,
        "successful": 6958
    },
    "total_jobs": 7073
}
27.3.11. job_instance_counts.json
The job_instance_counts.json file provides the same detail as job_counts.json, broken down by instance.
The following is an example job_instance_counts.json file:
{
    "localhost": {
        "launch_type": {
            "dependency": 3628,
            "manual": 770,
            "relaunch": 3,
            "scheduled": 1009,
            "scm": 6,
            "workflow": 1336
        },
        "status": {
            "canceled": 2,
            "failed": 60,
            "successful": 6690
        }
    }
}
Note that instances in this file are by hostname, not by UUID as they are in instance_info.
27.3.12. unified_job_template_table.csv
The unified_job_template_table.csv file provides information on job templates in the system. Each line contains the following fields for the job template:
- id: Job template id.
- name: Job template name.
- polymorphic_ctype_id: The id of the type of template it is.
-
model: The name of the
polymorphic_ctype_idfor the template. Examples includeproject,systemjobtemplate,jobtemplate,inventorysource, andworkflowjobtemplate. - created: When the template was created.
- modified: When the template was last updated.
-
created_by_id: The
useridthat created the template. Blank if done by the system. -
modified_by_id: The
useridthat last modified the template. Blank if done by the system. - current_job_id: Currently executing job id for the template, if any.
- last_job_id: Last execution of the job.
- last_job_run: Time of last execution of the job.
-
last_job_failed: Whether the
last_job_idfailed. -
status: Status of
last_job_id. - next_job_run: Next scheduled execution of the template, if any.
-
next_schedule_id: Schedule id for
next_job_run, if any.
27.3.13. unified_jobs_table.csv
The unified_jobs_table.csv file provides information on jobs run by the system.
Each line contains the following fields for a job:
- id: Job id.
- name: Job name (from the template).
- polymorphic_ctype_id: The id of the type of job it is.
-
model: The name of the
polymorphic_ctype_idfor the job. Examples includejobandworkflow. - organization_id: The organization ID for the job.
-
organization_name: Name for the
organization_id. - created: When the job record was created.
- started: When the job started executing.
- finished: When the job finished.
- elapsed: Elapsed time for the job in seconds.
- unified_job_template_id: The template for this job.
-
launch_type: One of
manual,scheduled,relaunched,scm,workflow, ordependency. - schedule_id: The id of the schedule that launched the job, if any,
- instance_group_id: The instance group that executed the job.
- execution_node: The node that executed the job (hostname, not UUID).
- controller_node: The automation controller node for the job, if run as an isolated job, or in a container group.
- cancel_flag: Whether the job was canceled.
- status: Status of the job.
- failed: Whether the job failed.
- job_explanation: Any additional detail for jobs that failed to execute properly.
- forks: Number of forks executed for this job.
27.3.14. workflow_job_template_node_table.csv
The workflow_job_template_node_table.csv file provides information on the nodes defined in workflow job templates on the system.
Each line contains the following fields for a worfklow job template node:
- id: Node id.
- created: When the node was created.
- modified: When the node was last updated.
- unified_job_template_id: The id of the job template, project, inventory, or other parent resource for this node.
- workflow_job_template_id: The workflow job template that contains this node.
- inventory_id: The inventory used by this node.
- success_nodes: Nodes that are triggered after this node succeeds.
- failure_nodes: Nodes that are triggered after this node fails.
- always_nodes: Nodes that always are triggered after this node finishes.
- all_parents_must_converge: Whether this node requires all its parent conditions satisfied to start.
27.3.15. workflow_job_node_table.csv
The workflow_job_node_table.csv provides information on the jobs that have been executed as part of a workflow on the system.
Each line contains the following fields for a job run as part of a workflow:
- id: Node id.
- created: When the node was created.
- modified: When the node was last updated.
- job_id: The job id for the job run for this node.
- unified_job_template_id: The id of the job template, project, inventory, or other parent resource for this node.
- workflow_job_template_id: The workflow job template that contains this node.
- inventory_id: The inventory used by this node.
- success_nodes: Nodes that are triggered after this node succeeds.
- failure_nodes: Nodes that are triggered after this node fails.
- always_nodes: Nodes that always are triggered after this node finishes.
- do_not_run: Nodes that were not run in the workflow due to their start conditions not being triggered.
- all_parents_must_converge: Whether this node requires all its parent conditions satisfied to start.
27.3.16. events_table.csv
The events_table.csv file provides information on all job events from all job runs in the system.
Each line contains the following fields for a job event:
- id: Event id.
- uuid: Event UUID.
- created: When the event was created.
- parent_uuid: The parent UUID for this event, if any.
- event: The Ansible event type.
-
task_action: The module associated with this event, if any (such as
commandoryum). -
failed: Whether the event returned
failed. -
changed: Whether the event returned
changed. - playbook: Playbook associated with the event.
- play: Play name from playbook.
- task: Task name from playbook.
- role: Role name from playbook.
- job_id: Id of the job this event is from.
- host_id: Id of the host this event is associated with, if any.
- host_name: Name of the host this event is associated with, if any.
- start: Start time of the task.
- end: End time of the task.
- duration: Duration of the task.
- warnings: Any warnings from the task or module.
- deprecations: Any deprecation warnings from the task or module.
27.4. Analytics Reports
Reports from collection are accessible through the automation controller UI if you have superuser-level permissions. By including the analytics view on-prem where it is most convenient, you can access data that can affect your day-to-day work. This data is aggregated from the automation provided on console.redhat.com.
Currently available is a view-only version of the Automation Calculator utility that shows a report that represents (possible) savings to the subscriber.
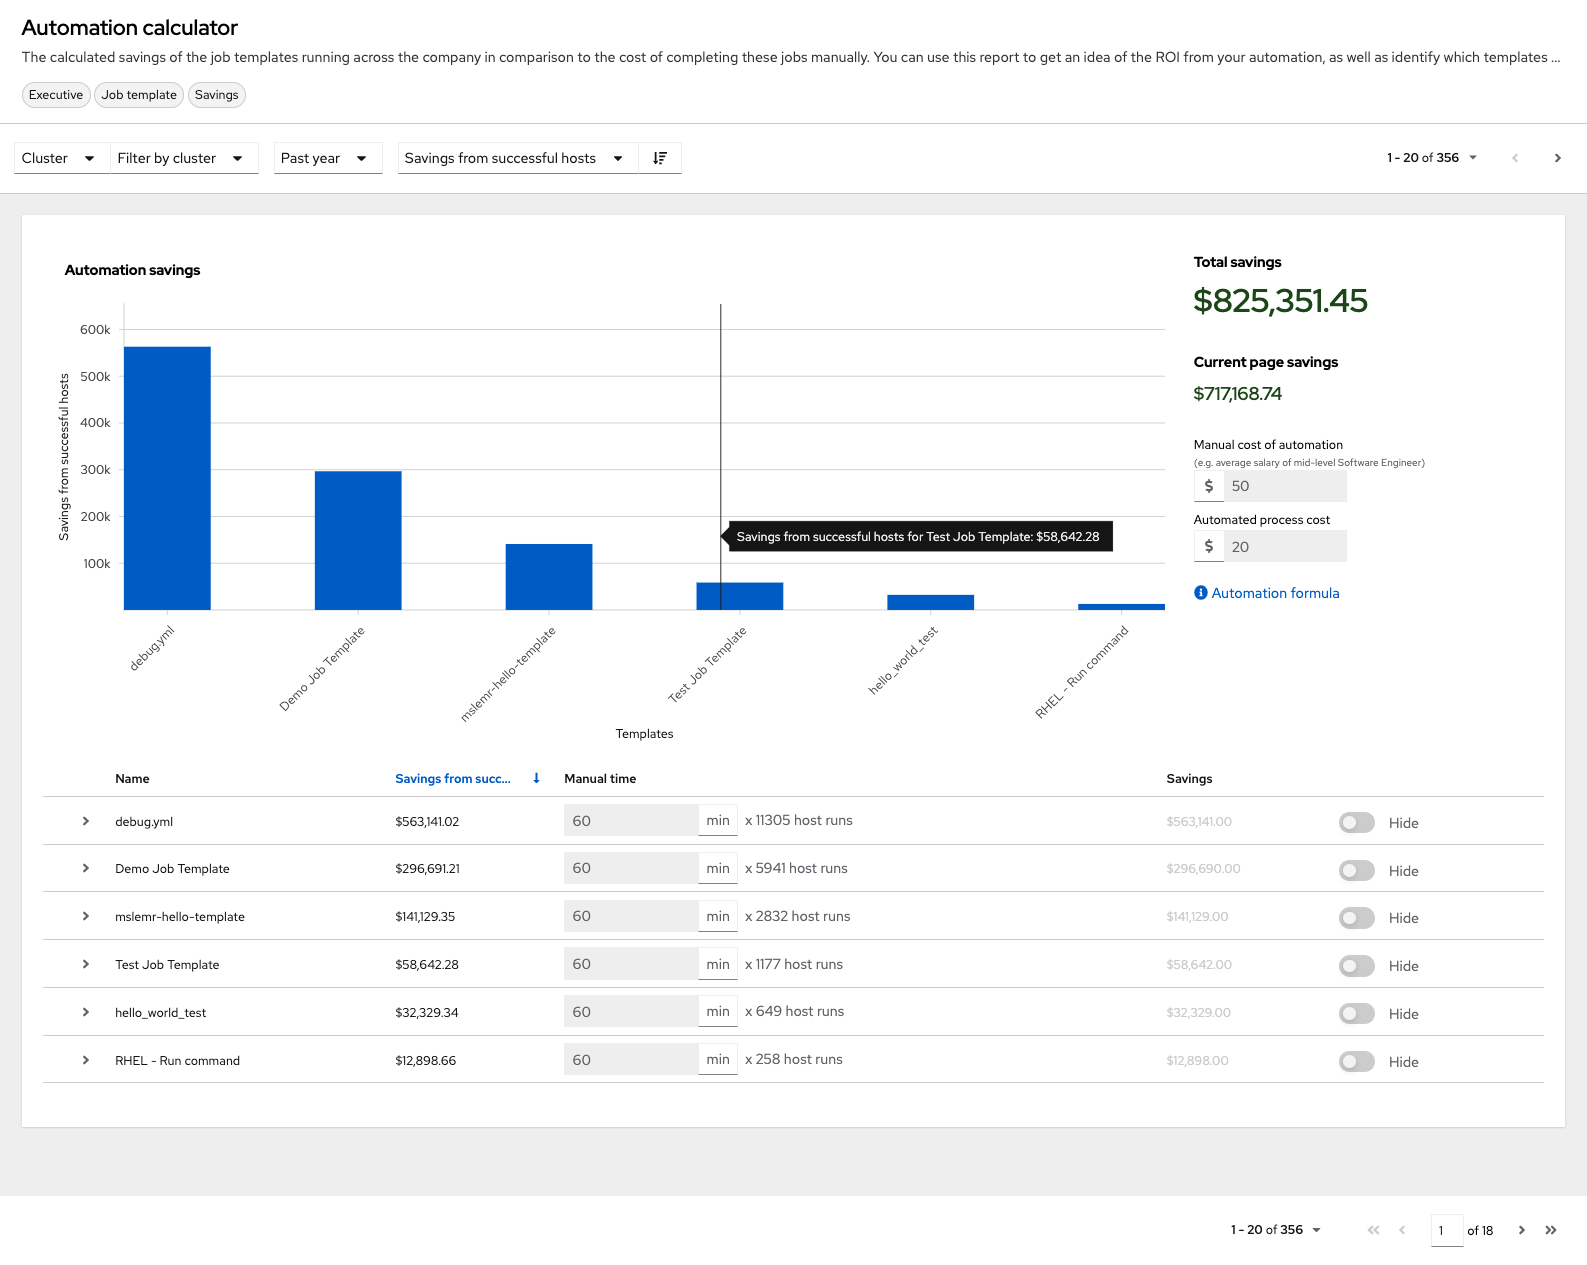
This option is available for technical preview and is subject to change in a future release. To preview the analytic reports view, set the Enable Preview of New User Interface toggle to On from the Miscellaneous System Settings option of the menu.
After saving, logout and log back in to access the options under the Analytics section on the navigation panel.
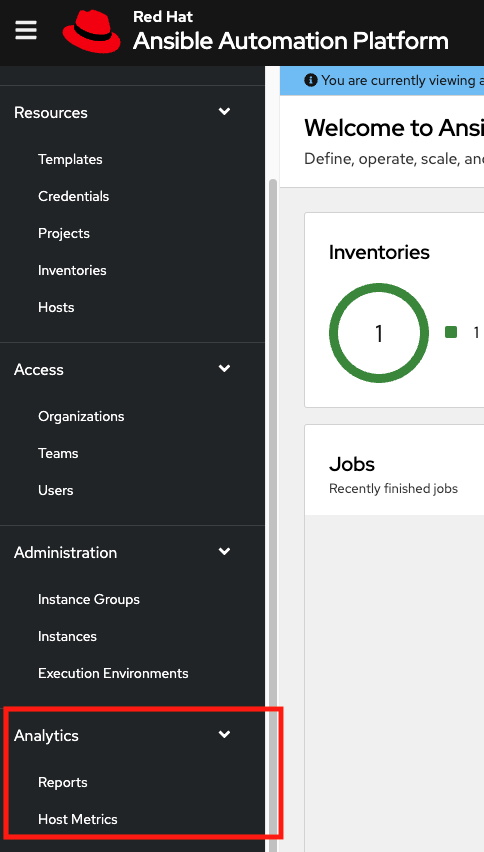
Host Metrics is another analytics report collected for host data. The ability to access this option from this part of the UI is currently in tech preview and is subject to change in a future release. For more information, see the Host Metrics view in Automation controller configuration.
Chapter 28. Troubleshooting automation controller
Useful troubleshooting information for automation controller.
28.1. Unable to connect to your host
If you are unable to run the helloworld.yml example playbook from the Managing projects section of the Getting started with automation controller guide or other playbooks due to host connection errors, try the following:
-
Can you
sshto your host? Ansible depends on SSH access to the servers you are managing. -
Are your
hostnamesand IPs correctly added in your inventory file? Check for typos.
28.2. Unable to login to automation controller through HTTP
Access to automation controller is intentionally restricted through a secure protocol (HTTPS). In cases where your configuration is set up to run an automation controller node behind a load balancer or proxy as "HTTP only", and you only want to access it without SSL (for troubleshooting, for example), you must add the following settings in the custom.py file located at /etc/tower/conf.d of your automation controller instance:
SESSION_COOKIE_SECURE = False
CSRF_COOKIE_SECURE = False
If you change these settings to false it enables automation controller to manage cookies and login sessions when using the HTTP protocol. You must do this on every node of a cluster installation.
To apply the changes, run:
automation-controller-service restart
28.3. Unable to run a playbook
If you are unable to run the helloworld.yml example playbook from the Managing projects section of the Getting started with automation controller guide due to playbook errors, try the following:
-
Ensure that you are authenticating with the user currently running the commands. If not, check how the username has been set up or pass the
--user=usernameor-u usernamecommands to specify a user. -
Is your YAML file correctly indented? You might need to line up your whitespace correctly. Indentation level is significant in YAML. You can use
yamlintto check your playbook.
28.4. Unable to run a job
If you are unable to run a job from a playbook, review the playbook YAML file. When importing a playbook, either manually or by a source control mechanism, keep in mind that the host definition is controlled by automation controller and should be set to hosts:all.
28.5. Playbooks do not show up in the Job Template list
If your playbooks are not showing up in the Job Template list, check the following:
- Ensure that the playbook is valid YML and can be parsed by Ansible.
-
Ensure that the permissions and ownership of the project path (
/var/lib/awx/projects) is set up so that the "awx" system user can view the files. Run the following command to change the ownership:
chown awx -R /var/lib/awx/projects/
28.6. Playbook stays in pending
If you are attempting to run a playbook job and it stays in the Pending state indefinitely, try the following actions:
-
Ensure that all supervisor services are running through
supervisorctl status. -
Ensure that the
/var/ partitionhas more than 1 GB of space available. Jobs do not complete with insufficient space on the/var/partition. -
Run
automation-controller-service restarton the automation controller server.
If you continue to have issues, run sosreport as root on the automation controller server, then file a support request with the result.
28.7. Reusing an external database causes installations to fail
Instances have been reported where reusing the external database during subsequent installation of nodes causes installation failures.
Example
You perform a clustered installation. Then, you need to do this again and perform a second clustered installation reusing the same external database, only this subsequent installation failed.
When setting up an external database that has been used in a prior installation, you must manually clear the database used for the clustered node before any additional installations can succeed.
28.8. Viewing private EC2 VPC instances in the automation controller inventory
By default, automation controller only shows instances in a VPC that have an Elastic IP (EIP) associated with them.
Procedure
- From the navigation panel, select → .
Select the group that has the Source set to AWS, and click the Source tab. In the Source variables field, enter:
vpc_destination_variable: private_ip_address
- Click and trigger an update of the group.
Once this is done you can see your VPC instances.
Automation controller must be running inside the VPC with access to those instances if you want to configure them.
Chapter 29. Automation controller tips and tricks
- Use the automation controller CLI Tool
- Change the automation controller Admin Password
- Create an automation controller Admin from the commandline
- Set up a jump host to use with automation controller
- View Ansible outputs for JSON commands when using automation controller
- Locate and configure the Ansible configuration file
- View a listing of all ansible_ variables
- The ALLOW_JINJA_IN_EXTRA_VARS variable
- Configure the controllerhost hostname for notifications
- Launch Jobs with curl
- Filter instances returned by the dynamic inventory sources in automation controller
- Use an unreleased module from Ansible source with automation controller
- Use callback plugins with automation controller
- Connect to Windows with winrm
- Import existing inventory files and host/group vars into automation controller
29.1. The automation controller CLI Tool
Automation controller has a full-featured command line interface.
For more information on configuration and use, see the AWX Command Line Interface and the AWX manage utility section.
29.2. Change the automation controller Administrator Password
During the installation process, you are prompted to enter an administrator password which is used for the admin superuser or system administrator created by automation controller. If you log into the instance using SSH, it tells you the default administrator password in the prompt.
If you need to change this password at any point, run the following command as root on the automation controller server:
awx-manage changepassword admin
Next, enter a new password. After that, the password you have entered works as the administrator password in the web UI.
To set policies at creation time for password validation using Django, see Django password policies.
29.3. Create an automation controller Administrator from the command line
Occasionally you might find it helpful to create a system administrator (superuser) account from the command line.
To create a superuser, run the following command as root on the automation controller server and enter the administrator information as prompted:
awx-manage createsuperuser
29.4. Set up a jump host to use with automation controller
Credentials supplied by automation controller do not flow to the jump host through ProxyCommand. They are only used for the end-node when the tunneled connection is set up.
You can configure a fixed user/keyfile in the AWX user’s SSH configuration in the ProxyCommand definition that sets up the connection through the jump host.
For example:
Host tampa
Hostname 10.100.100.11
IdentityFile [privatekeyfile]

Host 10.100..
Proxycommand ssh -W [jumphostuser]@%h:%p tampa
You can also add a jump host to your automation controller instance through Inventory variables.
These variables can be set at either the inventory, group, or host level. To add this, navigate to your inventory and in the variables field of whichever level you choose, add the following variables:
ansible_user: <user_name>
ansible_connection: ssh
ansible_ssh_common_args: '-o ProxyCommand="ssh -W %h:%p -q <user_name>@<jump_server_name>"'
29.5. View Ansible outputs for JSON commands when using automation controller
When working with automation controller, you can use the API to obtain the Ansible outputs for commands in JSON format.
To view the Ansible outputs, browse to https://<controller server name>/api/v2/jobs/<job_id>/job_events/
29.6. Locate and configure the Ansible configuration file
While Ansible does not require a configuration file, OS packages often include a default one in /etc/ansible/ansible.cfg for possible customization.
To use a custom ansible.cfg file, place it at the root of your project. Automation controller runs ansible-playbook from the root of the project directory, where it finds the custom ansible.cfg file.
An ansible.cfg file anywhere else in the project is ignored.
To learn which values you can use in this file, see Generating a sample ansible.cfg file.
Using the defaults are acceptable for starting out, but you can configure the default module path or connection type here, as well as other things.
Automation controller overrides some ansible.cfg options. For example, automation controller stores the SSH ControlMaster sockets, the SSH agent socket, and any other per-job run items in a per-job temporary directory that is passed to the container used for job execution.
29.7. View a listing of all ansible_ variables
By default, Ansible gathers "facts" about the machines under its management, accessible in Playbooks and in templates.
To view all facts available about a machine, run the setup module as an ad hoc action:
ansible -m setup hostname
This prints out a dictionary of all facts available for that particular host. For more information, see information-discovered-from-systems-facts.
29.8. The ALLOW_JINJA_IN_EXTRA_VARS variable
Setting ALLOW_JINJA_IN_EXTRA_VARS = template only works for saved job template extra variables.
Prompted variables and survey variables are excluded from the 'template'.
This parameter has three values:
-
templateto allow usage of Jinja saved directly on a job template definition (the default). -
neverto disable all Jinja usage (recommended). -
alwaysto always allow Jinja (strongly discouraged, but an option for prior compatibility).
This parameter is configurable in the Jobs Settings page of the automation controller UI.
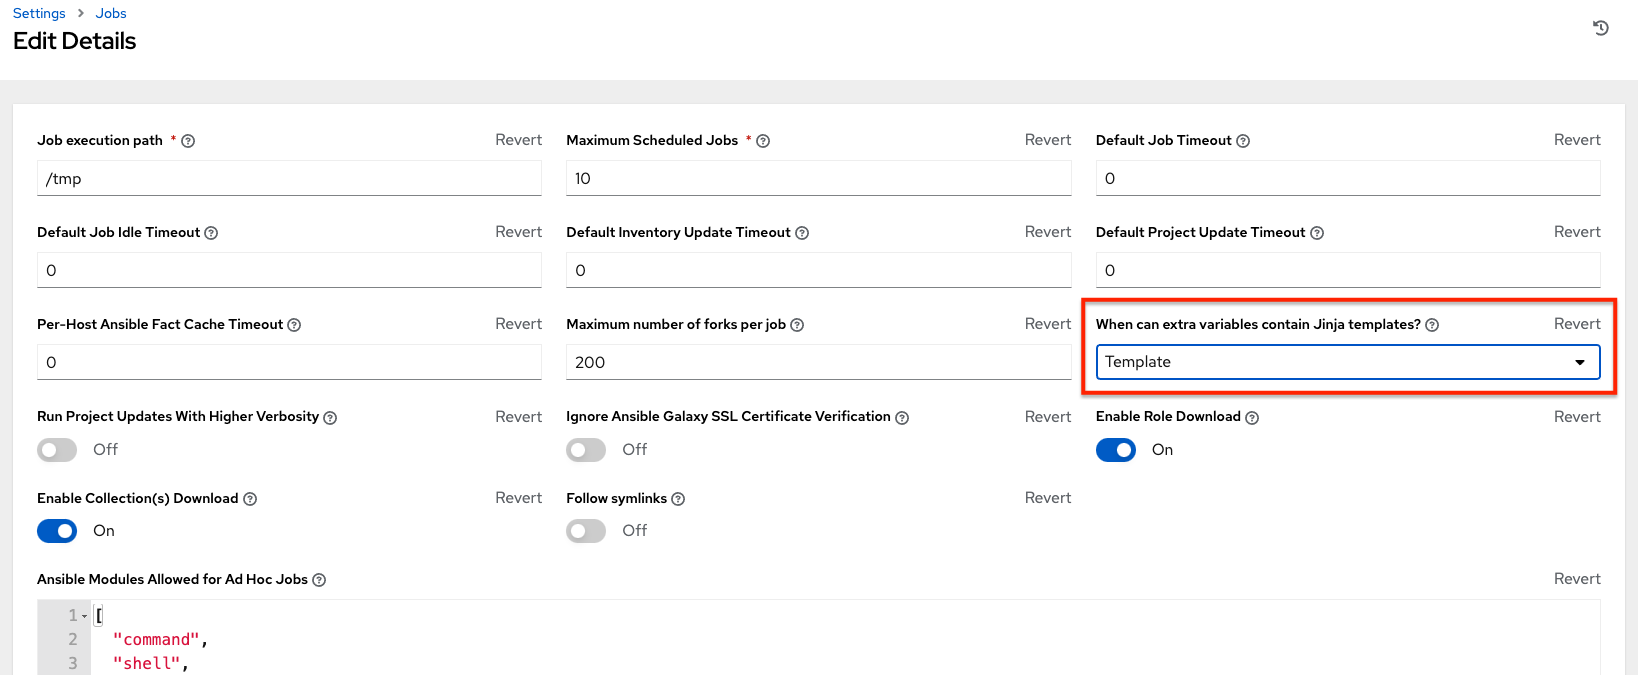
29.9. Configuring the controllerhost hostname for notifications
In System settings, you can replace https://controller.example.com in the Base URL of The Controller Host field with your preferred hostname to change the notification hostname.
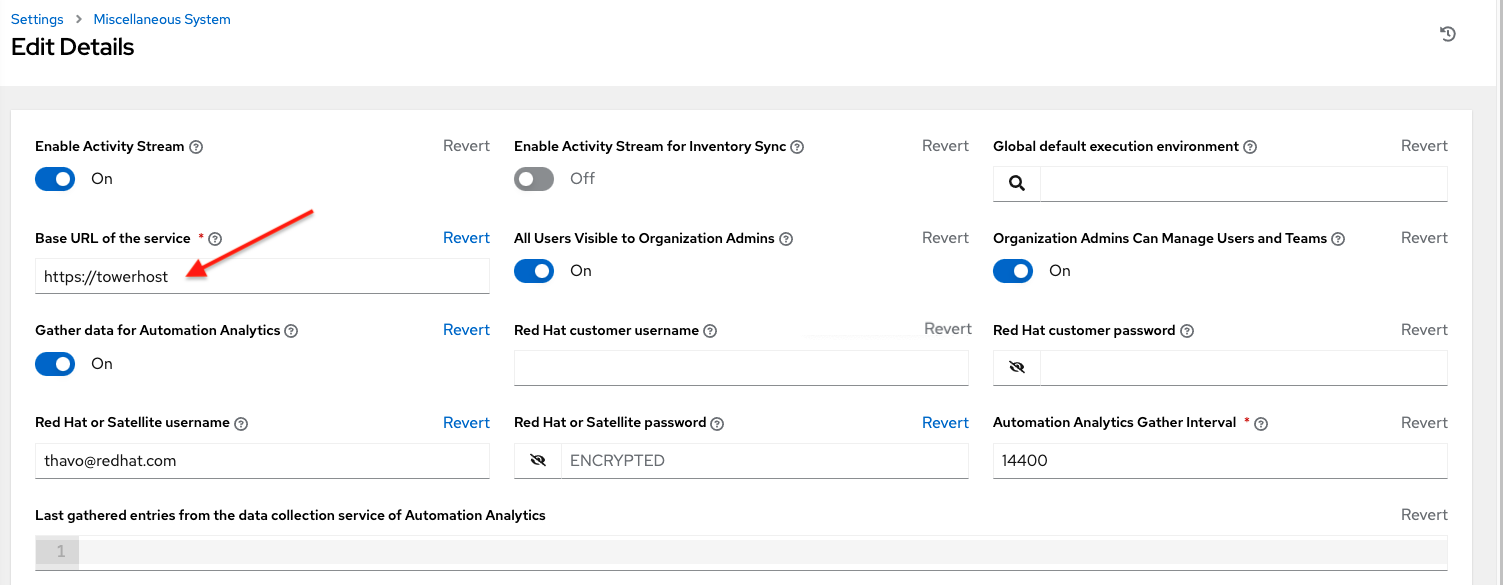
Refreshing your automation controller license also changes the notification hostname. New installations of automation controller need not set the hostname for notifications.
29.10. Launching Jobs with curl
Launching jobs with the automation controller API is simple.
The following are some easy to follow examples using the curl tool.
Assuming that your Job Template ID is '1', your controller IP is 192.168.42.100, and that admin and awxsecret are valid login credentials, you can create a new job this way:
curl -f -k -H 'Content-Type: application/json' -XPOST \
    --user admin:awxsecret \
    ht p://192.168.42.100/api/v2/job_templates/1/launch/
This returns a JSON object that you can parse and use to extract the 'id' field, which is the ID of the newly created job. You can also pass extra variables to the Job Template call, as in the following example:
curl -f -k -H 'Content-Type: application/json' -XPOST \
    -d '{"extra_vars": "{\"foo\": \"bar\"}"}' \
    --user admin:awxsecret http://192.168.42.100/api/v2/job_templates/1/launch/
The extra_vars parameter must be a string which contains JSON, not just a JSON dictionary. Use caution when escaping the quotes, etc.
29.11. Filtering instances returned by the dynamic inventory sources in the controller
By default, the dynamic inventory sources in automation controller (such as AWS and Google) return all instances available to the cloud credentials being used. They are automatically joined into groups based on various attributes. For example, AWS instances are grouped by region, by tag name, value, and security groups. To target specific instances in your environment, write your playbooks so that they target the generated group names.
For example:
---
- hosts: tag_Name_webserver
  tasks:
  ...
You can also use the Limit field in the Job Template settings to limit a playbook run to a certain group, groups, hosts, or a combination of them. The syntax is the same as the --limit parameter on the ansible-playbook command line.
You can also create your own groups by copying the auto-generated groups into your custom groups. Make sure that the Overwrite option is disabled on your dynamic inventory source, otherwise subsequent synchronization operations delete and replace your custom groups.
29.12. Use an unreleased module from Ansible source with automation controller
If there is a feature that is available in the latest Ansible core branch that you want to use with your automation controller system, making use of it in automation controller is simple.
First, determine which is the updated module you want to use from the available Ansible Core Modules or Ansible Extra Modules GitHub repositories.
Next, create a new directory, at the same directory level of your Ansible source playbooks, named /library.
When this is created, copy the module you want to use and drop it into the /library directory. It is consumed first by your system modules and can be removed once you have updated the stable version with your normal package manager.
29.13. Use callback plugins with automation controller
Ansible has a flexible method of handling actions during playbook runs, called callback plugins. You can use these plugins with automation controller to do things such as notify services upon playbook runs or failures, or send emails after every playbook run.
For official documentation on the callback plugin architecture, see Developing plugins.
Automation controller does not support the stdout callback plugin because Ansible only permits one, and it is already being used for streaming event data.
You might also want to review some example plugins, which should be modified for site-specific purposes, such as those available at: https://github.com/ansible/ansible/tree/devel/lib/ansible/plugins/callback
To use these plugins, put the callback plugin .py file into a directory called /callback_plugins alongside your playbook in your automation controller Project. Then, specify their paths (one path per line) in the Ansible Callback Plugins field of the Job settings:
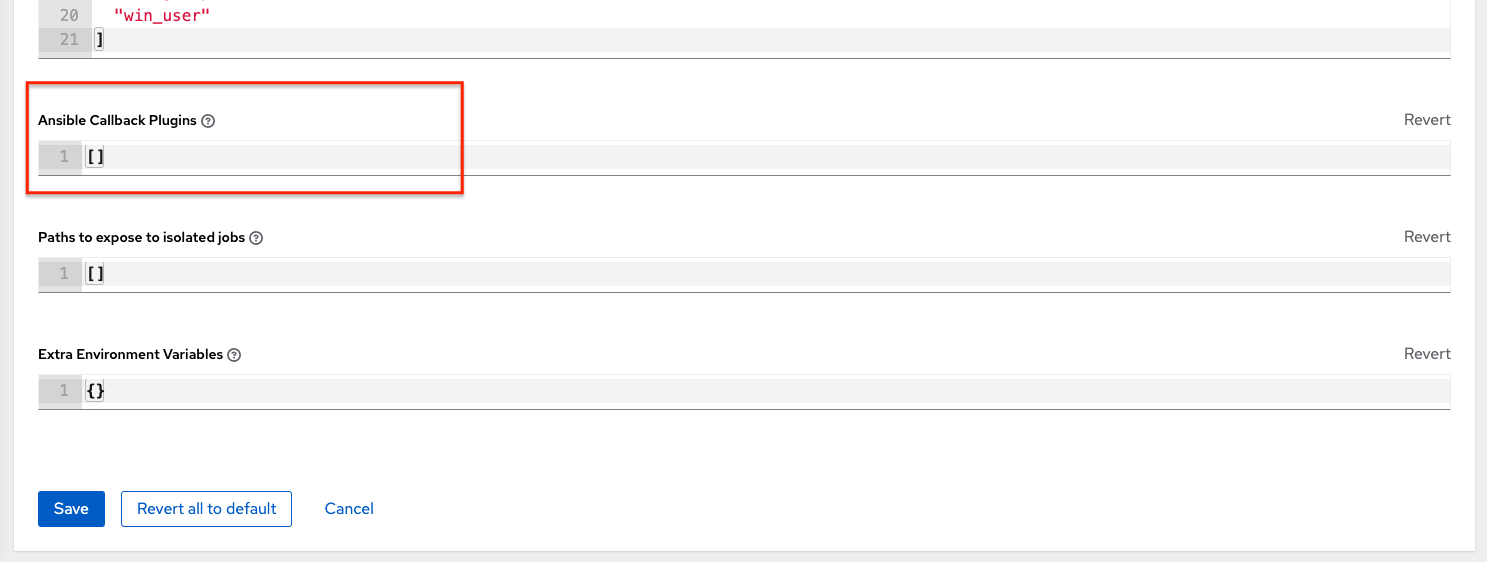
To have most callbacks shipped with Ansible applied globally, you must add them to the callback_whitelist section of your ansible.cfg.
If you have custom callbacks, see Enabling callback plugins.
29.14. Connect to Windows with winrm
By default, automation controller attempts to ssh to hosts.
You must add the winrm connection information to the group variables to which the Windows hosts belong.
To get started, edit the Windows group in which the hosts reside and place the variables in the source or edit screen for the group.
To add winrm connection info:
-
Edit the properties for the selected group by clicking on the Edit
 icon of the group name that contains the Windows servers. In the "variables" section, add your connection information as follows:
 ansible_connection: winrm
When complete, save your edits. If Ansible was previously attempting an SSH connection and failed, you should re-run the job template.
29.15. Import existing inventory files and host/group vars into automation controller
To import an existing static inventory and the accompanying host and group variables into automation controller, your inventory must be in a structure similar to the following:
inventory/
|-- group_vars
|   `-- mygroup
|-- host_vars
|   `-- myhost
`-- hosts
To import these hosts and vars, run the awx-manage command:
awx-manage inventory_import --source=inventory/ \
  --inventory-name="My Controller Inventory"
If you only have a single flat file of inventory, a file called ansible-hosts, for example, import it as follows:
awx-manage inventory_import --source=./ansible-hosts \
  --inventory-name="My Controller Inventory"
In case of conflicts or to overwrite an inventory named "My Controller Inventory", run:
awx-manage inventory_import --source=inventory/ \
  --inventory-name="My Controller Inventory" \
  --overwrite --overwrite-vars
If you receive an error, such as:
ValueError: need more than 1 value to unpack
Create a directory to hold the hosts file, as well as the group_vars:
mkdir -p inventory-directory/group_vars
Then, for each of the groups that have :vars listed, create a file called inventory-directory/group_vars/<groupname> and format the variables in YAML format.
The importer then handles the conversion correctly.