
2.2. History Database
2.2.1. Red Hat Enterprise Virtualization History Database
ovirt_engine_history) which tracks the engine database over time.
Important
2.2.2. Tracking Configuration History
ovirt-engine-dwhd, tracks three types of changes:
- A new entity is added to the engine database - the ETL Service replicates the change to the ovirt_engine_history database as a new entry.
- An existing entity is updated - the ETL Service replicates the change to the ovirt_engine_history database as a new entry.
- An entity is removed from the engine database - A new entry in the ovirt_engine_history database flags the corresponding entity as removed. Removed entities are only flagged as removed. To maintain correctness of historical reports and representations, they are not physically removed.
- a
history_idto indicate the configuration version of the entity; - a
create_datefield to indicate when the entity was added to the system; - an
update_datefield to indicate when the entity was changed; and - a
delete_datefield to indicate the date the entity was removed from the system.
2.2.3. Recording Statistical History
2.2.4. Application Settings for the Data Warehouse service in ovirt-engine-dwhd.conf
/usr/share/ovirt-engine-dwh/services/ovirt-engine-dwhd/ovirt-engine-dwhd.conf file. Configure any changes to the default values in an override file under /etc/ovirt-engine-dwh/ovirt-engine-dwhd.conf.d/. Restart the Data Warehouse service after saving the changes.
Table 2.1. ovirt-engine-dwhd.conf application settings variables
| Variable name | Default Value | Remarks |
|---|---|---|
DWH_DELETE_JOB_HOUR | 3 | The time at which a deletion job is run. Specify a value between 0 and 23, where 0 is midnight. |
DWH_SAMPLING | 60 | The interval, in seconds, at which data is collected into statistical tables. |
DWH_TABLES_KEEP_SAMPLES | 24 | The number of hours that data from DWH_SAMPLING is stored. Data more than two hours old is aggregated into hourly data. |
DWH_TABLES_KEEP_HOURLY | 1440 | The number of hours that hourly data is stored. The default is 60 days. Hourly data more than two days old is aggregated into daily data. |
DWH_TABLES_KEEP_DAILY | 43800 | The number of hours that daily data is stored. The default is five years. |
DWH_ERROR_EVENT_INTERVAL | 300000 | The minimum interval, in milliseconds, at which errors are pushed to the Manager's audit.log. |
2.2.5. Tracking Tag History
- A tag is created in the Administration Portal - the ETL Service copies the tag details, position in the tag tree and relation to other objects in the tag tree.
- A entity is attached to the tag tree in the Administration Portal - the ETL Service replicates the addition to the ovirt_engine_history database as a new entry.
- A tag is updated - the ETL Service replicates the change of tag details to the ovirt_engine_history database as a new entry.
- An entity or tag branch is removed from the Administration Portal - the ovirt_engine_history database flags the corresponding tag and relations as removed in new entries. Removed tags and relations are only flagged as removed or detached. In order to maintain correctness of historical reports and representations, they are not physically removed.
- A tag branch is moved - the corresponding tag and relations are updated as new entries. Moved tags and relations are only flagged as updated. In order to maintain correctness of historical reports and representations, they are not physically updated.
2.2.6. Allowing Read-Only Access to the History Database
To allow access to the history database without allowing edits, you must create a read-only PostgreSQL user that can log in to and read from the ovirt_engine_history database. This procedure must be executed on the system on which the history database is installed.
Procedure 2.1. Allowing Read-Only Access to the History Database
- Create the user to be granted read-only access to the history database:
# psql -U postgres -c "CREATE ROLE [user name] WITH LOGIN ENCRYPTED PASSWORD '[password]';" -d ovirt_engine_history
- Grant the newly created user permission to connect to the history database:
# psql -U postgres -c "GRANT CONNECT ON DATABASE ovirt_engine_history TO [user name];"
- Grant the newly created user usage of the
publicschema:# psql -U postgres -c "GRANT USAGE ON SCHEMA public TO [user name];" ovirt_engine_history
- Generate the rest of the permissions that will be granted to the newly created user and save them to a file:
# psql -U postgres -c "SELECT 'GRANT SELECT ON ' || relname || ' TO [user name];' FROM pg_class JOIN pg_namespace ON pg_namespace.oid = pg_class.relnamespace WHERE nspname = 'public' AND relkind IN ('r', 'v');" --pset=tuples_only=on ovirt_engine_history > grant.sql - Use the file you created in the previous step to grant permissions to the newly created user:
# psql -U postgres -f grant.sql ovirt_engine_history
- Remove the file you used to grant permissions to the newly created user:
# rm grant.sql
You can now access the ovirt_engine_history database with the newly created user using the following command:
# psql -U [user name] ovirt_engine_history
SELECT statements against tables and views in the ovirt_engine_history database succeed, while modifications fail.
2.2.7. Reports Examples
This example produces a resource utilization report for a single host. The resource utilization report provides CPU- and memory-usage percentage information from readings taken at one-minute intervals. This kind of report is useful for gaining insight into the load factor of an individual host over a short period of time. The report is defined by the following SQL query. Ensure the values provided for the host_name and history_datetime components of the where clause are substituted with the appropriate values for your environment and that the latest configuration is in use.
Example 2.1. Report query for resource utilization on a single host
 select history_datetime as DateTime, cpu_usage_percent as CPU, memory_usage_percent as Memory
    from host_configuration, host_samples_history
    where host_configuration.host_id = host_samples_history.host_id
    and host_name = 'example.labname.abc.company.com'
    and host_configuration.history_id in (select max(a.history_id)
    						from host_configuration as a
    						where host_configuration.host_id = a.host_id)
    and history_datetime >= '2011-07-01 18:45'
    and history_datetime <= '2011-07-31 21:45'
Table 2.2. Resource Utilization for a Single Host Example Data
| DateTime | CPU | Memory |
|---|---|---|
| 2010-07-01 18:45 | 42 | 0 |
| 2010-07-01 18:46 | 42 | 0 |
| 2010-07-01 18:47 | 42 | 1 |
| 2010-07-01 18:48 | 33 | 0 |
| 2010-07-01 18:49 | 33 | 0 |
| 2010-07-01 18:50 | 25 | 1 |

Figure 2.1. Single host utilization line graph
This example produces an aggregated resource utilization report across all hosts in the Red Hat Enterprise Virtualization Manager environment. Aggregated usage percentages for CPU and memory are shown with an hourly temporal resolution. This kind of report reveals utilization trends for the entire environment over a long period of time and is useful for capacity planning purposes. The following SQL query defines the report. Ensure the values provided for the history_datetime components of the where clause are substituted with appropriate values for your environment.
Example 2.2. Report query for resource utilization across all hosts
    select extract(hour from history_datetime) as Hour, avg(cpu_usage_percent) as CPU, avg(memory_usage_percent) as Memory
    from host_hourly_history
    where history_datetime >= '2011-07-01' and history_datetime < '2011-07-31'
    group by extract(hour from history_datetime)
    order by extract(hour from history_datetime)
Table 2.3. Resource utilization across all hosts example data
| Hour | CPU | Memory |
|---|---|---|
| 0 | 39 | 40 |
| 1 | 38 | 38 |
| 2 | 37 | 32 |
| 3 | 35 | 45 |
| 4 | 35 | 37 |
| 5 | 36 | 37 |
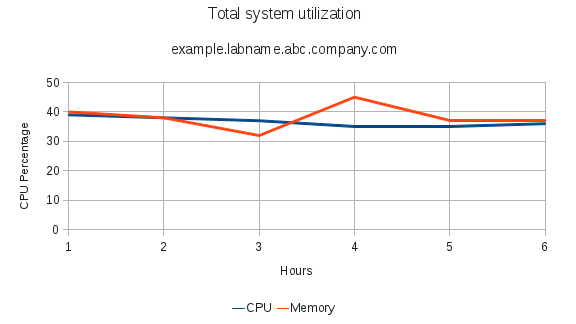
Figure 2.2. Total system utilization line graph
This example filters the latest virtual machine configuration list using the history tag tables. This kind of report demonstrates usage of the tags tree built in the Red Hat Enterprise Virtualization Manager to filter lists. The following SQL query defines this report. This query uses a predefined function that receives tag history IDs and returns the tag path with latest names of the tags in the Administration Portal. Ensure the values provided for the function result components of the where clause are substituted with appropriate values for your environment.
Example 2.3.
	SELECT vm_name
  FROM vm_configuration
		inner join latest_tag_relations_history on (vm_configuration.vm_id = latest_tag_relations_history.entity_id)
			inner join latest_tag_details on (latest_tag_details.tag_id = latest_tag_relations_history.parent_id)
 WHERE getpathinnames(latest_tag_details.history_id) like '/root/tlv%'
Table 2.4. Tag Filtering of Latest Virtual Machine Configuration
| vm_name |
|---|
| RHEL6-Pool-67 |
| RHEL6-Pool-5 |
| RHEL6-Pool-6 |
| RHEL6-23 |
This example produces a list of all current virtual machines names, types and operating systems in the Red Hat Enterprise Virtualization Manager environment. This kind of report demonstrates the usage of the ENUM table. The following SQL query defines this report:
Example 2.4.
SELECT 	vm_name, vm_type, operating_system
  FROM 	vm_configuration
		inner join enum_translator as vm_type_value on (vm_type_value.enum_type = 'VM_TYPE' and vm_configuration.vm_type = vm_type_value.enum_key)
		inner join enum_translator as os_value on (os_value.enum_type = 'OS_TYPE' and vm_configuration.operating_system = os_value.enum_key)
Table 2.5. Current Virtual Machines' Names, Types, and Operating Systems
| vm_name | vm_type | operating_system |
|---|---|---|
| RHEL6-Pool-2 | Desktop | RHEL 6 x64 |
| RHEL6-Pool-1 | Desktop | RHEL 6 x64 |
| RHEL6-Pool-3 | Desktop | RHEL 6 x64 |
| RHEL6-Pool-4 | Desktop | RHEL 6 x64 |
| RHEL6-Pool-5 | Desktop | RHEL 6 x64 |
2.2.8. Statistics History Views
2.2.8.1. Statistics History Views
2.2.8.2. Datacenter Statistics Views
Table 2.6. Historical Statistics for Each Data Center in the System
| Name | Type | Description |
|---|---|---|
| history_id | bigint | The unique ID of this row in the table. |
| history_datetime | timestamp with time zone | The timestamp of this history row (rounded to minute, hour, day as per the aggregation level). |
| datacenter_id | uuid | The unique ID of the data center. |
| datacenter_status | smallint |
|
| minutes_in_status | decimal | The total number of minutes that the data center was in the status shown in the datacenter_status column for the aggregation period. For example, if a data center was up for 55 minutes and in maintenance mode for 5 minutes during an hour, two rows will show for this hour. One will have a datacenter_status of Up and minutes_in_status of 55, the other will have a datacenter_status of Maintenance and a minutes_in_status of 5. |
| datacenter_configuration_version | integer | The data center configuration version at the time of sample. |
2.2.8.3. Storage Domain Statistics Views
Table 2.7. Historical Statistics for Each Storage Domain in the System
| Name | Type | Description |
|---|---|---|
| history_id | bigint | The unique ID of this row in the table. |
| history_datetime | timestamp with time zone | The timestamp of this history row (rounded to minute, hour, day as per the aggregation level). |
| storage_domain_id | uuid | Unique ID of the storage domain in the system. |
| available_disk_size_gb | integer | The total available (unused) capacity on the disk, expressed in gigabytes (GB). |
| used_disk_size_gb | integer | The total used capacity on the disk, expressed in gigabytes (GB). |
| storage_configuration_version | integer | The storage domain configuration version at the time of sample. |
| storage_domain_status | smallint | The storage domain status. |
| minutes_in_status | decimal | The total number of minutes that the storage domain was in the status shown state as shown in the status column for the aggregation period. For example, if a storage domain was "Active" for 55 minutes and "Inactive" for 5 minutes within an hour, two rows will be reported in the table for the same hour. One row will have a status of Active with minutes_in_status of 55, the other will have a status of Inactive and minutes_in_status of 5. |
2.2.8.4. Host Statistics Views
Table 2.8. Historical Statistics for Each Host in the System
| Name | Type | Description |
|---|---|---|
| history_id | bigint | The unique ID of this row in the table. |
| history_datetime | timestamp with time zone | The timestamp of this history row (rounded to minute, hour, day as per the aggregation level). |
| host_id | uuid | Unique ID of the host in the system. |
| host_status | smallint |
|
| minutes_in_status | decimal | The total number of minutes that the host was in the status shown in the status column for the aggregation period. For example, if a host was up for 55 minutes and down for 5 minutes during an hour, two rows will show for this hour. One will have a status of Up and minutes_in_status of 55, the other will have a status of Down and a minutes_in_status of 5. |
| memory_usage_percent | smallint | Percentage of used memory on the host. |
| max_memory_usage | smallint | The maximum memory usage for the aggregation period, expressed as a percentage. For hourly aggregations, this is the maximum collected sample value. For daily aggregations, it is the maximum hourly average value. |
| cpu_usage_percent | smallint | Used CPU percentage on the host. |
| max_cpu_usage | smallint | The maximum CPU usage for the aggregation period, expressed as a percentage. For hourly aggregations, this is the maximum collected sample value. For daily aggregations, it is the maximum hourly average value. |
| ksm_cpu_percent | smallint | CPU percentage ksm on the host is using. |
| max_ksm_cpu_percent | smallint | The maximum KSM usage for the aggregation period, expressed as a percentage. For hourly aggregations, this is the maximum collected sample value. For daily aggregations, it is the maximum hourly average value. |
| active_vms | smallint | The average number of active virtual machines for this aggregation. |
| max_active_vms | smallint | The maximum active number of virtual machines for the aggregation period. For hourly aggregations, this is the maximum collected sample value. For daily aggregations, it is the maximum hourly average value. |
| total_vms | smallint | The average number of all virtual machines on the host for this aggregation. |
| max_total_vms | smallint | The maximum total number of virtual machines for the aggregation period. For hourly aggregations, this is the maximum collected sample value. For daily aggregations, it is the maximum hourly average value. |
| total_vms_vcpus | smallint | Total number of VCPUs allocated to the host. |
| max_total_vms_vcpus | smallint | The maximum total virtual machine VCPU number for the aggregation period. For hourly aggregations, this is the maximum collected sample value. For daily aggregations, it is the maximum hourly average value. |
| cpu_load | smallint | The CPU load of the host. |
| max_cpu_load | smallint | The maximum CPU load for the aggregation period. For hourly aggregations, this is the maximum collected sample value. For daily aggregations, it is the maximum hourly average value. |
| system_cpu_usage_percent | smallint | Used CPU percentage on the host. |
| max_system_cpu_usage_percent | smallint | The maximum system CPU usage for the aggregation period, expressed as a percentage. For hourly aggregations, this is the maximum collected sample value. For daily aggregations, it is the maximum hourly average value. |
| user_cpu_usage_percent | smallint | Used user CPU percentage on the host. |
| max_user_cpu_usage_percent | smallint | The maximum user CPU usage for the aggregation period, expressed as a percentage. For hourly aggregations, this is the maximum collected sample value. For daily aggregations, it is the maximum hourly average value. |
| swap_used_mb | integer | Used swap size usage of the host in megabytes (MB). |
| max_swap_used_mb | integer | The maximum user swap size usage of the host for the aggregation period in megabytes (MB), expressed as a percentage. For hourly aggregations, this is the maximum collected sample value. For daily aggregations, it is the maximum hourly average value. |
| host_configuration_version | integer | The host configuration version at the time of sample. |
| ksm_shared_memory_mb | bigint | The Kernel Shared Memory size in megabytes (MB) that the host is using. |
| max_ksm_shared_memory_mb | bigint | The maximum KSM memory usage for the aggregation period expressed in megabytes (MB). For hourly aggregations, this is the maximum collected sample value. For daily aggregations, it is the maximum hourly average value. |
2.2.8.5. Host Interface Statistics Views
Table 2.9. Historical Statistics for Each Host Network Interface in the System
| Name | Type | Description |
|---|---|---|
| history_id | bigint | The unique ID of this row in the table. |
| history_datetime | timestamp with time zone | The timestamp of this history view (rounded to minute, hour, day as per the aggregation level). |
| host_interface_id | uuid | Unique identifier of the interface in the system. |
| receive_rate_percent | smallint | Used receive rate percentage on the host. |
| max_receive_rate_percent | smallint | The maximum receive rate for the aggregation period, expressed as a percentage. For hourly aggregations, this is the maximum collected sample value. For daily aggregations, it is the maximum hourly average value. |
| transmit_rate_percent | smallint | Used transmit rate percentage on the host. |
| max_transmit_rate_percent | smallint | The maximum transmit rate for the aggregation period, expressed as a percentage. For hourly aggregations, this is the maximum collected sample value. For daily aggregations, it is the maximum hourly average value. |
| host_interface_configuration_version | integer | The host interface configuration version at the time of sample. |
2.2.8.6. Virtual Machine Statistics Views
Table 2.10. Historical statistics for the virtual machines in the system
| Name | Type | Description |
|---|---|---|
| history_id | bigint | The unique ID of this row in the table. |
| history_datetime | timestamp with time zone | The timestamp of this history row (rounded to minute, hour, day as per the aggregation level). |
| vm_id | uuid | Unique ID of the virtual machine in the system. |
| vm_status | smallint |
|
| minutes_in_status | decimal | The total number of minutes that the virtual machine was in the status shown in the status column for the aggregation period. For example, if a virtual machine was up for 55 minutes and down for 5 minutes during an hour, two rows will show for this hour. One will have a status of Up and minutes_in_status, the other will have a status of Down and a minutes_in_status of 5. |
| cpu_usage_percent | smallint | The percentage of the CPU in use by the virtual machine. |
| max_cpu_usage | smallint | The maximum CPU usage for the aggregation period, expressed as a percentage. For hourly aggregations, this is the maximum collected sample value. For daily aggregations, it is the maximum hourly average value. |
| memory_usage_percent | smallint | Percentage of used memory in the virtual machine. The guest tools must be installed on the virtual machine for memory usage to be recorded. |
| max_memory_usage | smallint | The maximum memory usage for the aggregation period, expressed as a percentage. For hourly aggregations, this is the maximum collected sample value. For daily aggregations, it is the maximum hourly average value. The guest tools must be installed on the virtual machine for memory usage to be recorded. |
| user_cpu_usage_percent | smallint | Used user CPU percentage on the host. |
| max_user_cpu_usage_percent | smallint | The maximum user CPU usage for the aggregation period, expressed as a percentage. For hourly aggregations, this is the maximum collected sample value. For daily aggregation, it is the maximum hourly average value. |
| system_cpu_usage_percent | smallint | Used system CPU percentage on the host. |
| max_system_cpu_usage_percent | smallint | The maximum system CPU usage for the aggregation period, expressed as a percentage. For hourly aggregations, this is the maximum collected sample value. For daily aggregations, it is the maximum hourly average value. |
| vm_ip | varchar(255) | The IP address of the first NIC. Only shown if the guest agent is installed. |
| current_user_name | varchar(255) | Name of user logged into the virtual machine console, if a guest agent is installed. |
| currently_running_on_host | uuid | The unique ID of the host the virtual machine is running on. |
| vm_configuration_version | integer | The virtual machine configuration version at the time of sample. |
| current_host_configuration_version | integer | The current host the virtual machine is running on. |
| current_user_id | uuid | The unique ID of the user in the system. This ID is generated by the Manager. |
2.2.8.7. Virtual Machine Interface Statistics Views
Table 2.11. Historical Statistics for the Virtual Machine Network Interfaces in the System
| Name | Type | Description |
|---|---|---|
| history_id | bigint | The unique ID of this row in the table. |
| history_datetime | timestamp with time zone | The timestamp of this history row (rounded to minute, hour, day as per the aggregation level). |
| vm_interface_id | uuid | Unique identifier of the interface in the system. |
| receive_rate_percent | smallint | Used receive rate percentage on the host. |
| max_receive_rate_percent | smallint | The maximum receive rate for the aggregation period, expressed as a percentage. For hourly aggregations, this is the maximum collected sample value. For daily aggregations, it is the maximum hourly average value. |
| transmit_rate_percent | smallint | Used transmit rate percentage on the host. |
| max_transmit_rate_percent | smallint | The maximum transmit rate for the aggregation period, expressed as a percentage. For hourly aggregations, this is the maximum collected sample value. For daily aggregations, it is the maximum hourly average rate. |
| vm_interface_configuration_version | integer | The virtual machine interface configuration version at the time of sample. |
2.2.8.8. Virtual Machine Disk Statistics Views
Table 2.12. Historical Statistics for the Virtual Disks in the System
| Name | Type | Description |
|---|---|---|
| history_id | bigint | The unique ID of this row in the table. |
| history_datetime | timestamp with time zone | The timestamp of this history row (rounded to minute, hour, day as per the aggregation level). |
| vm_disk_id | uuid | Unique ID of the disk in the system. |
| vm_disk_status | integer |
|
| minutes_in_status | decimal | The total number of minutes that the virtual machine disk was in the status shown in the status column for the aggregation period. For example, if a virtual machine disk was locked for 55 minutes and OK for 5 minutes during an hour, two rows will show for this hour. One will have a status of Locked and minutes_in_status of 55, the other will have a status of OK and a minutes_in_status of 5. |
| vm_disk_actual_size_mb | integer | The actual size allocated to the disk. |
| read_rate_bytes_per_second | integer | Read rate to disk in bytes per second. |
| max_read_rate_bytes_per_second | integer | The maximum read rate for the aggregation period. For hourly aggregations, this is the maximum collected sample value. For daily aggregations, it is the maximum hourly average value. |
| read_latency_seconds | decimal | The virtual machine disk read latency measured in seconds. |
| max_read_latency_seconds | decimal | The maximum read latency for the aggregation period, measured in seconds. For hourly aggregations, this is the maximum collected sample value. For daily aggregations, it is the maximum hourly average value. |
| write_rate_bytes_per_second | integer | Write rate to disk in bytes per second. |
| max_write_rate_bytes_per_second | integer | The maximum write rate for the aggregation period. For hourly aggregations, this is the maximum collected sample value. For daily aggregations, it is the maximum hourly average value. |
| write_latency_seconds | decimal | The virtual machine disk write latency measured in seconds. |
| max_write_latency_seconds | decimal | The maximum write latency for the aggregation period, measured in seconds. For hourly aggregations, this is the maximum collected sample value. For daily aggregations, it is the maximum hourly average value. |
| flush_latency_seconds | decimal | The virtual machine disk flush latency measured in seconds. |
| max_flush_latency_seconds | decimal | The maximum flush latency for the aggregation period, measured in seconds. For hourly aggregations, this is the maximum collected sample value. For daily aggregations, it is the maximum hourly average value. |
| vm_disk_configuration_version | integer | The virtual machine disk configuration version at the time of sample. |
2.2.9. Configuration History Views
2.2.9.1. Configuration History Views
Note
delete_date does not appear in latest views because these views provide the latest configuration of living entities, which, by definition, have not been deleted.
2.2.9.2. Data Center Configuration
Table 2.13. v3_5_configuration_history_datacenters
| Name | Type | Description |
|---|---|---|
| history_id | integer | The ID of the configuration version in the history database. |
| datacenter_id | uuid | The unique ID of the data center in the system. |
| datacenter_name | varchar(40) | Name of the data center, as displayed in the edit dialog. |
| datacenter_description | varchar(4000) | Description of the data center, as displayed in the edit dialog. |
| storage_type | smallint |
|
| create_date | timestamp with time zone | The date this entity was added to the system. |
| update_date | timestamp with time zone | The date this entity was changed in the system. |
| delete_date | timestamp with time zone | The date this entity was deleted from the system. |
2.2.9.3. Datacenter Storage Domain Map
Table 2.14. v3_5_map_history_datacenters_storage_domains
| Name | Type | Description |
|---|---|---|
| history_id | integer | The ID of the configuration version in the history database. |
| storage_domain_id | uuid | The unique ID of this storage domain in the system. |
| datacenter_id | uuid | The unique ID of the data center in the system. |
| attach_date | timestamp with time zone | The date the storage domain was attached to the data center. |
| detach_date | timestamp with time zone | The date the storage domain was detached from the data center. |
2.2.9.4. Storage Domain Configuration
Table 2.15. v3_5_configuration_history_storage_domains
| Name | Type | Description |
|---|---|---|
| history_id | integer | The ID of the configuration version in the history database. |
| storage_domain_id | uuid | The unique ID of this storage domain in the system. |
| storage_domain_name | varchar(250) | Storage domain name. |
| storage_domain_type | smallint |
|
| storage_type | smallint |
|
| create_date | timestamp with time zone | The date this entity was added to the system. |
| update_date | timestamp with time zone | The date this entity was changed in the system. |
| delete_date | timestamp with time zone | The date this entity was deleted from the system. |
2.2.9.5. Cluster Configuration
Table 2.16. v3_5_configuration_history_clusters
| Name | Type | Description |
|---|---|---|
| history_id | integer | The ID of the configuration version in the history database. |
| cluster_id | uuid | The unique identifier of the datacenter this cluster resides in. |
| cluster_name | varchar(40) | Name of the cluster, as displayed in the edit dialog. |
| cluster_description | varchar(4000) | As defined in the edit dialog. |
| datacenter_id | uuid | The unique identifier of the datacenter this cluster resides in. |
| cpu_name | varchar(255) | As displayed in the edit dialog. |
| compatibility_version | varchar(40) | As displayed in the edit dialog. |
| datacenter_configuration_version | integer | The data center configuration version at the time of creation or update. |
| create_date | timestamp with time zone | The date this entity was added to the system. |
| update_date | timestamp with time zone | The date this entity was changed in the system. |
| delete_date | timestamp with time zone | The date this entity was deleted from the system. |
2.2.9.6. Host Configuration
Table 2.17. v3_5_configuration_history_hosts
| Name | Type | Description |
|---|---|---|
| history_id | integer | The ID of the configuration version in the history database. |
| host_id | uuid | The unique ID of the host in the system. |
| host_unique_id | varchar(128) | This field is a combination of the host physical UUID and one of its MAC addresses, and is used to detect hosts already registered in the system. |
| host_name | varchar(255) | Name of the host (same as in the edit dialog). |
| cluster_id | uuid | The unique ID of the cluster that this host belongs to. |
| host_type | smallint |
|
| fqdn_or_ip | varchar(255) | The host's DNS name or its IP address for Red Hat Enterprise Virtualization Manager to communicate with (as displayed in the edit dialog). |
| memory_size_mb | integer | The host's physical memory capacity, expressed in megabytes (MB). |
| swap_size_mb | integer | The host swap partition size. |
| cpu_model | varchar(255) | The host's CPU model. |
| number_of_cores | smallint | Total number of CPU cores in the host. |
| number_of_sockets | smallint | Total number of CPU sockets. |
| cpu_speed_mh | decimal | The host's CPU speed, expressed in megahertz (MHz). |
| host_os | varchar(255) | The host's operating system version. |
| pm_ip_address | varchar(255) | Power Management server IP address. |
| kernel_version | varchar(255) | The host's kernel version. |
| kvm_version | varchar(255) | The host's KVM version. |
| vdsm_version | varchar(40) | The host's VDSM version. |
| vdsm_port | integer | As displayed in the edit dialog. |
| cluster_configuration_version | integer | The cluster configuration version at the time of creation or update. |
| create_date | timestamp with time zone | The date this entity was added to the system. |
| update_date | timestamp with time zone | The date this entity was changed in the system. |
| delete_date | timestamp with time zone | The date this entity was deleted from the system. |
2.2.9.7. Host Interface Configuration
Table 2.18. v3_5_configuration_history_hosts_interfaces
| Name | Type | Description |
|---|---|---|
| history_id | integer | The ID of the configuration version in the history database. |
| host_interface_id | uuid | The unique ID of this interface in the system. |
| host_interface_name | varchar(50) | The interface name as reported by the host. |
| host_id | uuid | Unique ID of the host this interface belongs to. |
| host_interface_type | smallint |
|
| host_interface_speed_bps | integer | The interface speed in bits per second. |
| mac_address | varchar(20) | The interface MAC address. |
| logical_network_name | varchar(50) | The logical network associated with the interface. |
| ip_address | varchar(50) | As displayed in the edit dialog. |
| gateway | varchar(20) | As displayed in the edit dialog. |
| bond | Boolean | A flag to indicate if this interface is a bonded interface. |
| bond_name | varchar(50) | The name of the bond this interface is part of (if it is part of a bond). |
| vlan_id | integer | As displayed in the edit dialog. |
| host_configuration_version | integer | The host configuration version at the time of creation or update. |
| create_date | timestamp with time zone | The date this entity was added to the system. |
| update_date | timestamp with time zone | The date this entity was changed in the system. |
| delete_date | timestamp with time zone | The date this entity was deleted from the system. |
2.2.9.8. Virtual Machine Configuration
Table 2.19. v3_5_configuration_history_vms
| Name | Type | Description |
|---|---|---|
| history_id | integer | The ID of the configuration version in the history database. |
| vm_id | uuid | The unique ID of this VM in the system. |
| vm_name | varchar(255) | The name of the VM. |
| vm_description | varchar(4000) | As displayed in the edit dialog. |
| vm_type | smallint |
|
| cluster_id | uuid | The unique ID of the cluster this VM belongs to. |
| template_id | uuid | The unique ID of the template this VM is derived from. The field is for future use, as the templates are not synchronized to the history database in this version. |
| template_name | varchar(40) | Name of the template from which this VM is derived. |
| cpu_per_socket | smallint | Virtual CPUs per socket. |
| number_of_sockets | smallint | Total number of virtual CPU sockets. |
| memory_size_mb | integer | Total memory allocated to the VM, expressed in megabytes (MB). |
| operating_system | smallint |
|
| default_host | uuid | As displayed in the edit dialog, the ID of the default host in the system. |
| high_availability | Boolean | As displayed in the edit dialog. |
| initialized | Boolean | A flag to indicate if this VM was started at least once for Sysprep initialization purposes. |
| stateless | Boolean | As displayed in the edit dialog. |
| fail_back | Boolean | As displayed in the edit dialog. |
| usb_policy | smallint | As displayed in the edit dialog. |
| time_zone | varchar(40) | As displayed in the edit dialog. |
| cluster_configuration_version | integer | The cluster configuration version at the time of creation or update. |
| default_host_configuration_version | integer | The host configuration version at the time of creation or update. |
| create_date | timestamp with time zone | The date this entity was added to the system. |
| update_date | timestamp with time zone | The date this entity was changed in the system. |
| delete_date | timestamp with time zone | The date this entity was deleted from the system. |
| vm_pool_id | uuid | The virtual machine's pool unique ID. |
| vm_pool_name | varchar(255) | The name of the virtual machine's pool. |
2.2.9.9. Virtual Machine Interface Configuration
Table 2.20. v3_5_configuration_history_vms_interfaces
| Name | Type | Description |
|---|---|---|
| history_id | integer | The ID of the configuration version in the history database. |
| vm_interface_id | uuid | The unique ID of this interface in the system. |
| vm_interface_name | varchar(50) | As displayed in the edit dialog. |
| vm_interface_type | smallint |
The type of the virtual interface.
|
| vm_interface_speed_bps | integer | The average speed of the interface during the aggregation in bits per second. |
| mac_address | varchar(20) | As displayed in the edit dialog. |
| logical_network_name | varchar(50) | As displayed in the edit dialog. |
| vm_configuration_version | integer | The virtual machine configuration version at the time of creation or update. |
| create_date | timestamp with time zone | The date this entity was added to the system. |
| update_date | timestamp with time zone | The date this entity was changed in the system. |
| delete_date | timestamp with time zone | The date this entity was deleted from the system. |
2.2.9.10. Virtual Machine Device Configuration
Table 2.21. v3_5_configuration_history_vms_devices
| Name | Type | Description |
|---|---|---|
| history_id | integer | The ID of the configuration version in the history database. |
| vm_id | uuid | The unique ID of the virtual machine in the system. |
| type | varchar(30) | VM Device Type which can be "disk" or "interface" |
| address | varchar(255) | The virtual machine's device physical address |
| is_managed | Boolean | Flag that indicates if the device is managed by the Manager |
| is_plugged | Boolean | Flag that indicates if the device is plugged into the virtual machine. |
| is_readonly | Boolean | Flag that indicates if the device is read only. |
| vm_configuration_version | integer | The virtual machine configuration version at the time the sample was taken. |
| device_configuration_version | integer | The device configuration version at the time the sample was taken. |
| create_date | timestamp with time zone | The date this entity was added to the system. |
| update_date timestamp | timestamp with time zone | The date this entity was added to the system. |
| delete_date | timestamp with time zone | The date this entity was added to the system. |
2.2.9.11. Virtual Machine Disk Configuration
Table 2.22. v3_5_configuration_history_vms_disks
| Name | Type | Description |
|---|---|---|
| history_id | integer | The ID of the configuration version in the history database. |
| vm_disk_id | uuid | The unique ID of this disk in the system. |
| vm_disk_description | varchar(4000) | As displayed in the edit dialog. |
| storage_domain_id | uuid | The ID of the storage domain this disk image belongs to. |
| vm_disk_size_mb | integer | The defined size of the disk in megabytes (MB). |
| vm_disk_type | integer |
As displayed in the edit dialog. Only System and data are currently used.
|
| vm_disk_format | integer |
As displayed in the edit dialog.
|
| vm_disk_interface | integer |
|
| create_date | timestamp with time zone | The date this entity was added to the system. |
| update_date | timestamp with time zone | The date this entity was changed in the system. |
| delete_date | timestamp with time zone | The date this entity was deleted from the system. |
| is_shared | Boolean | Flag that indicates if the virtual machine's disk is shared. |
| image_id | uuid | The unique ID of the image in the system. |
2.2.9.12. User Details History
Table 2.23. v3_6_users_details_history view
| Name | Type | Description |
|---|---|---|
| user_id | uuid | The unique ID of the user in the system as generated by Manager. |
| first_name | varchar(255) | The user's first name. |
| last_name | varchar(255) | The user's last name. |
| domain | varchar(255) | The name of the authorization extension. |
| username | varchar(255) | The account name |
| department | varchar(255) | The organizational department the user belongs to. |
| user_role_title | varchar(255) | The title or role of the user within the organization. |
| varchar(255) | The email of the user in the organization. | |
| external_id | text | The unique identifier of the user from the external system. |
| active | Boolean | If the user is active or not - this is being checked once in an hour, if the user can be found in the authorization extension then it will remain active. A user can be turned to active also on successful login. |
| create_date | timestamp with time zone | The date this entity was added to the system. |
| update_date | timestamp with time zone | The date this entity was changed in the system. |
| delete_date | timestamp with time zone | The date this entity was deleted from the system. |