
Reports and Data Warehouse Guide
How to Use the Reports and Data Warehouse Capabilities of Red Hat Enterprise Virtualization
Abstract
Chapter 1. Installing and Configuring Data Warehouse and Reports
1.1. Overview of Configuring Data Warehouse and Reports
ovirt_engine_history database, to which the Manager is configured to log information for reporting purposes. Red Hat Enterprise Virtualization Manager Reports functionality is also available as an optional component. Reports provides a customized implementation of JasperServer and JasperReports, an open source reporting tool capable of being embedded in Java-based applications. It produces reports that can be built and accessed via a web user interface, and then rendered to screen, printed, or exported to a variety of formats including PDF, Excel, CSV, Word, RTF, Flash, ODT and ODS. The Data Warehouse and Reports components are optional, and must be installed and configured in addition to the Manager setup.
ovirt_engine_history database will use, use the RHEV Manager History Database Size Calculator tool. The estimate is based on the number of entities and the length of time you have chosen to retain the history records.
1.2. Data Warehouse and Reports Configuration Notes
The following behavior is expected in engine-setup:
engine-setup, and answer No to configuring Data Warehouse and Reports:
Configure Data Warehouse on this host (Yes, No) [Yes]: No
Configure Reports on this host (Yes, No) [Yes]: No
engine-setup again; setup no longer presents the option to configure those services.
To force engine-setup to present both options again, run engine-setup with the following options appended:
# engine-setup --otopi-environment='OVESETUP_REPORTS_CORE/enable=none:None OVESETUP_DWH_CORE/enable=none:None'
# engine-setup --otopi-environment='OVESETUP_DWH_CORE/enable=none:None'
# engine-setup --otopi-environment='OVESETUP_REPORTS_CORE/enable=none:None'
Note
--offline option .
1.3. Data Warehouse and Reports Installation Options
- Install and configure both Data Warehouse and Reports on the machine on which the Manager is installed.
This configuration hosts the Data Warehouse and Reports services on your Manager machine. This requires only a single registered machine, and is the simplest to configure; however, it also requires that the services share CPU and memory, and increases the demand on the host machine. Users who require access to the Data Warehouse service or the Reports service will require access to the Manager machine itself.
- Install and configure both Data Warehouse and Reports on one separate machine.
This configuration hosts Data Warehouse and Reports on a single, separate machine. This requires two registered machines; however, it reduces the load on the Manager machine, and avoids potential CPU and memory-sharing conflicts on that machine. Administrators can also allow user access to the Data Warehouse-Reports machine, without the need to grant access to the Manager machine. Note that the Data Warehouse and Reports services will still compete for resources on their single host.
- Install and configure Data Warehouse on a separate machine, then install and configure Reports on a separate machine.
This configuration separates each service onto its own dedicated host. This requires three registered machines; however, it reduces the load on each individual machine, and allows each service to avoid potential conflicts caused by sharing CPU and memory with other processes. Administrators can also allow user access to one particular machine, without the need to grant access to either of the two other machines.
- Install and configure Data Warehouse on the Manager machine, then install and configure Reports on a separate machine.
This configuration hosts Data Warehouse on the Manager machine, and Reports on a separate host. This requires two registered machines; however, it reduces the load on the Manager machine, and avoids some memory-sharing conflicts. Administrators can allow user access to the Reports machine, without the need to grant access to the Manager machine.
- Install and configure Data Warehouse on a separate machine, then install and configure Reports on the Manager machine.
This configuration hosts Data Warehouse on a separate machine, and Reports on the Manager machine. This requires two registered machines; however, it reduces the load on the Manager machine, and avoids some memory-sharing conflicts. Administrators can allow user access to the Data Warehouse machine, without the need to grant access to the Manager machine.
Note
/usr/share/jasperreports-server-pro/docs/
1.3.1. Installing and Configuring Data Warehouse and Reports on the Red Hat Enterprise Virtualization Manager
Install and configure Data Warehouse and Red Hat Enterprise Virtualization Manager Reports on the same machine as the Red Hat Enterprise Virtualization Manager.
Ensure that you have completed the following prerequisites:
- You must have installed and configured the Manager on this machine.
- If you choose to use a remote Data Warehouse database or Reports database, you must set up each database before installing the Data Warehouse and Reports services. You must have the following information about each database host:
- The fully qualified domain name of the host
- The port through which the database can be reached (5432 by default)
- The database name
- The database user
- The database password
- If you are using the self-hosted engine, you must move it to maintenance mode:
# hosted-engine --set-maintenance --mode=global
Procedure 1.1. Installing and Configuring Data Warehouse and Reports on the Red Hat Enterprise Virtualization Manager
- Install the rhevm-dwh package and the rhevm-reports package on the system where the Red Hat Enterprise Virtualization Manager is installed:
# yum install rhevm-dwh rhevm-reports
- Run the
engine-setupcommand to begin configuration of Data Warehouse and Reports on the machine:# engine-setup
- Follow the prompts to configure Data Warehouse and Reports:
Configure Data Warehouse on this host (Yes, No) [Yes]:
Configure Reports on this host (Yes, No) [Yes]:
- Press Enter to automatically configure the firewall, or type
Noand press Enter to maintain existing settings:Setup can automatically configure the firewall on this system. Note: automatic configuration of the firewall may overwrite current settings. Do you want Setup to configure the firewall? (Yes, No) [Yes]:
If you choose to automatically configure the firewall, and no firewall managers are active, you are prompted to select your chosen firewall manager from a list of supported options. Type the name of the firewall manager and press Enter. This applies even in cases where only one option is listed. - Answer the following questions about the Data Warehouse database and the Reports database:
Where is the DWH database located? (Local, Remote) [Local]:
Setup can configure the local postgresql server automatically for the DWH to run. This may conflict with existing applications.
Would you like Setup to automatically configure postgresql and create DWH database, or prefer to perform that manually? (Automatic, Manual) [Automatic]:
Where is the Reports database located? (Local, Remote) [Local]:
Setup can configure the local postgresql server automatically for the Reports to run. This may conflict with existing applications.
Would you like Setup to automatically configure postgresql and create Reports database, or prefer to perform that manually? (Automatic, Manual) [Automatic]:
Press Enter to choose the highlighted defaults, or type your alternative preference and then press Enter. If you selectRemote, you are prompted to provide details about each remote database host. - Set a password for the Reports administrative users (
adminandsuperuser). Note that the reports system maintains its own set of credentials that are separate to those used for the Manager:Reports power users password:
You are prompted to enter the password a second time to confirm it. - For the configuration to take effect, the
ovirt-engineservice must be restarted. Theengine-setupcommand prompts you:During execution engine service will be stopped (OK, Cancel) [OK]:
Press Enter to proceed. Theovirt-engineservice restarts automatically later in the command. - Confirm your installation settings:
Please confirm installation settings (OK, Cancel) [OK]:
Access the Reports Portal at http://demo.redhat.com/ovirt-engine-reports, replacing demo.redhat.com with the fully qualified domain name of the Manager. If during the Manager installation you selected a non-default HTTP port then append :port to the URL, replacing :port with the port that you chose.
admin and the password you set during reports installation. Note that the first time you log in to Red Hat Enterprise Virtualization Manager Reports, a number of web pages are generated and, as a result, your initial attempt to log in may take some time to complete.
1.3.2. Installing and Configuring Data Warehouse and Reports Together on a Separate Machine
Install and configure Data Warehouse and Red Hat Enterprise Virtualization Manager Reports together on a separate host from that on which the Red Hat Enterprise Virtualization Manager is installed. Hosting the Data Warehouse service and the Reports service on a separate machine helps to reduce the load on the Manager machine. Note that hosting Data Warehouse and Reports on the same machine means that these processes will share CPU and memory.
Ensure that you have completed the following prerequisites:
- You must have installed and configured the Manager on a separate machine.
- To set up the Data Warehouse and Reports machine, you must have the following:
- A virtual or physical machine with Red Hat Enterprise Linux 6.6 or later versions of Red Hat Enterprise Linux 6 installed.
- A subscription to the
Red Hat Enterprise Linux ServerandRed Hat Enterprise Virtualizationsubscription pools. - The password from the Manager's
/etc/ovirt-engine/engine.conf.d/10-setup-database.conffile. - Allowed access from the Data Warehouse-Reports machine to the Manager database machine's TCP port 5432.
- If you choose to use a remote Data Warehouse database or Reports database, you must set up each database before installing the Data Warehouse and Reports services. You must have the following information about each database host:
- The fully qualified domain name of the host
- The port through which the database can be reached (5432 by default)
- The database name
- The database user
- The database password
Procedure 1.2. Installing and Configuring Data Warehouse and Reports Together on a Separate Machine
- Register your system with the Content Delivery Network, entering your Customer Portal user name and password when prompted:
# subscription-manager register
- Find the
Red Hat Enterprise Linux ServerandRed Hat Enterprise Virtualizationsubscription pools and note down the pool IDs.# subscription-manager list --available
- Use the pool IDs located in the previous step to attach the entitlements to the system:
# subscription-manager attach --pool=pool_id
- Disable all existing repositories:
# subscription-manager repos --disable=*
- Enable the required repositories:
# subscription-manager repos --enable=rhel-6-server-rpms
# subscription-manager repos --enable=rhel-6-server-supplementary-rpms
# subscription-manager repos --enable=rhel-6-server-rhevm-3.6-rpms
# subscription-manager repos --enable=jb-eap-6-for-rhel-6-server-rpms
- Ensure that all packages currently installed are up to date:
# yum update
- Install the rhevm-dwh-setup and rhevm-reports-setup packages:
# yum install rhevm-dwh-setup rhevm-reports-setup
- Run the
engine-setupcommand to begin configuration of Data Warehouse and Reports on the machine:# engine-setup
- Follow the prompts to configure Data Warehouse and Reports:
Configure Data Warehouse on this host (Yes, No) [Yes]:
Configure Reports on this host (Yes, No) [Yes]:
- Press Enter to automatically configure the firewall, or type
Noand press Enter to maintain existing settings:Setup can automatically configure the firewall on this system. Note: automatic configuration of the firewall may overwrite current settings. Do you want Setup to configure the firewall? (Yes, No) [Yes]:
If you choose to automatically configure the firewall, and no firewall managers are active, you are prompted to select your chosen firewall manager from a list of supported options. Type the name of the firewall manager and press Enter. This applies even in cases where only one option is listed. - Press Enter to accept the automatically detected hostname, or enter an alternative hostname and press Enter:
Host fully qualified DNS name of this server [autodetected hostname]:
- Enter the fully qualified domain name of the Manager machine, and then press Enter:
Host fully qualified DNS name of the engine server []:
- Answer the following questions about the Data Warehouse database and the Reports database:
Where is the DWH database located? (Local, Remote) [Local]:
Setup can configure the local postgresql server automatically for the DWH to run. This may conflict with existing applications.
Would you like Setup to automatically configure postgresql and create DWH database, or prefer to perform that manually? (Automatic, Manual) [Automatic]:
Where is the Reports database located? (Local, Remote) [Local]:
Setup can configure the local postgresql server automatically for the Reports to run. This may conflict with existing applications.
Would you like Setup to automatically configure postgresql and create Reports database, or prefer to perform that manually? (Automatic, Manual) [Automatic]:
Press Enter to choose the highlighted defaults, or type your alternative preference and then press Enter. If you selectRemote, you are prompted to provide details about each remote database host. - Enter the fully qualified domain name and password for the Manager database machine. Press Enter to accept the default values in each other field:
Engine database host []: engine-db-fqdn
Engine database port [5432]:
Engine database secured connection (Yes, No) [No]:
Engine database name [engine]:
Engine database user [engine]:
Engine database password: password
- Press Enter to allow setup to sign the Reports certificate and Apache certificate on the Manager via SSH:
Setup will need to do some actions on the remote engine server. Either automatically, using ssh as root to access it, or you will be prompted to manually perform each such action.
Please choose one of the following:
1 - Access remote engine server using ssh as root
2 - Perform each action manually, use files to copy content around
(1, 2) [1]:
- Press Enter to accept the default SSH port, or enter an alternative port number and then press Enter:
ssh port on remote engine server [22]:
- Enter the root password for the Manager machine:
root password on remote engine server manager-fqdn.com:
- Press Enter to allow automatic configuration of SSL on Apache:
Setup can configure apache to use SSL using a certificate issued from the internal CA.
Do you wish Setup to configure that, or prefer to perform that manually? (Automatic, Manual) [Automatic]:
- Set a password for the Reports administrative users (
adminandsuperuser). Note that the reports system maintains its own set of credentials that are separate to those used for the Manager:Reports power users password:
You are prompted to enter the password a second time to confirm it. - Confirm your installation settings:
Please confirm installation settings (OK, Cancel) [OK]:
Access the Reports Portal at http://demo.redhat.com/ovirt-engine-reports, replacing demo.redhat.com with the fully qualified domain name of the Manager. If during the Manager installation you selected a non-default HTTP port then append :port to the URL, replacing :port with the port that you chose.
admin and the password you set during reports installation. Note that the first time you log in to Red Hat Enterprise Virtualization Manager Reports, a number of web pages are generated and, as a result, your initial attempt to log in may take some time to complete.
1.3.3. Installing and Configuring Data Warehouse and Reports on Separate Machines
Install and configure Data Warehouse on a separate host from that on which the Red Hat Enterprise Virtualization Manager is installed, then install and configure Red Hat Enterprise Virtualization Manager Reports on a third machine. Hosting the Data Warehouse and Reports services on separate machines helps to reduce the load on the Manager machine. Separating Data Warehouse and Reports onto individual machines further reduces the demand each service places on its host machine, and avoids any conflicts caused by sharing CPU and memory with other processes.
- Install and configure Data Warehouse on a separate machine.
- Install and configure Reports on a separate machine.
Ensure that you have completed the following prerequisites:
- You must have installed and configured the Manager on a separate machine.
- To set up the Data Warehouse machine, you must have the following:
- A virtual or physical machine with Red Hat Enterprise Linux 6.6 or later versions of Red Hat Enterprise Linux 6 installed.
- A subscription to the
Red Hat Enterprise Linux ServerandRed Hat Enterprise Virtualizationsubscription pools. - The password from the Manager's
/etc/ovirt-engine/engine.conf.d/10-setup-database.conffile. - Allowed access from the Data Warehouse machine to the Manager database machine's TCP port 5432.
- To set up the Reports machine, you must have the following:
- A virtual or physical machine with Red Hat Enterprise Linux 6.6 or later versions of Red Hat Enterprise Linux 6 installed.
- A subscription to the
Red Hat Enterprise Linux ServerandRed Hat Enterprise Virtualizationsubscription pools. - The password from the Data Warehouse machine's
/etc/ovirt-engine-dwh/ovirt-engine-dwhd.conf.d/10-setup-database.conffile. - Allowed access from the Reports machine to the Manager database machine's TCP port 5432.
- If you choose to use a remote Data Warehouse database or Reports database, you must set up each database before installing the Data Warehouse and Reports services. You must have the following information about each database host:
- The fully qualified domain name of the host
- The port through which the database can be reached (5432 by default)
- The database name
- The database user
- The database password
Procedure 1.3. Step 1: Installing and Configuring Data Warehouse on a Separate Machine
- Register your system with the Content Delivery Network, entering your Customer Portal user name and password when prompted:
# subscription-manager register
- Find the
Red Hat Enterprise Linux ServerandRed Hat Enterprise Virtualizationsubscription pools and note down the pool IDs.# subscription-manager list --available
- Use the pool IDs located in the previous step to attach the entitlements to the system:
# subscription-manager attach --pool=pool_id
- Disable all existing repositories:
# subscription-manager repos --disable=*
- Enable the required repositories:
# subscription-manager repos --enable=rhel-6-server-rpms
# subscription-manager repos --enable=rhel-6-server-supplementary-rpms
# subscription-manager repos --enable=rhel-6-server-rhevm-3.6-rpms
# subscription-manager repos --enable=jb-eap-6-for-rhel-6-server-rpms
- Ensure that all packages currently installed are up to date:
# yum update
- Install the rhevm-dwh-setup package:
# yum install rhevm-dwh-setup
- Run the
engine-setupcommand to begin configuration of Data Warehouse on the machine:# engine-setup
- Press Enter to configure Data Warehouse:
Configure Data Warehouse on this host (Yes, No) [Yes]:
- Press Enter to automatically configure the firewall, or type
Noand press Enter to maintain existing settings:Setup can automatically configure the firewall on this system. Note: automatic configuration of the firewall may overwrite current settings. Do you want Setup to configure the firewall? (Yes, No) [Yes]:
If you choose to automatically configure the firewall, and no firewall managers are active, you are prompted to select your chosen firewall manager from a list of supported options. Type the name of the firewall manager and press Enter. This applies even in cases where only one option is listed. - Press Enter to accept the automatically detected hostname, or enter an alternative hostname and press Enter:
Host fully qualified DNS name of this server [autodetected host name]:
- Answer the following questions about the Data Warehouse database:
Where is the DWH database located? (Local, Remote) [Local]:
Setup can configure the local postgresql server automatically for the DWH to run. This may conflict with existing applications.
Would you like Setup to automatically configure postgresql and create DWH database, or prefer to perform that manually? (Automatic, Manual) [Automatic]:
Press Enter to choose the highlighted defaults, or type your alternative preference and then press Enter. If you selectRemote, you are prompted to provide details about the remote database host. - Enter the fully qualified domain name and password for the Manager database machine. Press Enter to accept the default values in each other field:
Engine database host []: engine-db-fqdn
Engine database port [5432]:
Engine database secured connection (Yes, No) [No]:
Engine database name [engine]:
Engine database user [engine]:
Engine database password: password
- Confirm your installation settings:
Please confirm installation settings (OK, Cancel) [OK]:
Procedure 1.4. Step 2: Installing and Configuring Reports on a Separate Machine
- Register your system with the Content Delivery Network, entering your Customer Portal user name and password when prompted:
# subscription-manager register
- Find subscription pools containing the repositories required to install Reports:
# subscription-manager list --available | grep -A8 "Red Hat Enterprise Linux Server"
# subscription-manager list --available | grep -A8 "Red Hat Enterprise Virtualization"
- Use the pool identifiers located in the previous step to attach the
Red Hat Enterprise Linux ServerandRed Hat Enterprise Virtualizationentitlements to the system:# subscription-manager attach --pool=pool_id
- Disable all existing repositories:
# subscription-manager repos --disable=*
- Enable the required repositories:
# subscription-manager repos --enable=rhel-6-server-rpms
# subscription-manager repos --enable=rhel-6-server-supplementary-rpms
# subscription-manager repos --enable=rhel-6-server-rhevm-3.6-rpms
# subscription-manager repos --enable=jb-eap-6-for-rhel-6-server-rpms
- Ensure that all packages currently installed are up to date:
# yum update
- Install the rhevm-reports-setup package:
# yum install rhevm-reports-setup
- Run the
engine-setupcommand to begin configuration of Reports on the machine:# engine-setup
- Press Enter to configure Reports:
Configure Reports on this host (Yes, No) [Yes]:
- Press Enter to automatically configure the firewall, or type
Noand press Enter to maintain existing settings:Setup can automatically configure the firewall on this system. Note: automatic configuration of the firewall may overwrite current settings. Do you want Setup to configure the firewall? (Yes, No) [Yes]:
If you choose to automatically configure the firewall, and no firewall managers are active, you are prompted to select your chosen firewall manager from a list of supported options. Type the name of the firewall manager and press Enter. This applies even in cases where only one option is listed. - Press Enter to accept the automatically detected hostname, or enter an alternative hostname and press Enter:
Host fully qualified DNS name of this server [autodetected host name]:
- Enter the fully qualified domain name of the Manager machine, and then press Enter:
Host fully qualified DNS name of the engine server []:
- Answer the following questions about the Reports database:
Where is the Reports database located? (Local, Remote) [Local]:
Setup can configure the local postgresql server automatically for the Reports to run. This may conflict with existing applications.
Would you like Setup to automatically configure postgresql and create Reports database, or prefer to perform that manually? (Automatic, Manual) [Automatic]:
Press Enter to choose the highlighted defaults, or type your alternative preference and then press Enter. If you selectRemote, you are prompted to provide details about the remote database host. - Enter the fully qualified domain name and password for your Data Warehouse database host. Press Enter to accept the default values in each other field:
DWH database host []: dwh-db-fqdn
DWH database port [5432]:
DWH database secured connection (Yes, No) [No]:
DWH database name [ovirt_engine_history]:
DWH database user [ovirt_engine_history]:
DWH database password: password
- Press Enter to allow setup to sign the Reports certificate and Apache certificate on the Manager via SSH:
Setup will need to do some actions on the remote engine server. Either automatically, using ssh as root to access it, or you will be prompted to manually perform each such action.
Please choose one of the following:
1 - Access remote engine server using ssh as root
2 - Perform each action manually, use files to copy content around
(1, 2) [1]:
- Press Enter to accept the default SSH port, or enter an alternative port number and then press Enter:
ssh port on remote engine server [22]:
- Enter the root password for the Manager machine:
root password on remote engine server manager-fqdn.com:
- Press Enter to allow automatic configuration of SSL on Apache:
Setup can configure apache to use SSL using a certificate issued from the internal CA.
Do you wish Setup to configure that, or prefer to perform that manually? (Automatic, Manual) [Automatic]:
- Set a password for the Reports administrative users (
adminandsuperuser). Note that the reports system maintains its own set of credentials that are separate to those used for the Manager:Reports power users password:
You are prompted to enter the password a second time to confirm it. - Confirm your installation settings:
Please confirm installation settings (OK, Cancel) [OK]:
Access the Reports Portal at http://demo.redhat.com/ovirt-engine-reports, replacing demo.redhat.com with the fully qualified domain name of the Manager. If during the Manager installation you selected a non-default HTTP port then append :port to the URL, replacing :port with the port that you chose.
admin and the password you set during reports installation. Note that the first time you log in to Red Hat Enterprise Virtualization Manager Reports, a number of web pages are generated and, as a result, your initial attempt to log in may take some time to complete.
1.3.4. Installing and Configuring Data Warehouse on the Red Hat Enterprise Virtualization Manager and Reports on a Separate Machine
Install and configure Data Warehouse on the same system as the Red Hat Enterprise Virtualization Manager, then install and configure Red Hat Enterprise Virtualization Manager Reports on a separate machine. Hosting the Reports service on a separate machine helps to reduce the load on the Manager machine.
- Install and configure Data Warehouse on the Manager machine.
- Install and configure Reports on a separate machine.
Ensure that you have completed the following prerequisites:
- You must have installed and configured the Manager on one machine. This is the machine on which you are installing Data Warehouse.
- To set up the Reports machine, you must have the following:
- A virtual or physical machine with Red Hat Enterprise Linux 6.6 or later versions of Red Hat Enterprise Linux 6 installed.
- A subscription to the
Red Hat Enterprise Linux ServerandRed Hat Enterprise Virtualizationentitlement pools. - The password from the Data Warehouse machine's
/etc/ovirt-engine-dwh/ovirt-engine-dwhd.conf.d/10-setup-database.conffile. - Allowed access from the Reports machine to the Manager database machine's TCP port 5432.
- If you choose to use a remote Data Warehouse database or Reports database, you must set up each database before installing the Data Warehouse and Reports services. You must have the following information about each database host:
- The fully qualified domain name of the host
- The port through which the database can be reached (5432 by default)
- The database name
- The database user
- The database password
- If you are using the self-hosted engine, you must move it to maintenance mode:
# hosted-engine --set-maintenance --mode=global
Procedure 1.5. Step 1: Installing and Configuring Data Warehouse on the Manager Machine
- Install the rhevm-dwh package:
# yum install rhevm-dwh
- Run the
engine-setupcommand to begin configuration of Data Warehouse on the machine:# engine-setup
- Press Enter to configure Data Warehouse:
Configure Data Warehouse on this host (Yes, No) [Yes]:
- Press Enter to automatically configure the firewall, or type
Noand press Enter to maintain existing settings:Setup can automatically configure the firewall on this system. Note: automatic configuration of the firewall may overwrite current settings. Do you want Setup to configure the firewall? (Yes, No) [Yes]:
If you choose to automatically configure the firewall, and no firewall managers are active, you are prompted to select your chosen firewall manager from a list of supported options. Type the name of the firewall manager and press Enter. This applies even in cases where only one option is listed. - Answer the following questions about the Data Warehouse database:
Where is the DWH database located? (Local, Remote) [Local]:
Setup can configure the local postgresql server automatically for the DWH to run. This may conflict with existing applications.
Would you like Setup to automatically configure postgresql and create DWH database, or prefer to perform that manually? (Automatic, Manual) [Automatic]:
Press Enter to choose the highlighted defaults, or type your alternative preference and then press Enter. If you selectRemote, you are prompted to provide details about the remote database host. - For the configuration to take effect, the
ovirt-engineservice must be restarted. Theengine-setupcommand prompts you:During execution engine service will be stopped (OK, Cancel) [OK]:
Press Enter to proceed. Theovirt-engineservice restarts automatically later in the command. - Confirm your installation settings:
Please confirm installation settings (OK, Cancel) [OK]:
Procedure 1.6. Step 2: Installing and Configuring Reports on a Separate Machine
- Register your system with the Content Delivery Network, entering your Customer Portal user name and password when prompted:
# subscription-manager register
- Find the
Red Hat Enterprise Linux ServerandRed Hat Enterprise Virtualizationsubscription pools and note down the pool IDs.# subscription-manager list --available
- Use the pool IDs located in the previous step to attach the entitlements to the system:
# subscription-manager attach --pool=pool_id
- Disable all existing repositories:
# subscription-manager repos --disable=*
- Enable the required channels:
# subscription-manager repos --enable=rhel-6-server-rpms
# subscription-manager repos --enable=rhel-6-server-supplementary-rpms
# subscription-manager repos --enable=rhel-6-server-rhevm-3.6-rpms
# subscription-manager repos --enable=jb-eap-6-for-rhel-6-server-rpms
- Ensure that all packages currently installed are up to date:
# yum update
- Install the rhevm-reports-setup package:
# yum install rhevm-reports-setup
- Run the
engine-setupcommand to begin configuration of Reports on the machine:# engine-setup
- Press Enter to configure Reports:
Configure Reports on this host (Yes, No) [Yes]:
- Press Enter to automatically configure the firewall, or type
Noand press Enter to maintain existing settings:Setup can automatically configure the firewall on this system. Note: automatic configuration of the firewall may overwrite current settings. Do you want Setup to configure the firewall? (Yes, No) [Yes]:
If you choose to automatically configure the firewall, and no firewall managers are active, you are prompted to select your chosen firewall manager from a list of supported options. Type the name of the firewall manager and press Enter. This applies even in cases where only one option is listed. - Press Enter to accept the automatically detected hostname, or enter an alternative hostname and press Enter:
Host fully qualified DNS name of this server [autodetected host name]:
- Enter the fully qualified domain name of the Manager machine, and then press Enter:
Host fully qualified DNS name of the engine server []:
- Answer the following questions about the Reports database:
Where is the Reports database located? (Local, Remote) [Local]:
Setup can configure the local postgresql server automatically for the Reports to run. This may conflict with existing applications.
Would you like Setup to automatically configure postgresql and create Reports database, or prefer to perform that manually? (Automatic, Manual) [Automatic]:
Press Enter to choose the highlighted defaults, or type your alternative preference and then press Enter. If you selectRemote, you are prompted to provide details about the remote database host. - Enter the fully qualified domain name and password for your Data Warehouse database host. Press Enter to accept the default values in each other field:
DWH database host []: dwh-db-fqdn
DWH database port [5432]:
DWH database secured connection (Yes, No) [No]:
DWH database name [ovirt_engine_history]:
DWH database user [ovirt_engine_history]:
DWH database password: password
- Press Enter to allow setup to sign the Reports certificate and Apache certificate on the Manager via SSH:
Setup will need to do some actions on the remote engine server. Either automatically, using ssh as root to access it, or you will be prompted to manually perform each such action.
Please choose one of the following:
1 - Access remote engine server using ssh as root
2 - Perform each action manually, use files to copy content around
(1, 2) [1]:
- Press Enter to accept the default SSH port, or enter an alternative port number and then press Enter:
ssh port on remote engine server [22]:
- Enter the root password for the Manager machine:
root password on remote engine server manager-fqdn.com:
- Press Enter to allow automatic configuration of SSL on Apache:
Setup can configure apache to use SSL using a certificate issued from the internal CA.
Do you wish Setup to configure that, or prefer to perform that manually? (Automatic, Manual) [Automatic]:
- Set a password for the Reports administrative users (
adminandsuperuser). Note that the reports system maintains its own set of credentials that are separate to those used for the Manager:Reports power users password:
You are prompted to enter the password a second time to confirm it. - Confirm your installation settings:
Please confirm installation settings (OK, Cancel) [OK]:
Access the Reports Portal at http://demo.redhat.com/ovirt-engine-reports, replacing demo.redhat.com with the fully qualified domain name of the Manager. If during the Manager installation you selected a non-default HTTP port then append :port to the URL, replacing :port with the port that you chose.
admin and the password you set during reports installation. Note that the first time you log in to Red Hat Enterprise Virtualization Manager Reports, a number of web pages are generated and, as a result, your initial attempt to log in may take some time to complete.
1.3.5. Installing and Configuring Data Warehouse on a Separate Machine and Reports on the Red Hat Enterprise Virtualization Manager
Install and configure Data Warehouse on a separate host from that on which the Red Hat Enterprise Virtualization Manager is installed, then install and configure Red Hat Enterprise Virtualization Manager Reports on the Manager machine. Hosting the Data Warehouse service on a separate machine helps to reduce the load on the Manager machine. Note that hosting the Manager and Reports on the same machine means that these processes will share CPU and memory.
- Install and configure Data Warehouse on a separate machine.
- Install and configure Reports on the Manager machine.
Ensure that you have completed the following prerequisites:
- You must have installed and configured the Manager on a separate machine.
- To set up the Data Warehouse machine, you must have the following:
- A virtual or physical machine with Red Hat Enterprise Linux 6.6 or later versions of Red Hat Enterprise Linux 6 installed.
- A subscription to the
Red Hat Enterprise Linux ServerandRed Hat Enterprise Virtualizationentitlement pools. - The password from the Manager's
/etc/ovirt-engine/engine.conf.d/10-setup-database.conffile. - Allowed access from the Data Warehouse machine to the Manager database machine's TCP port 5432.
- To set up the Reports machine, you must have the following:
- The password from the Data Warehouse machine's
/etc/ovirt-engine-dwh/ovirt-engine-dwhd.conf.d/10-setup-database.conffile.
- If you choose to use a remote Data Warehouse database or Reports database, you must set up each database before installing the Data Warehouse and Reports services. You must have the following information about each database host:
- The fully qualified domain name of the host
- The port through which the database can be reached (5432 by default)
- The database name
- The database user
- The database password
- If you are using the self-hosted engine, you must move it to maintenance mode:
# hosted-engine --set-maintenance --mode=global
Procedure 1.7. Step 1: Installing and Configuring Data Warehouse on a Separate Machine
- Register your system with the Content Delivery Network, entering your Customer Portal user name and password when prompted:
# subscription-manager register
- Find the
Red Hat Enterprise Linux ServerandRed Hat Enterprise Virtualizationsubscription pools and note down the pool IDs.# subscription-manager list --available
- Use the pool IDs located in the previous step to attach the entitlements to the system:
# subscription-manager attach --pool=pool_id
- Disable all existing repositories:
# subscription-manager repos --disable=*
- Enable the required channels:
# subscription-manager repos --enable=rhel-6-server-rpms
# subscription-manager repos --enable=rhel-6-server-supplementary-rpms
# subscription-manager repos --enable=rhel-6-server-rhevm-3.6-rpms
# subscription-manager repos --enable=jb-eap-6-for-rhel-6-server-rpms
- Ensure that all packages currently installed are up to date:
# yum update
- Install the rhevm-dwh-setup package:
# yum install rhevm-dwh-setup
- Run the
engine-setupcommand to begin configuration of Data Warehouse on the machine:# engine-setup
- Press Enter to configure Data Warehouse:
Configure Data Warehouse on this host (Yes, No) [Yes]:
- Press Enter to automatically configure the firewall, or type
Noand press Enter to maintain existing settings:Setup can automatically configure the firewall on this system. Note: automatic configuration of the firewall may overwrite current settings. Do you want Setup to configure the firewall? (Yes, No) [Yes]:
If you choose to automatically configure the firewall, and no firewall managers are active, you are prompted to select your chosen firewall manager from a list of supported options. Type the name of the firewall manager and press Enter. This applies even in cases where only one option is listed. - Press Enter to accept the automatically detected hostname, or enter an alternative hostname and press Enter:
Host fully qualified DNS name of this server [autodetected host name]:
- Answer the following questions about the Data Warehouse database:
Where is the DWH database located? (Local, Remote) [Local]:
Setup can configure the local postgresql server automatically for the DWH to run. This may conflict with existing applications.
Would you like Setup to automatically configure postgresql and create DWH database, or prefer to perform that manually? (Automatic, Manual) [Automatic]:
Press Enter to choose the highlighted defaults, or type your alternative preference and then press Enter. If you selectRemote, you are prompted to provide details about the remote database host. - Enter the fully qualified domain name and password for the Manager database machine. Press Enter to accept the default values in each other field:
Engine database host []: engine-db-fqdn
Engine database port [5432]:
Engine database secured connection (Yes, No) [No]:
Engine database name [engine]:
Engine database user [engine]:
Engine database password: password
- Confirm your installation settings:
Please confirm installation settings (OK, Cancel) [OK]:
Procedure 1.8. Step 2: Installing and Configuring Reports on the Manager Machine
- Install the rhevm-reports package:
# yum install rhevm-reports
- Run the
engine-setupcommand to begin configuration of Reports on the machine:# engine-setup
- Press Enter to configure Reports:
Configure Reports on this host (Yes, No) [Yes]:
- Press Enter to automatically configure the firewall, or type
Noand press Enter to maintain existing settings:Setup can automatically configure the firewall on this system. Note: automatic configuration of the firewall may overwrite current settings. Do you want Setup to configure the firewall? (Yes, No) [Yes]:
If you choose to automatically configure the firewall, and no firewall managers are active, you are prompted to select your chosen firewall manager from a list of supported options. Type the name of the firewall manager and press Enter. This applies even in cases where only one option is listed. - Answer the following questions about the Reports database:
Where is the Reports database located? (Local, Remote) [Local]:
Setup can configure the local postgresql server automatically for the Reports to run. This may conflict with existing applications.
Would you like Setup to automatically configure postgresql and create Reports database, or prefer to perform that manually? (Automatic, Manual) [Automatic]:
Press Enter to choose the highlighted defaults, or type your alternative preference and then press Enter. If you selectRemote, you are prompted to provide details about the remote database host. - Enter the fully qualified domain name and password for your Data Warehouse database host. Press Enter to accept the default values in each other field:
DWH database host []: dwh-db-fqdn
DWH database port [5432]:
DWH database secured connection (Yes, No) [No]:
DWH database name [ovirt_engine_history]:
DWH database user [ovirt_engine_history]:
DWH database password: password
- Set a password for the Reports administrative users (
adminandsuperuser). Note that the reports system maintains its own set of credentials that are separate to those used for the Manager:Reports power users password:
You are prompted to enter the password a second time to confirm it. - For the configuration to take effect, the
ovirt-engineservice must be restarted. Theengine-setupcommand prompts you:During execution engine service will be stopped (OK, Cancel) [OK]:
Press Enter to proceed. Theovirt-engineservice restarts automatically later in the command. - Confirm your installation settings:
Please confirm installation settings (OK, Cancel) [OK]:
Access the Reports Portal at http://demo.redhat.com/ovirt-engine-reports, replacing demo.redhat.com with the fully qualified domain name of the Manager. If during the Manager installation you selected a non-default HTTP port then append :port to the URL, replacing :port with the port that you chose.
admin and the password you set during reports installation. Note that the first time you log in to Red Hat Enterprise Virtualization Manager Reports, a number of web pages are generated and, as a result, your initial attempt to log in may take some time to complete.
1.4. Migrating Data Warehouse and Reports to Separate Machines
ovirt_engine_history database, or optionally migrate the ovirt_engine_history database to a new database machine before migrating the Data Warehouse service. If the ovirt_engine_history database is hosted on the Manager, migrating the database in addition to the Data Warehouse service further reduces the competition for resources on the Manager machine. You can migrate the database to the same machine onto which you will migrate the Data Warehouse service, or to a machine that is separate from both the Manager machine and the new Data Warehouse service machine.
1.4.1. Migrating the Data Warehouse Database to a Separate Machine
ovirt_engine_history database before you migrate the Data Warehouse service. This procedure uses pg_dump to create a database backup, and psql to restore the backup on the new database machine. The pg_dump command provides flexible options for backing up and restoring databases; for more information on options that may be suitable for your system, see the pg_dump manual page.
Important
engine-setup and entering the details of the new Data Warehouse database when prompted. If you do not do this, the Reports service is still connected to the old database, and does not receive any new data.
Procedure 1.9. Migrating the Data Warehouse Database to a Separate Machine
- On the existing database machine, dump the
ovirt_engine_historydatabase into a SQL script file:# pg_dump ovirt_engine_history > ovirt_engine_history.sql
- Copy the script file from the existing database machine to the new database machine.
- Restore the
ovirt_engine_historydatabase on the new database machine:# psql -d ovirt_engine_history -f ovirt_engine_history.sql
The command above assumes that the database on the new machine is also namedovirt_engine_history.
1.4.2. Migrating the Data Warehouse Service to a Separate Machine
ovirt_engine_history database) prior to migrating the Data Warehouse service, see Section 1.4.1, “Migrating the Data Warehouse Database to a Separate Machine”.
- Set up the new Data Warehouse machine.
- Stop the Data Warehouse service on the Manager machine.
- Configure the new Data Warehouse machine.
- Remove the Data Warehouse package from the Manager machine.
Ensure that you have completed the following prerequisites:
- You must have installed and configured the Manager and Data Warehouse on the same machine.
- To set up the new Data Warehouse machine, you must have the following:
- A virtual or physical machine with Red Hat Enterprise Linux 6.6 or later versions of Red Hat Enterprise Linux 6 installed.
- A subscription to the
Red Hat Enterprise Linux ServerandRed Hat Enterprise Virtualizationentitlement pools. - The password from the Manager's
/etc/ovirt-engine/engine.conf.d/10-setup-database.conffile. - Allowed access from the Data Warehouse machine to the Manager database machine's TCP port 5432.
- The
ovirt_engine_historydatabase credentials from the Manager's/etc/ovirt-engine-dwh/ovirt-engine-dwhd.conf.d/10-setup-database.conffile. If you migrated theovirt_engine_historydatabase using Section 1.4.1, “Migrating the Data Warehouse Database to a Separate Machine”, retrieve the credentials you defined during the database setup on that machine.
Procedure 1.10. Step 1: Setting up the New Data Warehouse Machine
- Register your system with the Content Delivery Network, entering your Customer Portal user name and password when prompted:
# subscription-manager register
- Find the
Red Hat Enterprise Linux ServerandRed Hat Enterprise Virtualizationsubscription pools and note down the pool IDs.# subscription-manager list --available
- Use the pool IDs located in the previous step to attach the entitlements to the system:
# subscription-manager attach --pool=pool_id
- Disable all existing repositories:
# subscription-manager repos --disable=*
- Enable the required channels:
# subscription-manager repos --enable=rhel-6-server-rpms
# subscription-manager repos --enable=rhel-6-server-supplementary-rpms
# subscription-manager repos --enable=rhel-6-server-rhevm-3.6-rpms
# subscription-manager repos --enable=jb-eap-6-for-rhel-6-server-rpms
- Ensure that all packages currently installed are up to date:
# yum update
- Install the rhevm-dwh-setup package:
# yum install rhevm-dwh-setup
Procedure 1.11. Step 2: Stopping the Data Warehouse Service on the Manager Machine
- Stop the Data Warehouse service:
# service ovirt-engine-dwhd stop
- If the
ovirt_engine_historydatabase, the Manager database, or both are hosted on the Manager machine and were configured by a previous version (Red Hat Enterprise Virtualization 3.4 or prior) that was then upgraded, you must allow the new Data Warehouse machine to access them. Edit the/var/lib/pgsql/data/postgresql.conffile and modify thelisten_addressesline so that it matches the following:listen_addresses = '*'
If the line does not exist or has been commented out, add it manually.If one or both databases are hosted on a remote machine, you must manually grant access by editing thepostgres.conffile on each machine, and adding thelisten_addressesline, as above. If both databases are hosted on the Manager machine and were configured during a clean setup of Red Hat Enterprise Virtualization Manager 3.5, access is granted by default. - Restart the postgresql service:
# service postgresql restart
Procedure 1.12. Step 3: Configuring the New Data Warehouse Machine
- Run the
engine-setupcommand to begin configuration of Data Warehouse on the machine:# engine-setup
- Press Enter to configure Data Warehouse:
Configure Data Warehouse on this host (Yes, No) [Yes]:
- Press Enter to automatically configure the firewall, or type
Noand press Enter to maintain existing settings:Setup can automatically configure the firewall on this system. Note: automatic configuration of the firewall may overwrite current settings. Do you want Setup to configure the firewall? (Yes, No) [Yes]:
If you choose to automatically configure the firewall, and no firewall managers are active, you are prompted to select your chosen firewall manager from a list of supported options. Type the name of the firewall manager and press Enter. This applies even in cases where only one option is listed. - Press Enter to accept the automatically detected hostname, or enter an alternative hostname and press Enter:
Host fully qualified DNS name of this server [autodetected host name]:
- Answer the following question about the location of the
ovirt_engine_historydatabase:Where is the DWH database located? (Local, Remote) [Local]: Remote
Type the alternative option as shown above and then press Enter. - Enter the fully qualified domain name and password for your
ovirt_engine_historydatabase host. Press Enter to accept the default values in each other field:DWH database host []: dwh-db-fqdn DWH database port [5432]: DWH database secured connection (Yes, No) [No]: DWH database name [ovirt_engine_history]: DWH database user [ovirt_engine_history]: DWH database password: password
- Enter the fully qualified domain name and password for the Manager database machine. Press Enter to accept the default values in each other field:
Engine database host []: engine-db-fqdn
Engine database port [5432]:
Engine database secured connection (Yes, No) [No]:
Engine database name [engine]:
Engine database user [engine]:
Engine database password: password
- Press Enter to create a backup of the existing Data Warehouse database:
Would you like to backup the existing database before upgrading it? (Yes, No) [Yes]:
The time and space required for the database backup depends on the size of the database. It may take several hours to complete. If you choose not to back up the database here, andengine-setupfails for any reason, you will not be able to restore the database or any of the data within it. The location of the backup file appears at the end of the setup script. - Confirm that you want to permanently disconnect the existing Data Warehouse service from the Manager:
Do you want to permanently disconnect this DWH from the engine? (Yes, No) [No]:
- Confirm your installation settings:
Please confirm installation settings (OK, Cancel) [OK]:
Procedure 1.13. Step 4: Removing the Data Warehouse Package from the Manager Machine
- Remove the Data Warehouse package:
# yum remove rhevm-dwh
This step prevents the Data Warehouse service from attempting to automatically restart after an hour. - Remove the Data Warehouse files:
# rm -rf /etc/ovirt-engine-dwh /var/lib/ovirt-engine-dwh
1.4.3. Migrating the Reports Service to a Separate Machine
ovirt_engine_reports database) cannot be migrated; you must create a new ovirt_engine_reports database when you configure Reports on the new machine. Saved ad hoc reports can be migrated from the Manager machine to the new Reports machine. Migrate the Reports service only after the Manager and Data Warehouse have been configured.
- Configure the new Reports machine.
- Migrate any saved reports to the new Reports machine.
- Remove the Reports service from the Manager machine.
Ensure that you have completed the following prerequisites:
- You must have installed and configured the Manager and Reports on the same machine.
- You must have installed and configured Data Warehouse, either on the Manager machine or on a separate machine.
- To set up the new Reports machine, you must have the following:
- A virtual or physical machine with Red Hat Enterprise Linux 6.6 or later versions of Red Hat Enterprise Linux 6 installed
- A subscription to the
Red Hat Enterprise Linux ServerandRed Hat Enterprise Virtualizationentitlement pools - The password from the Data Warehouse machine's
/etc/ovirt-engine-dwh/ovirt-engine-dwhd.conf.d/10-setup-database.conffile - Allowed access from the Reports machine to the Manager database machine's TCP port 5432
Procedure 1.14. Step 1: Configuring the New Reports Machine
- Register your system with the Content Delivery Network, entering your Customer Portal user name and password when prompted:
# subscription-manager register
- Find the
Red Hat Enterprise Linux ServerandRed Hat Enterprise Virtualizationsubscription pools and note down the pool IDs.# subscription-manager list --available
- Use the pool IDs located in the previous step to attach the entitlements to the system:
# subscription-manager attach --pool=pool_id
- Disable all existing repositories:
# subscription-manager repos --disable=*
- Enable the required channels:
# subscription-manager repos --enable=rhel-6-server-rpms
# subscription-manager repos --enable=rhel-6-server-supplementary-rpms
# subscription-manager repos --enable=rhel-6-server-rhevm-3.6-rpms
# subscription-manager repos --enable=jb-eap-6-for-rhel-6-server-rpms
- Ensure that all packages currently installed are up to date:
# yum update
- Install the rhevm-reports-setup package:
# yum install rhevm-reports-setup
- Run the
engine-setupcommand to begin configuration of Reports on the machine:# engine-setup
- Press Enter to configure Reports:
Configure Reports on this host (Yes, No) [Yes]:
- Press Enter to automatically configure the firewall, or type
Noand press Enter to maintain existing settings:Setup can automatically configure the firewall on this system. Note: automatic configuration of the firewall may overwrite current settings. Do you want Setup to configure the firewall? (Yes, No) [Yes]:
If you choose to automatically configure the firewall, and no firewall managers are active, you are prompted to select your chosen firewall manager from a list of supported options. Type the name of the firewall manager and press Enter. This applies even in cases where only one option is listed. - Press Enter to accept the automatically detected hostname, or enter an alternative hostname and press Enter:
Host fully qualified DNS name of this server [autodetected host name]:
- Enter the fully qualified domain name of the Manager machine, and then press Enter:
Host fully qualified DNS name of the engine server []:
- Answer the following questions about the
ovirt_engine_reportsdatabase. Press Enter to allow setup to create and configure a local database:Where is the Reports database located? (Local, Remote) [Local]: Setup can configure the local postgresql server automatically for the Reports to run. This may conflict with existing applications. Would you like Setup to automatically configure postgresql and create Reports database, or prefer to perform that manually? (Automatic, Manual) [Automatic]:
- Enter the fully qualified domain name and password for your
ovirt_engine_historydatabase host. Press Enter to accept the default values in each other field:DWH database host []: dwh-db-fqdn DWH database port [5432]: DWH database secured connection (Yes, No) [No]: DWH database name [ovirt_engine_history]: DWH database user [ovirt_engine_history]: DWH database password: password
- Press Enter to allow setup to sign the Reports certificate and Apache certificate on the Manager via SSH:
Setup will need to do some actions on the remote engine server. Either automatically, using ssh as root to access it, or you will be prompted to manually perform each such action.
Please choose one of the following:
1 - Access remote engine server using ssh as root
2 - Perform each action manually, use files to copy content around
(1, 2) [1]:
- Press Enter to accept the default SSH port, or enter an alternative port number and then press Enter:
ssh port on remote engine server [22]:
- Enter the root password for the Manager machine:
root password on remote engine server manager-fqdn.com:
- Press Enter to allow automatic configuration of SSL on Apache:
Setup can configure apache to use SSL using a certificate issued from the internal CA.
Do you wish Setup to configure that, or prefer to perform that manually? (Automatic, Manual) [Automatic]:
- Set a password for the Reports administrative users (
adminandsuperuser). Note that the reports system maintains its own set of credentials that are separate to those used for the Manager:Reports power users password:
You are prompted to enter the password a second time to confirm it. - Confirm your installation settings:
Please confirm installation settings (OK, Cancel) [OK]:
Procedure 1.15. Step 2: Migrating Saved Reports to the New Reports Machine
- On the Manager machine, run the
ovirt-engine-reports-toolcommand:# ovirt-engine-reports-tool
- Enter the number that corresponds to the export option, and press Enter:
(2) Export Jasperreports saved reports to a zip file
(1, 2, 3) []: 2
- Enter the absolute path for the zip file to export saved reports to, and press Enter:
Filename to export saved reports to: /tmp/saved-reports.zip
- Copy the zip file to the new Reports machine:
# scp /tmp/saved-reports.zip reports-machine-fqdn:/tmp/
- On the new Reports machine, run the
ovirt-engine-reports-toolcommand:# ovirt-engine-reports-tool
- Enter the number that corresponds to the import option, and press Enter:
(3) Import a saved reports zip file to Jasperreports
(1, 2, 3) []: 3
- Enter the absolute path of the zip file from which to import, and press Enter:
Filename to import saved reports from: /tmp/saved-reports.zip
Procedure 1.16. Step 3: Removing the Reports Service from the Manager Machine
- Stop the Reports service:
# service ovirt-engine-reportsd stop
- Remove the Reports package:
# yum remove rhevm-reports
- Remove the Reports files:
# rm -rf /etc/ovirt-engine-reports /var/lib/ovirt-engine-reports
- Remove the Reports database and user. The default name for both is
ovirt_engine_reports:# su - postgres $ psql postgres=# drop database ovirt_engine_reports; postgres=# drop user ovirt_engine_reports;
Note
engine-setup. This means that the Administration Portal includes dashboards from and direct links to only the most recent Reports installation.
Chapter 2. About History Database, Reports, and Dashboards
2.1. Introduction
2.1.1. History Database Overview
Warning
SELECT statement. The result of the SELECT statement populates the virtual table that the view returns. A user references the view name in PL/PGSQL statements the same way a table is referenced.
2.1.2. JasperReports and JasperServer in Red Hat Enterprise Virtualization
2.2. History Database
2.2.1. Red Hat Enterprise Virtualization History Database
ovirt_engine_history) which tracks the engine database over time.
Important
2.2.2. Tracking Configuration History
ovirt-engine-dwhd, tracks three types of changes:
- A new entity is added to the engine database - the ETL Service replicates the change to the ovirt_engine_history database as a new entry.
- An existing entity is updated - the ETL Service replicates the change to the ovirt_engine_history database as a new entry.
- An entity is removed from the engine database - A new entry in the ovirt_engine_history database flags the corresponding entity as removed. Removed entities are only flagged as removed. To maintain correctness of historical reports and representations, they are not physically removed.
- a
history_idto indicate the configuration version of the entity; - a
create_datefield to indicate when the entity was added to the system; - an
update_datefield to indicate when the entity was changed; and - a
delete_datefield to indicate the date the entity was removed from the system.
2.2.3. Recording Statistical History
2.2.4. Application Settings for the Data Warehouse service in ovirt-engine-dwhd.conf
/usr/share/ovirt-engine-dwh/services/ovirt-engine-dwhd/ovirt-engine-dwhd.conf file. Configure any changes to the default values in an override file under /etc/ovirt-engine-dwh/ovirt-engine-dwhd.conf.d/. Restart the Data Warehouse service after saving the changes.
Table 2.1. ovirt-engine-dwhd.conf application settings variables
| Variable name | Default Value | Remarks |
|---|---|---|
DWH_DELETE_JOB_HOUR | 3 | The time at which a deletion job is run. Specify a value between 0 and 23, where 0 is midnight. |
DWH_SAMPLING | 60 | The interval, in seconds, at which data is collected into statistical tables. |
DWH_TABLES_KEEP_SAMPLES | 24 | The number of hours that data from DWH_SAMPLING is stored. Data more than two hours old is aggregated into hourly data. |
DWH_TABLES_KEEP_HOURLY | 1440 | The number of hours that hourly data is stored. The default is 60 days. Hourly data more than two days old is aggregated into daily data. |
DWH_TABLES_KEEP_DAILY | 43800 | The number of hours that daily data is stored. The default is five years. |
DWH_ERROR_EVENT_INTERVAL | 300000 | The minimum interval, in milliseconds, at which errors are pushed to the Manager's audit.log. |
2.2.5. Tracking Tag History
- A tag is created in the Administration Portal - the ETL Service copies the tag details, position in the tag tree and relation to other objects in the tag tree.
- A entity is attached to the tag tree in the Administration Portal - the ETL Service replicates the addition to the ovirt_engine_history database as a new entry.
- A tag is updated - the ETL Service replicates the change of tag details to the ovirt_engine_history database as a new entry.
- An entity or tag branch is removed from the Administration Portal - the ovirt_engine_history database flags the corresponding tag and relations as removed in new entries. Removed tags and relations are only flagged as removed or detached. In order to maintain correctness of historical reports and representations, they are not physically removed.
- A tag branch is moved - the corresponding tag and relations are updated as new entries. Moved tags and relations are only flagged as updated. In order to maintain correctness of historical reports and representations, they are not physically updated.
2.2.6. Allowing Read-Only Access to the History Database
To allow access to the history database without allowing edits, you must create a read-only PostgreSQL user that can log in to and read from the ovirt_engine_history database. This procedure must be executed on the system on which the history database is installed.
Procedure 2.1. Allowing Read-Only Access to the History Database
- Create the user to be granted read-only access to the history database:
# psql -U postgres -c "CREATE ROLE [user name] WITH LOGIN ENCRYPTED PASSWORD '[password]';" -d ovirt_engine_history
- Grant the newly created user permission to connect to the history database:
# psql -U postgres -c "GRANT CONNECT ON DATABASE ovirt_engine_history TO [user name];"
- Grant the newly created user usage of the
publicschema:# psql -U postgres -c "GRANT USAGE ON SCHEMA public TO [user name];" ovirt_engine_history
- Generate the rest of the permissions that will be granted to the newly created user and save them to a file:
# psql -U postgres -c "SELECT 'GRANT SELECT ON ' || relname || ' TO [user name];' FROM pg_class JOIN pg_namespace ON pg_namespace.oid = pg_class.relnamespace WHERE nspname = 'public' AND relkind IN ('r', 'v');" --pset=tuples_only=on ovirt_engine_history > grant.sql - Use the file you created in the previous step to grant permissions to the newly created user:
# psql -U postgres -f grant.sql ovirt_engine_history
- Remove the file you used to grant permissions to the newly created user:
# rm grant.sql
You can now access the ovirt_engine_history database with the newly created user using the following command:
# psql -U [user name] ovirt_engine_history
SELECT statements against tables and views in the ovirt_engine_history database succeed, while modifications fail.
2.2.7. Reports Examples
This example produces a resource utilization report for a single host. The resource utilization report provides CPU- and memory-usage percentage information from readings taken at one-minute intervals. This kind of report is useful for gaining insight into the load factor of an individual host over a short period of time. The report is defined by the following SQL query. Ensure the values provided for the host_name and history_datetime components of the where clause are substituted with the appropriate values for your environment and that the latest configuration is in use.
Example 2.1. Report query for resource utilization on a single host
 select history_datetime as DateTime, cpu_usage_percent as CPU, memory_usage_percent as Memory
    from host_configuration, host_samples_history
    where host_configuration.host_id = host_samples_history.host_id
    and host_name = 'example.labname.abc.company.com'
    and host_configuration.history_id in (select max(a.history_id)
    						from host_configuration as a
    						where host_configuration.host_id = a.host_id)
    and history_datetime >= '2011-07-01 18:45'
    and history_datetime <= '2011-07-31 21:45'
Table 2.2. Resource Utilization for a Single Host Example Data
| DateTime | CPU | Memory |
|---|---|---|
| 2010-07-01 18:45 | 42 | 0 |
| 2010-07-01 18:46 | 42 | 0 |
| 2010-07-01 18:47 | 42 | 1 |
| 2010-07-01 18:48 | 33 | 0 |
| 2010-07-01 18:49 | 33 | 0 |
| 2010-07-01 18:50 | 25 | 1 |

Figure 2.1. Single host utilization line graph
This example produces an aggregated resource utilization report across all hosts in the Red Hat Enterprise Virtualization Manager environment. Aggregated usage percentages for CPU and memory are shown with an hourly temporal resolution. This kind of report reveals utilization trends for the entire environment over a long period of time and is useful for capacity planning purposes. The following SQL query defines the report. Ensure the values provided for the history_datetime components of the where clause are substituted with appropriate values for your environment.
Example 2.2. Report query for resource utilization across all hosts
    select extract(hour from history_datetime) as Hour, avg(cpu_usage_percent) as CPU, avg(memory_usage_percent) as Memory
    from host_hourly_history
    where history_datetime >= '2011-07-01' and history_datetime < '2011-07-31'
    group by extract(hour from history_datetime)
    order by extract(hour from history_datetime)
Table 2.3. Resource utilization across all hosts example data
| Hour | CPU | Memory |
|---|---|---|
| 0 | 39 | 40 |
| 1 | 38 | 38 |
| 2 | 37 | 32 |
| 3 | 35 | 45 |
| 4 | 35 | 37 |
| 5 | 36 | 37 |
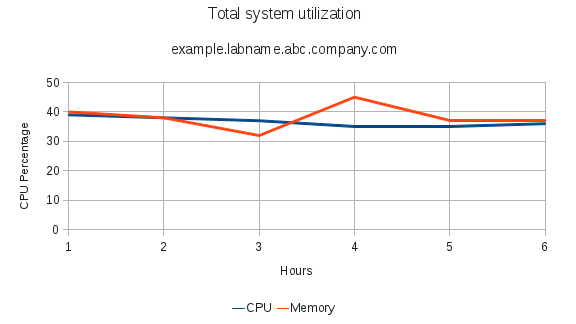
Figure 2.2. Total system utilization line graph
This example filters the latest virtual machine configuration list using the history tag tables. This kind of report demonstrates usage of the tags tree built in the Red Hat Enterprise Virtualization Manager to filter lists. The following SQL query defines this report. This query uses a predefined function that receives tag history IDs and returns the tag path with latest names of the tags in the Administration Portal. Ensure the values provided for the function result components of the where clause are substituted with appropriate values for your environment.
Example 2.3.
	SELECT vm_name
  FROM vm_configuration
		inner join latest_tag_relations_history on (vm_configuration.vm_id = latest_tag_relations_history.entity_id)
			inner join latest_tag_details on (latest_tag_details.tag_id = latest_tag_relations_history.parent_id)
 WHERE getpathinnames(latest_tag_details.history_id) like '/root/tlv%'
Table 2.4. Tag Filtering of Latest Virtual Machine Configuration
| vm_name |
|---|
| RHEL6-Pool-67 |
| RHEL6-Pool-5 |
| RHEL6-Pool-6 |
| RHEL6-23 |
This example produces a list of all current virtual machines names, types and operating systems in the Red Hat Enterprise Virtualization Manager environment. This kind of report demonstrates the usage of the ENUM table. The following SQL query defines this report:
Example 2.4.
SELECT 	vm_name, vm_type, operating_system
  FROM 	vm_configuration
		inner join enum_translator as vm_type_value on (vm_type_value.enum_type = 'VM_TYPE' and vm_configuration.vm_type = vm_type_value.enum_key)
		inner join enum_translator as os_value on (os_value.enum_type = 'OS_TYPE' and vm_configuration.operating_system = os_value.enum_key)
Table 2.5. Current Virtual Machines' Names, Types, and Operating Systems
| vm_name | vm_type | operating_system |
|---|---|---|
| RHEL6-Pool-2 | Desktop | RHEL 6 x64 |
| RHEL6-Pool-1 | Desktop | RHEL 6 x64 |
| RHEL6-Pool-3 | Desktop | RHEL 6 x64 |
| RHEL6-Pool-4 | Desktop | RHEL 6 x64 |
| RHEL6-Pool-5 | Desktop | RHEL 6 x64 |
2.2.8. Statistics History Views
2.2.8.1. Statistics History Views
2.2.8.2. Datacenter Statistics Views
Table 2.6. Historical Statistics for Each Data Center in the System
| Name | Type | Description |
|---|---|---|
| history_id | bigint | The unique ID of this row in the table. |
| history_datetime | timestamp with time zone | The timestamp of this history row (rounded to minute, hour, day as per the aggregation level). |
| datacenter_id | uuid | The unique ID of the data center. |
| datacenter_status | smallint |
|
| minutes_in_status | decimal | The total number of minutes that the data center was in the status shown in the datacenter_status column for the aggregation period. For example, if a data center was up for 55 minutes and in maintenance mode for 5 minutes during an hour, two rows will show for this hour. One will have a datacenter_status of Up and minutes_in_status of 55, the other will have a datacenter_status of Maintenance and a minutes_in_status of 5. |
| datacenter_configuration_version | integer | The data center configuration version at the time of sample. |
2.2.8.3. Storage Domain Statistics Views
Table 2.7. Historical Statistics for Each Storage Domain in the System
| Name | Type | Description |
|---|---|---|
| history_id | bigint | The unique ID of this row in the table. |
| history_datetime | timestamp with time zone | The timestamp of this history row (rounded to minute, hour, day as per the aggregation level). |
| storage_domain_id | uuid | Unique ID of the storage domain in the system. |
| available_disk_size_gb | integer | The total available (unused) capacity on the disk, expressed in gigabytes (GB). |
| used_disk_size_gb | integer | The total used capacity on the disk, expressed in gigabytes (GB). |
| storage_configuration_version | integer | The storage domain configuration version at the time of sample. |
| storage_domain_status | smallint | The storage domain status. |
| minutes_in_status | decimal | The total number of minutes that the storage domain was in the status shown state as shown in the status column for the aggregation period. For example, if a storage domain was "Active" for 55 minutes and "Inactive" for 5 minutes within an hour, two rows will be reported in the table for the same hour. One row will have a status of Active with minutes_in_status of 55, the other will have a status of Inactive and minutes_in_status of 5. |
2.2.8.4. Host Statistics Views
Table 2.8. Historical Statistics for Each Host in the System
| Name | Type | Description |
|---|---|---|
| history_id | bigint | The unique ID of this row in the table. |
| history_datetime | timestamp with time zone | The timestamp of this history row (rounded to minute, hour, day as per the aggregation level). |
| host_id | uuid | Unique ID of the host in the system. |
| host_status | smallint |
|
| minutes_in_status | decimal | The total number of minutes that the host was in the status shown in the status column for the aggregation period. For example, if a host was up for 55 minutes and down for 5 minutes during an hour, two rows will show for this hour. One will have a status of Up and minutes_in_status of 55, the other will have a status of Down and a minutes_in_status of 5. |
| memory_usage_percent | smallint | Percentage of used memory on the host. |
| max_memory_usage | smallint | The maximum memory usage for the aggregation period, expressed as a percentage. For hourly aggregations, this is the maximum collected sample value. For daily aggregations, it is the maximum hourly average value. |
| cpu_usage_percent | smallint | Used CPU percentage on the host. |
| max_cpu_usage | smallint | The maximum CPU usage for the aggregation period, expressed as a percentage. For hourly aggregations, this is the maximum collected sample value. For daily aggregations, it is the maximum hourly average value. |
| ksm_cpu_percent | smallint | CPU percentage ksm on the host is using. |
| max_ksm_cpu_percent | smallint | The maximum KSM usage for the aggregation period, expressed as a percentage. For hourly aggregations, this is the maximum collected sample value. For daily aggregations, it is the maximum hourly average value. |
| active_vms | smallint | The average number of active virtual machines for this aggregation. |
| max_active_vms | smallint | The maximum active number of virtual machines for the aggregation period. For hourly aggregations, this is the maximum collected sample value. For daily aggregations, it is the maximum hourly average value. |
| total_vms | smallint | The average number of all virtual machines on the host for this aggregation. |
| max_total_vms | smallint | The maximum total number of virtual machines for the aggregation period. For hourly aggregations, this is the maximum collected sample value. For daily aggregations, it is the maximum hourly average value. |
| total_vms_vcpus | smallint | Total number of VCPUs allocated to the host. |
| max_total_vms_vcpus | smallint | The maximum total virtual machine VCPU number for the aggregation period. For hourly aggregations, this is the maximum collected sample value. For daily aggregations, it is the maximum hourly average value. |
| cpu_load | smallint | The CPU load of the host. |
| max_cpu_load | smallint | The maximum CPU load for the aggregation period. For hourly aggregations, this is the maximum collected sample value. For daily aggregations, it is the maximum hourly average value. |
| system_cpu_usage_percent | smallint | Used CPU percentage on the host. |
| max_system_cpu_usage_percent | smallint | The maximum system CPU usage for the aggregation period, expressed as a percentage. For hourly aggregations, this is the maximum collected sample value. For daily aggregations, it is the maximum hourly average value. |
| user_cpu_usage_percent | smallint | Used user CPU percentage on the host. |
| max_user_cpu_usage_percent | smallint | The maximum user CPU usage for the aggregation period, expressed as a percentage. For hourly aggregations, this is the maximum collected sample value. For daily aggregations, it is the maximum hourly average value. |
| swap_used_mb | integer | Used swap size usage of the host in megabytes (MB). |
| max_swap_used_mb | integer | The maximum user swap size usage of the host for the aggregation period in megabytes (MB), expressed as a percentage. For hourly aggregations, this is the maximum collected sample value. For daily aggregations, it is the maximum hourly average value. |
| host_configuration_version | integer | The host configuration version at the time of sample. |
| ksm_shared_memory_mb | bigint | The Kernel Shared Memory size in megabytes (MB) that the host is using. |
| max_ksm_shared_memory_mb | bigint | The maximum KSM memory usage for the aggregation period expressed in megabytes (MB). For hourly aggregations, this is the maximum collected sample value. For daily aggregations, it is the maximum hourly average value. |
2.2.8.5. Host Interface Statistics Views
Table 2.9. Historical Statistics for Each Host Network Interface in the System
| Name | Type | Description |
|---|---|---|
| history_id | bigint | The unique ID of this row in the table. |
| history_datetime | timestamp with time zone | The timestamp of this history view (rounded to minute, hour, day as per the aggregation level). |
| host_interface_id | uuid | Unique identifier of the interface in the system. |
| receive_rate_percent | smallint | Used receive rate percentage on the host. |
| max_receive_rate_percent | smallint | The maximum receive rate for the aggregation period, expressed as a percentage. For hourly aggregations, this is the maximum collected sample value. For daily aggregations, it is the maximum hourly average value. |
| transmit_rate_percent | smallint | Used transmit rate percentage on the host. |
| max_transmit_rate_percent | smallint | The maximum transmit rate for the aggregation period, expressed as a percentage. For hourly aggregations, this is the maximum collected sample value. For daily aggregations, it is the maximum hourly average value. |
| host_interface_configuration_version | integer | The host interface configuration version at the time of sample. |
2.2.8.6. Virtual Machine Statistics Views
Table 2.10. Historical statistics for the virtual machines in the system
| Name | Type | Description |
|---|---|---|
| history_id | bigint | The unique ID of this row in the table. |
| history_datetime | timestamp with time zone | The timestamp of this history row (rounded to minute, hour, day as per the aggregation level). |
| vm_id | uuid | Unique ID of the virtual machine in the system. |
| vm_status | smallint |
|
| minutes_in_status | decimal | The total number of minutes that the virtual machine was in the status shown in the status column for the aggregation period. For example, if a virtual machine was up for 55 minutes and down for 5 minutes during an hour, two rows will show for this hour. One will have a status of Up and minutes_in_status, the other will have a status of Down and a minutes_in_status of 5. |
| cpu_usage_percent | smallint | The percentage of the CPU in use by the virtual machine. |
| max_cpu_usage | smallint | The maximum CPU usage for the aggregation period, expressed as a percentage. For hourly aggregations, this is the maximum collected sample value. For daily aggregations, it is the maximum hourly average value. |
| memory_usage_percent | smallint | Percentage of used memory in the virtual machine. The guest tools must be installed on the virtual machine for memory usage to be recorded. |
| max_memory_usage | smallint | The maximum memory usage for the aggregation period, expressed as a percentage. For hourly aggregations, this is the maximum collected sample value. For daily aggregations, it is the maximum hourly average value. The guest tools must be installed on the virtual machine for memory usage to be recorded. |
| user_cpu_usage_percent | smallint | Used user CPU percentage on the host. |
| max_user_cpu_usage_percent | smallint | The maximum user CPU usage for the aggregation period, expressed as a percentage. For hourly aggregations, this is the maximum collected sample value. For daily aggregation, it is the maximum hourly average value. |
| system_cpu_usage_percent | smallint | Used system CPU percentage on the host. |
| max_system_cpu_usage_percent | smallint | The maximum system CPU usage for the aggregation period, expressed as a percentage. For hourly aggregations, this is the maximum collected sample value. For daily aggregations, it is the maximum hourly average value. |
| vm_ip | varchar(255) | The IP address of the first NIC. Only shown if the guest agent is installed. |
| current_user_name | varchar(255) | Name of user logged into the virtual machine console, if a guest agent is installed. |
| currently_running_on_host | uuid | The unique ID of the host the virtual machine is running on. |
| vm_configuration_version | integer | The virtual machine configuration version at the time of sample. |
| current_host_configuration_version | integer | The current host the virtual machine is running on. |
| current_user_id | uuid | The unique ID of the user in the system. This ID is generated by the Manager. |
2.2.8.7. Virtual Machine Interface Statistics Views
Table 2.11. Historical Statistics for the Virtual Machine Network Interfaces in the System
| Name | Type | Description |
|---|---|---|
| history_id | bigint | The unique ID of this row in the table. |
| history_datetime | timestamp with time zone | The timestamp of this history row (rounded to minute, hour, day as per the aggregation level). |
| vm_interface_id | uuid | Unique identifier of the interface in the system. |
| receive_rate_percent | smallint | Used receive rate percentage on the host. |
| max_receive_rate_percent | smallint | The maximum receive rate for the aggregation period, expressed as a percentage. For hourly aggregations, this is the maximum collected sample value. For daily aggregations, it is the maximum hourly average value. |
| transmit_rate_percent | smallint | Used transmit rate percentage on the host. |
| max_transmit_rate_percent | smallint | The maximum transmit rate for the aggregation period, expressed as a percentage. For hourly aggregations, this is the maximum collected sample value. For daily aggregations, it is the maximum hourly average rate. |
| vm_interface_configuration_version | integer | The virtual machine interface configuration version at the time of sample. |
2.2.8.8. Virtual Machine Disk Statistics Views
Table 2.12. Historical Statistics for the Virtual Disks in the System
| Name | Type | Description |
|---|---|---|
| history_id | bigint | The unique ID of this row in the table. |
| history_datetime | timestamp with time zone | The timestamp of this history row (rounded to minute, hour, day as per the aggregation level). |
| vm_disk_id | uuid | Unique ID of the disk in the system. |
| vm_disk_status | integer |
|
| minutes_in_status | decimal | The total number of minutes that the virtual machine disk was in the status shown in the status column for the aggregation period. For example, if a virtual machine disk was locked for 55 minutes and OK for 5 minutes during an hour, two rows will show for this hour. One will have a status of Locked and minutes_in_status of 55, the other will have a status of OK and a minutes_in_status of 5. |
| vm_disk_actual_size_mb | integer | The actual size allocated to the disk. |
| read_rate_bytes_per_second | integer | Read rate to disk in bytes per second. |
| max_read_rate_bytes_per_second | integer | The maximum read rate for the aggregation period. For hourly aggregations, this is the maximum collected sample value. For daily aggregations, it is the maximum hourly average value. |
| read_latency_seconds | decimal | The virtual machine disk read latency measured in seconds. |
| max_read_latency_seconds | decimal | The maximum read latency for the aggregation period, measured in seconds. For hourly aggregations, this is the maximum collected sample value. For daily aggregations, it is the maximum hourly average value. |
| write_rate_bytes_per_second | integer | Write rate to disk in bytes per second. |
| max_write_rate_bytes_per_second | integer | The maximum write rate for the aggregation period. For hourly aggregations, this is the maximum collected sample value. For daily aggregations, it is the maximum hourly average value. |
| write_latency_seconds | decimal | The virtual machine disk write latency measured in seconds. |
| max_write_latency_seconds | decimal | The maximum write latency for the aggregation period, measured in seconds. For hourly aggregations, this is the maximum collected sample value. For daily aggregations, it is the maximum hourly average value. |
| flush_latency_seconds | decimal | The virtual machine disk flush latency measured in seconds. |
| max_flush_latency_seconds | decimal | The maximum flush latency for the aggregation period, measured in seconds. For hourly aggregations, this is the maximum collected sample value. For daily aggregations, it is the maximum hourly average value. |
| vm_disk_configuration_version | integer | The virtual machine disk configuration version at the time of sample. |
2.2.9. Configuration History Views
2.2.9.1. Configuration History Views
Note
delete_date does not appear in latest views because these views provide the latest configuration of living entities, which, by definition, have not been deleted.
2.2.9.2. Data Center Configuration
Table 2.13. v3_5_configuration_history_datacenters
| Name | Type | Description |
|---|---|---|
| history_id | integer | The ID of the configuration version in the history database. |
| datacenter_id | uuid | The unique ID of the data center in the system. |
| datacenter_name | varchar(40) | Name of the data center, as displayed in the edit dialog. |
| datacenter_description | varchar(4000) | Description of the data center, as displayed in the edit dialog. |
| storage_type | smallint |
|
| create_date | timestamp with time zone | The date this entity was added to the system. |
| update_date | timestamp with time zone | The date this entity was changed in the system. |
| delete_date | timestamp with time zone | The date this entity was deleted from the system. |
2.2.9.3. Datacenter Storage Domain Map
Table 2.14. v3_5_map_history_datacenters_storage_domains
| Name | Type | Description |
|---|---|---|
| history_id | integer | The ID of the configuration version in the history database. |
| storage_domain_id | uuid | The unique ID of this storage domain in the system. |
| datacenter_id | uuid | The unique ID of the data center in the system. |
| attach_date | timestamp with time zone | The date the storage domain was attached to the data center. |
| detach_date | timestamp with time zone | The date the storage domain was detached from the data center. |
2.2.9.4. Storage Domain Configuration
Table 2.15. v3_5_configuration_history_storage_domains
| Name | Type | Description |
|---|---|---|
| history_id | integer | The ID of the configuration version in the history database. |
| storage_domain_id | uuid | The unique ID of this storage domain in the system. |
| storage_domain_name | varchar(250) | Storage domain name. |
| storage_domain_type | smallint |
|
| storage_type | smallint |
|
| create_date | timestamp with time zone | The date this entity was added to the system. |
| update_date | timestamp with time zone | The date this entity was changed in the system. |
| delete_date | timestamp with time zone | The date this entity was deleted from the system. |
2.2.9.5. Cluster Configuration
Table 2.16. v3_5_configuration_history_clusters
| Name | Type | Description |
|---|---|---|
| history_id | integer | The ID of the configuration version in the history database. |
| cluster_id | uuid | The unique identifier of the datacenter this cluster resides in. |
| cluster_name | varchar(40) | Name of the cluster, as displayed in the edit dialog. |
| cluster_description | varchar(4000) | As defined in the edit dialog. |
| datacenter_id | uuid | The unique identifier of the datacenter this cluster resides in. |
| cpu_name | varchar(255) | As displayed in the edit dialog. |
| compatibility_version | varchar(40) | As displayed in the edit dialog. |
| datacenter_configuration_version | integer | The data center configuration version at the time of creation or update. |
| create_date | timestamp with time zone | The date this entity was added to the system. |
| update_date | timestamp with time zone | The date this entity was changed in the system. |
| delete_date | timestamp with time zone | The date this entity was deleted from the system. |
2.2.9.6. Host Configuration
Table 2.17. v3_5_configuration_history_hosts
| Name | Type | Description |
|---|---|---|
| history_id | integer | The ID of the configuration version in the history database. |
| host_id | uuid | The unique ID of the host in the system. |
| host_unique_id | varchar(128) | This field is a combination of the host physical UUID and one of its MAC addresses, and is used to detect hosts already registered in the system. |
| host_name | varchar(255) | Name of the host (same as in the edit dialog). |
| cluster_id | uuid | The unique ID of the cluster that this host belongs to. |
| host_type | smallint |
|
| fqdn_or_ip | varchar(255) | The host's DNS name or its IP address for Red Hat Enterprise Virtualization Manager to communicate with (as displayed in the edit dialog). |
| memory_size_mb | integer | The host's physical memory capacity, expressed in megabytes (MB). |
| swap_size_mb | integer | The host swap partition size. |
| cpu_model | varchar(255) | The host's CPU model. |
| number_of_cores | smallint | Total number of CPU cores in the host. |
| number_of_sockets | smallint | Total number of CPU sockets. |
| cpu_speed_mh | decimal | The host's CPU speed, expressed in megahertz (MHz). |
| host_os | varchar(255) | The host's operating system version. |
| pm_ip_address | varchar(255) | Power Management server IP address. |
| kernel_version | varchar(255) | The host's kernel version. |
| kvm_version | varchar(255) | The host's KVM version. |
| vdsm_version | varchar(40) | The host's VDSM version. |
| vdsm_port | integer | As displayed in the edit dialog. |
| cluster_configuration_version | integer | The cluster configuration version at the time of creation or update. |
| create_date | timestamp with time zone | The date this entity was added to the system. |
| update_date | timestamp with time zone | The date this entity was changed in the system. |
| delete_date | timestamp with time zone | The date this entity was deleted from the system. |
2.2.9.7. Host Interface Configuration
Table 2.18. v3_5_configuration_history_hosts_interfaces
| Name | Type | Description |
|---|---|---|
| history_id | integer | The ID of the configuration version in the history database. |
| host_interface_id | uuid | The unique ID of this interface in the system. |
| host_interface_name | varchar(50) | The interface name as reported by the host. |
| host_id | uuid | Unique ID of the host this interface belongs to. |
| host_interface_type | smallint |
|
| host_interface_speed_bps | integer | The interface speed in bits per second. |
| mac_address | varchar(20) | The interface MAC address. |
| logical_network_name | varchar(50) | The logical network associated with the interface. |
| ip_address | varchar(50) | As displayed in the edit dialog. |
| gateway | varchar(20) | As displayed in the edit dialog. |
| bond | Boolean | A flag to indicate if this interface is a bonded interface. |
| bond_name | varchar(50) | The name of the bond this interface is part of (if it is part of a bond). |
| vlan_id | integer | As displayed in the edit dialog. |
| host_configuration_version | integer | The host configuration version at the time of creation or update. |
| create_date | timestamp with time zone | The date this entity was added to the system. |
| update_date | timestamp with time zone | The date this entity was changed in the system. |
| delete_date | timestamp with time zone | The date this entity was deleted from the system. |
2.2.9.8. Virtual Machine Configuration
Table 2.19. v3_5_configuration_history_vms
| Name | Type | Description |
|---|---|---|
| history_id | integer | The ID of the configuration version in the history database. |
| vm_id | uuid | The unique ID of this VM in the system. |
| vm_name | varchar(255) | The name of the VM. |
| vm_description | varchar(4000) | As displayed in the edit dialog. |
| vm_type | smallint |
|
| cluster_id | uuid | The unique ID of the cluster this VM belongs to. |
| template_id | uuid | The unique ID of the template this VM is derived from. The field is for future use, as the templates are not synchronized to the history database in this version. |
| template_name | varchar(40) | Name of the template from which this VM is derived. |
| cpu_per_socket | smallint | Virtual CPUs per socket. |
| number_of_sockets | smallint | Total number of virtual CPU sockets. |
| memory_size_mb | integer | Total memory allocated to the VM, expressed in megabytes (MB). |
| operating_system | smallint |
|
| default_host | uuid | As displayed in the edit dialog, the ID of the default host in the system. |
| high_availability | Boolean | As displayed in the edit dialog. |
| initialized | Boolean | A flag to indicate if this VM was started at least once for Sysprep initialization purposes. |
| stateless | Boolean | As displayed in the edit dialog. |
| fail_back | Boolean | As displayed in the edit dialog. |
| usb_policy | smallint | As displayed in the edit dialog. |
| time_zone | varchar(40) | As displayed in the edit dialog. |
| cluster_configuration_version | integer | The cluster configuration version at the time of creation or update. |
| default_host_configuration_version | integer | The host configuration version at the time of creation or update. |
| create_date | timestamp with time zone | The date this entity was added to the system. |
| update_date | timestamp with time zone | The date this entity was changed in the system. |
| delete_date | timestamp with time zone | The date this entity was deleted from the system. |
| vm_pool_id | uuid | The virtual machine's pool unique ID. |
| vm_pool_name | varchar(255) | The name of the virtual machine's pool. |
2.2.9.9. Virtual Machine Interface Configuration
Table 2.20. v3_5_configuration_history_vms_interfaces
| Name | Type | Description |
|---|---|---|
| history_id | integer | The ID of the configuration version in the history database. |
| vm_interface_id | uuid | The unique ID of this interface in the system. |
| vm_interface_name | varchar(50) | As displayed in the edit dialog. |
| vm_interface_type | smallint |
The type of the virtual interface.
|
| vm_interface_speed_bps | integer | The average speed of the interface during the aggregation in bits per second. |
| mac_address | varchar(20) | As displayed in the edit dialog. |
| logical_network_name | varchar(50) | As displayed in the edit dialog. |
| vm_configuration_version | integer | The virtual machine configuration version at the time of creation or update. |
| create_date | timestamp with time zone | The date this entity was added to the system. |
| update_date | timestamp with time zone | The date this entity was changed in the system. |
| delete_date | timestamp with time zone | The date this entity was deleted from the system. |
2.2.9.10. Virtual Machine Device Configuration
Table 2.21. v3_5_configuration_history_vms_devices
| Name | Type | Description |
|---|---|---|
| history_id | integer | The ID of the configuration version in the history database. |
| vm_id | uuid | The unique ID of the virtual machine in the system. |
| type | varchar(30) | VM Device Type which can be "disk" or "interface" |
| address | varchar(255) | The virtual machine's device physical address |
| is_managed | Boolean | Flag that indicates if the device is managed by the Manager |
| is_plugged | Boolean | Flag that indicates if the device is plugged into the virtual machine. |
| is_readonly | Boolean | Flag that indicates if the device is read only. |
| vm_configuration_version | integer | The virtual machine configuration version at the time the sample was taken. |
| device_configuration_version | integer | The device configuration version at the time the sample was taken. |
| create_date | timestamp with time zone | The date this entity was added to the system. |
| update_date timestamp | timestamp with time zone | The date this entity was added to the system. |
| delete_date | timestamp with time zone | The date this entity was added to the system. |
2.2.9.11. Virtual Machine Disk Configuration
Table 2.22. v3_5_configuration_history_vms_disks
| Name | Type | Description |
|---|---|---|
| history_id | integer | The ID of the configuration version in the history database. |
| vm_disk_id | uuid | The unique ID of this disk in the system. |
| vm_disk_description | varchar(4000) | As displayed in the edit dialog. |
| storage_domain_id | uuid | The ID of the storage domain this disk image belongs to. |
| vm_disk_size_mb | integer | The defined size of the disk in megabytes (MB). |
| vm_disk_type | integer |
As displayed in the edit dialog. Only System and data are currently used.
|
| vm_disk_format | integer |
As displayed in the edit dialog.
|
| vm_disk_interface | integer |
|
| create_date | timestamp with time zone | The date this entity was added to the system. |
| update_date | timestamp with time zone | The date this entity was changed in the system. |
| delete_date | timestamp with time zone | The date this entity was deleted from the system. |
| is_shared | Boolean | Flag that indicates if the virtual machine's disk is shared. |
| image_id | uuid | The unique ID of the image in the system. |
2.2.9.12. User Details History
Table 2.23. v3_6_users_details_history view
| Name | Type | Description |
|---|---|---|
| user_id | uuid | The unique ID of the user in the system as generated by Manager. |
| first_name | varchar(255) | The user's first name. |
| last_name | varchar(255) | The user's last name. |
| domain | varchar(255) | The name of the authorization extension. |
| username | varchar(255) | The account name |
| department | varchar(255) | The organizational department the user belongs to. |
| user_role_title | varchar(255) | The title or role of the user within the organization. |
| varchar(255) | The email of the user in the organization. | |
| external_id | text | The unique identifier of the user from the external system. |
| active | Boolean | If the user is active or not - this is being checked once in an hour, if the user can be found in the authorization extension then it will remain active. A user can be turned to active also on successful login. |
| create_date | timestamp with time zone | The date this entity was added to the system. |
| update_date | timestamp with time zone | The date this entity was changed in the system. |
| delete_date | timestamp with time zone | The date this entity was deleted from the system. |
2.3. Reports
2.3.1. Online Help for JasperReports

Figure 2.3. Red Hat Enterprise Virtualization Reports online help
Note
/usr/share/jasperreports-server-pro/docs/
2.3.2. JasperReports System Requirements
Web Browsers in the table of contents.
2.3.3. Users in the Red Hat Enterprise Virtualization Reports Portal
admin and superuser. The passwords for these users were set during the installation of Red Hat Enterprise Virtualization Reports. Generally, additional users must be added manually.
Note
admin user name was rhevm-admin. If you are performing a clean installation, the user name is now admin. If you are performing an upgrade, the user name will remain rhevm-admin.
2.3.4. Resetting the Password for the Reports Administrative User
ovirt-engine-reports-tool utility. Note that changing the Reports administrative password requires you to restart the ovirt-engine-reportsd service, and access to Reports functionality will be interrupted.
Procedure 2.2. Resetting the Password for the Reports Administrative User
- Log in to the machine on which Red Hat Enterprise Virtualization Reports is installed.
- Run the
ovirt-engine-reports-toolcommand:# ovirt-engine-reports-tool
- Enter the number that corresponds to the change the password option, and press Enter:
(1) Change the password of the internal Reports Admin
(1, 2, 3) []: 1
- Enter a new password, and press Enter:
Reports admin password: NEW_PASS
Please confirm password: NEW_PASS
- Restart the
ovirt-engine-reportsdservice to apply the change:# service ovirt-engine-reportsd restart
ovirt-engine-reports-tool utility can also be used to export and import saved ad hoc reports. See Section 2.3.16, “Backing Up and Restoring Saved Ad Hoc Reports” for more information about the import and export functions.
2.3.5. Logging in to Access the Reports Portal
superuser and admin accounts when you installed Red Hat Enterprise Virtualization Reports. Red Hat Enterprise Virtualization Reports does not provide default passwords.
https://YOUR.MANAGER.URL/ovirt-engine-reports/login.html. A login screen for Red Hat Enterprise Virtualization Reports is displayed.
Note

Figure 2.4. Red Hat Enterprise Virtualization Reports login screen
ovirt-user. Click the button.

Figure 2.5. Red Hat Enterprise Virtualization Reports main screen
admin and superuser. Generally, additional users need to be created within the Reports Portal.
2.3.7. Reports Portal User Roles
- ROLE_ADMINISTRATOR - Can create/edit/delete reports, dashboards, ad hoc reports, and manage the server.
- ROLE_USER - Can create/edit/delete ad hoc reports and view reports and dashboards.
- ROLE_ANONYMOUS - Can log in and look at reports and dashboards.

Figure 2.6. JasperReports user roles
2.3.8. Navigating Reports and Dashboards
 ) button in the navigation bar at the top of the reports portal to return to this page.

Figure 2.7. Red Hat Enterprise Virtualization Reports Filter pane
2.3.9. Report Parameters

Figure 2.8. Red Hat Enterprise Virtualization Reports - Reports List
Note

Figure 2.9. Report Parameter Selection
Many report parameters are cascading input fields. This means the selection made for one parameter changes the options available for another parameter. The Data Center and Cluster parameters are cascading. Once a user selects a data center, only clusters within that data center are available for selection. Similarly, if a user selects a cluster, the Host Type field updates to show only host types that exist in the selected cluster. Cascading parameters filter out objects that do not contain child objects relevant to the report. For example, a report pertaining to virtual machines removes the selection of clusters that do not contain virtual machines. A report pertaining to both virtual machines and hosts only provides a selection from clusters containing both virtual machines and hosts.
Objects deleted (removed) from the system are still recorded in the reporting history database. Select deleted objects, such as clusters, data centers and hosts, as values for report parameters if required. The bottom of the parameter options list shows deleted objects, which are suffixed with the date of removal from the system.
2.3.10. Right-click Reporting Integration with the Red Hat Enterprise Virtualization Administration Portal
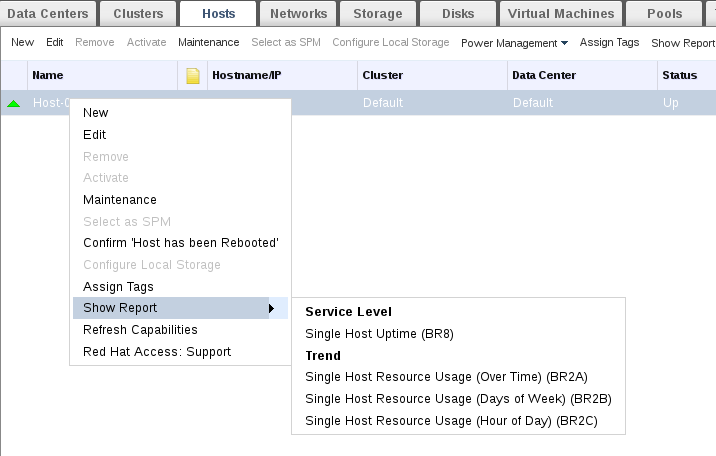
Figure 2.10. Right-click Reporting

Figure 2.11. Alternative to Right-click Reporting
2.3.11. Executive Reports
2.3.11.1. Executive reports: Active Virtual Machines by OS
Active Virtual Machines by OS report shows a summary of the number of active virtual machines in a given time period, broken down by operating system. The following parameters are provided to run this report:
Table 2.25. Active Virtual Machines by OS Parameters
| Parameter | Description |
|---|---|
Show Deleted Entities? | The report includes deleted objects, such as data centers, clusters, and hosts removed from the environment. |
Period Range | The report is for the period range selected. Daily reports cover a single day. Monthly reports cover a single month. Quarterly reports cover a three-month quarter, beginning on the month specified in the Dates parameter. Yearly reports cover a year, beginning on the month specified in the Dates parameter. |
Dates | The report covers the selected period range, beginning on this date. Daily period ranges pass in one day increments. For a Monthly period range, the selected month is used. For a Quarterly period range, the quarter is determined as beginning on the selected month. A yearly period range also starts on the selected month. |
Data Center | The report includes only virtual machines in the selected data center. The options list shows only data centers that contain virtual machines. |
Cluster | The report only includes virtual machines in the selected cluster. The options list shows only clusters in the selected data center. If All is selected, the report includes all virtual machines in the selected data center. |
Virtual Machine Type | The report only includes virtual machines of the selected type. Possible types are Server and Desktop. The options list shows only types that exist in the selected data center and cluster. If All is selected, the report includes all virtual machine types. |
2.3.11.2. Executive Reports: Cluster Capacity Vs Usage
Cluster Capacity Vs Usage report shows the relationship between system capacity and usage (workload) over a given time period. Capacity is expressed in terms of CPU cores and physical memory, while usage is expressed as vCPUs and virtual machine memory. The following parameters must be provided to run this report:
Table 2.26. Cluster Capacity Vs Usage Parameters
| Parameter | Description |
|---|---|
Show Deleted Entities? | The report includes deleted objects, such as data centers, clusters, and hosts removed from the environment. |
Period Range | The report is for the period range selected. Daily reports cover a single day. Monthly reports cover a single month. Quarterly reports cover a three-month quarter, beginning on the month specified in the Dates parameter. Yearly reports cover a year, beginning on the month specified in the Dates parameter. |
Dates | The report covers the selected period range, beginning on this date. Daily period ranges pass in one day increments. For a Monthly period range, the selected month is used. For a Quarterly period range, the quarter is determined as beginning on the selected month. A yearly period range also starts on the selected month. |
Data Center | The list of options for the Cluster parameter includes only clusters in the selected data center. The options list contains only data centers that contain clusters. |
Cluster | The report only includes the selected cluster. The options list shows only clusters in the selected data center. If All is selected, the report includes all clusters in the selected data center. |
2.3.11.3. Executive Reports: Host Operating System Break Down
Host OS Break Down report indicates the number of hosts running each operating system version over a given time period. The following parameters must be provided to run this report:
Table 2.27. Host OS Break Down Parameters
| Parameter | Description |
|---|---|
Show Deleted Entities? | The report includes deleted objects, such as data centers, clusters, and hosts removed from the environment. |
Period Range | The report is for the period range selected. Daily reports cover a single day. Monthly reports cover a single month. Quarterly reports cover a three-month quarter, beginning on the month specified in the Dates parameter. Yearly reports cover a year, beginning on the month specified in the Dates parameter. |
Dates | The report covers the selected period range, beginning on this date. Daily period ranges pass in one day increments. For a Monthly period range, the selected month is used. For a Quarterly period range, the quarter is determined as beginning on the selected month. A yearly period range also starts on the selected month. |
Data Center | The list of options for the Cluster parameter includes only clusters in the selected data center. The options list shows only data centers that contain clusters. |
Cluster | The report includes only hosts in the selected cluster. The options list shows only clusters in the selected data center. If All is selected, the report includes all hosts in the selected data center. |
2.3.11.4. Executive Reports: Summary of Host Usage Resources
Summary of Host Usage Resources report shows a scatter plot of average host resource utilization for a given time period in terms of CPU and memory usage. The following parameters must be provided to run this report:
Table 2.28. Summary of Host Usage Resources Parameters
| Parameter | Description |
|---|---|
Show Deleted Entities? | The report includes deleted objects, such as data centers, clusters, and hosts removed from the environment. |
Period Range | The report is for the period range selected. Daily reports cover a single day. Monthly reports cover a single month. Quarterly reports cover a three-month quarter, beginning on the month specified in the Dates parameter. Yearly reports cover a year, beginning on the month specified in the Dates parameter. |
Dates | The report covers the selected period range, beginning on this date. Daily period ranges pass in one day increments. For a Monthly period range, the selected month is used. For a Quarterly period range, the quarter is determined as beginning on the selected month. A yearly period range also starts on the selected month. |
Data Center | The list of options for the Cluster parameter includes only clusters in the selected data center. The options list shows only data centers that contain clusters. |
Cluster | The report includes only hosts in the selected cluster. The options list shows only clusters in the selected data center. If All is selected, the report includes all hosts in the selected data center. |
2.3.12. Inventory Reports
2.3.12.1. Inventory Reports: Hosts Inventory
Hosts Inventory report shows a list of all hosts in the selected data center and cluster. The following parameters must be provided to run this report:
Table 2.29. Hosts Inventory Parameters
| Parameter | Description |
|---|---|
Show Deleted Entities? | The report includes deleted objects, such as data centers, clusters, and hosts removed from the environment. |
Data Center | The list of options for the Cluster parameter includes only clusters in the selected data center. The options list shows only data centers that contain clusters. |
Cluster | The report includes only hosts in the selected cluster. The options list shows only clusters in the selected data center. If All is selected, the report includes all hosts in the selected data center. |
Host Type | The report includes only hosts of the selected type. The options list shows only host types present in the selected data center and cluster. If All is selected, the report includes all host types. |
2.3.12.2. Inventory Reports: Storage Domain Over Time
Storage Domain Size Over Time report shows a line graph contrasting the total available and total used space for a single storage domain over time for a given period. The following parameters must be provided to run this report:
Table 2.30. Storage Domain Size Over Time Parameters
| Parameter | Description |
|---|---|
Show Deleted Entities? | The report includes deleted objects, such as data centers, clusters, and hosts removed from the environment. |
Period Range | The report is for the period range selected. Monthly reports cover a single month. Quarterly reports cover a three-month quarter, beginning on the month specified in the Dates parameter. |
Dates | The report covers the selected period range, beginning on this date. For a Monthly period range, the selected month is used. For a Quarterly period range, the quarter is determined as beginning on the selected month. The list of options for the Storage Domain name parameter includes only storage domains that were attached during the specified period. |
Data Center | The options list for the Storage Domain Name parameter shows only storage domains in this selected data center. |
Storage Domain Type | The options list for the Storage Domain Name parameter shows only storage domains of this selected type. |
Storage Domain Name | The report refers to the storage domain selected. A report is only for a single storage domain and the user must select a storage domain. The list of options shows only storage domains that were attached to the data center during the selected period. |
2.3.12.3. Inventory Reports: Virtual Machines Inventory
Virtual Machines Inventory report shows a list of all virtual machines in the selected data center and cluster. The following parameters must be provided to run this report:
Table 2.31. Virtual Machines Inventory Parameters
| Parameter | Description |
|---|---|
Show Deleted Entities? | The report includes deleted objects, such as data centers, clusters, and hosts removed from the environment. |
Data Center | The list of options for the Cluster parameter includes only clusters in the selected data center. The options list shows only data centers that contain clusters. |
Cluster | The report includes only virtual machines in the selected cluster. The options list shows only clusters in the selected data center. If All is selected, the report includes all virtual machines in the selected data center. |
Virtual Machine Type | The report includes only virtual machines of the selected type. The options list shows only virtual machine types present in the selected data center and cluster. If All is selected, the report includes all virtual machine types. |
2.3.12.4. Inventory Reports: Cloud Provider Virtual Machine Inventory
Table 2.32. Cloud Provider Virtual Machine Inventory Parameters
| Parameter | Description |
|---|---|
Show Deleted Entities? | The report includes deleted objects, such as data centers, clusters, and hosts removed from the environment. |
Period Range | The report is for the period range selected. Daily reports cover a single day. Monthly reports cover a single month. Quarterly reports cover a three-month quarter, beginning on the month specified in the Dates parameter. Yearly reports cover a year, beginning on the month specified in the Dates parameter. |
Dates | The report covers the selected period range, beginning on this date. Daily period ranges pass in one day increments. For a Monthly period range, the selected month is used. For a Quarterly period range, the quarter is determined as beginning on the selected month. A yearly period range also starts on the selected month. |
Data Center | The list of options for the Cluster parameter includes only clusters in the selected data center. The options list shows only data centers that contain clusters. |
Cluster | The report includes only virtual machines in the selected cluster. The options list shows only clusters in the selected data center. If All is selected, the report includes all virtual machines in the selected data center. |
Virtual Machine Type | The report includes only virtual machines of the selected type. The options list shows only virtual machine types present in the selected data center and cluster. If All is selected, the report includes all virtual machine types. |
2.3.12.5. Inventory Reports: Storage Domains
Storage Domains Inventory report shows a list of storage domains in the selected data center and of the selected type. The following parameters must be provided to run this report:
Table 2.33. Storage Domain Inventory Parameters
| Parameter | Description |
|---|---|
Show DeletedDetached Entities? | The report includes deleted objects, such as data centers, clusters, and hosts removed from the environment. |
Data Center | The options list for the Storage Domain Name parameter shows only storage domains in this selected data center. |
Storage Domain Type | The options list for the Storage Domain Name parameter shows only storage domains of this selected type. |
2.3.13. Service Level Reports
2.3.13.1. Service Level Reports: Cluster Host Uptime
Cluster Host Uptime report shows the weighted average uptime of hosts within a cluster for a given period of time. This report also provides a table listing the total planned (maintenance) and unplanned down time for each host. The following parameters must be provided to run this report:
Table 2.34. Cluster Host Uptime Parameters
| Parameter | Description |
|---|---|
Show Deleted Entities? | The report includes deleted objects, such as data centers, clusters, and hosts removed from the environment. |
Period Range | The report is for the period range selected. Daily reports cover a single day. Monthly reports cover a single month. Quarterly reports cover a three-month quarter, beginning on the month specified in the Dates parameter. Yearly reports cover a year, beginning on the month specified in the Dates parameter. |
Dates | The report covers the selected period range, beginning on this date. Daily period ranges pass in one day increments. For a Monthly period range, the selected month is used. For a Quarterly period range, the quarter is determined as beginning on the selected month. A yearly period range also starts on the selected month. |
Data Center | The list of options for the Cluster parameter includes only clusters in the selected data center. The options list shows only data centers that contain clusters. |
Cluster | The report includes only hosts in the selected cluster. The options list shows only clusters in the selected data center. If All is selected, the report includes all hosts in the selected data center. |
Host Type | The report includes only hosts of the selected type. The options list shows only host types present in the selected data center and cluster. If All is selected, the report includes all host types. |
2.3.13.2. Service Level Reports: Cluster Quality of Service - Hosts
Cluster Quality of Services - Hosts report shows the amount of time hosts sustain load above a specified threshold for a given time period. Load is defined in terms of CPU usage percent and memory usage percent. The following parameters must be provided to run this report:
Table 2.35. Cluster Quality of Service - Hosts Parameters
| Parameter | Description |
|---|---|
Show Deleted Entities? | The report includes deleted objects, such as data centers, clusters, and hosts removed from the environment. |
Period Range | The report is for the period range selected. Daily reports cover a single day. Monthly reports cover a single month. Quarterly reports cover a three-month quarter, beginning on the month specified in the Dates parameter. Yearly reports cover a year, beginning on the month specified in the Dates parameter. |
Dates | The report covers the selected period range, beginning on this date. Daily period ranges pass in one day increments. For a Monthly period range, the selected month is used. For a Quarterly period range, the quarter is determined as beginning on the selected month. A yearly period range also starts on the selected month. |
Data Center | The list of options for the Cluster parameter includes only clusters in the selected data center. The options list shows only data centers that contain clusters. |
Cluster | The report includes only hosts in the selected cluster. The options list shows only clusters in the selected data center. If All is selected, the report includes all hosts in the selected data center. |
Host Type | The report includes only hosts of the selected type. The options list shows only host types present in the selected data center and cluster. If All is selected, the report includes all host types. |
CPU Threshold | The report measures the quality of service as the amount of time hosts sustain load above a given threshold. The CPU Threshold defines a load threshold as a percentage of total CPU usage on the host. The load is measured by one-minute samples, averaged over an hour. The report therefore shows sustained load, not short term peaks. A CPU Threshold of 60 per cent is a suggested starting point to produce a meaningful quality of service report. |
Memory Threshold | The report measures the quality of service as the amount of time hosts sustain load above a given threshold. The Memory Threshold defines a load threshold as a percentage of total memory usage on the host. The load is measured by one-minute samples, averaged over an hour. The report therefore shows sustained load, not short term peaks. A Memory Threshold of 60 per cent is a suggested starting point to produce a meaningful quality of service report. |
2.3.13.3. Service Level Reports: Cluster Quality of Service - Virtual Machines
Cluster Quality of Service - Virtual Machines report shows the amount of time virtual machines sustain load above a specified threshold for a given time period. Load is defined in terms of CPU usage percent and memory usage percent. The following parameters must be provided to run this report:
Table 2.36. Cluster Quality of Service - Virtual Machines Parameters
| Parameter | Description |
|---|---|
Show Deleted Entities? | The report includes deleted objects, such as data centers, clusters, and hosts removed from the environment. |
Period Range | The report is for the period range selected. Daily reports cover a single day. Monthly reports cover a single month. Quarterly reports cover a three-month quarter, beginning on the month specified in the Dates parameter. Yearly reports cover a year, beginning on the month specified in the Dates parameter. |
Dates | The report covers the selected period range, beginning on this date. Daily period ranges pass in one day increments. For a Monthly period range, the selected month is used. For a Quarterly period range, the quarter is determined as beginning on the selected month. A yearly period range also starts on the selected month. |
Data Center | The list of options for the Cluster parameter includes only clusters in the selected data center. The options list shows only data centers that contain clusters. |
Cluster | The report includes only virtual machines in the selected cluster. The options list shows only clusters in the selected data center. If All is selected, the report includes all virtual machines in the selected data center. |
Virtual Machine Type | The report includes only virtual machines of the selected type. The options list shows only virtual machine types present in the selected data center and cluster. If All is selected, the report includes all virtual machine types. |
CPU Threshold | The report measures quality of service as the amount of time virtual machines sustain load above a given threshold. The CPU Threshold defines a load threshold as a percentage of total CPU usage on the virtual machine. The load is measured by one-minute samples, averaged over an hour. The report therefore shows sustained load, not short term peaks. A CPU Threshold of 60 per cent is a suggested starting point to produce a meaningful quality of service report. |
Memory Threshold | The reports measures quality of service as the amount of time virtual machines sustain load above a given threshold. The Memory Threshold defines a load threshold as a percentage of total memory usage on the virtual machine. The load is measured by one-minute samples, averaged over an hour. The report therefore shows sustained load, not short term peaks. A Memory Threshold of 60 per cent is a suggested starting point to produce a meaningful quality of service report. |
2.3.13.4. Service Level Reports: Single Host Uptime
Single Host Uptime report shows the total proportion of uptime, planned downtime and unplanned downtime for a single host. The following parameters must be provided to run this report:
Table 2.37. Single Host Uptime Parameters
| Parameter | Description |
|---|---|
Show Deleted Entities? | The report includes deleted objects, such as data centers, clusters, and hosts removed from the environment. |
Period Range | The report is for the period range selected. Daily reports cover a single day. Monthly reports cover a single month. Quarterly reports cover a three-month quarter, beginning on the month specified in the Dates parameter. Yearly reports cover a year, beginning on the month specified in the Dates parameter. |
Dates | The report covers the selected period range, beginning on this date. Daily period ranges pass in one day increments. For a Monthly period range, the selected month is used. For a Quarterly period range, the quarter is determined as beginning on the selected month. A yearly period range also starts on the selected month. |
Data Center | The list of options for the Cluster parameter includes only clusters in the selected data center. The options list shows only data centers that contain clusters. |
Cluster | The list of options for the Host Name parameter includes only hosts in the selected cluster. The options list shows only clusters in the selected data center. If All is selected, the list of options for the Host Name parameter includes all hosts in the selected data center. |
Host Type | The list of options for the Host Name parameter includes only hosts of the selected type. The options list shows only host types present in the selected data center and cluster. If All is selected, the list of options for the Host Name parameter includes all host types. |
Host Name | The report refers to the host selected. A report is only for a single host and a user must select a host. |
2.3.13.5. Service Level Reports: Top 10 Downtime Hosts
Top 10 Downtime Hosts report shows the total proportion of uptime, planned downtime and unplanned downtime for the 10 hosts with the greatest amount of downtime. The following parameters must be provided to run this report:
Table 2.38. Top 10 Downtime Hosts Parameters
Parameter | Description |
|---|---|
Show Deleted Entities? | The report includes deleted objects, such as data centers, clusters, and hosts removed from the environment. |
Period Range | The report is for the period range selected. Daily reports cover a single day. Monthly reports cover a single month. Quarterly reports cover a three-month quarter, beginning on the month specified in the Dates parameter. Yearly reports cover a year, beginning on the month specified in the Dates parameter. |
Dates | The report covers the selected period range, beginning on this date. Daily period ranges pass in one day increments. For a Monthly period range, the selected month is used. For a Quarterly period range, the quarter is determined as beginning on the selected month. A yearly period range also starts on the selected month. |
Data Center | The list of options for the Cluster parameter includes only clusters in the selected data center. The options list contains only data centers that contain clusters. |
Cluster | The report includes only hosts in the selected cluster. The options list shows only clusters in the selected data center. If All is selected, the report includes all hosts in the selected data center. |
Host Type | The report includes only hosts of the selected type. The options list shows only host types present in the selected data center and cluster. If All is selected, the report includes all host types. |
2.3.13.6. Service Level Reports: High Availability Virtual Servers Uptime
High Availability Virtual Servers Uptime report shows the weighted average uptime of high availability virtual servers within a cluster for a given period of time. The report also provides a table listing the total uptime and unplanned down time for each virtual server. The following parameters must be provided to run this report:
Table 2.39. High Availability Virtual Servers Uptime Parameters
| Parameter | Description |
|---|---|
Show Deleted Entities? | The report includes deleted objects, such as data centers, clusters, and hosts removed from the environment. |
Period Range | The report is for the period range selected. Daily reports cover a single day. Monthly reports cover a single month. Quarterly reports cover a three-month quarter, beginning on the month specified in the Dates parameter. Yearly reports cover a year, beginning on the month specified in the Dates parameter. |
Dates | The report covers the selected period range, beginning on this date. Daily period ranges pass in one day increments. For a Monthly period range, the selected month is used. For a Quarterly period range, the quarter is determined as beginning on the selected month. A yearly period range also starts on the selected month. |
Data Center | The list of options for the Cluster parameter includes only clusters in the selected data center. The options list shows only data centers that contain clusters. |
Cluster | The report includes only virtual servers in the selected cluster. The options list shows only clusters in the selected data center. If All is selected, the report includes all virtual servers in the selected data center. |
2.3.14. Trend Reports
2.3.14.1. Trend Reports: Five Least Utilized Hosts (Over Time)
Five Least Utilized Hosts (Over Time) report shows the weighted average daily peak load, in terms of CPU and memory usage, for the five hosts with the lowest load factor for a given period of time. The following parameters must be provided to run this report:
Table 2.40. Five Least Utilized Hosts (Over Time) Parameters
| Parameter | Description |
|---|---|
Show Deleted Entities? | The report includes deleted objects, such as data centers, clusters, and hosts removed from the environment. |
Period Range | The report is for the period range selected. Daily reports cover a single day. Monthly reports cover a single month. Quarterly reports cover a three-month quarter, beginning on the month specified in the Dates parameter. Yearly reports cover a year, beginning on the month specified in the Dates parameter. |
Dates | The report covers the selected period range, beginning on this date. Daily period ranges pass in one day increments. For a Monthly period range, the selected month is used. For a Quarterly period range, the quarter is determined as beginning on the selected month. A yearly period range also starts on the selected month. |
Data Center | The list of options for the Cluster parameter includes only clusters in the selected data center. The options list shows only data centers that contain clusters. |
Cluster | The report includes only hosts in the selected cluster. The options list shows only clusters in the selected data center. If All is selected, the report includes all hosts in the selected data center. |
Host Type | The report includes only hosts of the selected type. The options list shows only host types present in the selected data center and cluster. If All is selected, the report includes all host types. |
2.3.14.2. Trend Reports: Five Least Utilized Virtual Machines (Over Time)
Five Least Utilized Virtual Machines (Over Time) report shows the weighted average daily peak load, in terms of CPU and memory usage, for the five virtual machines with the lowest load factor for a given period of time. The following parameters must be provided to run this report:
Table 2.41. Five Least Utilized Virtual Machines (Over Time) Parameters
| Parameter | Description |
|---|---|
Show Deleted Entities? | The report includes deleted objects, such as data centers, clusters, and hosts removed from the environment. |
Period Range | The report is for the period range selected. Daily reports cover a single day. Monthly reports cover a single month. Quarterly reports cover a three-month quarter, beginning on the month specified in the Dates parameter. Yearly reports cover a year, beginning on the month specified in the Dates parameter. |
Dates | The report covers the selected period range, beginning on this date. Daily period ranges pass in one day increments. For a Monthly period range, the selected month is used. For a Quarterly period range, the quarter is determined as beginning on the selected month. A yearly period range also starts on the selected month. |
Data Center | The list of options for the Cluster parameter includes only clusters in the selected data center. The options list shows only data centers that contain clusters. |
Cluster | The report includes only virtual machines in the selected cluster. The options list shows only clusters in the selected data center. If All is selected, the report includes all virtual machines in the selected data center. |
Virtual Machine Type | The report includes only virtual machines of the selected type. The options list shows only virtual machine types present in the selected data center and cluster. If All is selected, the report includes all virtual machine types. |
2.3.14.3. Trend Reports: Five Most Utilized Hosts (Over Time)
Five Most Utilized Hosts (Over Time) report shows the weighted average daily peak load, in terms of CPU and memory usage, for the five hosts with the highest load factor for a given period of time. The following parameters must be provided to run this report:
Table 2.42. Five Most Utilized Hosts (Over Time) Parameters
| Parameter | Description |
|---|---|
Show Deleted Entities? | The report includes deleted objects, such as data centers, clusters, and hosts removed from the environment. |
Period Range | The report is for the period range selected. Daily reports cover a single day. Monthly reports cover a single month. Quarterly reports cover a three-month quarter, beginning on the month specified in the Dates parameter. Yearly reports cover a year, beginning on the month specified in the Dates parameter. |
Dates | The report covers the selected period range, beginning on this date. Daily period ranges pass in one day increments. For a Monthly period range, the selected month is used. For a Quarterly period range, the quarter is determined as beginning on the selected month. A yearly period range also starts on the selected month. |
Data Center | The list of options for the Cluster parameter includes only clusters in the selected data center. The options list shows only data centers that contain clusters. |
Cluster | The report includes only hosts in the selected cluster. The options list shows only clusters in the selected data center. If All is selected, the report includes all hosts in the selected data center. |
Host Type | The report includes only hosts of the selected type. The options list shows only host types present in the selected data center and cluster. If All is selected, the report includes all host types. |
2.3.14.4. Trend Reports: Five Most Utilized Virtual Machines (Over Time)
Five Most Utilized Virtual Machines (Over Time) report shows the weighted average daily peak load, in terms of CPU and memory usage, for the five virtual machines with the highest load factor for a given period of time. The following parameters must be provided to run this report:
Table 2.43. Five Most Utilized Virtual Machines (Over Time) Parameters
| Parameter | Description |
|---|---|
Show Deleted Entities? | The report includes deleted objects, such as data centers, clusters, and hosts removed from the environment. |
Period Range | The report is for the period range selected. Daily reports cover a single day. Monthly reports cover a single month. Quarterly reports cover a three-month quarter, beginning on the month specified in the Dates parameter. Yearly reports cover a year, beginning on the month specified in the Dates parameter. |
Dates | The report covers the selected period range, beginning on this date. Daily period ranges pass in one day increments. For a Monthly period range, the selected month is used. For a Quarterly period range, the quarter is determined as beginning on the selected month. A yearly period range also starts on the selected month. |
Data Center | The list of options for the Cluster parameter includes only clusters in the selected data center. The options list shows only data centers which contain clusters. |
Cluster | The report includes only virtual machines in the selected cluster. The options list shows only clusters in the selected data center. If All is selected, the report includes all virtual machines in the selected data center. |
Virtual Machine Type | The report includes only virtual machines of the selected type. The options list shows only virtual machine types present in the selected data center and cluster. If All is selected, the report includes all virtual machine types. |
2.3.14.5. Trend Reports: Multiple Hosts Resource Usage (Over Time)
Multiple Hosts Resource Usage (Over Time) report shows the daily peak load, in terms of CPU and memory usage, for up to five selected hosts over a given period of time. The following parameters must be provided to run this report:
Table 2.44. Multiple Hosts Resource Usage (Over Time) Parameters
| Parameter | Description |
|---|---|
Show Deleted Entities? | The report includes deleted objects, such as data centers, clusters, and hosts removed from the environment. |
Period Range | The report is for the period range selected. Daily reports cover a single day. Monthly reports cover a single month. Quarterly reports cover a three-month quarter, beginning on the month specified in the Dates parameter. Yearly reports cover a year, beginning on the month specified in the Dates parameter. |
Dates | The report covers the selected period range, beginning on this date. Daily period ranges pass in one day increments. For a Monthly period range, the selected month is used. For a Quarterly period range, the quarter is determined as beginning on the selected month. A yearly period range also starts on the selected month. |
Data Center | The list of options for the Cluster parameter includes only clusters in the selected data center. The options list shows only data centers that contain clusters. |
Cluster | The list of options for the Hosts list parameter includes only hosts in the selected cluster. The options list shows only clusters in the selected data center. If All is selected, the list of options for the Hosts list parameter includes all hosts in the selected data center. |
Host Type | The list of options for the Hosts list parameter includes only hosts of the selected type. The options list shows only host types present in the selected data center and cluster. If All is selected, the list of options for the Hosts list parameter includes all host types. |
Hosts list | The report includes all hosts selected in the host list. Select any number of hosts up to a maximum of five. |
2.3.14.6. Trend Reports: Multiple Virtual Machines Resource Usage (Over Time)
Multiple Virtual Machines Resource Usage (Over Time) report shows the daily peak load, in terms of CPU and memory usage, for up to five selected virtual machines over a given period of time. The following parameters must be provided to run this report:
Table 2.45. Multiple Virtual Machines Resource Usage (Over Time) Parameters
| Parameter | Description |
|---|---|
Show Deleted Entities? | The report includes deleted objects, such as data centers, clusters, and hosts removed from the environment. |
Period Range | The report is for the period range selected. Daily reports cover a single day. Monthly reports cover a single month. Quarterly reports cover a three-month quarter, beginning on the month specified in the Dates parameter. Yearly reports cover a year, beginning on the month specified in the Dates parameter. |
Dates | The report covers the selected period range, beginning on this date. Daily period ranges pass in one day increments. For a Monthly period range, the selected month is used. For a Quarterly period range, the quarter is determined as beginning on the selected month. A yearly period range also starts on the selected month. |
Data Center | The list of options for the Cluster parameter includes only clusters in the selected data center. The options list shows only data centers that contain clusters. |
Cluster | The list of options for the VM List parameter include only virtual machines in the selected cluster. The options list shows only clusters in the selected data center. If All is selected, the list of options for the VM List parameter includes all virtual machines in the selected data center. |
Virtual Machine Type | The list of options for the VM List parameter includes only virtual machines of the selected type. The options list shows only virtual machine types present in the selected data center and cluster. If All is selected, the list of options for the VM List parameter includes all virtual machine types. |
Virtual Machine List | The report includes all virtual machines selected in the virtual machine list. Select any number of virtual machines up to a maximum of five. |
2.3.14.7. Trend Reports: Single Host Resource Usage (Days of Week)
Single Host Resource Usage (Days of Week) report shows various resource utilization metrics for a single host over a given period of time and broken down by day of the week. The metrics include CPU usage, memory usage, number of active virtual machines and network usage. The following parameters must be provided to run this report:
Table 2.46. Single Host Resource Usage (Days of Week) Parameters
| Parameter | Description |
|---|---|
Show Deleted Entities? | The report includes deleted objects, such as data centers, clusters, and hosts removed from the environment. |
Period Range | The report is for the period range selected. Daily reports cover a single day. Monthly reports cover a single month. Quarterly reports cover a three-month quarter, beginning on the month specified in the Dates parameter. Yearly reports cover a year, beginning on the month specified in the Dates parameter. |
Dates | The report covers the selected period range, beginning on this date. Daily period ranges pass in one day increments. For a Monthly period range, the selected month is used. For a Quarterly period range, the quarter is determined as beginning on the selected month. A yearly period range also starts on the selected month. |
Data Center | The list of options for the Cluster parameter includes only clusters in the selected data center. The options list shows only data centers that contain clusters. |
Cluster | The list of options for the Host Name parameter includes only hosts in the selected cluster. The options list shows only clusters in the selected data center. If All is selected, the list of options for the Host Name parameter includes all hosts in the selected data center. |
Host Type | The list of options for the Host Name parameter includes only hosts of the selected type. The options list shows only host types present in the selected data center and cluster. If All is selected, the list of options for the Host Name parameter includes all host types. |
Host Name | The report refers to the host selected. A report is only for a single host and the user must select a host. |
2.3.14.8. Trend Reports: Single Host Resource Usage (Hour of Day)
Single Host Resource Usage (Hour of Day) report shows a variety of resource utilization metrics for a single host over a given period of time, broken down by hour of the day (0-23). The metrics include CPU usage, memory usage, number of active virtual machines and network usage. The following parameters must be provided to run this report:
Table 2.47. Single Host Resource Usage (Hour of Day) Parameters
| Parameter | Description |
|---|---|
Show Deleted Entities? | The report includes deleted objects, such as data centers, clusters, and hosts removed from the environment. |
Period Range | The report is for the period range selected. Daily reports cover a single day. Monthly reports cover a single month. Quarterly reports cover a three-month quarter, beginning on the month specified in the Dates parameter. Yearly reports cover a year, beginning on the month specified in the Dates parameter. |
Dates | The report covers the selected period range, beginning on this date. Daily period ranges pass in one day increments. For a Monthly period range, the selected month is used. For a Quarterly period range, the quarter is determined as beginning on the selected month. A yearly period range also starts on the selected month. |
Data Center | The list of options for the Cluster parameter includes only clusters in the selected data center. The options list shows only data centers that contain clusters. |
Cluster | The list of options for the Host Name parameter includes only hosts in the selected cluster. The options list shows only clusters in the selected data center. If All is selected, the list of options for the Host Name parameter includes all hosts in the selected data center. |
Host Type | Only hosts of the selected type will be included in the list of options for the Host Name parameter. The options list shows only host types present in the selected data center and cluster. If All is selected, the list of options for the Host Name parameter includes all host types. |
Host Name | The report refers to the host selected. A report is only for a single host and the user must select a host. |
2.3.14.9. Trend Reports: Single Virtual Machine Resources (Days of Week)
Single Virtual Machine Resources (Days of Week) report shows a variety of resource utilization metrics for a single virtual machine over a given period of time, broken down by day of the week. The metrics include CPU usage, memory usage, disk usage and network usage. The following parameters must be provided to run this report:
Table 2.48. Single Virtual Machine Resources (Days of Week) Parameters
| Parameter | Description |
|---|---|
Show Deleted Entities? | The report includes deleted objects, such as data centers, clusters, and hosts removed from the environment. |
Period Range | The report is for the period range selected. Daily reports cover a single day. Monthly reports cover a single month. Quarterly reports cover a three-month quarter, beginning on the month specified in the Dates parameter. Yearly reports cover a year, beginning on the month specified in the Dates parameter. |
Dates | The report covers the selected period range, beginning on this date. Daily period ranges pass in one day increments. For a Monthly period range, the selected month is used. For a Quarterly period range, the quarter is determined as beginning on the selected month. A yearly period range also starts on the selected month. |
Data Center | The list of options for the Cluster parameter includes only clusters in the selected data center. The options list shows only data centers that contain clusters. |
Cluster | The list of options for the VM Name parameter includes only virtual machines in the selected cluster. The options list shows only clusters in the selected data center. If All is selected, the list of options for the VM Name parameter includes all virtual machines in the selected data center. |
Virtual Machine Type | The list of options for the VM Name parameter includes only virtual machines of the selected type. The options list shows only virtual machine types present in the selected data center and cluster. If All is selected, the list of options for the VM Name parameter includes all virtual machine types. |
Virtual Machine Name | The report refers to the virtual machine selected. A report is only for a single virtual machine and the user must select a virtual machine. |
2.3.14.10. Trend Reports: Single Virtual Machine Resources (Hour of Day)
Single Virtual Machine Resources (Hour of Day) report shows a variety of resource utilization metrics for a single virtual machine over a given period of time, broken down by hour of the day (0-23). The metrics include CPU usage, memory usage, disk usage and network usage. The following parameters must be provided to run this report:
Table 2.49. Single Virtual Machine Resources (Hour of Day) Parameters
| Parameter | Description |
|---|---|
Show Deleted Entities? | The report includes deleted objects, such as data centers, clusters, and hosts removed from the environment. |
Period Range | The report is for the period range selected. Daily reports cover a single day. Monthly reports cover a single month. Quarterly reports cover a three-month quarter, beginning on the month specified in the Dates parameter. Yearly reports cover a year, beginning on the month specified in the Dates parameter. |
Dates | The report covers the selected period range, beginning on this date. Daily period ranges pass in one day increments. For a Monthly period range, the selected month is used. For a Quarterly period range, the quarter is determined as beginning on the selected month. A yearly period range also starts on the selected month. |
Data Center | The list of options for the Cluster parameter includes only clusters in the selected data center. The options list shows only data centers which contain clusters. |
Cluster | The list of options for the VM Name parameter includes only virtual machines in the selected cluster. The options list shows only clusters in the selected data center. If All is selected, the list of options for the VM Name parameter includes all virtual machines in the selected data center. |
Virtual Machine Type | The list of options for the VM Name parameter includes only virtual machines of the selected type. The options list shows only virtual machine types present in the selected data center and cluster. If All is selected, the list of options for the VM Name parameter includes all virtual machine types. |
Virtual Machine Name | The report refers to the virtual machine selected. A report is only for a single virtual machine and the user must select a virtual machine. |
2.3.14.11. Trend Reports: Single Virtual Machine Resources (Over Time)
Single Virtual Machine Resources (Over Time) report shows a variety of resource utilization metrics for a single virtual machine over a given period of time. The metrics include CPU usage, memory usage, disk usage and network usage. The following parameters must be provided to run this report:
Table 2.50. Single Virtual Machine Resources (Over Time) Parameters
| Parameter | Description |
|---|---|
Show Deleted Entities? | The report includes deleted objects, such as data centers, clusters, and hosts removed from the environment. |
Period Range | The report is for the period range selected. Daily reports cover a single day. Monthly reports cover a single month. Quarterly reports cover a three-month quarter, beginning on the month specified in the Dates parameter. Yearly reports cover a year, beginning on the month specified in the Dates parameter. |
Dates | The report covers the selected period range, beginning on this date. Daily period ranges pass in one day increments. For a Monthly period range, the selected month is used. For a Quarterly period range, the quarter is determined as beginning on the selected month. A yearly period range also starts on the selected month. |
Data Center | The list of options for the Cluster parameter includes only clusters in the selected data center. The options list shows only data centers that contain clusters. |
Cluster | The list of options for the VM Name parameter includes only virtual machines in the selected cluster. The options list shows only clusters in the selected data center. If All is selected, the list of options for the VM Name parameter includes all virtual machines in the selected data center. |
Virtual Machine Type | The list of options for the VM Name parameter lists only virtual machines of the selected type. The options list shows only virtual machine types present in the selected data center and cluster. If All is selected, the list of options for the VM Name parameter includes all virtual machine types. |
Virtual Machine Name | The report refers to the virtual machine selected. A report is only for a single virtual machine and the user must select a virtual machine. |
2.3.15. Ad Hoc Reports

Figure 2.12. Create Ad Hoc Report - Administrator's View
Working with the Ad Hoc Editor section of the online help explains the ad hoc report interface in detail.
2.3.16. Backing Up and Restoring Saved Ad Hoc Reports
ovirt-engine-reports-tool utility. You can also use the export option on its own to take regular backups of your saved reports. Saved ad hoc reports can only be imported on a Reports environment that is the same version as the Reports environment on which the reports were created.
Procedure 2.3. Migrating Saved Reports to Another Machine
- On the Reports machine, run the
ovirt-engine-reports-toolcommand:# ovirt-engine-reports-tool
- Enter the number that corresponds to the export option, and press Enter:
(2) Export Jasperreports saved reports to a zip file
(1, 2, 3) []: 2
- Enter the absolute path for the zip file to export saved reports to, and press Enter:
Filename to export saved reports to: /tmp/saved-reports.zip
- Copy the zip file to another Reports machine:
# scp /tmp/saved-reports.zip reports-machine-fqdn:/tmp/
- On the second Reports machine, run the
ovirt-engine-reports-toolcommand:# ovirt-engine-reports-tool
- Enter the number that corresponds to the import option, and press Enter:
(3) Import a saved reports zip file to Jasperreports
(1, 2, 3) []: 3
- Enter the absolute path of the zip file from which to import, and press Enter:
Filename to import saved reports from: /tmp/saved-reports.zip
2.3.17. Reports Schema: Tag History and ENUM Views
Note
delete_date and detach_date do not appear in latest views because these views provide the latest configuration of living entities, which, by definition, have not been deleted.
Table 2.51. Tag Relations History in the System
| Name | Type | Description |
|---|---|---|
| history_id | integer | The unique ID of this row in the table. |
| entity_id | UUID | Unique ID of the entity or tag in the system. |
| entity_type | smallint |
|
| parent_id | UUID | Unique ID of the entity or tag in the system. |
| attach_date | timestamp with time zone | The date the entity or tag was attached to the entity or tag. |
| detach_date | timestamp with time zone | The date the entity or tag was detached from the entity or tag. |
Table 2.52. v3_5_tag_details_view\v3_5_latest_tag_details_view
| Name | Type | Description |
|---|---|---|
| history_id | integer | The unique ID of this row in the table. |
| tag_id | UUID | Unique ID of the tag in the system. |
| tag_name | varchar(50) | Name of the tag, as displayed in the tag tree. |
| tag_description | varchar(4000) | Description of the tag, as displayed in the edit dialog. |
| tag_path | varchar(4000) | The path to the tag in the tree. |
| tag_level | smallint | The tag level in the tree. |
| create_date | timestamp with time zone | The date this tag was added to the system. |
| update_date | timestamp with time zone | The date this tag was changed in the system. |
| delete_date | timestamp with time zone | The date this tag was deleted from the system. |
Table 2.53. v3_5_enum_translator_view
| Name | Type | Description |
|---|---|---|
| enum_type | varchar(40) | The type of ENUM. |
| enum_key | smallint | The key of the ENUM. |
| value | varchar(40) | The value of the ENUM. |
2.4. Dashboards
2.4.1. Dashboards
Designer, in the Reports Portal. For more information on dashboards, consult the JasperReports documentation by clicking the in the top menu bar of the Reports Portal.
2.4.2. Inventory Dashboard
Inventory Dashboard provides an executive summary of the inventory of a data center over a given period of time. The dashboard includes average disk use, number of active virtual machines, and a breakdown of host operating systems. The following parameters can be modified for this dashboard:
Table 2.54. Inventory Dashboard Parameters
| Parameter | Description |
|---|---|
Show Deleted Entities? | The report includes deleted objects, such as data centers, clusters, and hosts removed from the environment. |
Period Range | The dashboard shows data for the period range selected. Monthly dashboards cover a single month. Quarterly dashboards cover a three-month quarter, beginning on the month specified in the Dates parameter. |
Dates | The dashboard covers the selected period range, beginning on this date. For a Monthly period range, the selected month is used. For a Quarterly period range, the quarter is determined as beginning on the selected month. |
Data Center | The report refers to the selected data center. The list of options shows only data centers containing either hosts, storage domains or virtual machines. The list of options for the Cluster parameter includes only clusters in the selected data center. |
2.4.3. Trends Dashboard
Trends Dashboard provides an executive summary of the trends in a data center over a given period of time. The dashboard includes graphs of CPU and memory usage over time for the most highly utilized hosts and virtual machines in the data center. The following parameters can be modified for this dashboard:
Table 2.55. Trends Dashboard Parameters
| Parameter | Description |
|---|---|
Show Deleted Entities? | The report includes deleted objects, such as data centers, clusters, and hosts removed from the environment. |
Period Range | The dashboard shows data for the period range selected. Monthly dashboards cover a single month. Quarterly dashboards cover a three-month quarter, beginning on the month specified in the Dates parameter. |
Dates | The dashboard covers the selected period range, beginning on this date. For a Monthly period range, the selected month is used. For a Quarterly period range, the quarter is determined as beginning on the selected month. |
Data Center | The report refers to the selected data center. The list of options shows only data centers containing either hosts, storage domains or virtual machines. The list of options for the Cluster parameter includes only clusters in the selected data center. |
2.4.4. Uptime Dashboard
Uptime Dashboard provides an executive summary of the service level and uptime for a data center over a given period of time. The dashboard includes details on total uptime for each cluster in the data center for the period. The following parameters can be modified for this dashboard:
Table 2.56. Uptime Dashboard Parameters
| Parameter | Description |
|---|---|
Show Deleted Entities? | The report includes deleted objects, such as data centers, clusters, and hosts removed from the environment. |
Period Range | The dashboard shows data for the period range selected. Monthly dashboards cover a single month. Quarterly dashboards cover a three-month quarter, beginning on the month specified in the Dates parameter. |
Dates | The dashboard covers the selected period range, beginning on this date. For a Monthly period range, the selected month is used. For a Quarterly period range, the quarter is determined as beginning on the selected month. |
Data Center | The report refers to the selected data center. The list of options shows only data centers containing either hosts, storage domains or virtual machines. The list of options for the Cluster parameter includes only clusters in the selected data center. |
2.4.5. Integrated Reporting Dashboard in the Red Hat Enterprise Virtualization Administration Portal

Figure 2.13. Reports Dashboard
Datacenter Dashboard, Cluster Dashboard, and System Dashboard.
Appendix A. Revision History
| Revision History | ||||
|---|---|---|---|---|
| Revision 3.6-6 | Wed 27 Jul 2016 | |||
| ||||
| Revision 3.6-5 | Wed 20 Apr 2016 | |||
| ||||
| Revision 3.6-4 | Mon 22 Feb 2016 | |||
| ||||
| Revision 3.6-3 | Wed 18 Nov 2015 | |||
| ||||
| Revision 3.6-2 | Wed 11 Nov 2015 | |||
| ||||
| Revision 3.6-1 | Tue 11 Aug 2015 | |||
| ||||