
"PrometheusOperatorRejectedResources" alert firing continuously in a Red Hat OpenShift Service in RHOCP 4
Environment
- Red Hat OpenShift Service on AWS (ROSA)
- 4
- Red Hat OpenShift Container Platform (RHOCP)
- 4
Issue
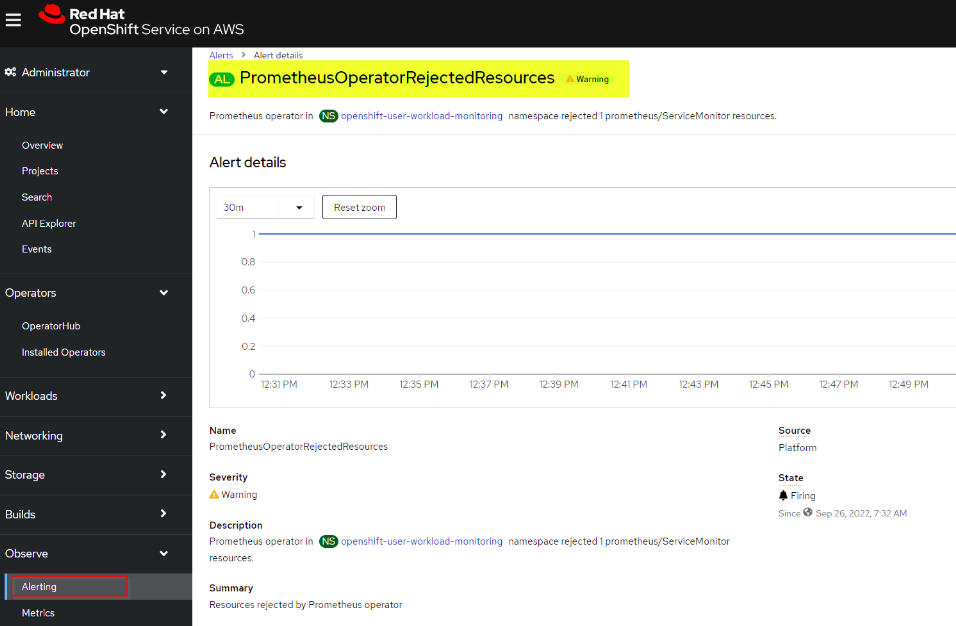
- Continuous "PrometheusOperatorRejectedResources" warning from the AlertManager.
- Prometheus operator shows the following warning log repeatedly:
level=warn ts=2022-07-29T16:17:27.361540578Z caller=operator.go:1832 component=prometheusoperator msg="skipping servicemonitor" error="it accesses file system via bearer token file which Prometheus specification prohibits" servicemonitor=openshift-logging/monitor-elasticsearch-cluster namespace=openshift-user-workload-monitoring prometheus=user-workload
Resolution
As per the description of the "Red Hat OpenShift Logging" operator, it is a pre-requisite to enable monitoring on namespace openshift-logging. This can be resolved by setting the label openshift.io/cluster-monitoring=true on the affected namespace.
oc label namespace openshift-logging openshift.io/cluster-monitoring=true
For Customers using ROSA
Please note that the customers cannot directly set this label as "openshift-logging" comes under the Red Hat managed namespaces. If the customers attempt to set any label on the managed namespaces (i.e., starting with openshift-), it will be blocked and the following error log is displayed:
Error from server (Prevented from accessing Red Hat managed namespaces.
In order to enable the cluster monitoring by applying the above label, please open a support case with us by clicking here.
Root Cause
The "PrometheusOperatorRejectedResources" alert fires when the Prometheus operator rejects some resources in a particular namespace due to some misconfiguration in the service or UWM. Here, the "openshift-logging" namespace under user workload monitoring (UWM) is being rejected by Prometheus operator. "openshift-logging" monitoring is expected to be in UWM and thus, Red SRE is not alerted for it (it's also a warning alert). The Prometheus Operator would expect cluster monitoring to be enabled for it.
Diagnostic Steps
-
Verify if "PrometheusOperatorRejectedResources" alert is firing using web console:
-
Inspect the logs for the Prometheus Operator:
oc logs -n openshift-user-workload-monitoring deployment/prometheus-operator -c prometheus-operator | grep "it accesses file system via bearer token"

<...>
level=warn ts=2022-07-29T16:17:27.361540578Z caller=operator.go:1832 component=prometheusoperator msg="skipping servicemonitor" error="it accesses file system via bearer token file which Prometheus specification prohibits" servicemonitor=openshift-logging/monitor-elasticsearch-cluster namespace=openshift-user-workload-monitoring prometheus=user-workload
<...>
This solution is part of Red Hat’s fast-track publication program, providing a huge library of solutions that Red Hat engineers have created while supporting our customers. To give you the knowledge you need the instant it becomes available, these articles may be presented in a raw and unedited form.
Comments