Log Analyzer
We are proud to introduce a new Red Hat Access Labs app: Log Analyzer
Log Analyzer is a multi-purpose log parsing web application with an emphasis on break/fix and identification of errors in your log files. Currently there are plenty of enterprise solutions in the log parsing arena but none that work in an on-demand fashion and none that tie into Red Hat's ecosystem. This app fills that void and provides a means to parse your logs (see the info page for currently supported log types) into a structured form with visualizations and recommendations.
Whether you are having a clear error on your servers, or everything appears to be running fine, Log Analyzer can provide you a wealth of additional information that isn't easy to get from just grepping through the file. After parsing you may very well find a solution that directly addresses the issue you were seeing, or you may find that there are no impacting problems. At a minimum, you will have a greater overall picture of what is happening on your servers with the provided visualizations and log analysis.
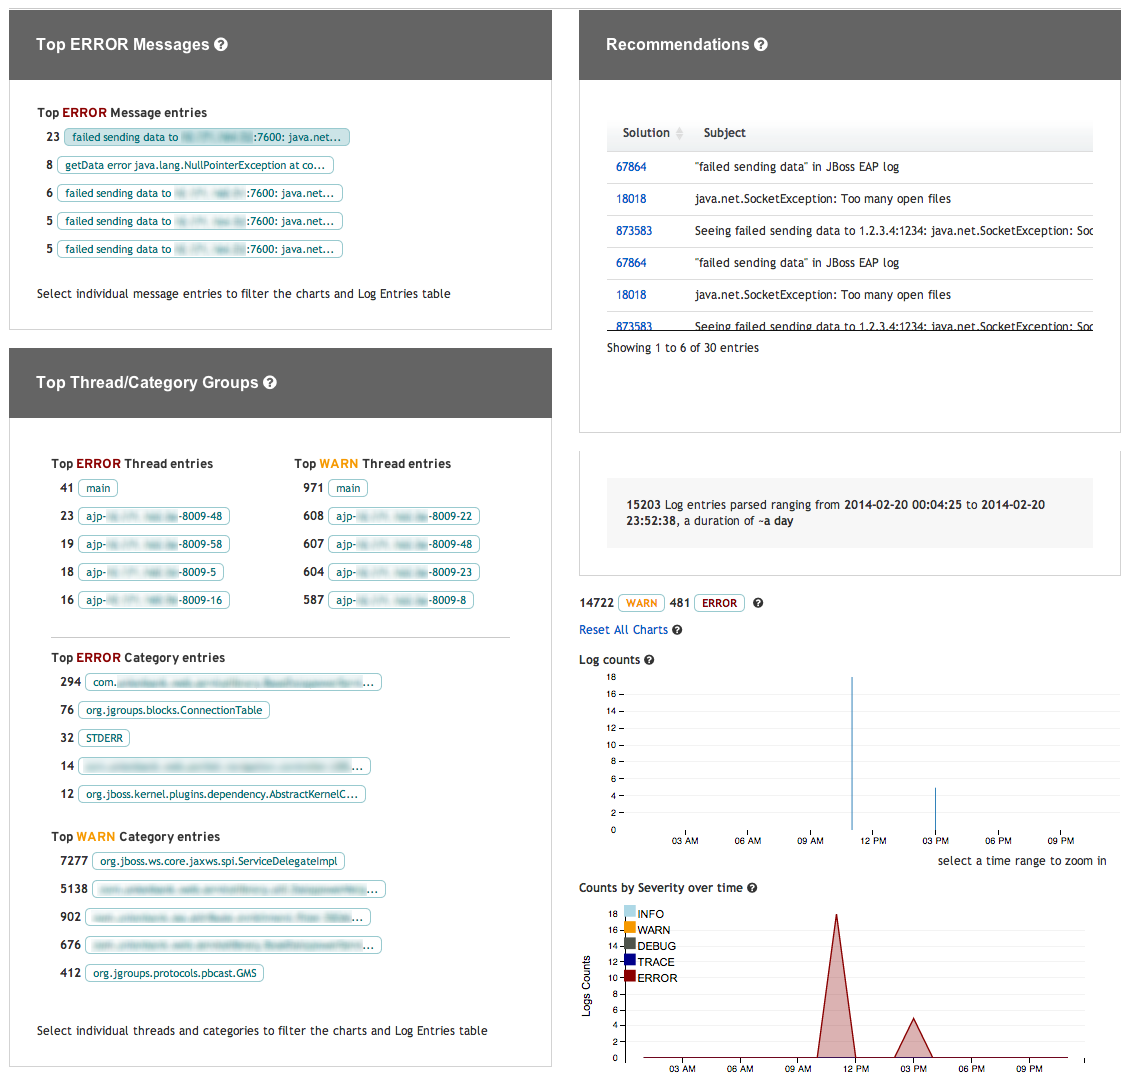
Let's take a look at a real world log where a customer was having clustering issues. Dropping the 30m JBoss server log in takes about 5-10 seconds to parse then we are presented with the following:

The above illustrates the various analyses of the log file. The log entries are effectively map reduced into categories for each uniquely identified field in the log, then from there counted up and the top counts for each field displayed. For example, the top error messages are shown. The 'Top ERROR Message entries' being clearly indicative of a clustering issue with the 'failed sending data to ip:port' the the 'Top ERROR Category entries' containing 'org.jgroups.blocks.ConnectionTable'.
On the top right you'll see directly relevant solution recommendations based on these top error messages as well.
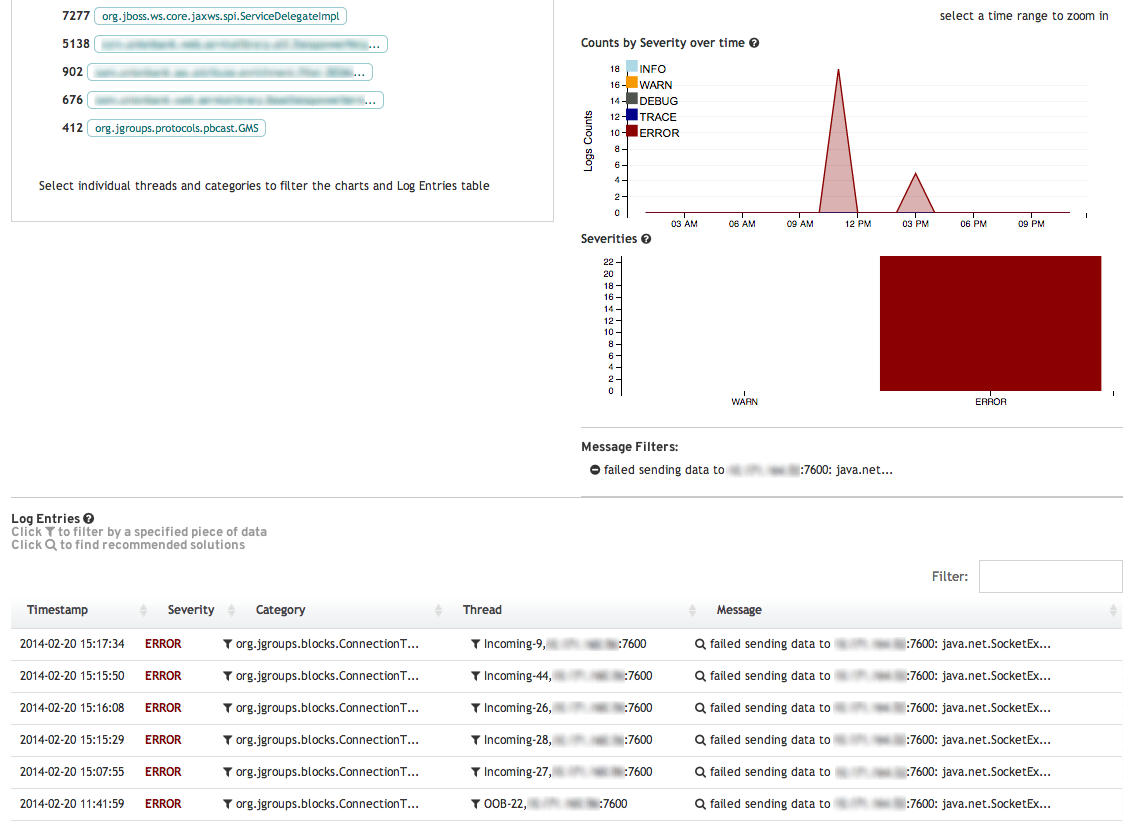
Selecting any of the top fields will further filter the table. So selecting that top error message yield:

Here we can quickly see where in the log those clustering errors began: a little before 12 and around 3pm. The Log Entries table at the bottom is reactive based on the currently selected filters. You are able to click on the Message itself which will expand into a popup. Each individual message can be sent submitted to Red Hat for inline recommendations and loading of solutions as well.
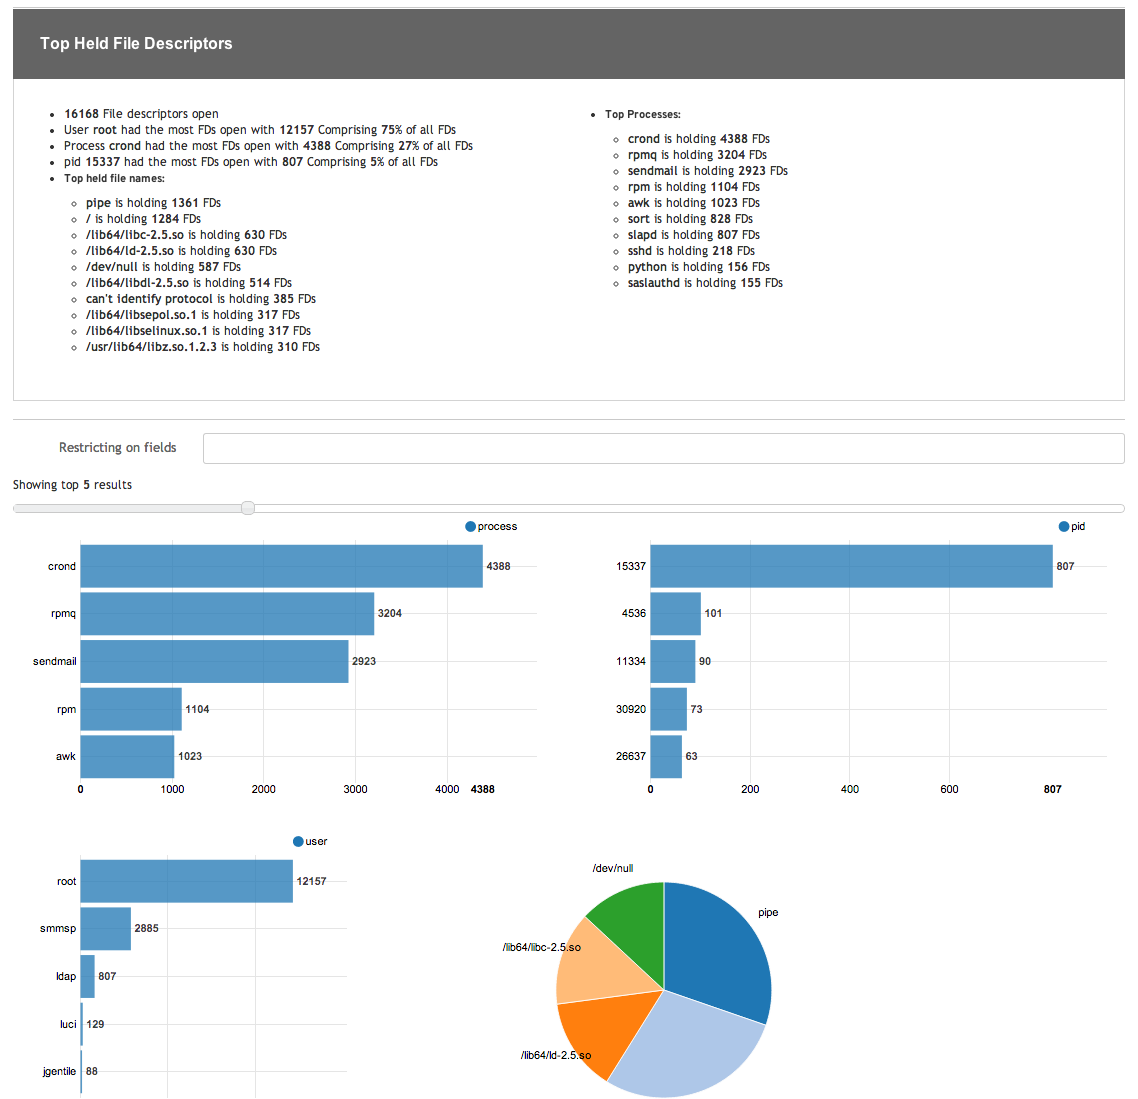
Here is an example of parsed list open files (lsof) output:

Taking an lsof snapshot, parsing it in Log Analyzer, and attaching it to a case is an excellent use case that can help Global Support Services (GSS) further assist you. You can also use this view to help you see what is holding onto FDs and potentially causing ulimit issues.
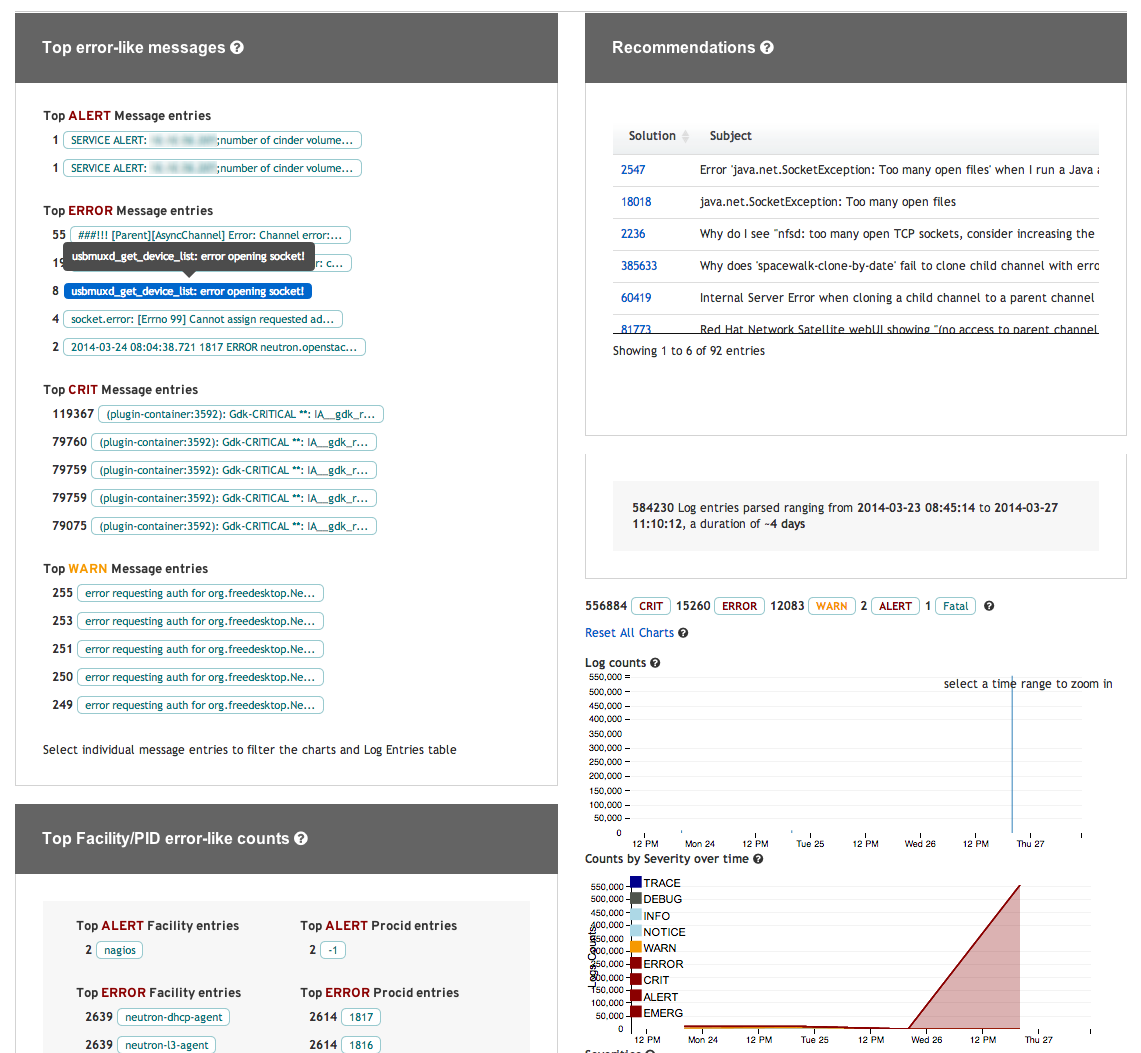
Now for a /var/log/messages. This is another real world example. This particular file was ~100m, and took around one minute to parse and analyze ~584k log entries.

There is a lot of data to consume in this file including an increasing trend of errors beginning late Tues. and increasing into Wed. If you are taking a look at a log message, and unsure how to interpret the output, and the recommendations may not be clear, one great idea to help GSS, would be to copy and paste the top error-like messages to your existing case or in a new case. For example, based on the above messages output, I would copy:
Top ALERT Message entries

1 SERVICE ALERT: x.x.x.x;number of cinder volume...
1 SERVICE ALERT: x.x.x.x;number of cinder volume...
Top ERROR Message entries

55 ###!!! [Parent][AsyncChannel] Error: Channel error:...
19 ###!!! [Parent][RPCChannel] Error: Channel error: c...
8 usbmuxd_get_device_list: error opening socket!
4 socket.error: [Errno 99] Cannot assign requested ad...
2 2014-03-24 08:04:38.721 1817 ERROR neutron.openstac...
Top CRIT Message entries

119367 (plugin-container:3592): Gdk-CRITICAL **: IA__gdk_r...
79760 (plugin-container:3592): Gdk-CRITICAL **: IA__gdk_r...
79759 (plugin-container:3592): Gdk-CRITICAL **: IA__gdk_r...
79759 (plugin-container:3592): Gdk-CRITICAL **: IA__gdk_r...
79075 (plugin-container:3592): Gdk-CRITICAL **: IA__gdk_r...
Top WARN Message entries

255 error requesting auth for org.freedesktop.Ne...
253 error requesting auth for org.freedesktop.Ne...
251 error requesting auth for org.freedesktop.Ne...
250 error requesting auth for org.freedesktop.Ne...
249 error requesting auth for org.freedesktop.Ne...
This could give a great heads up to the engineer working your case.
I'd encourage you to routinely run your logs through Log Analyzer. If nothing other than a sanity check and pre-emptive analysis, you may be surprised what you find, and what Solution Recommendations may help you. You can find further information on the Log Analyzer info page


Comments