
22.6.2. Installing the JBoss Operations Network Plug-in (Library Mode)
Procedure 22.7. Install JBoss Operations Network Library Mode Plug-in
Open the JBoss Operations Network Console
- From the JBoss Operations Network console, select .
- Select from the options on the left side of the console.

Figure 22.1. JBoss Operations Network Console for JBoss Data Grid
Upload the Library Mode Plug-in
- Click , locate the
InfinispanPluginon your local file system. - Click to add the plug-in to the JBoss Operations Network Server.
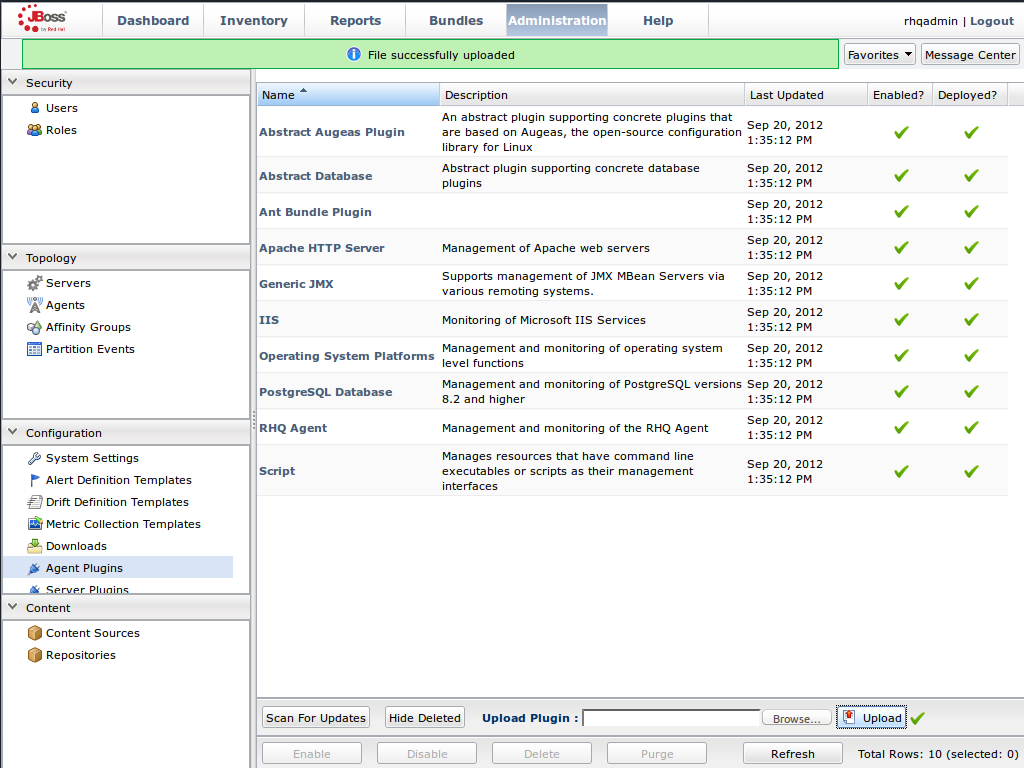
Figure 22.2. Upload the
InfinispanPlugin.Scan for Updates
- Once the file has successfully uploaded, click at the bottom of the screen.
- The
InfinispanPluginwill now appear in the list of installed plug-ins.
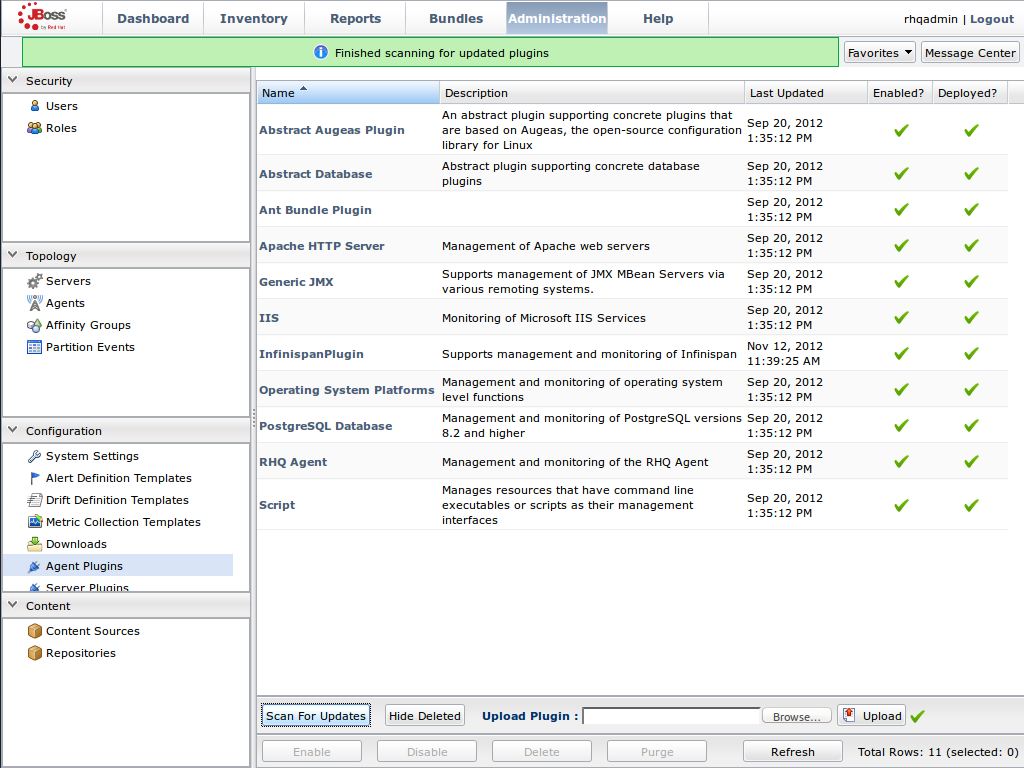
Figure 22.3. Scan for Updated Plug-ins.
Import the Platform
- Navigate to the and select from the list on the left of the console.
- Select the platform on which the application is running and click at the bottom of the screen.
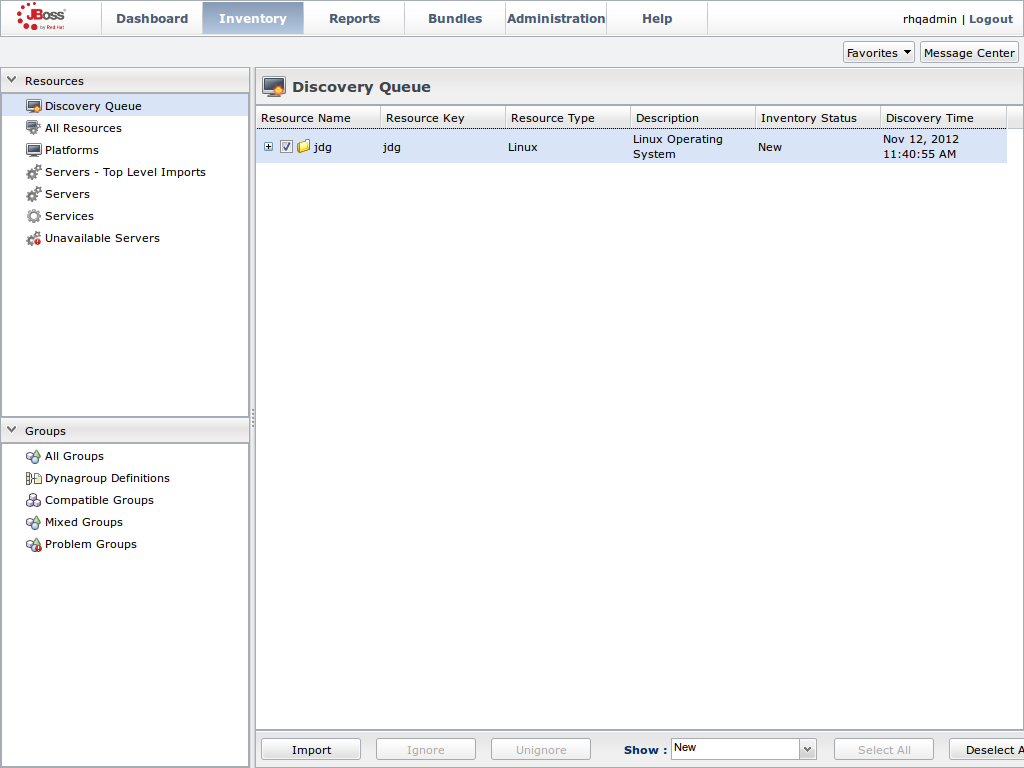
Figure 22.4. Import the Platform from the .
Access the Servers on the Platform
- The
jdgPlatform now appears in the Platforms list. - Click on the Platform to access the servers that are running on it.
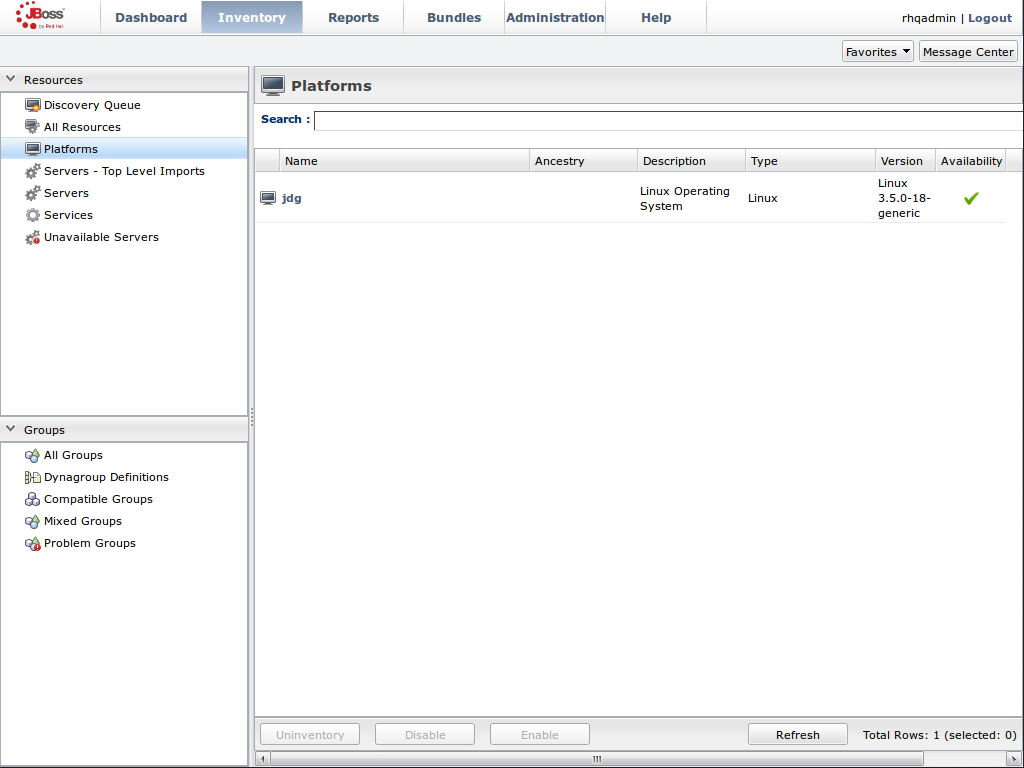
Figure 22.5. Open the
jdgPlatform to view the list of servers.Import the JMX Server
- From the tab, select .
- Click the button at the bottom of the screen and select the option from the list.
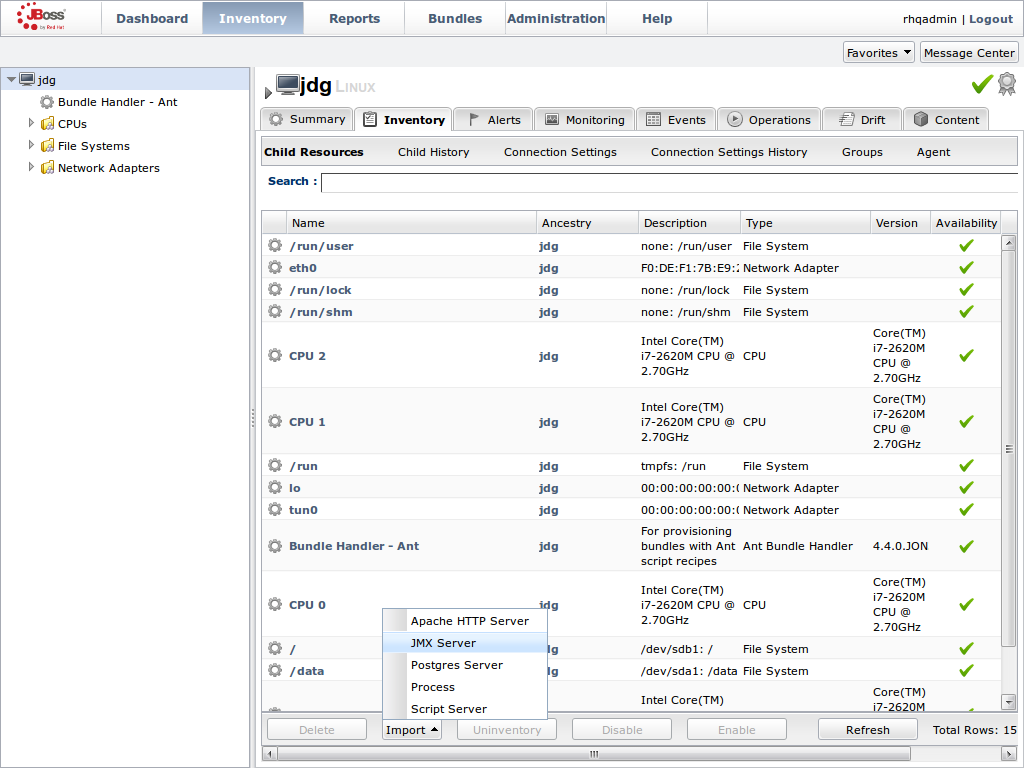
Figure 22.6. Import the JMX Server
Enable JDK Connection Settings
- In the window, specify from the list of options.
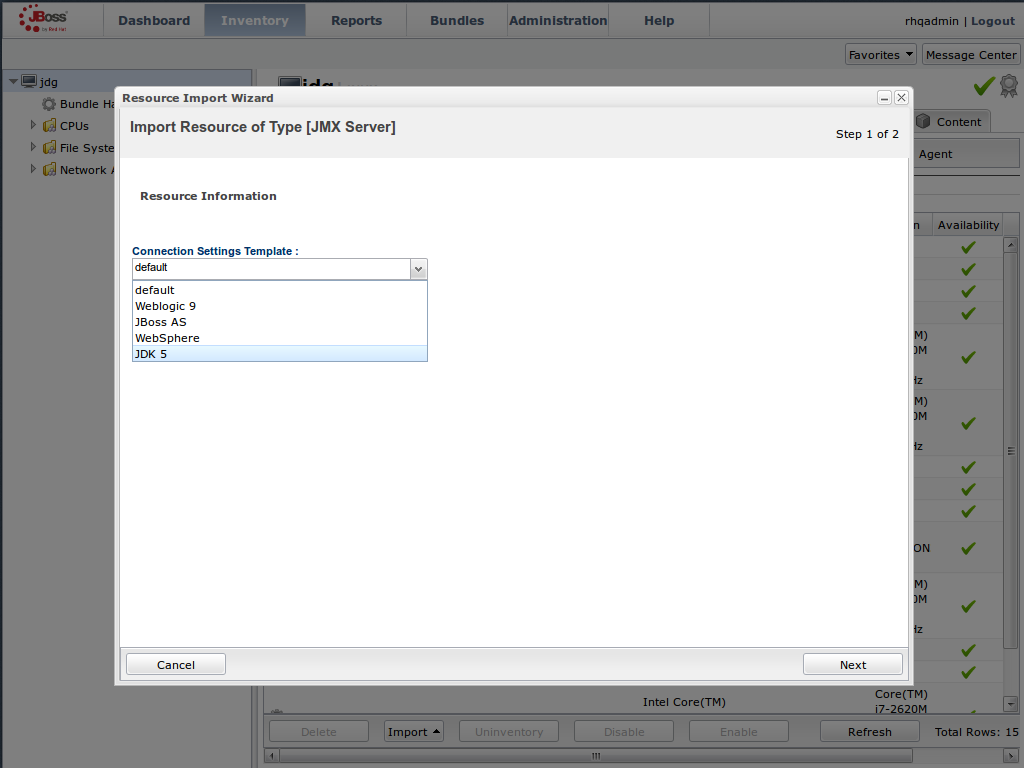
Figure 22.7. Select the JDK 5 Template.
Modify the Connector Address
- In the menu, modify the supplied with the hostname and JMX port of the process containing the Infinispan Library.
- Specify the and information if required.
- Click .
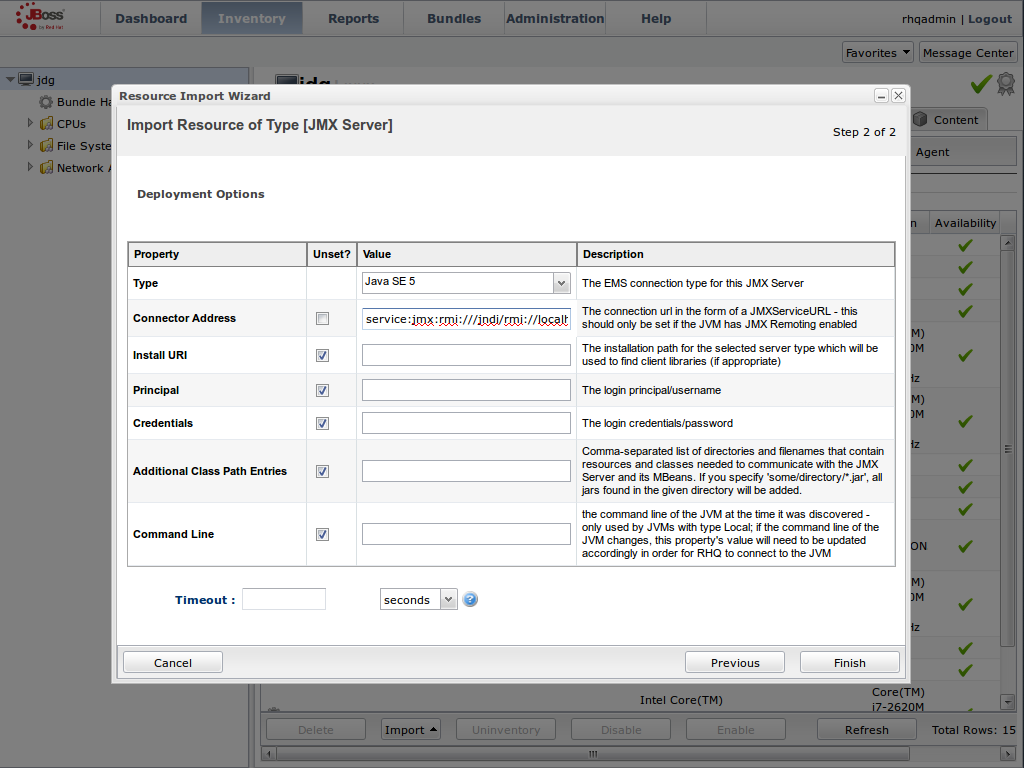
Figure 22.8. Modify the values in the Deployment Options screen.
View Cache Statistics and Operations
- Click to refresh the list of servers.
- The tree in the panel on the left side of the screen contains the node, which contains the available cache managers. The available cache managers contain the available caches.
- Select a cache from the available caches to view metrics.
- Select the tab.
- The view shows statistics and metrics.
- The tab provides access to the various operations that can be performed on the services.
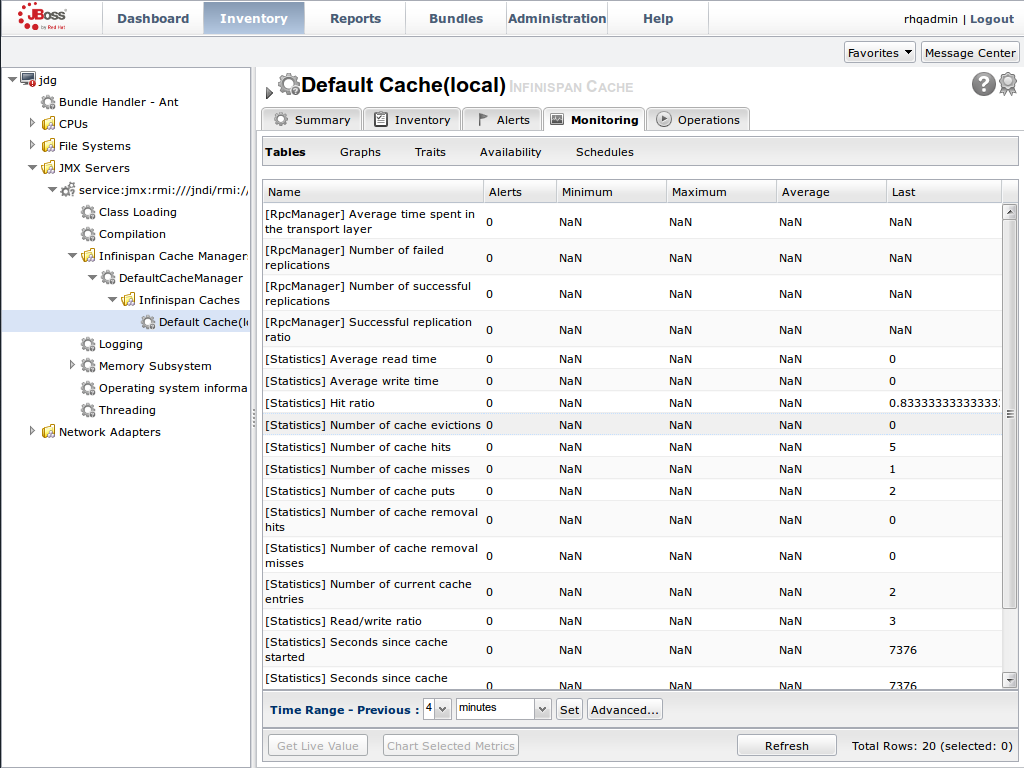
Figure 22.9. Metrics and operational data relayed through JMX is now available in the JBoss Operations Network console.