
Chapter 7. Scalability and performance optimization
7.1. Optimizing storage
Optimizing storage helps to minimize storage use across all resources. By optimizing storage, administrators help ensure that existing storage resources are working in an efficient manner.
7.1.1. Available persistent storage options
Understand your persistent storage options so that you can optimize your OpenShift Container Platform environment.
Table 7.1. Available storage options
| Storage type | Description | Examples |
|---|---|---|
| Block |
| AWS EBS and VMware vSphere support dynamic persistent volume (PV) provisioning natively in OpenShift Container Platform. |
| File |
| RHEL NFS, NetApp NFS [1], and Vendor NFS |
| Object |
| AWS S3 |
- NetApp NFS supports dynamic PV provisioning when using the Trident plugin.
7.1.2. Recommended configurable storage technology
The following table summarizes the recommended and configurable storage technologies for the given OpenShift Container Platform cluster application.
Table 7.2. Recommended and configurable storage technology
| Storage type | Block | File | Object |
|---|---|---|---|
|
1
2 3 Prometheus is the underlying technology used for metrics. 4 This does not apply to physical disk, VM physical disk, VMDK, loopback over NFS, AWS EBS, and Azure Disk.
5 For metrics, using file storage with the 6 For logging, review the recommended storage solution in Configuring persistent storage for the log store section. Using NFS storage as a persistent volume or through NAS, such as Gluster, can corrupt the data. Hence, NFS is not supported for Elasticsearch storage and LokiStack log store in OpenShift Container Platform Logging. You must use one persistent volume type per log store. 7 Object storage is not consumed through OpenShift Container Platform’s PVs or PVCs. Apps must integrate with the object storage REST API. | |||
| ROX1 | Yes4 | Yes4 | Yes |
| RWX2 | No | Yes | Yes |
| Registry | Configurable | Configurable | Recommended |
| Scaled registry | Not configurable | Configurable | Recommended |
| Metrics3 | Recommended | Configurable5 | Not configurable |
| Elasticsearch Logging | Recommended | Configurable6 | Not supported6 |
| Loki Logging | Not configurable | Not configurable | Recommended |
| Apps | Recommended | Recommended | Not configurable7 |
A scaled registry is an OpenShift image registry where two or more pod replicas are running.
7.1.2.1. Specific application storage recommendations
Testing shows issues with using the NFS server on Red Hat Enterprise Linux (RHEL) as storage backend for core services. This includes the OpenShift Container Registry and Quay, Prometheus for monitoring storage, and Elasticsearch for logging storage. Therefore, using RHEL NFS to back PVs used by core services is not recommended.
Other NFS implementations on the marketplace might not have these issues. Contact the individual NFS implementation vendor for more information on any testing that was possibly completed against these OpenShift Container Platform core components.
7.1.2.1.1. Registry
In a non-scaled/high-availability (HA) OpenShift image registry cluster deployment:
- The storage technology does not have to support RWX access mode.
- The storage technology must ensure read-after-write consistency.
- The preferred storage technology is object storage followed by block storage.
- File storage is not recommended for OpenShift image registry cluster deployment with production workloads.
7.1.2.1.2. Scaled registry
In a scaled/HA OpenShift image registry cluster deployment:
- The storage technology must support RWX access mode.
- The storage technology must ensure read-after-write consistency.
- The preferred storage technology is object storage.
- Red Hat OpenShift Data Foundation (ODF), Amazon Simple Storage Service (Amazon S3), Google Cloud Storage (GCS), Microsoft Azure Blob Storage, and OpenStack Swift are supported.
- Object storage should be S3 or Swift compliant.
- For non-cloud platforms, such as vSphere and bare metal installations, the only configurable technology is file storage.
- Block storage is not configurable.
7.1.2.1.3. Metrics
In an OpenShift Container Platform hosted metrics cluster deployment:
- The preferred storage technology is block storage.
- Object storage is not configurable.
It is not recommended to use file storage for a hosted metrics cluster deployment with production workloads.
7.1.2.1.4. Logging
In an OpenShift Container Platform hosted logging cluster deployment:
Loki Operator:
- The preferred storage technology is S3 compatible Object storage.
- Block storage is not configurable.
OpenShift Elasticsearch Operator:
- The preferred storage technology is block storage.
- Object storage is not supported.
As of logging version 5.4.3 the OpenShift Elasticsearch Operator is deprecated and is planned to be removed in a future release. Red Hat will provide bug fixes and support for this feature during the current release lifecycle, but this feature will no longer receive enhancements and will be removed. As an alternative to using the OpenShift Elasticsearch Operator to manage the default log storage, you can use the Loki Operator.
7.1.2.1.5. Applications
Application use cases vary from application to application, as described in the following examples:
- Storage technologies that support dynamic PV provisioning have low mount time latencies, and are not tied to nodes to support a healthy cluster.
- Application developers are responsible for knowing and understanding the storage requirements for their application, and how it works with the provided storage to ensure that issues do not occur when an application scales or interacts with the storage layer.
7.1.2.2. Other specific application storage recommendations
It is not recommended to use RAID configurations on Write intensive workloads, such as etcd. If you are running etcd with a RAID configuration, you might be at risk of encountering performance issues with your workloads.
- Red Hat OpenStack Platform (RHOSP) Cinder: RHOSP Cinder tends to be adept in ROX access mode use cases.
- Databases: Databases (RDBMSs, NoSQL DBs, etc.) tend to perform best with dedicated block storage.
- The etcd database must have enough storage and adequate performance capacity to enable a large cluster. Information about monitoring and benchmarking tools to establish ample storage and a high-performance environment is described in Recommended etcd practices.
7.1.3. Data storage management
The following table summarizes the main directories that OpenShift Container Platform components write data to.
Table 7.3. Main directories for storing OpenShift Container Platform data
| Directory | Notes | Sizing | Expected growth |
|---|---|---|---|
| /var/log | Log files for all components. | 10 to 30 GB. | Log files can grow quickly; size can be managed by growing disks or by using log rotate. |
| /var/lib/etcd | Used for etcd storage when storing the database. | Less than 20 GB. Database can grow up to 8 GB. | Will grow slowly with the environment. Only storing metadata. Additional 20-25 GB for every additional 8 GB of memory. |
| /var/lib/containers | This is the mount point for the CRI-O runtime. Storage used for active container runtimes, including pods, and storage of local images. Not used for registry storage. | 50 GB for a node with 16 GB memory. Note that this sizing should not be used to determine minimum cluster requirements. Additional 20-25 GB for every additional 8 GB of memory. | Growth is limited by capacity for running containers. |
| /var/lib/kubelet | Ephemeral volume storage for pods. This includes anything external that is mounted into a container at runtime. Includes environment variables, kube secrets, and data volumes not backed by persistent volumes. | Varies | Minimal if pods requiring storage are using persistent volumes. If using ephemeral storage, this can grow quickly. |
7.1.4. Optimizing storage performance for Microsoft Azure
OpenShift Container Platform and Kubernetes are sensitive to disk performance, and faster storage is recommended, particularly for etcd on the control plane nodes.
For production Azure clusters and clusters with intensive workloads, the virtual machine operating system disk for control plane machines should be able to sustain a tested and recommended minimum throughput of 5000 IOPS / 200MBps. This throughput can be provided by having a minimum of 1 TiB Premium SSD (P30). In Azure and Azure Stack Hub, disk performance is directly dependent on SSD disk sizes. To achieve the throughput supported by a Standard_D8s_v3 virtual machine, or other similar machine types, and the target of 5000 IOPS, at least a P30 disk is required.
Host caching must be set to ReadOnly for low latency and high IOPS and throughput when reading data. Reading data from the cache, which is present either in the VM memory or in the local SSD disk, is much faster than reading from the disk, which is in the blob storage.
7.1.5. Additional resources
7.2. Optimizing routing
The OpenShift Container Platform HAProxy router can be scaled or configured to optimize performance.
7.2.1. Baseline Ingress Controller (router) performance
The OpenShift Container Platform Ingress Controller, or router, is the ingress point for ingress traffic for applications and services that are configured using routes and ingresses.
When evaluating a single HAProxy router performance in terms of HTTP requests handled per second, the performance varies depending on many factors. In particular:
- HTTP keep-alive/close mode
- Route type
- TLS session resumption client support
- Number of concurrent connections per target route
- Number of target routes
- Back end server page size
- Underlying infrastructure (network/SDN solution, CPU, and so on)
While performance in your specific environment will vary, Red Hat lab tests on a public cloud instance of size 4 vCPU/16GB RAM. A single HAProxy router handling 100 routes terminated by backends serving 1kB static pages is able to handle the following number of transactions per second.
In HTTP keep-alive mode scenarios:
| Encryption | LoadBalancerService | HostNetwork |
|---|---|---|
| none | 21515 | 29622 |
| edge | 16743 | 22913 |
| passthrough | 36786 | 53295 |
| re-encrypt | 21583 | 25198 |
In HTTP close (no keep-alive) scenarios:
| Encryption | LoadBalancerService | HostNetwork |
|---|---|---|
| none | 5719 | 8273 |
| edge | 2729 | 4069 |
| passthrough | 4121 | 5344 |
| re-encrypt | 2320 | 2941 |
The default Ingress Controller configuration was used with the spec.tuningOptions.threadCount field set to 4. Two different endpoint publishing strategies were tested: Load Balancer Service and Host Network. TLS session resumption was used for encrypted routes. With HTTP keep-alive, a single HAProxy router is capable of saturating a 1 Gbit NIC at page sizes as small as 8 kB.
When running on bare metal with modern processors, you can expect roughly twice the performance of the public cloud instance above. This overhead is introduced by the virtualization layer in place on public clouds and holds mostly true for private cloud-based virtualization as well. The following table is a guide to how many applications to use behind the router:
| Number of applications | Application type |
|---|---|
| 5-10 | static file/web server or caching proxy |
| 100-1000 | applications generating dynamic content |
In general, HAProxy can support routes for up to 1000 applications, depending on the technology in use. Ingress Controller performance might be limited by the capabilities and performance of the applications behind it, such as language or static versus dynamic content.
Ingress, or router, sharding should be used to serve more routes towards applications and help horizontally scale the routing tier.
For more information on Ingress sharding, see Configuring Ingress Controller sharding by using route labels and Configuring Ingress Controller sharding by using namespace labels.
You can modify the Ingress Controller deployment using the information provided in Setting Ingress Controller thread count for threads and Ingress Controller configuration parameters for timeouts, and other tuning configurations in the Ingress Controller specification.
7.2.2. Configuring Ingress Controller liveness, readiness, and startup probes
Cluster administrators can configure the timeout values for the kubelet’s liveness, readiness, and startup probes for router deployments that are managed by the OpenShift Container Platform Ingress Controller (router). The liveness and readiness probes of the router use the default timeout value of 1 second, which is too brief when networking or runtime performance is severely degraded. Probe timeouts can cause unwanted router restarts that interrupt application connections. The ability to set larger timeout values can reduce the risk of unnecessary and unwanted restarts.
You can update the timeoutSeconds value on the livenessProbe, readinessProbe, and startupProbe parameters of the router container.
| Parameter | Description |
|---|---|
|
|
The |
|
|
The |
|
|
The |
The timeout configuration option is an advanced tuning technique that can be used to work around issues. However, these issues should eventually be diagnosed and possibly a support case or Jira issue opened for any issues that causes probes to time out.
The following example demonstrates how you can directly patch the default router deployment to set a 5-second timeout for the liveness and readiness probes:
$ oc -n openshift-ingress patch deploy/router-default --type=strategic --patch='{"spec":{"template":{"spec":{"containers":[{"name":"router","livenessProbe":{"timeoutSeconds":5},"readinessProbe":{"timeoutSeconds":5}}]}}}}'Verification
$ oc -n openshift-ingress describe deploy/router-default | grep -e Liveness: -e Readiness:
    Liveness:   http-get http://:1936/healthz delay=0s timeout=5s period=10s #success=1 #failure=3
    Readiness:  http-get http://:1936/healthz/ready delay=0s timeout=5s period=10s #success=1 #failure=3
7.2.3. Configuring HAProxy reload interval
When you update a route or an endpoint associated with a route, OpenShift Container Platform router updates the configuration for HAProxy. Then, HAProxy reloads the updated configuration for those changes to take effect. When HAProxy reloads, it generates a new process that handles new connections using the updated configuration.
HAProxy keeps the old process running to handle existing connections until those connections are all closed. When old processes have long-lived connections, these processes can accumulate and consume resources.
The default minimum HAProxy reload interval is five seconds. You can configure an Ingress Controller using its spec.tuningOptions.reloadInterval field to set a longer minimum reload interval.
Setting a large value for the minimum HAProxy reload interval can cause latency in observing updates to routes and their endpoints. To lessen the risk, avoid setting a value larger than the tolerable latency for updates.
Procedure
Change the minimum HAProxy reload interval of the default Ingress Controller to 15 seconds by running the following command:
$ oc -n openshift-ingress-operator patch ingresscontrollers/default --type=merge --patch='{"spec":{"tuningOptions":{"reloadInterval":"15s"}}}'
7.3. Optimizing networking
The OpenShift SDN uses OpenvSwitch, virtual extensible LAN (VXLAN) tunnels, OpenFlow rules, and iptables. This network can be tuned by using jumbo frames, multi-queue, and ethtool settings.
OVN-Kubernetes uses Generic Network Virtualization Encapsulation (Geneve) instead of VXLAN as the tunnel protocol. This network can be tuned by using network interface controller (NIC) offloads.
VXLAN provides benefits over VLANs, such as an increase in networks from 4096 to over 16 million, and layer 2 connectivity across physical networks. This allows for all pods behind a service to communicate with each other, even if they are running on different systems.
VXLAN encapsulates all tunneled traffic in user datagram protocol (UDP) packets. However, this leads to increased CPU utilization. Both these outer- and inner-packets are subject to normal checksumming rules to guarantee data is not corrupted during transit. Depending on CPU performance, this additional processing overhead can cause a reduction in throughput and increased latency when compared to traditional, non-overlay networks.
Cloud, VM, and bare metal CPU performance can be capable of handling much more than one Gbps network throughput. When using higher bandwidth links such as 10 or 40 Gbps, reduced performance can occur. This is a known issue in VXLAN-based environments and is not specific to containers or OpenShift Container Platform. Any network that relies on VXLAN tunnels will perform similarly because of the VXLAN implementation.
If you are looking to push beyond one Gbps, you can:
- Evaluate network plugins that implement different routing techniques, such as border gateway protocol (BGP).
- Use VXLAN-offload capable network adapters. VXLAN-offload moves the packet checksum calculation and associated CPU overhead off of the system CPU and onto dedicated hardware on the network adapter. This frees up CPU cycles for use by pods and applications, and allows users to utilize the full bandwidth of their network infrastructure.
VXLAN-offload does not reduce latency. However, CPU utilization is reduced even in latency tests.
7.3.1. Optimizing the MTU for your network
There are two important maximum transmission units (MTUs): the network interface controller (NIC) MTU and the cluster network MTU.
The NIC MTU is only configured at the time of OpenShift Container Platform installation. The MTU must be less than or equal to the maximum supported value of the NIC of your network. If you are optimizing for throughput, choose the largest possible value. If you are optimizing for lowest latency, choose a lower value.
The OpenShift SDN network plugin overlay MTU must be less than the NIC MTU by 50 bytes at a minimum. This accounts for the SDN overlay header. So, on a normal ethernet network, this should be set to 1450. On a jumbo frame ethernet network, this should be set to 8950. These values should be set automatically by the Cluster Network Operator based on the NIC’s configured MTU. Therefore, cluster administrators do not typically update these values. Amazon Web Services (AWS) and bare-metal environments support jumbo frame ethernet networks. This setting will help throughput, especially with transmission control protocol (TCP).
For OVN and Geneve, the MTU must be less than the NIC MTU by 100 bytes at a minimum.
This 50 byte overlay header is relevant to the OpenShift SDN network plugin. Other SDN solutions might require the value to be more or less.
7.3.2. Recommended practices for installing large scale clusters
When installing large clusters or scaling the cluster to larger node counts, set the cluster network cidr accordingly in your install-config.yaml file before you install the cluster:
networking:
  clusterNetwork:
  - cidr: 10.128.0.0/14
    hostPrefix: 23
  machineNetwork:
  - cidr: 10.0.0.0/16
  networkType: OVNKubernetes
  serviceNetwork:
  - 172.30.0.0/16
The default cluster network cidr 10.128.0.0/14 cannot be used if the cluster size is more than 500 nodes. It must be set to 10.128.0.0/12 or 10.128.0.0/10 to get to larger node counts beyond 500 nodes.
7.3.3. Impact of IPsec
Because encrypting and decrypting node hosts uses CPU power, performance is affected both in throughput and CPU usage on the nodes when encryption is enabled, regardless of the IP security system being used.
IPSec encrypts traffic at the IP payload level, before it hits the NIC, protecting fields that would otherwise be used for NIC offloading. This means that some NIC acceleration features might not be usable when IPSec is enabled and will lead to decreased throughput and increased CPU usage.
7.3.4. Additional resources
7.4. Optimizing CPU usage with mount namespace encapsulation
You can optimize CPU usage in OpenShift Container Platform clusters by using mount namespace encapsulation to provide a private namespace for kubelet and CRI-O processes. This reduces the cluster CPU resources used by systemd with no difference in functionality.
Mount namespace encapsulation is a Technology Preview feature only. Technology Preview features are not supported with Red Hat production service level agreements (SLAs) and might not be functionally complete. Red Hat does not recommend using them in production. These features provide early access to upcoming product features, enabling customers to test functionality and provide feedback during the development process.
For more information about the support scope of Red Hat Technology Preview features, see Technology Preview Features Support Scope.
7.4.1. Encapsulating mount namespaces
Mount namespaces are used to isolate mount points so that processes in different namespaces cannot view each others' files. Encapsulation is the process of moving Kubernetes mount namespaces to an alternative location where they will not be constantly scanned by the host operating system.
The host operating system uses systemd to constantly scan all mount namespaces: both the standard Linux mounts and the numerous mounts that Kubernetes uses to operate. The current implementation of kubelet and CRI-O both use the top-level namespace for all container runtime and kubelet mount points. However, encapsulating these container-specific mount points in a private namespace reduces systemd overhead with no difference in functionality. Using a separate mount namespace for both CRI-O and kubelet can encapsulate container-specific mounts from any systemd or other host operating system interaction.
This ability to potentially achieve major CPU optimization is now available to all OpenShift Container Platform administrators. Encapsulation can also improve security by storing Kubernetes-specific mount points in a location safe from inspection by unprivileged users.
The following diagrams illustrate a Kubernetes installation before and after encapsulation. Both scenarios show example containers which have mount propagation settings of bidirectional, host-to-container, and none.
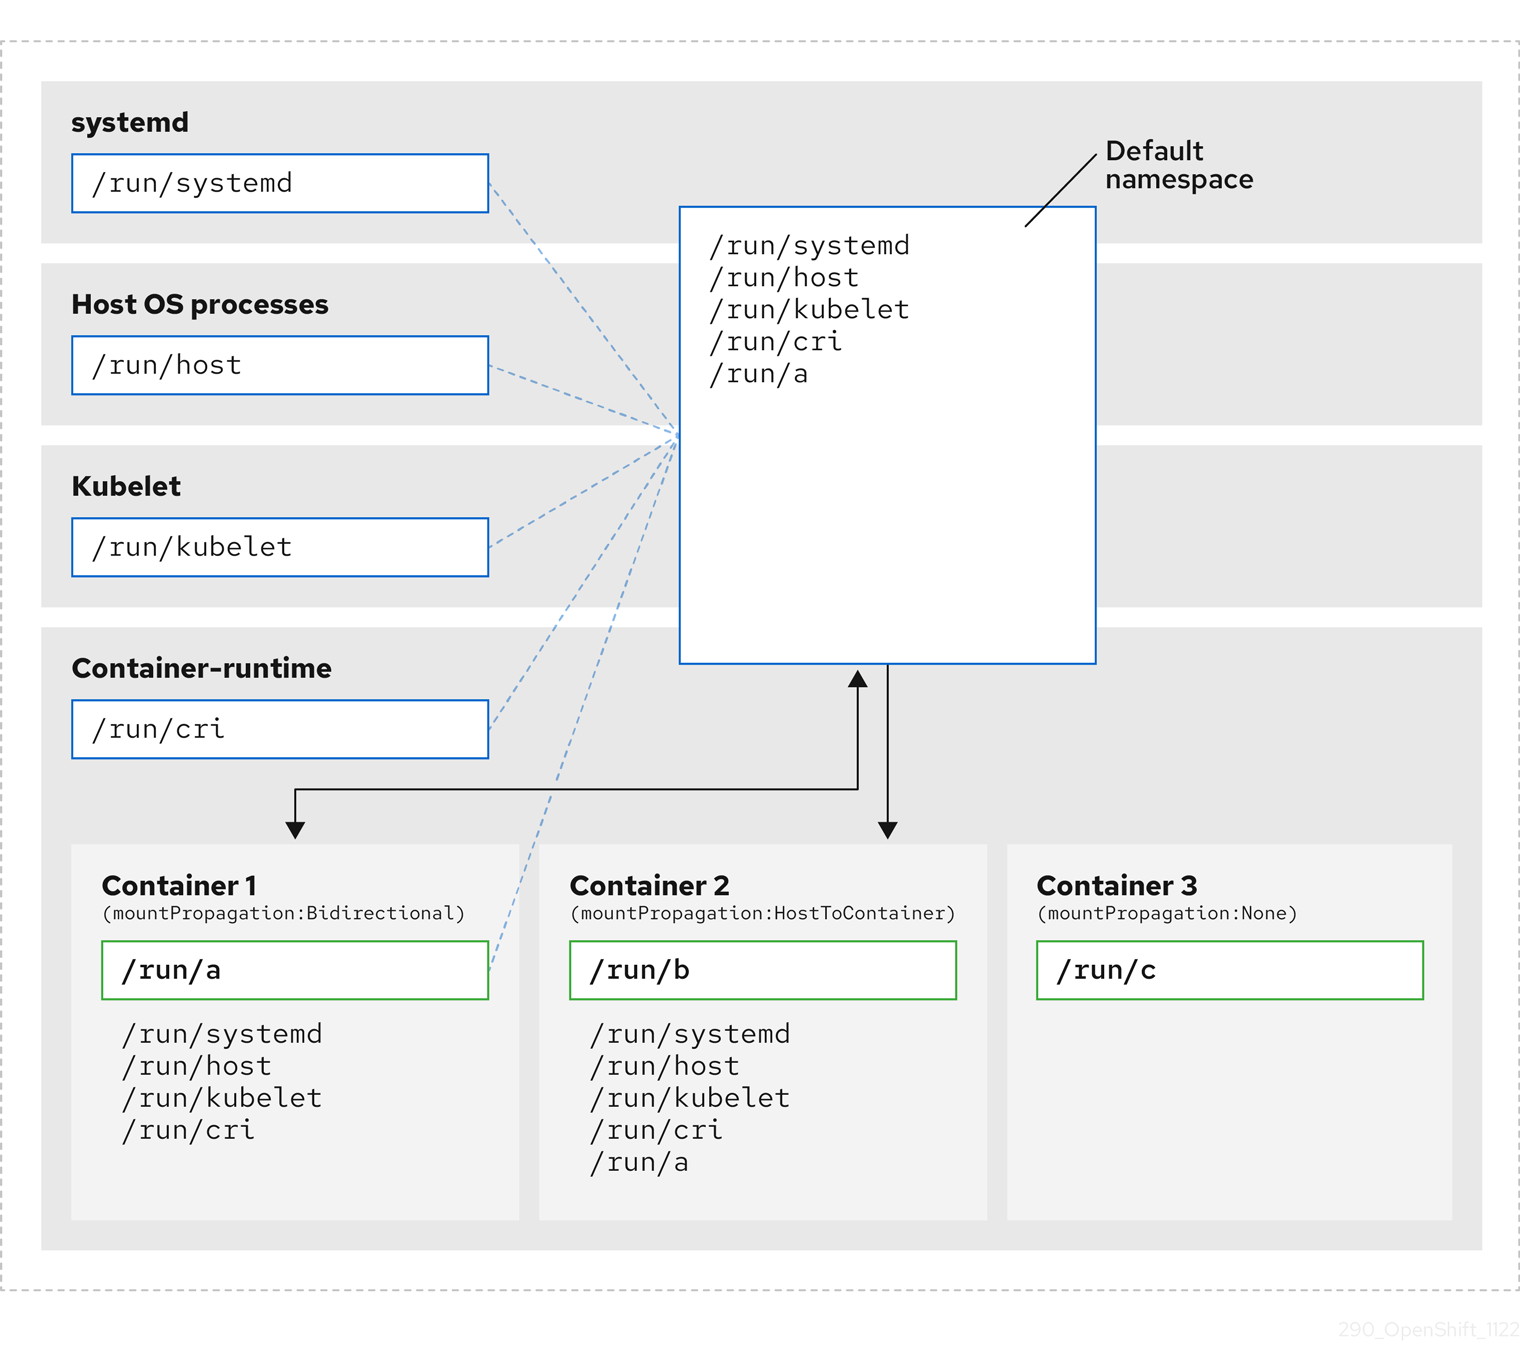
Here we see systemd, host operating system processes, kubelet, and the container runtime sharing a single mount namespace.
- systemd, host operating system processes, kubelet, and the container runtime each have access to and visibility of all mount points.
-
Container 1, configured with bidirectional mount propagation, can access systemd and host mounts, kubelet and CRI-O mounts. A mount originating in Container 1, such as
/run/ais visible to systemd, host operating system processes, kubelet, container runtime, and other containers with host-to-container or bidirectional mount propagation configured (as in Container 2). -
Container 2, configured with host-to-container mount propagation, can access systemd and host mounts, kubelet and CRI-O mounts. A mount originating in Container 2, such as
/run/b, is not visible to any other context. -
Container 3, configured with no mount propagation, has no visibility of external mount points. A mount originating in Container 3, such as
/run/c, is not visible to any other context.
The following diagram illustrates the system state after encapsulation.
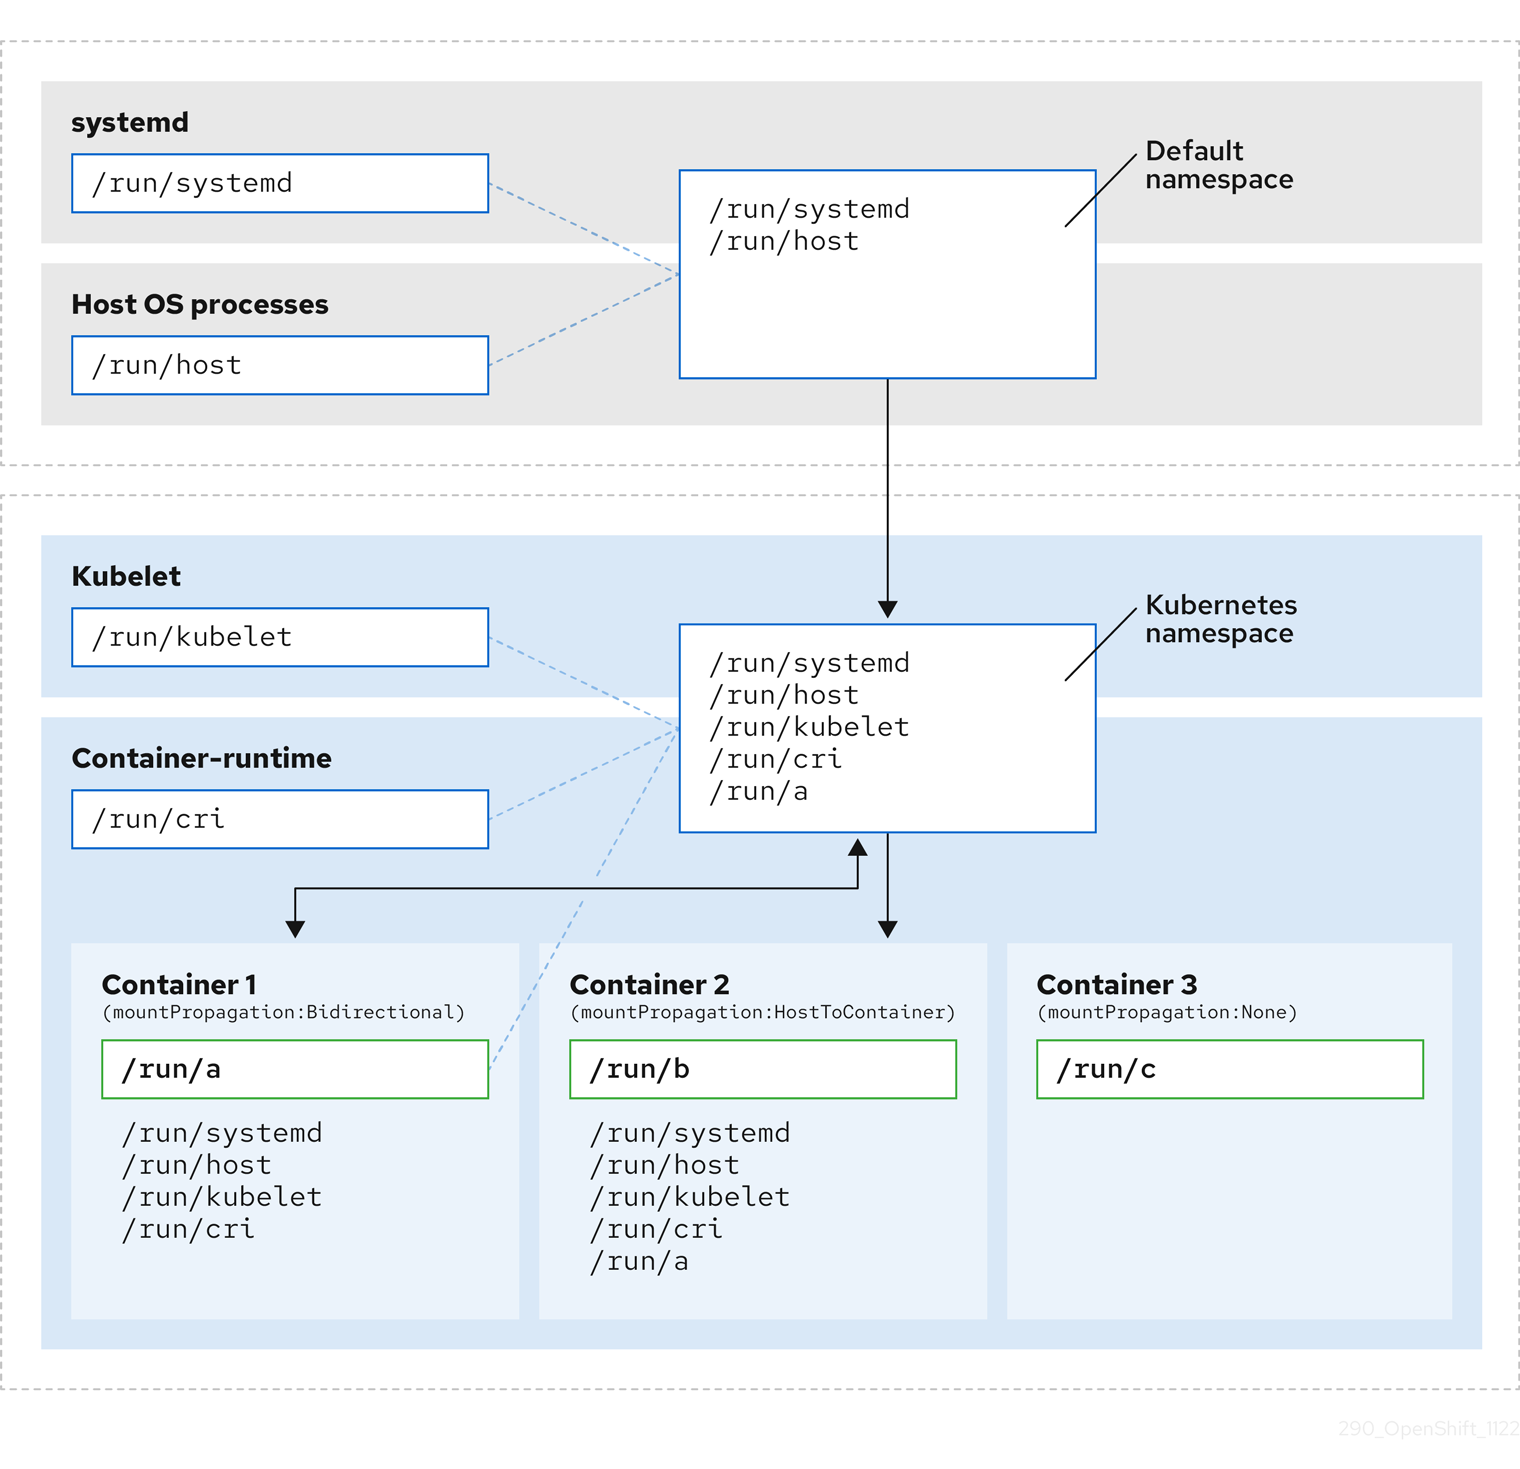
- The main systemd process is no longer devoted to unnecessary scanning of Kubernetes-specific mount points. It only monitors systemd-specific and host mount points.
- The host operating system processes can access only the systemd and host mount points.
- Using a separate mount namespace for both CRI-O and kubelet completely separates all container-specific mounts away from any systemd or other host operating system interaction whatsoever.
-
The behavior of Container 1 is unchanged, except a mount it creates such as
/run/ais no longer visible to systemd or host operating system processes. It is still visible to kubelet, CRI-O, and other containers with host-to-container or bidirectional mount propagation configured (like Container 2). - The behavior of Container 2 and Container 3 is unchanged.
7.4.2. Configuring mount namespace encapsulation
You can configure mount namespace encapsulation so that a cluster runs with less resource overhead.
Mount namespace encapsulation is a Technology Preview feature and it is disabled by default. To use it, you must enable the feature manually.
Prerequisites
-
You have installed the OpenShift CLI (
oc). -
You have logged in as a user with
cluster-adminprivileges.
Procedure
Create a file called
mount_namespace_config.yamlwith the following YAML:apiVersion: machineconfiguration.openshift.io/v1 kind: MachineConfig metadata: labels: machineconfiguration.openshift.io/role: master name: 99-kubens-master spec: config: ignition: version: 3.2.0 systemd: units: - enabled: true name: kubens.service --- apiVersion: machineconfiguration.openshift.io/v1 kind: MachineConfig metadata: labels: machineconfiguration.openshift.io/role: worker name: 99-kubens-worker spec: config: ignition: version: 3.2.0 systemd: units: - enabled: true name: kubens.serviceApply the mount namespace
MachineConfigCR by running the following command:$ oc apply -f mount_namespace_config.yaml
Example output
machineconfig.machineconfiguration.openshift.io/99-kubens-master created
machineconfig.machineconfiguration.openshift.io/99-kubens-worker created
The
MachineConfigCR can take up to 30 minutes to finish being applied in the cluster. You can check the status of theMachineConfigCR by running the following command:$ oc get mcp
Example output
NAME     CONFIG                                             UPDATED   UPDATING   DEGRADED   MACHINECOUNT   READYMACHINECOUNT   UPDATEDMACHINECOUNT   DEGRADEDMACHINECOUNT   AGE
master   rendered-master-03d4bc4befb0f4ed3566a2c8f7636751   False     True       False      3              0                   0                     0                      45m
worker   rendered-worker-10577f6ab0117ed1825f8af2ac687ddf   False     True       False      3              1                   1
Wait for the
MachineConfigCR to be applied successfully across all control plane and worker nodes after running the following command:$ oc wait --for=condition=Updated mcp --all --timeout=30m
Example output
machineconfigpool.machineconfiguration.openshift.io/master condition met
machineconfigpool.machineconfiguration.openshift.io/worker condition met
Verification
To verify encapsulation for a cluster host, run the following commands:
Open a debug shell to the cluster host:
$ oc debug node/<node_name>
Open a
chrootsession:sh-4.4# chroot /host
Check the systemd mount namespace:
sh-4.4# readlink /proc/1/ns/mnt
Example output
mnt:[4026531953]
Check kubelet mount namespace:
sh-4.4# readlink /proc/$(pgrep kubelet)/ns/mnt
Example output
mnt:[4026531840]
Check the CRI-O mount namespace:
sh-4.4# readlink /proc/$(pgrep crio)/ns/mnt
Example output
mnt:[4026531840]
These commands return the mount namespaces associated with systemd, kubelet, and the container runtime. In OpenShift Container Platform, the container runtime is CRI-O.
Encapsulation is in effect if systemd is in a different mount namespace to kubelet and CRI-O as in the above example. Encapsulation is not in effect if all three processes are in the same mount namespace.
7.4.3. Inspecting encapsulated namespaces
You can inspect Kubernetes-specific mount points in the cluster host operating system for debugging or auditing purposes by using the kubensenter script that is available in Red Hat Enterprise Linux CoreOS (RHCOS).
SSH shell sessions to the cluster host are in the default namespace. To inspect Kubernetes-specific mount points in an SSH shell prompt, you need to run the kubensenter script as root. The kubensenter script is aware of the state of the mount encapsulation, and is safe to run even if encapsulation is not enabled.
oc debug remote shell sessions start inside the Kubernetes namespace by default. You do not need to run kubensenter to inspect mount points when you use oc debug.
If the encapsulation feature is not enabled, the kubensenter findmnt and findmnt commands return the same output, regardless of whether they are run in an oc debug session or in an SSH shell prompt.
Prerequisites
-
You have installed the OpenShift CLI (
oc). -
You have logged in as a user with
cluster-adminprivileges. - You have configured SSH access to the cluster host.
Procedure
Open a remote SSH shell to the cluster host. For example:
$ ssh core@<node_name>
Run commands using the provided
kubensenterscript as the root user. To run a single command inside the Kubernetes namespace, provide the command and any arguments to thekubensenterscript. For example, to run thefindmntcommand inside the Kubernetes namespace, run the following command:[core@control-plane-1 ~]$ sudo kubensenter findmnt
Example output
kubensenter: Autodetect: kubens.service namespace found at /run/kubens/mnt
TARGET                                SOURCE                 FSTYPE     OPTIONS
/                                     /dev/sda4[/ostree/deploy/rhcos/deploy/32074f0e8e5ec453e56f5a8a7bc9347eaa4172349ceab9c22b709d9d71a3f4b0.0]
|                                                            xfs        rw,relatime,seclabel,attr2,inode64,logbufs=8,logbsize=32k,prjquota
                                      shm                    tmpfs
...
To start a new interactive shell inside the Kubernetes namespace, run the
kubensenterscript without any arguments:[core@control-plane-1 ~]$ sudo kubensenter
Example output
kubensenter: Autodetect: kubens.service namespace found at /run/kubens/mnt
7.4.4. Running additional services in the encapsulated namespace
Any monitoring tool that relies on the ability to run in the host operating system and have visibility of mount points created by kubelet, CRI-O, or containers themselves, must enter the container mount namespace to see these mount points. The kubensenter script that is provided with OpenShift Container Platform executes another command inside the Kubernetes mount point and can be used to adapt any existing tools.
The kubensenter script is aware of the state of the mount encapsulation feature status, and is safe to run even if encapsulation is not enabled. In that case the script executes the provided command in the default mount namespace.
For example, if a systemd service needs to run inside the new Kubernetes mount namespace, edit the service file and use the ExecStart= command line with kubensenter.
[Unit]
Description=Example service
[Service]
ExecStart=/usr/bin/kubensenter /path/to/original/command arg1 arg2