Interactive web interface for Performance Co-Pilot on RHEL7
Introduction
Performance Co-Pilot is a broad toolset for recording, analyzing, and interacting with systemwide performance data. The toolkit includes pmchart, a Qt-based application, with which one can create interactive dashboards, viewing live or historical, local or remote data.. For times when an X-Windows application is not suitable:
- on RHEL7, PCP 3.9.10 and later includes an interactive web interface provided by the
pmwebdservice. The instructions below focus on RHEL7/pmwebd, but from RHEL8 on the new way with pmlogger/redis/grafana is recommended. - on RHEL8 and later we recommend a combination of pmlogger/redis/grafana for graphical visualizations via web browser. That is documented in the product documentation.
These instructions allow users to view performance data through a web browser. As the format to archive metrics has not changed, also archive files from rhel7 and earlier can be visualized on rhel8/9.
Each archive file and each recorded numeric metric within those files is represented by a different graphite-format time series (computed on demand), which may be selected for viewing individually or as groups (using wildcards).
Quick Start, for RHEL7 based pmwebd
Assuming you already have a PCP installation on your computer, with archives beneath the default location /var/log/pcp:
# yum install pcp-webapi pcp-webjs
# systemctl enable --now pmwebd
% firefox http://localhost:44323/ &
Note, no other installation of graphite or grafana is necessary, nor are any graphite-specific system services used.
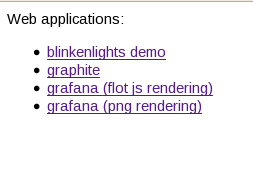
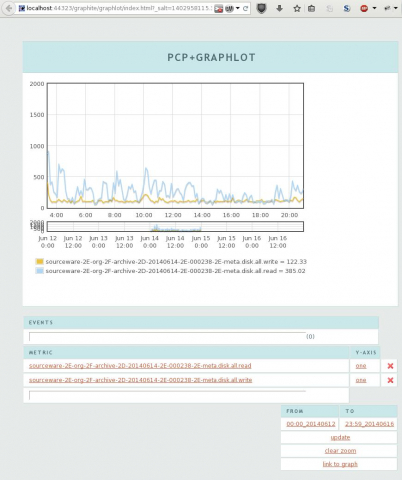
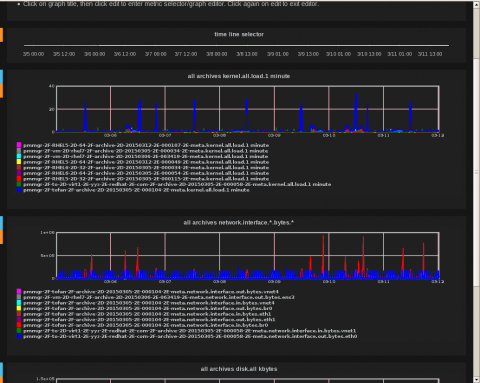
Click on the graphite or grafana links, and dive in. The default dashboards offer a quick cpu/disk/network traffic overview. Feel free to experiment, play, zoom around, even to edit the views. Not every graphite/grafana function is available; please file RFEs for important bits you miss.

Configuration
The web applications provided by pmwebd display locally stored PCP archive data., that has been or is being recorded by programs such as pmlogger, as opposed to live data on a local or remote host. Archived does not necessarily mean "stale", since data just being written by a logger will appear immediately via pmwebd. Archived also doesn't necessarily mean "local", since a logger may be monitoring a remote PCP pmcd server. So, the choice of data visible to pmwebd really comes down to the configuration of currently runnimlogger/redis/grafana is recommended.
* on RHEL8 and later we recommend a combination of PCP, redis and Grafana for visualization.
Each archive file and each recorded numeric metric within those files is represented by a different graphite-format time series (computed on demand), which may be selected for viewing individually or as groups (using wildcards). Details are here.
Quick Start
Assuming you already have a PCP installation on your computer, with archives beneath the default location /var/log/pcp:
# yum install pcp-webapi pcp-webjs
# chkconfig pmwebd on; service pmwebd start
% firefox http://localhost:44323/ &
Note, no other installation of graphite or grafana is necessary, nor are any graphite-specific system services used.
Click on the graphite or grafana links, and dive in. The default dashboards offer a quick cpu/disk/network traffic overview. Feel free to experiment, play, zoom around, even to edit the views. Not every graphite/grafana function is available; please file RFEs for important bits you miss.


Configuration
The web applications provided by pmwebd display locally stored PCP archive data., that has been or is being recorded by programs such as pmlogger, as opposed to live data on a local or remote host. Archived does not necessarily mean "stale", since data just being written by a logger will appear immediately via pmwebd. Archived also doesn't necessarily mean "local", since a logger may be monitoring a remote PCP pmcd server. So, the choice of data visible to pmwebd really comes down to the configuration of currently runninng pmloggers (and of course to the selection of historical archives, however obtained). The system pmwebd service may be configured by the /etc/pcp/pmwebd/pmwebd.options file, or you may run pmwebd directly, under your complete control. The web applications, index pages, and default dashboards, are all under /usr/share/pcp/webapps, which one may copy/edit in a new directory identified with the pmwebd -R option.. See the pmwebd man page for further details.
Configuring any given pmlogger instance to determine the set of metrics it records, the sampling interval, and the host it records from, is done with a set of configuration files under /etc/pcp/pmlogger. See the pmlogger man page for details. The control of pmlogger instances (startup, shutdown) may be done at least two ways. The first is the pmlogger service (a script & cron-job that use /etc/pcp/pmlogger/control), which lists hosts to monitor and a pmlogger output-directory & config file for each. Please turn off compression for the pmlogger_daily run in /etc/cron.d/pcp-pmlogger. The second way is the pmmgr service (a program controlled by /etc/pcp/pmmgr files), which is a convenient way to automatically spawn pmlogger instances for pmcd services running locally or on the network, using any combination of listing, scanning, and avahi service discovery..) The third way is to invoke pmlogger or pmmgr directly, under your complete control. See the pmlogger and pmmgr man pages for further details..


Comments