
Red Hat Training
A Red Hat training course is available for RHEL 8
Monitoring and managing system status and performance
Optimizing system throughput, latency, and power consumption
Abstract
Making open source more inclusive
Red Hat is committed to replacing problematic language in our code, documentation, and web properties. We are beginning with these four terms: master, slave, blacklist, and whitelist. Because of the enormity of this endeavor, these changes will be implemented gradually over several upcoming releases. For more details, see our CTO Chris Wright’s message.
Providing feedback on Red Hat documentation
We appreciate your feedback on our documentation. Let us know how we can improve it.
Submitting feedback through Jira (account required)
- Log in to the Jira website.
- Click Create in the top navigation bar.
- Enter a descriptive title in the Summary field.
- Enter your suggestion for improvement in the Description field. Include links to the relevant parts of the documentation.
- Click Create at the bottom of the dialogue.
Chapter 1. Overview of performance monitoring options
The following are some of the performance monitoring and configuration tools available in Red Hat Enterprise Linux 8:
-
Performance Co-Pilot (
pcp) is used for monitoring, visualizing, storing, and analyzing system-level performance measurements. It allows the monitoring and management of real-time data, and logging and retrieval of historical data. Red Hat Enterprise Linux 8 provides several tools that can be used from the command line to monitor a system outside run level
5. The following are the built-in command line tools:-
topis provided by theprocps-ngpackage. It gives a dynamic view of the processes in a running system. It displays a variety of information, including a system summary and a list of tasks currently being managed by the Linux kernel. -
psis provided by theprocps-ngpackage. It captures a snapshot of a select group of active processes. By default, the examined group is limited to processes that are owned by the current user and associated with the terminal where thepscommand is executed. -
Virtual memory statistics (
vmstat) is provided by theprocps-ngpackage. It provides instant reports of your system’s processes, memory, paging, block input/output, interrupts, and CPU activity. -
System activity reporter (
sar) is provided by thesysstatpackage. It collects and reports information about system activity that has occurred so far on the current day.
-
-
perfuses hardware performance counters and kernel trace-points to track the impact of other commands and applications on a system. -
bcc-toolsis used for BPF Compiler Collection (BCC). It provides over 100eBPFscripts that monitor kernel activities. For more information about each of this tool, see the man page describing how to use it and what functions it performs. -
turbostatis provided by thekernel-toolspackage. It reports on processor topology, frequency, idle power-state statistics, temperature, and power usage on the Intel 64 processors. -
iostatis provided by thesysstatpackage. It monitors and reports on system IO device loading to help administrators make decisions about how to balance IO load between physical disks. -
irqbalancedistributes hardware interrupts across processors to improve system performance. -
ssprints statistical information about sockets, allowing administrators to assess device performance over time. Red Hat recommends usingssovernetstatin Red Hat Enterprise Linux 8. -
numastatis provided by thenumactlpackage. By default,numastatdisplays per-node NUMA hit an miss system statistics from the kernel memory allocator. Optimal performance is indicated by highnuma_hitvalues and lownuma_missvalues. -
numadis an automatic NUMA affinity management daemon. It monitors NUMA topology and resource usage within a system that dynamically improves NUMA resource allocation, management, and therefore system performance. -
SystemTapmonitors and analyzes operating system activities, especially the kernel activities. -
valgrindanalyzes applications by running it on a synthetic CPU and instrumenting existing application code as it is executed. It then prints commentary that clearly identifies each process involved in application execution to a user-specified file, file descriptor, or network socket. It is also useful for finding memory leaks. -
pqosis provided by theintel-cmt-catpackage. It monitors and controls CPU cache and memory bandwidth on recent Intel processors.
Additional resources
-
pcp,top,ps,vmstat,sar,perf,iostat,irqbalance,ss,numastat,numad,valgrind, andpqosman pages -
/usr/share/doc/directory - What exactly is the meaning of value "await" reported by iostat? Red Hat Knowledgebase article
- Monitoring performance with Performance Co-Pilot
Chapter 2. Getting started with TuneD
As a system administrator, you can use the TuneD application to optimize the performance profile of your system for a variety of use cases.
2.1. The purpose of TuneD
TuneD is a service that monitors your system and optimizes the performance under certain workloads. The core of TuneD are profiles, which tune your system for different use cases.
TuneD is distributed with a number of predefined profiles for use cases such as:
- High throughput
- Low latency
- Saving power
It is possible to modify the rules defined for each profile and customize how to tune a particular device. When you switch to another profile or deactivate TuneD, all changes made to the system settings by the previous profile revert back to their original state.
You can also configure TuneD to react to changes in device usage and adjusts settings to improve performance of active devices and reduce power consumption of inactive devices.
2.2. TuneD profiles
A detailed analysis of a system can be very time-consuming. TuneD provides a number of predefined profiles for typical use cases. You can also create, modify, and delete profiles.
The profiles provided with TuneD are divided into the following categories:
- Power-saving profiles
- Performance-boosting profiles
The performance-boosting profiles include profiles that focus on the following aspects:
- Low latency for storage and network
- High throughput for storage and network
- Virtual machine performance
- Virtualization host performance
Syntax of profile configuration
The tuned.conf file can contain one [main] section and other sections for configuring plug-in instances. However, all sections are optional.
Lines starting with the hash sign (#) are comments.
Additional resources
-
tuned.conf(5)man page.
2.3. The default TuneD profile
During the installation, the best profile for your system is selected automatically. Currently, the default profile is selected according to the following customizable rules:
| Environment | Default profile | Goal |
|---|---|---|
| Compute nodes |
| The best throughput performance |
| Virtual machines |
|
The best performance. If you are not interested in the best performance, you can change it to the |
| Other cases |
| Balanced performance and power consumption |
Additional resources
-
tuned.conf(5)man page.
2.4. Merged TuneD profiles
As an experimental feature, it is possible to select more profiles at once. TuneD will try to merge them during the load.
If there are conflicts, the settings from the last specified profile takes precedence.
Example 2.1. Low power consumption in a virtual guest
The following example optimizes the system to run in a virtual machine for the best performance and concurrently tunes it for low power consumption, while the low power consumption is the priority:
# tuned-adm profile virtual-guest powersave
Merging is done automatically without checking whether the resulting combination of parameters makes sense. Consequently, the feature might tune some parameters the opposite way, which might be counterproductive: for example, setting the disk for high throughput by using the throughput-performance profile and concurrently setting the disk spindown to the low value by the spindown-disk profile.
Additional resources
*tuned-adm man page. * tuned.conf(5) man page.
2.5. The location of TuneD profiles
TuneD stores profiles in the following directories:
/usr/lib/tuned/-
Distribution-specific profiles are stored in the directory. Each profile has its own directory. The profile consists of the main configuration file called
tuned.conf, and optionally other files, for example helper scripts. /etc/tuned/-
If you need to customize a profile, copy the profile directory into the directory, which is used for custom profiles. If there are two profiles of the same name, the custom profile located in
/etc/tuned/is used.
Additional resources
-
tuned.conf(5)man page.
2.6. TuneD profiles distributed with RHEL
The following is a list of profiles that are installed with TuneD on Red Hat Enterprise Linux.
There might be more product-specific or third-party TuneD profiles available. Such profiles are usually provided by separate RPM packages.
balancedThe default power-saving profile. It is intended to be a compromise between performance and power consumption. It uses auto-scaling and auto-tuning whenever possible. The only drawback is the increased latency. In the current TuneD release, it enables the CPU, disk, audio, and video plugins, and activates the
conservativeCPU governor. Theradeon_powersaveoption uses thedpm-balancedvalue if it is supported, otherwise it is set toauto.It changes the
energy_performance_preferenceattribute to thenormalenergy setting. It also changes thescaling_governorpolicy attribute to either theconservativeorpowersaveCPU governor.powersaveA profile for maximum power saving performance. It can throttle the performance in order to minimize the actual power consumption. In the current TuneD release it enables USB autosuspend, WiFi power saving, and Aggressive Link Power Management (ALPM) power savings for SATA host adapters. It also schedules multi-core power savings for systems with a low wakeup rate and activates the
ondemandgovernor. It enables AC97 audio power saving or, depending on your system, HDA-Intel power savings with a 10 seconds timeout. If your system contains a supported Radeon graphics card with enabled KMS, the profile configures it to automatic power saving. On ASUS Eee PCs, a dynamic Super Hybrid Engine is enabled.It changes the
energy_performance_preferenceattribute to thepowersaveorpowerenergy setting. It also changes thescaling_governorpolicy attribute to either theondemandorpowersaveCPU governor.NoteIn certain cases, the
balancedprofile is more efficient compared to thepowersaveprofile.Consider there is a defined amount of work that needs to be done, for example a video file that needs to be transcoded. Your machine might consume less energy if the transcoding is done on the full power, because the task is finished quickly, the machine starts to idle, and it can automatically step-down to very efficient power save modes. On the other hand, if you transcode the file with a throttled machine, the machine consumes less power during the transcoding, but the process takes longer and the overall consumed energy can be higher.
That is why the
balancedprofile can be generally a better option.throughput-performanceA server profile optimized for high throughput. It disables power savings mechanisms and enables
sysctlsettings that improve the throughput performance of the disk and network IO. CPU governor is set toperformance.It changes the
energy_performance_preferenceandscaling_governorattribute to theperformanceprofile.accelerator-performance-
The
accelerator-performanceprofile contains the same tuning as thethroughput-performanceprofile. Additionally, it locks the CPU to low C states so that the latency is less than 100us. This improves the performance of certain accelerators, such as GPUs. latency-performanceA server profile optimized for low latency. It disables power savings mechanisms and enables
sysctlsettings that improve latency. CPU governor is set toperformanceand the CPU is locked to the low C states (by PM QoS).It changes the
energy_performance_preferenceandscaling_governorattribute to theperformanceprofile.network-latencyA profile for low latency network tuning. It is based on the
latency-performanceprofile. It additionally disables transparent huge pages and NUMA balancing, and tunes several other network-relatedsysctlparameters.It inherits the
latency-performanceprofile which changes theenergy_performance_preferenceandscaling_governorattribute to theperformanceprofile.hpc-compute-
A profile optimized for high-performance computing. It is based on the
latency-performanceprofile. network-throughputA profile for throughput network tuning. It is based on the
throughput-performanceprofile. It additionally increases kernel network buffers.It inherits either the
latency-performanceorthroughput-performanceprofile, and changes theenergy_performance_preferenceandscaling_governorattribute to theperformanceprofile.virtual-guestA profile designed for Red Hat Enterprise Linux 8 virtual machines and VMWare guests based on the
throughput-performanceprofile that, among other tasks, decreases virtual memory swappiness and increases disk readahead values. It does not disable disk barriers.It inherits the
throughput-performanceprofile and changes theenergy_performance_preferenceandscaling_governorattribute to theperformanceprofile.virtual-hostA profile designed for virtual hosts based on the
throughput-performanceprofile that, among other tasks, decreases virtual memory swappiness, increases disk readahead values, and enables a more aggressive value of dirty pages writeback.It inherits the
throughput-performanceprofile and changes theenergy_performance_preferenceandscaling_governorattribute to theperformanceprofile.oracle-
A profile optimized for Oracle databases loads based on
throughput-performanceprofile. It additionally disables transparent huge pages and modifies other performance-related kernel parameters. This profile is provided by thetuned-profiles-oraclepackage. desktop-
A profile optimized for desktops, based on the
balancedprofile. It additionally enables scheduler autogroups for better response of interactive applications. optimize-serial-consoleA profile that tunes down I/O activity to the serial console by reducing the printk value. This should make the serial console more responsive. This profile is intended to be used as an overlay on other profiles. For example:
# tuned-adm profile throughput-performance optimize-serial-console
mssql-
A profile provided for Microsoft SQL Server. It is based on the
throughput-performanceprofile. intel-sstA profile optimized for systems with user-defined Intel Speed Select Technology configurations. This profile is intended to be used as an overlay on other profiles. For example:
# tuned-adm profile cpu-partitioning intel-sst
2.7. TuneD cpu-partitioning profile
For tuning Red Hat Enterprise Linux 8 for latency-sensitive workloads, Red Hat recommends to use the cpu-partitioning TuneD profile.
Prior to Red Hat Enterprise Linux 8, the low-latency Red Hat documentation described the numerous low-level steps needed to achieve low-latency tuning. In Red Hat Enterprise Linux 8, you can perform low-latency tuning more efficiently by using the cpu-partitioning TuneD profile. This profile is easily customizable according to the requirements for individual low-latency applications.
The following figure is an example to demonstrate how to use the cpu-partitioning profile. This example uses the CPU and node layout.
Figure 2.1. Figure cpu-partitioning
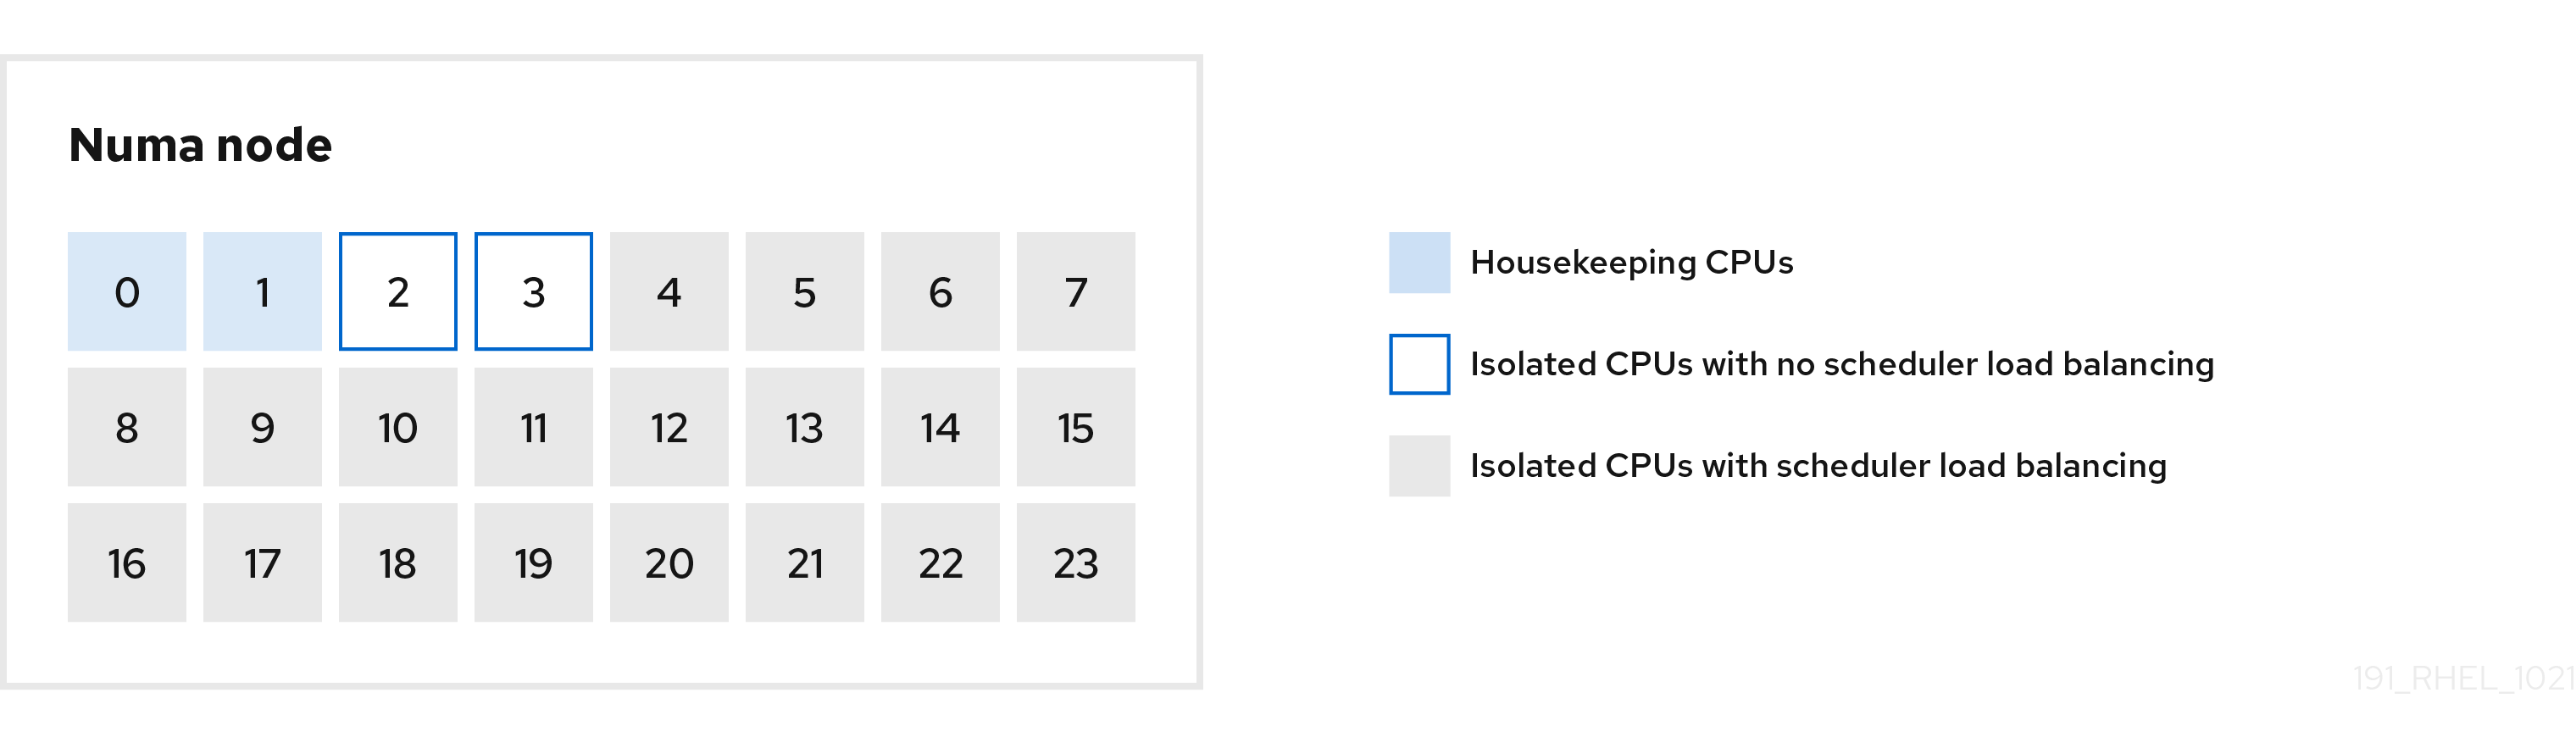
You can configure the cpu-partitioning profile in the /etc/tuned/cpu-partitioning-variables.conf file using the following configuration options:
- Isolated CPUs with load balancing
In the cpu-partitioning figure, the blocks numbered from 4 to 23, are the default isolated CPUs. The kernel scheduler’s process load balancing is enabled on these CPUs. It is designed for low-latency processes with multiple threads that need the kernel scheduler load balancing.
You can configure the cpu-partitioning profile in the
/etc/tuned/cpu-partitioning-variables.conffile using theisolated_cores=cpu-listoption, which lists CPUs to isolate that will use the kernel scheduler load balancing.The list of isolated CPUs is comma-separated or you can specify a range using a dash, such as
3-5. This option is mandatory. Any CPU missing from this list is automatically considered a housekeeping CPU.- Isolated CPUs without load balancing
In the cpu-partitioning figure, the blocks numbered 2 and 3, are the isolated CPUs that do not provide any additional kernel scheduler process load balancing.
You can configure the cpu-partitioning profile in the
/etc/tuned/cpu-partitioning-variables.conffile using theno_balance_cores=cpu-listoption, which lists CPUs to isolate that will not use the kernel scheduler load balancing.Specifying the
no_balance_coresoption is optional, however any CPUs in this list must be a subset of the CPUs listed in theisolated_coreslist.Application threads using these CPUs need to be pinned individually to each CPU.
- Housekeeping CPUs
-
Any CPU not isolated in the
cpu-partitioning-variables.conffile is automatically considered a housekeeping CPU. On the housekeeping CPUs, all services, daemons, user processes, movable kernel threads, interrupt handlers, and kernel timers are permitted to execute.
Additional resources
-
tuned-profiles-cpu-partitioning(7)man page
2.8. Using the TuneD cpu-partitioning profile for low-latency tuning
This procedure describes how to tune a system for low-latency using the TuneD’s cpu-partitioning profile. It uses the example of a low-latency application that can use cpu-partitioning and the CPU layout as mentioned in the cpu-partitioning figure.
The application in this case uses:
- One dedicated reader thread that reads data from the network will be pinned to CPU 2.
- A large number of threads that process this network data will be pinned to CPUs 4-23.
- A dedicated writer thread that writes the processed data to the network will be pinned to CPU 3.
Prerequisites
-
You have installed the
cpu-partitioningTuneD profile by using theyum install tuned-profiles-cpu-partitioningcommand as root.
Procedure
Edit
/etc/tuned/cpu-partitioning-variables.conffile and add the following information:# All isolated CPUs: isolated_cores=2-23 # Isolated CPUs without the kernel’s scheduler load balancing: no_balance_cores=2,3
Set the
cpu-partitioningTuneD profile:# tuned-adm profile cpu-partitioning
Reboot
After rebooting, the system is tuned for low-latency, according to the isolation in the cpu-partitioning figure. The application can use taskset to pin the reader and writer threads to CPUs 2 and 3, and the remaining application threads on CPUs 4-23.
Additional resources
-
tuned-profiles-cpu-partitioning(7)man page
2.9. Customizing the cpu-partitioning TuneD profile
You can extend the TuneD profile to make additional tuning changes.
For example, the cpu-partitioning profile sets the CPUs to use cstate=1. In order to use the cpu-partitioning profile but to additionally change the CPU cstate from cstate1 to cstate0, the following procedure describes a new TuneD profile named my_profile, which inherits the cpu-partitioning profile and then sets C state-0.
Procedure
Create the
/etc/tuned/my_profiledirectory:# mkdir /etc/tuned/my_profileCreate a
tuned.conffile in this directory, and add the following content:# vi /etc/tuned/my_profile/tuned.conf [main] summary=Customized tuning on top of cpu-partitioning include=cpu-partitioning [cpu] force_latency=cstate.id:0|1Use the new profile:
# tuned-adm profile my_profile
In the shared example, a reboot is not required. However, if the changes in the my_profile profile require a reboot to take effect, then reboot your machine.
Additional resources
-
tuned-profiles-cpu-partitioning(7)man page
2.10. Real-time TuneD profiles distributed with RHEL
Real-time profiles are intended for systems running the real-time kernel. Without a special kernel build, they do not configure the system to be real-time. On RHEL, the profiles are available from additional repositories.
The following real-time profiles are available:
realtimeUse on bare-metal real-time systems.
Provided by the
tuned-profiles-realtimepackage, which is available from the RT or NFV repositories.realtime-virtual-hostUse in a virtualization host configured for real-time.
Provided by the
tuned-profiles-nfv-hostpackage, which is available from the NFV repository.realtime-virtual-guestUse in a virtualization guest configured for real-time.
Provided by the
tuned-profiles-nfv-guestpackage, which is available from the NFV repository.
2.11. Static and dynamic tuning in TuneD
Understanding the difference between the two categories of system tuning that TuneD applies, static and dynamic, is important when determining which one to use for a given situation or purpose.
- Static tuning
-
Mainly consists of the application of predefined
sysctlandsysfssettings and one-shot activation of several configuration tools such asethtool. - Dynamic tuning
Watches how various system components are used throughout the uptime of your system. TuneD adjusts system settings dynamically based on that monitoring information.
For example, the hard drive is used heavily during startup and login, but is barely used later when the user might mainly work with applications such as web browsers or email clients. Similarly, the CPU and network devices are used differently at different times. TuneD monitors the activity of these components and reacts to the changes in their use.
By default, dynamic tuning is disabled. To enable it, edit the
/etc/tuned/tuned-main.conffile and change thedynamic_tuningoption to1. TuneD then periodically analyzes system statistics and uses them to update your system tuning settings. To configure the time interval in seconds between these updates, use theupdate_intervaloption.Currently implemented dynamic tuning algorithms try to balance the performance and powersave, and are therefore disabled in the performance profiles. Dynamic tuning for individual plug-ins can be enabled or disabled in the TuneD profiles.
Example 2.2. Static and dynamic tuning on a workstation
On a typical office workstation, the Ethernet network interface is inactive most of the time. Only a few emails go in and out or some web pages might be loaded.
For those kinds of loads, the network interface does not have to run at full speed all the time, as it does by default. TuneD has a monitoring and tuning plug-in for network devices that can detect this low activity and then automatically lower the speed of that interface, typically resulting in a lower power usage.
If the activity on the interface increases for a longer period of time, for example because a DVD image is being downloaded or an email with a large attachment is opened, TuneD detects this and sets the interface speed to maximum to offer the best performance while the activity level is high.
This principle is used for other plug-ins for CPU and disks as well.
2.12. TuneD no-daemon mode
You can run TuneD in no-daemon mode, which does not require any resident memory. In this mode, TuneD applies the settings and exits.
By default, no-daemon mode is disabled because a lot of TuneD functionality is missing in this mode, including:
- D-Bus support
- Hot-plug support
- Rollback support for settings
To enable no-daemon mode, include the following line in the /etc/tuned/tuned-main.conf file:
daemon = 0
2.13. Installing and enabling TuneD
This procedure installs and enables the TuneD application, installs TuneD profiles, and presets a default TuneD profile for your system.
Procedure
Install the
TuneDpackage:# yum install tuned
Enable and start the
TuneDservice:# systemctl enable --now tuned
Optionally, install TuneD profiles for real-time systems:
For the TuneD profiles for real-time systems enable
rhel-8repository.# subscription-manager repos --enable=rhel-8-for-x86_64-nfv-beta-rpms
Install it.
# yum install tuned-profiles-realtime tuned-profiles-nfv
Verify that a TuneD profile is active and applied:
$ tuned-adm active Current active profile: throughput-performanceNoteThe active profile TuneD automatically presets differs based on your machine type and system settings.
$ tuned-adm verify

Verification succeeded, current system settings match the preset profile.
See tuned log file ('/var/log/tuned/tuned.log') for details.
2.14. Listing available TuneD profiles
This procedure lists all TuneD profiles that are currently available on your system.
Procedure
To list all available TuneD profiles on your system, use:
$ tuned-adm list

Available profiles:
- accelerator-performance - Throughput performance based tuning with disabled higher latency STOP states
- balanced                - General non-specialized TuneD profile
- desktop                 - Optimize for the desktop use-case
- latency-performance     - Optimize for deterministic performance at the cost of increased power consumption
- network-latency         - Optimize for deterministic performance at the cost of increased power consumption, focused on low latency network performance
- network-throughput      - Optimize for streaming network throughput, generally only necessary on older CPUs or 40G+ networks
- powersave               - Optimize for low power consumption
- throughput-performance  - Broadly applicable tuning that provides excellent performance across a variety of common server workloads
- virtual-guest           - Optimize for running inside a virtual guest
- virtual-host            - Optimize for running KVM guests
Current active profile: balanced
To display only the currently active profile, use:
$ tuned-adm active

Current active profile: throughput-performance
Additional resources
-
tuned-adm(8)man page.
2.15. Setting a TuneD profile
This procedure activates a selected TuneD profile on your system.
Prerequisites
-
The
TuneDservice is running. See Installing and Enabling TuneD for details.
Procedure
Optionally, you can let TuneD recommend the most suitable profile for your system:
# tuned-adm recommend

throughput-performance
Activate a profile:
# tuned-adm profile selected-profileAlternatively, you can activate a combination of multiple profiles:
# tuned-adm profile selected-profile1 selected-profile2
Example 2.3. A virtual machine optimized for low power consumption
The following example optimizes the system to run in a virtual machine with the best performance and concurrently tunes it for low power consumption, while the low power consumption is the priority:
# tuned-adm profile virtual-guest powersave
View the current active TuneD profile on your system:
# tuned-adm active

Current active profile: selected-profile
Reboot the system:
# reboot
Verification steps
Verify that the TuneD profile is active and applied:
$ tuned-adm verify

Verification succeeded, current system settings match the preset profile.
See tuned log file ('/var/log/tuned/tuned.log') for details.
Additional resources
-
tuned-adm(8)man page
2.16. Using the TuneD D-Bus interface
You can directly communicate with TuneD at runtime through the TuneD D-Bus interface to control a variety of TuneD services.
You can use the busctl or dbus-send commands to access the D-Bus API.
Although you can use either the busctl or dbus-send command, the busctl command is a part of systemd and, therefore, present on most hosts already.
2.16.1. Using the TuneD D-Bus interface to show available TuneD D-Bus API methods
You can see the D-Bus API methods available to use with TuneD by using the TuneD D-Bus interface.
Prerequisites
- The TuneD service is running. See Installing and Enabling TuneD for details.
Procedure
To see the available TuneD API methods, run:
$ busctl introspect com.redhat.tuned /Tuned com.redhat.tuned.control
The output should look similar to the following:
NAME                       	TYPE  	SIGNATURE RESULT/VALUE FLAGS
.active_profile            	method	-     	  s            -
.auto_profile              	method	-     	  (bs)         -
.disable                   	method	-      	  b            -
.get_all_plugins           	method	-     	  a{sa{ss}}    -
.get_plugin_documentation  	method	s     	  s            -
.get_plugin_hints          	method	s     	  a{ss}        -
.instance_acquire_devices  	method	ss    	  (bs)         -
.is_running                	method	-     	  b            -
.log_capture_finish        	method	s     	  s            -
.log_capture_start         	method	ii    	  s            -
.post_loaded_profile       	method	-     	  s            -
.profile_info              	method	s     	  (bsss)       -
.profile_mode              	method	-     	  (ss)         -
.profiles                  	method	-     	  as           -
.profiles2                 	method	-     	  a(ss)        -
.recommend_profile         	method	-     	  s            -
.register_socket_signal_path    method	s     	  b            -
.reload                    	method	-     	  b            -
.start                     	method	-     	  b            -
.stop                      	method	-     	  b            -
.switch_profile            	method	s     	  (bs)         -
.verify_profile            	method	-     	  b            -
.verify_profile_ignore_missing  method	-     	  b            -
.profile_changed           	signal	sbs   	  -            -
You can find descriptions of the different available methods in the TuneD upstream repository.
2.16.2. Using the TuneD D-Bus interface to change the active TuneD profile
You can replace the active TuneD profile with your desired TuneD profile by using the TuneD D-Bus interface.
Prerequisites
- The TuneD service is running. See Installing and Enabling TuneD for details.
Procedure
To change the active TuneD profile, run:
$ busctl call com.redhat.tuned /Tuned com.redhat.tuned.control switch_profile s profile
(bs) true "OK"
Replace profile with the name of your desired profile.
Verification
To view the current active TuneD profile, run:
$ busctl call com.redhat.tuned /Tuned com.redhat.tuned.control active_profile
s "profile"
2.17. Disabling TuneD
This procedure disables TuneD and resets all affected system settings to their original state before TuneD modified them.
Procedure
To disable all tunings temporarily:
# tuned-adm off
The tunings are applied again after the
TuneDservice restarts.Alternatively, to stop and disable the
TuneDservice permanently:# systemctl disable --now tuned
Additional resources
-
tuned-adm(8)man page
Chapter 3. Customizing TuneD profiles
You can create or modify TuneD profiles to optimize system performance for your intended use case.
Prerequisites
- Install and enable TuneD as described in Installing and Enabling TuneD for details.
3.1. TuneD profiles
A detailed analysis of a system can be very time-consuming. TuneD provides a number of predefined profiles for typical use cases. You can also create, modify, and delete profiles.
The profiles provided with TuneD are divided into the following categories:
- Power-saving profiles
- Performance-boosting profiles
The performance-boosting profiles include profiles that focus on the following aspects:
- Low latency for storage and network
- High throughput for storage and network
- Virtual machine performance
- Virtualization host performance
Syntax of profile configuration
The tuned.conf file can contain one [main] section and other sections for configuring plug-in instances. However, all sections are optional.
Lines starting with the hash sign (#) are comments.
Additional resources
-
tuned.conf(5)man page.
3.2. The default TuneD profile
During the installation, the best profile for your system is selected automatically. Currently, the default profile is selected according to the following customizable rules:
| Environment | Default profile | Goal |
|---|---|---|
| Compute nodes |
| The best throughput performance |
| Virtual machines |
|
The best performance. If you are not interested in the best performance, you can change it to the |
| Other cases |
| Balanced performance and power consumption |
Additional resources
-
tuned.conf(5)man page.
3.3. Merged TuneD profiles
As an experimental feature, it is possible to select more profiles at once. TuneD will try to merge them during the load.
If there are conflicts, the settings from the last specified profile takes precedence.
Example 3.1. Low power consumption in a virtual guest
The following example optimizes the system to run in a virtual machine for the best performance and concurrently tunes it for low power consumption, while the low power consumption is the priority:
# tuned-adm profile virtual-guest powersave
Merging is done automatically without checking whether the resulting combination of parameters makes sense. Consequently, the feature might tune some parameters the opposite way, which might be counterproductive: for example, setting the disk for high throughput by using the throughput-performance profile and concurrently setting the disk spindown to the low value by the spindown-disk profile.
Additional resources
*tuned-adm man page. * tuned.conf(5) man page.
3.4. The location of TuneD profiles
TuneD stores profiles in the following directories:
/usr/lib/tuned/-
Distribution-specific profiles are stored in the directory. Each profile has its own directory. The profile consists of the main configuration file called
tuned.conf, and optionally other files, for example helper scripts. /etc/tuned/-
If you need to customize a profile, copy the profile directory into the directory, which is used for custom profiles. If there are two profiles of the same name, the custom profile located in
/etc/tuned/is used.
Additional resources
-
tuned.conf(5)man page.
3.5. Inheritance between TuneD profiles
TuneD profiles can be based on other profiles and modify only certain aspects of their parent profile.
The [main] section of TuneD profiles recognizes the include option:
[main]
include=parent
All settings from the parent profile are loaded in this child profile. In the following sections, the child profile can override certain settings inherited from the parent profile or add new settings not present in the parent profile.
You can create your own child profile in the /etc/tuned/ directory based on a pre-installed profile in /usr/lib/tuned/ with only some parameters adjusted.
If the parent profile is updated, such as after a TuneD upgrade, the changes are reflected in the child profile.
Example 3.2. A power-saving profile based on balanced
The following is an example of a custom profile that extends the balanced profile and sets Aggressive Link Power Management (ALPM) for all devices to the maximum powersaving.
[main]
include=balanced

[scsi_host]
alpm=min_power
Additional resources
-
tuned.conf(5)man page
3.6. Static and dynamic tuning in TuneD
Understanding the difference between the two categories of system tuning that TuneD applies, static and dynamic, is important when determining which one to use for a given situation or purpose.
- Static tuning
-
Mainly consists of the application of predefined
sysctlandsysfssettings and one-shot activation of several configuration tools such asethtool. - Dynamic tuning
Watches how various system components are used throughout the uptime of your system. TuneD adjusts system settings dynamically based on that monitoring information.
For example, the hard drive is used heavily during startup and login, but is barely used later when the user might mainly work with applications such as web browsers or email clients. Similarly, the CPU and network devices are used differently at different times. TuneD monitors the activity of these components and reacts to the changes in their use.
By default, dynamic tuning is disabled. To enable it, edit the
/etc/tuned/tuned-main.conffile and change thedynamic_tuningoption to1. TuneD then periodically analyzes system statistics and uses them to update your system tuning settings. To configure the time interval in seconds between these updates, use theupdate_intervaloption.Currently implemented dynamic tuning algorithms try to balance the performance and powersave, and are therefore disabled in the performance profiles. Dynamic tuning for individual plug-ins can be enabled or disabled in the TuneD profiles.
Example 3.3. Static and dynamic tuning on a workstation
On a typical office workstation, the Ethernet network interface is inactive most of the time. Only a few emails go in and out or some web pages might be loaded.
For those kinds of loads, the network interface does not have to run at full speed all the time, as it does by default. TuneD has a monitoring and tuning plug-in for network devices that can detect this low activity and then automatically lower the speed of that interface, typically resulting in a lower power usage.
If the activity on the interface increases for a longer period of time, for example because a DVD image is being downloaded or an email with a large attachment is opened, TuneD detects this and sets the interface speed to maximum to offer the best performance while the activity level is high.
This principle is used for other plug-ins for CPU and disks as well.
3.7. TuneD plug-ins
Plug-ins are modules in TuneD profiles that TuneD uses to monitor or optimize different devices on the system.
TuneD uses two types of plug-ins:
- Monitoring plug-ins
Monitoring plug-ins are used to get information from a running system. The output of the monitoring plug-ins can be used by tuning plug-ins for dynamic tuning.
Monitoring plug-ins are automatically instantiated whenever their metrics are needed by any of the enabled tuning plug-ins. If two tuning plug-ins require the same data, only one instance of the monitoring plug-in is created and the data is shared.
- Tuning plug-ins
- Each tuning plug-in tunes an individual subsystem and takes several parameters that are populated from the TuneD profiles. Each subsystem can have multiple devices, such as multiple CPUs or network cards, that are handled by individual instances of the tuning plug-ins. Specific settings for individual devices are also supported.
Syntax for plug-ins in TuneD profiles
Sections describing plug-in instances are formatted in the following way:
[NAME]
type=TYPE
devices=DEVICES
- NAME
- is the name of the plug-in instance as it is used in the logs. It can be an arbitrary string.
- TYPE
- is the type of the tuning plug-in.
- DEVICES
is the list of devices that this plug-in instance handles.
The
devicesline can contain a list, a wildcard (*), and negation (!). If there is nodevicesline, all devices present or later attached on the system of the TYPE are handled by the plug-in instance. This is same as using thedevices=*option.Example 3.4. Matching block devices with a plug-in
The following example matches all block devices starting with
sd, such assdaorsdb, and does not disable barriers on them:[data_disk] type=disk devices=sd* disable_barriers=false
The following example matches all block devices except
sda1andsda2:[data_disk] type=disk devices=!sda1, !sda2 disable_barriers=false
If no instance of a plug-in is specified, the plug-in is not enabled.
If the plug-in supports more options, they can be also specified in the plug-in section. If the option is not specified and it was not previously specified in the included plug-in, the default value is used.
Short plug-in syntax
If you do not need custom names for the plug-in instance and there is only one definition of the instance in your configuration file, TuneD supports the following short syntax:
[TYPE]
devices=DEVICES
In this case, it is possible to omit the type line. The instance is then referred to with a name, same as the type. The previous example could be then rewritten into:
Example 3.5. Matching block devices using the short syntax
[disk]
devices=sdb*
disable_barriers=false
Conflicting plug-in definitions in a profile
If the same section is specified more than once using the include option, the settings are merged. If they cannot be merged due to a conflict, the last conflicting definition overrides the previous settings. If you do not know what was previously defined, you can use the replace Boolean option and set it to true. This causes all the previous definitions with the same name to be overwritten and the merge does not happen.
You can also disable the plug-in by specifying the enabled=false option. This has the same effect as if the instance was never defined. Disabling the plug-in is useful if you are redefining the previous definition from the include option and do not want the plug-in to be active in your custom profile.
- NOTE
TuneD includes the ability to run any shell command as part of enabling or disabling a tuning profile. This enables you to extend TuneD profiles with functionality that has not been integrated into TuneD yet.
You can specify arbitrary shell commands using the
scriptplug-in.
Additional resources
-
tuned.conf(5)man page
3.8. Available TuneD plug-ins
Monitoring plug-ins
Currently, the following monitoring plug-ins are implemented:
disk- Gets disk load (number of IO operations) per device and measurement interval.
net- Gets network load (number of transferred packets) per network card and measurement interval.
load- Gets CPU load per CPU and measurement interval.
Tuning plug-ins
Currently, the following tuning plug-ins are implemented. Only some of these plug-ins implement dynamic tuning. Options supported by plug-ins are also listed:
cpuSets the CPU governor to the value specified by the
governoroption and dynamically changes the Power Management Quality of Service (PM QoS) CPU Direct Memory Access (DMA) latency according to the CPU load.If the CPU load is lower than the value specified by the
load_thresholdoption, the latency is set to the value specified by thelatency_highoption, otherwise it is set to the value specified bylatency_low.You can also force the latency to a specific value and prevent it from dynamically changing further. To do so, set the
force_latencyoption to the required latency value.eeepc_sheDynamically sets the front-side bus (FSB) speed according to the CPU load.
This feature can be found on some netbooks and is also known as the ASUS Super Hybrid Engine (SHE).
If the CPU load is lower or equal to the value specified by the
load_threshold_powersaveoption, the plug-in sets the FSB speed to the value specified by theshe_powersaveoption. If the CPU load is higher or equal to the value specified by theload_threshold_normaloption, it sets the FSB speed to the value specified by theshe_normaloption.Static tuning is not supported and the plug-in is transparently disabled if TuneD does not detect the hardware support for this feature.
net-
Configures the Wake-on-LAN functionality to the values specified by the
wake_on_lanoption. It uses the same syntax as theethtoolutility. It also dynamically changes the interface speed according to the interface utilization. sysctlSets various
sysctlsettings specified by the plug-in options.The syntax is
name=value, where name is the same as the name provided by thesysctlutility.Use the
sysctlplug-in if you need to change system settings that are not covered by other plug-ins available in TuneD. If the settings are covered by some specific plug-ins, prefer these plug-ins.usbSets autosuspend timeout of USB devices to the value specified by the
autosuspendparameter.The value
0means that autosuspend is disabled.vmEnables or disables transparent huge pages depending on the value of the
transparent_hugepagesoption.Valid values of the
transparent_hugepagesoption are:- "always"
- "never"
- "madvise"
audioSets the autosuspend timeout for audio codecs to the value specified by the
timeoutoption.Currently, the
snd_hda_intelandsnd_ac97_codeccodecs are supported. The value0means that the autosuspend is disabled. You can also enforce the controller reset by setting the Boolean optionreset_controllertotrue.diskSets the disk elevator to the value specified by the
elevatoroption.It also sets:
-
APM to the value specified by the
apmoption -
Scheduler quantum to the value specified by the
scheduler_quantumoption -
Disk spindown timeout to the value specified by the
spindownoption -
Disk readahead to the value specified by the
readaheadparameter -
The current disk readahead to a value multiplied by the constant specified by the
readahead_multiplyoption
In addition, this plug-in dynamically changes the advanced power management and spindown timeout setting for the drive according to the current drive utilization. The dynamic tuning can be controlled by the Boolean option
dynamicand is enabled by default.-
APM to the value specified by the
scsi_hostTunes options for SCSI hosts.
It sets Aggressive Link Power Management (ALPM) to the value specified by the
alpmoption.mounts-
Enables or disables barriers for mounts according to the Boolean value of the
disable_barriersoption. scriptExecutes an external script or binary when the profile is loaded or unloaded. You can choose an arbitrary executable.
ImportantThe
scriptplug-in is provided mainly for compatibility with earlier releases. Prefer other TuneD plug-ins if they cover the required functionality.TuneD calls the executable with one of the following arguments:
-
startwhen loading the profile -
stopwhen unloading the profile
You need to correctly implement the
stopaction in your executable and revert all settings that you changed during thestartaction. Otherwise, the roll-back step after changing your TuneD profile will not work.Bash scripts can import the
/usr/lib/tuned/functionsBash library and use the functions defined there. Use these functions only for functionality that is not natively provided by TuneD. If a function name starts with an underscore, such as_wifi_set_power_level, consider the function private and do not use it in your scripts, because it might change in the future.Specify the path to the executable using the
scriptparameter in the plug-in configuration.Example 3.6. Running a Bash script from a profile
To run a Bash script named
script.shthat is located in the profile directory, use:[script] script=${i:PROFILE_DIR}/script.sh-
sysfsSets various
sysfssettings specified by the plug-in options.The syntax is
name=value, where name is thesysfspath to use.Use this plugin in case you need to change some settings that are not covered by other plug-ins. Prefer specific plug-ins if they cover the required settings.
videoSets various powersave levels on video cards. Currently, only the Radeon cards are supported.
The powersave level can be specified by using the
radeon_powersaveoption. Supported values are:-
default -
auto -
low -
mid -
high -
dynpm -
dpm-battery -
dpm-balanced -
dpm-perfomance
For details, see www.x.org. Note that this plug-in is experimental and the option might change in future releases.
-
bootloaderAdds options to the kernel command line. This plug-in supports only the GRUB 2 boot loader.
Customized non-standard location of the GRUB 2 configuration file can be specified by the
grub2_cfg_fileoption.The kernel options are added to the current GRUB configuration and its templates. The system needs to be rebooted for the kernel options to take effect.
Switching to another profile or manually stopping the
TuneDservice removes the additional options. If you shut down or reboot the system, the kernel options persist in thegrub.cfgfile.The kernel options can be specified by the following syntax:
cmdline=arg1 arg2 ... argN
Example 3.7. Modifying the kernel command line
For example, to add the
quietkernel option to a TuneD profile, include the following lines in thetuned.conffile:[bootloader] cmdline=quiet
The following is an example of a custom profile that adds the
isolcpus=2option to the kernel command line:[bootloader] cmdline=isolcpus=2
serviceHandles various
sysvinit,sysv-rc,openrc, andsystemdservices specified by the plug-in options.The syntax is
service.service_name=command[,file:file].Supported service-handling commands are:
-
start -
stop -
enable -
disable
Separate multiple commands using either a comma (
,) or a semicolon (;). If the directives conflict, theserviceplugin uses the last listed one.Use the optional
file:filedirective to install an overlay configuration file,file, forsystemdonly. Other init systems ignore this directive. Theserviceplugin copies overlay configuration files to/etc/systemd/system/service_name.service.d/directories. Once profiles are unloaded, theserviceplugin removes these directories if they are empty.NoteThe
serviceplugin only operates on the current runlevel with non-systemdinit systems.Example 3.8. Starting and enabling the sendmail
sendmailservice with an overlay file[service] service.sendmail=start,enable,file:${i:PROFILE_DIR}/tuned-sendmail.confThe internal variable
${i:PROFILE_DIR}points to the directory the plugin loads the profile from.-
scheduler- Offers a variety of options for the tuning of scheduling priorities, CPU core isolation, and process, thread, and IRQ affinities.
For specifics of the different options available, see Functionalities of the scheduler TuneD plug-in.
3.9. Functionalities of the scheduler TuneD plugin
Use the scheduler TuneD plugin to control and tune scheduling priorities, CPU core isolation, and process, thread, and IRQ afinities.
CPU isolation
To prevent processes, threads, and IRQs from using certain CPUs, use the isolated_cores option. It changes process and thread affinities, IRQ affinities, and sets the default_smp_affinity parameter for IRQs.
The CPU affinity mask is adjusted for all processes and threads matching the ps_whitelist option, subject to success of the sched_setaffinity() system call. The default setting of the ps_whitelist regular expression is .* to match all processes and thread names. To exclude certain processes and threads, use the ps_blacklist option. The value of this option is also interpreted as a regular expression. Process and thread names are matched against that expression. Profile rollback enables all matching processes and threads to run on all CPUs, and restores the IRQ settings prior to the profile application.
Multiple regular expressions separated by ; for the ps_whitelist and ps_blacklist options are supported. Escaped semicolon \; is taken literally.
Example 3.9. Isolate CPUs 2-4
The following configuration isolates CPUs 2-4. Processes and threads that match the ps_blacklist regular expression can use any CPUs regardless of the isolation:
[scheduler]
isolated_cores=2-4
ps_blacklist=.*pmd.*;.*PMD.*;^DPDK;.*qemu-kvm.*
IRQ SMP affinity
The /proc/irq/default_smp_affinity file contains a bitmask representing the default target CPU cores on a system for all inactive interrupt request (IRQ) sources. Once an IRQ is activated or allocated, the value in the /proc/irq/default_smp_affinity file determines the IRQ’s affinity bitmask.
The default_irq_smp_affinity parameter controls what TuneD writes to the /proc/irq/default_smp_affinity file. The default_irq_smp_affinity parameter supports the following values and behaviors:
calcCalculates the content of the
/proc/irq/default_smp_affinityfile from theisolated_coresparameter. An inversion of theisolated_coresparameter calculates the non-isolated cores.The intersection of the non-isolated cores and the previous content of the
/proc/irq/default_smp_affinityfile is then written to the/proc/irq/default_smp_affinityfile.This is the default behavior if the
default_irq_smp_affinityparameter is omitted.ignore-
TuneD does not modify the
/proc/irq/default_smp_affinityfile. - A CPU list
Takes the form of a single number such as
1, a comma separated list such as1,3, or a range such as3-5.Unpacks the CPU list and writes it directly to the
/proc/irq/default_smp_affinityfile.
Example 3.10. Setting the default IRQ smp affinity using an explicit CPU list
The following example uses an explicit CPU list to set the default IRQ SMP affinity to CPUs 0 and 2:
[scheduler]
isolated_cores=1,3
default_irq_smp_affinity=0,2
Scheduling policy
To adjust scheduling policy, priority and affinity for a group of processes or threads, use the following syntax:
group.groupname=rule_prio:sched:prio:affinity:regex
where rule_prio defines internal TuneD priority of the rule. Rules are sorted based on priority. This is needed for inheritance to be able to reorder previously defined rules. Equal rule_prio rules should be processed in the order they were defined. However, this is Python interpreter dependent. To disable an inherited rule for groupname, use:
group.groupname=
sched must be one of the following:
f- for first in, first out (FIFO)
b- for batch
r- for round robin
o- for other
*- for do not change
affinity is CPU affinity in hexadecimal. Use * for no change.
prio is scheduling priority (see chrt -m).
regex is Python regular expression. It is matched against the output of the ps -eo cmd command.
Any given process name can match more than one group. In such cases, the last matching regex determines the priority and scheduling policy.
Example 3.11. Setting scheduling policies and priorities
The following example sets the scheduling policy and priorities to kernel threads and watchdog:
[scheduler]
group.kthreads=0:*:1:*:\[.*\]$
group.watchdog=0:f:99:*:\[watchdog.*\]
The scheduler plugin uses a perf event loop to identify newly created processes. By default, it listens to perf.RECORD_COMM and perf.RECORD_EXIT events.
Setting the perf_process_fork parameter to true tells the plug-in to also listen to perf.RECORD_FORK events, meaning that child processes created by the fork() system call are processed.
Processing perf events can pose a significant CPU overhead.
The CPU overhead of the scheduler plugin can be mitigated by using the scheduler runtime option and setting it to 0. This completely disables the dynamic scheduler functionality and the perf events are not monitored and acted upon. The disadvantage of this is that the process and thread tuning will be done only at profile application.
Example 3.12. Disabling the dynamic scheduler functionality
The following example disables the dynamic scheduler functionality while also isolating CPUs 1 and 3:
[scheduler]
runtime=0
isolated_cores=1,3
The mmapped buffer is used for perf events. Under heavy loads, this buffer might overflow and as a result the plugin might start missing events and not processing some newly created processes. In such cases, use the perf_mmap_pages parameter to increase the buffer size. The value of the perf_mmap_pages parameter must be a power of 2. If the perf_mmap_pages parameter is not manually set, a default value of 128 is used.
Confinement using cgroups
The scheduler plugin supports process and thread confinement using cgroups v1.
The cgroup_mount_point option specifies the path to mount the cgroup file system, or, where TuneD expects it to be mounted. If it is unset, /sys/fs/cgroup/cpuset is expected.
If the cgroup_groups_init option is set to 1, TuneD creates and removes all cgroups defined with the cgroup* options. This is the default behavior. If the cgroup_mount_point option is set to 0, the cgroups must be preset by other means.
If the cgroup_mount_point_init option is set to 1, TuneD creates and removes the cgroup mount point. It implies cgroup_groups_init = 1. If the cgroup_mount_point_init option is set to 0, you must preset the cgroups mount point by other means. This is the default behavior.
The cgroup_for_isolated_cores option is the cgroup name for the isolated_cores option functionality. For example, if a system has 4 CPUs, isolated_cores=1 means that Tuned moves all processes and threads to CPUs 0, 2, and 3. The scheduler plug-in isolates the specified core by writing the calculated CPU affinity to the cpuset.cpus control file of the specified cgroup and moves all the matching processes and threads to this group. If this option is unset, classic cpuset affinity using sched_setaffinity() sets the CPU affinity.
The cgroup.cgroup_name option defines affinities for arbitrary cgroups. You can even use hierarchic cgroups, but you must specify the hierarchy in the correct order. TuneD does not do any sanity checks here, with the exception that it forces the cgroup to be in the location specified by the cgroup_mount_point option.
The syntax of the scheduler option starting with group. has been augmented to use cgroup.cgroup_name instead of the hexadecimal affinity. The matching processes are moved to the cgroup cgroup_name. You can also use cgroups not defined by the cgroup. option as described above. For example, cgroups not managed by TuneD.
All cgroup names are sanitized by replacing all periods (.) with slashes (/). This prevents the plugin from writing outside the location specified by the cgroup_mount_point option.
Example 3.13. Using cgroups v1 with the scheduler plug-in
The following example creates 2 cgroups, group1 and group2. It sets the cgroup group1 affinity to CPU 2 and the cgroup group2 to CPUs 0 and 2. Given a 4 CPU setup, the isolated_cores=1 option moves all processes and threads to CPU cores 0, 2, and 3. Processes and threads specified by the ps_blacklist regular expression are not moved.
[scheduler]
cgroup_mount_point=/sys/fs/cgroup/cpuset
cgroup_mount_point_init=1
cgroup_groups_init=1
cgroup_for_isolated_cores=group
cgroup.group1=2
cgroup.group2=0,2

group.ksoftirqd=0:f:2:cgroup.group1:ksoftirqd.*
ps_blacklist=ksoftirqd.*;rcuc.*;rcub.*;ktimersoftd.*
isolated_cores=1
The cgroup_ps_blacklist option excludes processes belonging to the specified cgroups. The regular expression specified by this option is matched against cgroup hierarchies from /proc/PID/cgroups. Commas (,) separate cgroups v1 hierarchies from /proc/PID/cgroups before regular expression matching. The following is an example of content the regular expression is matched against:
10:hugetlb:/,9:perf_event:/,8:blkio:/
Multiple regular expressions can be separated by semicolons (;). The semicolon represents a logical 'or' operator.
Example 3.14. Excluding processes from the scheduler using cgroups
In the following example, the scheduler plug-in moves all processes away from core 1, except for processes which belong to cgroup /daemons. The \b string is a regular expression metacharacter that matches a word boundary.
[scheduler]
isolated_cores=1
cgroup_ps_blacklist=:/daemons\b
In the following example, the scheduler plugin excludes all processes which belong to a cgroup with a hierarchy-ID of 8 and controller-list blkio.
[scheduler]
isolated_cores=1
cgroup_ps_blacklist=\b8:blkio:
Recent kernels moved some sched_ and numa_balancing_ kernel run-time parameters from the /proc/sys/kernel directory managed by the sysctl utility, to debugfs, typically mounted under the /sys/kernel/debug directory. TuneD provides an abstraction mechanism for the following parameters via the scheduler plugin where, based on the kernel used, TuneD writes the specified value to the correct location:
-
sched_min_granularity_ns -
sched_latency_ns, -
sched_wakeup_granularity_ns -
sched_tunable_scaling, -
sched_migration_cost_ns -
sched_nr_migrate -
numa_balancing_scan_delay_ms -
numa_balancing_scan_period_min_ms -
numa_balancing_scan_period_max_ms numa_balancing_scan_size_mbExample 3.15. Set tasks' "cache hot" value for migration decisions.
On the old kernels, setting the following parameter meant that
sysctlwrote a value of500000to the/proc/sys/kernel/sched_migration_cost_nsfile:[sysctl] kernel.sched_migration_cost_ns=500000
This is, on more recent kernels, equivalent to setting the following parameter via the
schedulerplugin:[scheduler] sched_migration_cost_ns=500000
Meaning TuneD writes a value of
500000to the/sys/kernel/debug/sched/migration_cost_nsfile.
3.10. Variables in TuneD profiles
Variables expand at run time when a TuneD profile is activated.
Using TuneD variables reduces the amount of necessary typing in TuneD profiles.
There are no predefined variables in TuneD profiles. You can define your own variables by creating the [variables] section in a profile and using the following syntax:
[variables]

variable_name=value
To expand the value of a variable in a profile, use the following syntax:
${variable_name}Example 3.16. Isolating CPU cores using variables
In the following example, the ${isolated_cores} variable expands to 1,2; hence the kernel boots with the isolcpus=1,2 option:
[variables]
isolated_cores=1,2

[bootloader]
cmdline=isolcpus=${isolated_cores}
The variables can be specified in a separate file. For example, you can add the following lines to tuned.conf:
[variables]
include=/etc/tuned/my-variables.conf

[bootloader]
cmdline=isolcpus=${isolated_cores}
If you add the isolated_cores=1,2 option to the /etc/tuned/my-variables.conf file, the kernel boots with the isolcpus=1,2 option.
Additional resources
-
tuned.conf(5)man page
3.11. Built-in functions in TuneD profiles
Built-in functions expand at run time when a TuneD profile is activated.
You can:
- Use various built-in functions together with TuneD variables
- Create custom functions in Python and add them to TuneD in the form of plug-ins
To call a function, use the following syntax:
${f:function_name:argument_1:argument_2}
To expand the directory path where the profile and the tuned.conf file are located, use the PROFILE_DIR function, which requires special syntax:
${i:PROFILE_DIR}Example 3.17. Isolating CPU cores using variables and built-in functions
In the following example, the ${non_isolated_cores} variable expands to 0,3-5, and the cpulist_invert built-in function is called with the 0,3-5 argument:
[variables]
non_isolated_cores=0,3-5

[bootloader]
cmdline=isolcpus=${f:cpulist_invert:${non_isolated_cores}}
The cpulist_invert function inverts the list of CPUs. For a 6-CPU machine, the inversion is 1,2, and the kernel boots with the isolcpus=1,2 command-line option.
Additional resources
-
tuned.conf(5)man page
3.12. Built-in functions available in TuneD profiles
The following built-in functions are available in all TuneD profiles:
PROFILE_DIR-
Returns the directory path where the profile and the
tuned.conffile are located. exec- Executes a process and returns its output.
assertion- Compares two arguments. If they do not match, the function logs text from the first argument and aborts profile loading.
assertion_non_equal- Compares two arguments. If they match, the function logs text from the first argument and aborts profile loading.
kb2s- Converts kilobytes to disk sectors.
s2kb- Converts disk sectors to kilobytes.
strip- Creates a string from all passed arguments and deletes both leading and trailing white space.
virt_checkChecks whether TuneD is running inside a virtual machine (VM) or on bare metal:
- Inside a VM, the function returns the first argument.
- On bare metal, the function returns the second argument, even in case of an error.
cpulist_invert-
Inverts a list of CPUs to make its complement. For example, on a system with 4 CPUs, numbered from 0 to 3, the inversion of the list
0,2,3is1. cpulist2hex- Converts a CPU list to a hexadecimal CPU mask.
cpulist2hex_invert- Converts a CPU list to a hexadecimal CPU mask and inverts it.
hex2cpulist- Converts a hexadecimal CPU mask to a CPU list.
cpulist_online- Checks whether the CPUs from the list are online. Returns the list containing only online CPUs.
cpulist_present- Checks whether the CPUs from the list are present. Returns the list containing only present CPUs.
cpulist_unpack-
Unpacks a CPU list in the form of
1-3,4to1,2,3,4. cpulist_pack-
Packs a CPU list in the form of
1,2,3,5to1-3,5.
3.13. Creating new TuneD profiles
This procedure creates a new TuneD profile with custom performance rules.
Prerequisites
-
The
TuneDservice is running. See Installing and Enabling TuneD for details.
Procedure
In the
/etc/tuned/directory, create a new directory named the same as the profile that you want to create:# mkdir /etc/tuned/my-profileIn the new directory, create a file named
tuned.conf. Add a[main]section and plug-in definitions in it, according to your requirements.For example, see the configuration of the
balancedprofile:[main] summary=General non-specialized TuneD profile [cpu] governor=conservative energy_perf_bias=normal [audio] timeout=10 [video] radeon_powersave=dpm-balanced, auto [scsi_host] alpm=medium_power
To activate the profile, use:
# tuned-adm profile my-profileVerify that the TuneD profile is active and the system settings are applied:
$ tuned-adm active

Current active profile: my-profile
$ tuned-adm verify Verification succeeded, current system settings match the preset profile. See tuned log file ('/var/log/tuned/tuned.log') for details.
Additional resources
-
tuned.conf(5)man page
3.14. Modifying existing TuneD profiles
This procedure creates a modified child profile based on an existing TuneD profile.
Prerequisites
-
The
TuneDservice is running. See Installing and Enabling TuneD for details.
Procedure
In the
/etc/tuned/directory, create a new directory named the same as the profile that you want to create:# mkdir /etc/tuned/modified-profileIn the new directory, create a file named
tuned.conf, and set the[main]section as follows:[main] include=parent-profileReplace parent-profile with the name of the profile you are modifying.
Include your profile modifications.
Example 3.18. Lowering swappiness in the throughput-performance profile
To use the settings from the
throughput-performanceprofile and change the value ofvm.swappinessto 5, instead of the default 10, use:[main] include=throughput-performance [sysctl] vm.swappiness=5
To activate the profile, use:
# tuned-adm profile modified-profileVerify that the TuneD profile is active and the system settings are applied:
$ tuned-adm active

Current active profile: my-profile
$ tuned-adm verify Verification succeeded, current system settings match the preset profile. See tuned log file ('/var/log/tuned/tuned.log') for details.
Additional resources
-
tuned.conf(5)man page
3.15. Setting the disk scheduler using TuneD
This procedure creates and enables a TuneD profile that sets a given disk scheduler for selected block devices. The setting persists across system reboots.
In the following commands and configuration, replace:
-
device with the name of the block device, for example
sdf -
selected-scheduler with the disk scheduler that you want to set for the device, for example
bfq
Prerequisites
-
The
TuneDservice is installed and enabled. For details, see Installing and enabling TuneD.
Procedure
Optional: Select an existing TuneD profile on which your profile will be based. For a list of available profiles, see TuneD profiles distributed with RHEL.
To see which profile is currently active, use:
$ tuned-adm active
Create a new directory to hold your TuneD profile:
# mkdir /etc/tuned/my-profileFind the system unique identifier of the selected block device:
$ udevadm info --query=property --name=/dev/device | grep -E '(WWN|SERIAL)'

ID_WWN=0x5002538d00000000_
ID_SERIAL=Generic-_SD_MMC_20120501030900000-0:0
ID_SERIAL_SHORT=20120501030900000
NoteThe command in the this example will return all values identified as a World Wide Name (WWN) or serial number associated with the specified block device. Although it is preferred to use a WWN, the WWN is not always available for a given device and any values returned by the example command are acceptable to use as the device system unique ID.
Create the
/etc/tuned/my-profile/tuned.confconfiguration file. In the file, set the following options:Optional: Include an existing profile:
[main]
include=existing-profile
Set the selected disk scheduler for the device that matches the WWN identifier:
[disk]
devices_udev_regex=IDNAME=device system unique id
elevator=selected-scheduler
Here:
-
Replace IDNAME with the name of the identifier being used (for example,
ID_WWN). Replace device system unique id with the value of the chosen identifier (for example,
0x5002538d00000000).To match multiple devices in the
devices_udev_regexoption, enclose the identifiers in parentheses and separate them with vertical bars:devices_udev_regex=(ID_WWN=0x5002538d00000000)|(ID_WWN=0x1234567800000000)
-
Replace IDNAME with the name of the identifier being used (for example,
Enable your profile:
# tuned-adm profile my-profile
Verification steps
Verify that the TuneD profile is active and applied:
$ tuned-adm active

Current active profile: my-profile
$ tuned-adm verify Verification succeeded, current system settings match the preset profile. See TuneD log file ('/var/log/tuned/tuned.log') for details.Read the contents of the
/sys/block/device/queue/schedulerfile:# cat /sys/block/device/queue/scheduler [mq-deadline] kyber bfq noneIn the file name, replace device with the block device name, for example
sdc.The active scheduler is listed in square brackets (
[]).
Additional resources
Chapter 4. Reviewing a system using tuna interface
Use the tuna tool to adjust scheduler tunables, tune thread priority, IRQ handlers, and isolate CPU cores and sockets. Tuna reduces the complexity of performing tuning tasks.
The tuna tool performs the following operations:
- Lists the CPUs on a system
- Lists the interrupt requests (IRQs) currently running on a system
- Changes policy and priority information about threads
- Displays the current policies and priorities of a system
4.1. Installing the tuna tool
The tuna tool is designed to be used on a running system. This allows application-specific measurement tools to see and analyze system performance immediately after changes have been made.
Procedure
Install the
tunatool:# yum install tuna
Verification steps
Display the available
tunaCLI options:# tuna -h
Additional resources
-
tuna(8)man page
4.2. Viewing the system status using tuna tool
This procedure describes how to view the system status using the tuna command-line interface (CLI) tool.
Prerequisites
- The tuna tool is installed. For more information, see Installing tuna tool.
Procedure
To view the current policies and priorities:
# tuna --show_threads
            thread
pid   SCHED_ rtpri affinity             cmd
1      OTHER     0      0,1            init
2       FIFO    99        0     migration/0
3      OTHER     0        0     ksoftirqd/0
4       FIFO    99        0      watchdog/0
To view a specific thread corresponding to a PID or matching a command name:
# tuna --threads=pid_or_cmd_list --show_threadsThe pid_or_cmd_list argument is a list of comma-separated PIDs or command-name patterns.
-
To tune CPUs using the
tunaCLI, see Tuning CPUs using tuna tool. -
To tune the IRQs using the
tunatool, see Tuning IRQs using tuna tool. To save the changed configuration:
# tuna --save=filename
This command saves only currently running kernel threads. Processes that are not running are not saved.
Additional resources
-
tuna(8)man page
4.3. Tuning CPUs using tuna tool
The tuna tool commands can target individual CPUs.
Using the tuna tool, you can:
Isolate CPUs- All tasks running on the specified CPU move to the next available CPU. Isolating a CPU makes it unavailable by removing it from the affinity mask of all threads.
Include CPUs- Allows tasks to run on the specified CPU
Restore CPUs- Restores the specified CPU to its previous configuration.
This procedure describes how to tune CPUs using the tuna CLI.
Prerequisites
- The tuna tool is installed. For more information, see Installing tuna tool.
Procedure
To specify the list of CPUs to be affected by a command:
# tuna --cpus=cpu_list [command]
The cpu_list argument is a list of comma-separated CPU numbers. For example,
--cpus=0,2. CPU lists can also be specified in a range, for example--cpus=”1-3”, which would select CPUs 1, 2, and 3.To add a specific CPU to the current cpu_list, for example, use
--cpus=+0.Replace [command] with, for example,
--isolate.To isolate a CPU:
# tuna --cpus=cpu_list --isolate
To include a CPU:
# tuna --cpus=cpu_list --include
To use a system with four or more processors, display how to make all the ssh threads run on CPU 0 and 1, and all the
httpthreads on CPU 2 and 3:# tuna --cpus=0,1 --threads=ssh\* \ --move --cpus=2,3 --threads=http\* --move
This command performs the following operations sequentially:
- Selects CPUs 0 and 1.
-
Selects all threads that begin with
ssh. -
Moves the selected threads to the selected CPUs. Tuna sets the affinity mask of threads starting with
sshto the appropriate CPUs. The CPUs can be expressed numerically as 0 and 1, in hex mask as 0x3, or in binary as 11. - Resets the CPU list to 2 and 3.
-
Selects all threads that begin with
http. -
Moves the selected threads to the specified CPUs. Tuna sets the affinity mask of threads starting with
httpto the specified CPUs. The CPUs can be expressed numerically as 2 and 3, in hex mask as 0xC, or in binary as 1100.
Verification steps
Display the current configuration and verify that the changes were performed as expected:
# tuna --threads=gnome-sc\* --show_threads \
--cpus=0 --move --show_threads --cpus=1 \
--move --show_threads --cpus=+0 --move --show_threads

                       thread       ctxt_switches
     pid SCHED_ rtpri affinity voluntary nonvoluntary             cmd
   3861   OTHER     0      0,1     33997           58 gnome-screensav
                       thread       ctxt_switches
     pid SCHED_ rtpri affinity voluntary nonvoluntary             cmd
   3861   OTHER     0        0     33997           58 gnome-screensav
                       thread       ctxt_switches
     pid SCHED_ rtpri affinity voluntary nonvoluntary             cmd
   3861   OTHER     0        1     33997           58 gnome-screensav
                       thread       ctxt_switches
     pid SCHED_ rtpri affinity voluntary nonvoluntary             cmd
   3861   OTHER     0      0,1     33997           58 gnome-screensav
This command performs the following operations sequentially:
-
Selects all threads that begin with the
gnome-scthreads. - Displays the selected threads to enable the user to verify their affinity mask and RT priority.
- Selects CPU 0.
-
Moves the
gnome-scthreads to the specified CPU, CPU 0. - Shows the result of the move.
- Resets the CPU list to CPU 1.
-
Moves the
gnome-scthreads to the specified CPU, CPU 1. - Displays the result of the move.
- Adds CPU 0 to the CPU list.
-
Moves the
gnome-scthreads to the specified CPUs, CPUs 0 and 1. - Displays the result of the move.
-
Selects all threads that begin with the
Additional resources
-
/proc/cpuinfofile -
tuna(8)man page
4.4. Tuning IRQs using tuna tool
The /proc/interrupts file records the number of interrupts per IRQ, the type of interrupt, and the name of the device that is located at that IRQ.
This procedure describes how to tune the IRQs using the tuna tool.
Prerequisites
- The tuna tool is installed. For more information, see Installing tuna tool.
Procedure
To view the current IRQs and their affinity:
# tuna --show_irqs
# users            affinity
0 timer                   0
1 i8042                   0
7 parport0                0
To specify the list of IRQs to be affected by a command:
# tuna --irqs=irq_list [command]
The irq_list argument is a list of comma-separated IRQ numbers or user-name patterns.
Replace [command] with, for example,
--spread.To move an interrupt to a specified CPU:
# tuna --irqs=128 --show_irqs
   # users            affinity
 128 iwlwifi           0,1,2,3

# tuna --irqs=128 --cpus=3 --move
Replace 128 with the irq_list argument and 3 with the cpu_list argument.
The cpu_list argument is a list of comma-separated CPU numbers, for example,
--cpus=0,2. For more information, see Tuning CPUs using tuna tool.
Verification steps
Compare the state of the selected IRQs before and after moving any interrupt to a specified CPU:
# tuna --irqs=128 --show_irqs
   # users            affinity
 128 iwlwifi                 3
Additional resources
-
/procs/interruptsfile -
tuna(8)man page
Chapter 5. Monitoring performance using RHEL System Roles
As a system administrator, you can use the metrics RHEL System Role with any Ansible Automation Platform control node to monitor the performance of a system.
5.1. Preparing a control node and managed nodes to use RHEL System Roles
Before you can use individual RHEL System Roles to manage services and settings, you must prepare the control node and managed nodes.
5.1.1. Preparing a control node on RHEL 8
Before using RHEL System Roles, you must configure a control node. This system then configures the managed hosts from the inventory according to the playbooks.
Prerequisites
RHEL 8.6 or later is installed. For more information about installing RHEL, see Performing a standard RHEL 8 installation.
NoteIn RHEL 8.5 and earlier versions, Ansible packages were provided through Ansible Engine instead of Ansible Core, and with a different level of support. Do not use Ansible Engine because the packages might not be compatible with Ansible automation content in RHEL 8.6 and later. For more information, see Scope of support for the Ansible Core package included in the RHEL 9 and RHEL 8.6 and later AppStream repositories.
- The system is registered to the Customer Portal.
-
A
Red Hat Enterprise Linux Serversubscription is attached to the system. -
Optional: An
Ansible Automation Platformsubscription is attached to the system.
Procedure
Install the
rhel-system-rolespackage:[root@control-node]# yum install rhel-system-rolesThis command installs the
ansible-corepackage as a dependency.Create a user named
ansibleto manage and run playbooks:[root@control-node]# useradd ansibleSwitch to the newly created
ansibleuser:[root@control-node]# su - ansiblePerform the rest of the procedure as this user.
Create an SSH public and private key:
[ansible@control-node]$ ssh-keygen
Generating public/private rsa key pair.
Enter file in which to save the key (/home/ansible/.ssh/id_rsa):
Enter passphrase (empty for no passphrase): <password>
Enter same passphrase again: <password>
...
Use the suggested default location for the key file.
- Optional: To prevent Ansible from prompting you for the SSH key password each time you establish a connection, configure an SSH agent.
Create the
~/.ansible.cfgfile with the following content:[defaults] inventory = /home/ansible/inventory remote_user = ansible [privilege_escalation] become = True become_method = sudo become_user = root become_ask_pass = True
NoteSettings in the
~/.ansible.cfgfile have a higher priority and override settings from the global/etc/ansible/ansible.cfgfile.With these settings, Ansible performs the following actions:
- Manages hosts in the specified inventory file.
-
Uses the account set in the
remote_userparameter when it establishes SSH connections to managed nodes. -
Uses the
sudoutility to execute tasks on managed nodes as therootuser. - Prompts for the root password of the remote user every time you apply a playbook. This is recommended for security reasons.
Create an
~/inventoryfile in INI or YAML format that lists the hostnames of managed hosts. You can also define groups of hosts in the inventory file. For example, the following is an inventory file in the INI format with three hosts and one host group namedUS:managed-node-01.example.com [US] managed-node-02.example.com ansible_host=192.0.2.100 managed-node-03.example.com
Note that the control node must be able to resolve the hostnames. If the DNS server cannot resolve certain hostnames, add the
ansible_hostparameter next to the host entry to specify its IP address.
Next steps
- Prepare the managed nodes. For more information, see Preparing a managed node.
Additional resources
- Scope of support for the Ansible Core package included in the RHEL 9 and RHEL 8.6 and later AppStream repositories
- How to register and subscribe a system to the Red Hat Customer Portal using subscription-manager
-
The
ssh-keygen(1)man page - Connecting to remote machines with SSH keys using ssh-agent
- Ansible configuration settings
- How to build your inventory
- Updates to using Ansible in RHEL 8.6 and 9.0
5.1.2. Preparing a managed node
Managed nodes are the systems listed in the inventory and which will be configured by the control node according to the playbook. You do not have to install Ansible on managed hosts.
Prerequisites
- You prepared the control node. For more information, see Preparing a control node on RHEL 8.
You have SSH access from the control node.
ImportantDirect SSH access as the
rootuser is a security risk. To reduce this risk, you will create a local user on this node and configure asudopolicy when preparing a managed node. Ansible on the control node can then use the local user account to log in to the managed node and run playbooks as different users, such asroot.
Procedure
Create a user named
ansible:[root@managed-node-01]# useradd ansibleThe control node later uses this user to establish an SSH connection to this host.
Set a password for the
ansibleuser:[root@managed-node-01]# passwd ansible Changing password for user ansible. New password: <password> Retype new password: <password> passwd: all authentication tokens updated successfully.
You must enter this password when Ansible uses
sudoto perform tasks as therootuser.Install the
ansibleuser’s SSH public key on the managed node:Log in to the control node as the
ansibleuser, and copy the SSH public key to the managed node:[ansible@control-node]$ ssh-copy-id managed-node-01.example.com /usr/bin/ssh-copy-id: INFO: Source of key(s) to be installed: "/home/ansible/.ssh/id_rsa.pub" The authenticity of host 'managed-node-01.example.com (192.0.2.100)' can't be established. ECDSA key fingerprint is SHA256:9bZ33GJNODK3zbNhybokN/6Mq7hu3vpBXDrCxe7NAvo.
When prompted, connect by entering
yes:Are you sure you want to continue connecting (yes/no/[fingerprint])? yes /usr/bin/ssh-copy-id: INFO: attempting to log in with the new key(s), to filter out any that are already installed /usr/bin/ssh-copy-id: INFO: 1 key(s) remain to be installed -- if you are prompted now it is to install the new keysWhen prompted, enter the password:
ansible@managed-node-01.example.com's password: <password>

Number of key(s) added: 1

Now try logging into the machine, with:   "ssh '<managed-node-01.example.com>'"
and check to make sure that only the key(s) you wanted were added.
Verify the SSH connection by remotely executing a command on the control node:
[ansible@control-node]$ ssh <managed-node-01.example.com> whoami
ansible
Create a
sudoconfiguration for theansibleuser:Create and edit the
/etc/sudoers.d/ansiblefile by using thevisudocommand:[root@managed-node-01]# visudo /etc/sudoers.d/ansibleThe benefit of using
visudoover a normal editor is that this utility provides basic sanity checks and checks for parse errors before installing the file.Configure a
sudoerspolicy in the/etc/sudoers.d/ansiblefile that meets your requirements, for example:To grant permissions to the
ansibleuser to run all commands as any user and group on this host after entering theansibleuser’s password, use:ansible ALL=(ALL) ALLTo grant permissions to the
ansibleuser to run all commands as any user and group on this host without entering theansibleuser’s password, use:ansible ALL=(ALL) NOPASSWD: ALL
Alternatively, configure a more fine-granular policy that matches your security requirements. For further details on
sudoerspolicies, see thesudoers(5)man page.
Verification
Verify that you can execute commands from the control node on an all managed nodes:
[ansible@control-node]$ ansible all -m ping
BECOME password: <password>
managed-node-01.example.com | SUCCESS => {
    	"ansible_facts": {
    	    "discovered_interpreter_python": "/usr/bin/python3"
    	},
    	"changed": false,
    	"ping": "pong"
}
...
The hard-coded all group dynamically contains all hosts listed in the inventory file.
Verify that privilege escalation works correctly by running the
whoamiutility on a managed host by using the Ansiblecommandmodule:[ansible@control-node]$ ansible managed-node-01.example.com -m command -a whoami BECOME password: <password> managed-node-01.example.com | CHANGED | rc=0 >> root
If the command returns root, you configured
sudoon the managed nodes correctly.
Additional resources
- Preparing a control node on RHEL 8.
-
The
sudoers(5)man page
5.2. Introduction to the metrics System Role
RHEL System Roles is a collection of Ansible roles and modules that provide a consistent configuration interface to remotely manage multiple RHEL systems. The metrics System Role configures performance analysis services for the local system and, optionally, includes a list of remote systems to be monitored by the local system. The metrics System Role enables you to use pcp to monitor your systems performance without having to configure pcp separately, as the set-up and deployment of pcp is handled by the playbook.
Table 5.1. metrics system role variables
| Role variable | Description | Example usage |
|---|---|---|
| metrics_monitored_hosts |
List of remote hosts to be analyzed by the target host. These hosts will have metrics recorded on the target host, so ensure enough disk space exists below |
|
| metrics_retention_days | Configures the number of days for performance data retention before deletion. |
|
| metrics_graph_service |
A boolean flag that enables the host to be set up with services for performance data visualization via |
|
| metrics_query_service |
A boolean flag that enables the host to be set up with time series query services for querying recorded |
|
| metrics_provider |
Specifies which metrics collector to use to provide metrics. Currently, |
|
| metrics_manage_firewall |
Uses the |
|
| metrics_manage_selinux |
Uses the |
|
For details about the parameters used in metrics_connections and additional information about the metrics System Role, see the /usr/share/ansible/roles/rhel-system-roles.metrics/README.md file.
5.3. Using the metrics System Role to monitor your local system with visualization
This procedure describes how to use the metrics RHEL System Role to monitor your local system while simultaneously provisioning data visualization via Grafana.
Prerequisites
- The Ansible Core package is installed on the control machine.
-
You have the
rhel-system-rolespackage installed on the machine you want to monitor.
Procedure
Configure
localhostin the/etc/ansible/hostsAnsible inventory by adding the following content to the inventory:localhost ansible_connection=local
Create an Ansible playbook with the following content:
---
- name: Manage metrics
  hosts: localhost
  vars:
    metrics_graph_service: yes
    metrics_manage_firewall: true
    metrics_manage_selinux: true
  roles:
    - rhel-system-roles.metrics
Run the Ansible playbook:
# ansible-playbook name_of_your_playbook.ymlNoteBecause the
metrics_graph_serviceboolean is set tovalue="yes",Grafanais automatically installed and provisioned withpcpadded as a data source. Becausemetrics_manage_firewallandmetrics_manage_selinuxare both set totrue, the metrics role uses thefirewallandselinuxsystem roles to manage the ports used by the metrics role.-
To view visualization of the metrics being collected on your machine, access the
grafanaweb interface as described in Accessing the Grafana web UI.
5.4. Using the metrics System Role to set up a fleet of individual systems to monitor themselves
This procedure describes how to use the metrics System Role to set up a fleet of machines to monitor themselves.
Prerequisites
- The Ansible Core package is installed on the control machine.
-
You have the
rhel-system-rolespackage installed on the machine you want to use to run the playbook. - You have the SSH connection established.
Procedure
Add the name or IP address of the machines you want to monitor via the playbook to the
/etc/ansible/hostsAnsible inventory file under an identifying group name enclosed in brackets:[remotes] webserver.example.com database.example.com
Create an Ansible playbook with the following content:
--- - hosts: remotes vars: metrics_retention_days: 0 metrics_manage_firewall: true metrics_manage_selinux: true roles: - rhel-system-roles.metricsNoteBecause
metrics_manage_firewallandmetrics_manage_selinuxare both set totrue, the metrics role uses thefirewallandselinuxroles to manage the ports used by themetricsrole.Run the Ansible playbook:
# ansible-playbook name_of_your_playbook.yml -kWhere the
-kprompt for password to connect to remote system.
5.5. Using the metrics System Role to monitor a fleet of machines centrally via your local machine
This procedure describes how to use the metrics System Role to set up your local machine to centrally monitor a fleet of machines while also provisioning visualization of the data via grafana and querying of the data via redis.
Prerequisites
- The Ansible Core package is installed on the control machine.
-
You have the
rhel-system-rolespackage installed on the machine you want to use to run the playbook.
Procedure
Create an Ansible playbook with the following content:
---
- hosts: localhost
  vars:
    metrics_graph_service: yes
    metrics_query_service: yes
    metrics_retention_days: 10
    metrics_monitored_hosts: ["database.example.com", "webserver.example.com"]
    metrics_manage_firewall: yes
    metrics_manage_selinux: yes
  roles:
    - rhel-system-roles.metrics
Run the Ansible playbook:
# ansible-playbook name_of_your_playbook.ymlNoteBecause the
metrics_graph_serviceandmetrics_query_servicebooleans are set tovalue="yes",grafanais automatically installed and provisioned withpcpadded as a data source with thepcpdata recording indexed intoredis, allowing thepcpquerying language to be used for complex querying of the data. Becausemetrics_manage_firewallandmetrics_manage_selinuxare both set totrue, themetricsrole uses thefirewallandselinuxroles to manage the ports used by themetricsrole.-
To view a graphical representation of the metrics being collected centrally by your machine and to query the data, access the
grafanaweb interface as described in Accessing the Grafana web UI.
5.6. Setting up authentication while monitoring a system using the metrics System Role
PCP supports the scram-sha-256 authentication mechanism through the Simple Authentication Security Layer (SASL) framework. The metrics RHEL System Role automates the steps to setup authentication using the scram-sha-256 authentication mechanism. This procedure describes how to setup authentication using the metrics RHEL System Role.
Prerequisites
- The Ansible Core package is installed on the control machine.
-
You have the
rhel-system-rolespackage installed on the machine you want to use to run the playbook.
Procedure
Include the following variables in the Ansible playbook you want to setup authentication for:
--- vars: metrics_username: your_username metrics_password: your_password metrics_manage_firewall: true metrics_manage_selinux: trueNoteBecause
metrics_manage_firewallandmetrics_manage_selinuxare both set totrue, themetricsrole uses thefirewallandselinuxroles to manage the ports used by themetricsrole.Run the Ansible playbook:
# ansible-playbook name_of_your_playbook.yml
Verification steps
Verify the
saslconfiguration:# pminfo -f -h "pcp://ip_adress?username=your_username" disk.dev.read Password: disk.dev.read inst [0 or "sda"] value 19540
ip_adress should be replaced by the IP address of the host.
5.7. Using the metrics System Role to configure and enable metrics collection for SQL Server
This procedure describes how to use the metrics RHEL System Role to automate the configuration and enabling of metrics collection for Microsoft SQL Server via pcp on your local system.
Prerequisites
- The Ansible Core package is installed on the control machine.
-
You have the
rhel-system-rolespackage installed on the machine you want to monitor. - You have installed Microsoft SQL Server for Red Hat Enterprise Linux and established a 'trusted' connection to an SQL server. See Install SQL Server and create a database on Red Hat.
- You have installed the Microsoft ODBC driver for SQL Server for Red Hat Enterprise Linux. See Red Hat Enterprise Server and Oracle Linux.
Procedure
Configure
localhostin the/etc/ansible/hostsAnsible inventory by adding the following content to the inventory:localhost ansible_connection=local
Create an Ansible playbook that contains the following content:
---
- hosts: localhost
  vars:
   metrics_from_mssql: true
   metrics_manage_firewall: true
   metrics_manage_selinux: true
  roles:
   - role: rhel-system-roles.metrics
NoteBecause
metrics_manage_firewallandmetrics_manage_selinuxare both set totrue, themetricsrole uses thefirewallandselinuxroles to manage the ports used by themetricsrole.Run the Ansible playbook:
# ansible-playbook name_of_your_playbook.yml
Verification steps
Use the
pcpcommand to verify that SQL Server PMDA agent (mssql) is loaded and running:# pcp platform: Linux rhel82-2.local 4.18.0-167.el8.x86_64 #1 SMP Sun Dec 15 01:24:23 UTC 2019 x86_64 hardware: 2 cpus, 1 disk, 1 node, 2770MB RAM timezone: PDT+7 services: pmcd pmproxy pmcd: Version 5.0.2-1, 12 agents, 4 clients pmda: root pmcd proc pmproxy xfs linux nfsclient mmv kvm mssql jbd2 dm pmlogger: primary logger: /var/log/pcp/pmlogger/rhel82-2.local/20200326.16.31 pmie: primary engine: /var/log/pcp/pmie/rhel82-2.local/pmie.log
Chapter 6. Setting up PCP
Performance Co-Pilot (PCP) is a suite of tools, services, and libraries for monitoring, visualizing, storing, and analyzing system-level performance measurements.
6.1. Overview of PCP
You can add performance metrics using Python, Perl, C++, and C interfaces. Analysis tools can use the Python, C++, C client APIs directly, and rich web applications can explore all available performance data using a JSON interface.
You can analyze data patterns by comparing live results with archived data.
Features of PCP:
- Light-weight distributed architecture, which is useful during the centralized analysis of complex systems.
- It allows the monitoring and management of real-time data.
- It allows logging and retrieval of historical data.
PCP has the following components:
-
The Performance Metric Collector Daemon (
pmcd) collects performance data from the installed Performance Metric Domain Agents (pmda). PMDAs can be individually loaded or unloaded on the system and are controlled by the PMCD on the same host. -
Various client tools, such as
pminfoorpmstat, can retrieve, display, archive, and process this data on the same host or over the network. -
The
pcppackage provides the command-line tools and underlying functionality. -
The
pcp-guipackage provides the graphical application. Install thepcp-guipackage by executing theyum install pcp-guicommand. For more information, see Visually tracing PCP log archives with the PCP Charts application.
Additional resources
-
pcp(1)man page -
/usr/share/doc/pcp-doc/directory - System services and tools distributed with PCP
- Index of Performance Co-Pilot (PCP) articles, solutions, tutorials, and white papers fromon Red Hat Customer Portal
- Side-by-side comparison of PCP tools with legacy tools Red Hat Knowledgebase article
- PCP upstream documentation
6.2. Installing and enabling PCP
To begin using PCP, install all the required packages and enable the PCP monitoring services.
This procedure describes how to install PCP using the pcp package. If you want to automate the PCP installation, install it using the pcp-zeroconf package. For more information about installing PCP by using pcp-zeroconf, see Setting up PCP with pcp-zeroconf.
Procedure
Install the
pcppackage:# yum install pcp
Enable and start the
pmcdservice on the host machine:# systemctl enable pmcd # systemctl start pmcd
Verification steps
Verify if the
pmcdprocess is running on the host:# pcp Performance Co-Pilot configuration on workstation: platform: Linux workstation 4.18.0-80.el8.x86_64 #1 SMP Wed Mar 13 12:02:46 UTC 2019 x86_64 hardware: 12 cpus, 2 disks, 1 node, 36023MB RAM timezone: CEST-2 services: pmcd pmcd: Version 4.3.0-1, 8 agents pmda: root pmcd proc xfs linux mmv kvm jbd2
Additional resources
-
pmcd(1)man page - System services and tools distributed with PCP
6.3. Deploying a minimal PCP setup
The minimal PCP setup collects performance statistics on Red Hat Enterprise Linux. The setup involves adding the minimum number of packages on a production system needed to gather data for further analysis.
You can analyze the resulting tar.gz file and the archive of the pmlogger output using various PCP tools and compare them with other sources of performance information.
Prerequisites
- PCP is installed. For more information, see Installing and enabling PCP.
Procedure
Update the
pmloggerconfiguration:# pmlogconf -r /var/lib/pcp/config/pmlogger/config.default
Start the
pmcdandpmloggerservices:# systemctl start pmcd.service # systemctl start pmlogger.service
- Execute the required operations to record the performance data.
Stop the
pmcdandpmloggerservices:# systemctl stop pmcd.service # systemctl stop pmlogger.service
Save the output and save it to a
tar.gzfile named based on the host name and the current date and time:# cd /var/log/pcp/pmlogger/ # tar -czf $(hostname).$(date +%F-%Hh%M).pcp.tar.gz $(hostname)
Extract this file and analyze the data using PCP tools.
Additional resources
-
pmlogconf(1),pmlogger(1), andpmcd(1)man pages - System services and tools distributed with PCP
6.4. System services and tools distributed with PCP
Performance Co-Pilot (PCP) includes various system services and tools you can use for measuring performance. The basic package pcp includes the system services and basic tools. Additional tools are provided with the pcp-system-tools, pcp-gui, and pcp-devel packages.
Roles of system services distributed with PCP
pmcd- The Performance Metric Collector Daemon (PMCD).
pmie- The Performance Metrics Inference Engine.
pmlogger- The performance metrics logger.
pmproxy- The realtime and historical performance metrics proxy, time series query and REST API service.
Tools distributed with base PCP package
pcp- Displays the current status of a Performance Co-Pilot installation.
pcp-vmstat- Provides a high-level system performance overview every 5 seconds. Displays information about processes, memory, paging, block IO, traps, and CPU activity.
pmconfig- Displays the values of configuration parameters.
pmdiff- Compares the average values for every metric in either one or two archives, in a given time window, for changes that are likely to be of interest when searching for performance regressions.
pmdumplog- Displays control, metadata, index, and state information from a Performance Co-Pilot archive file.
pmfind- Finds PCP services on the network.
pmie- An inference engine that periodically evaluates a set of arithmetic, logical, and rule expressions. The metrics are collected either from a live system, or from a Performance Co-Pilot archive file.
pmieconf-
Displays or sets configurable
pmievariables. pmiectl-
Manages non-primary instances of
pmie. pminfo- Displays information about performance metrics. The metrics are collected either from a live system, or from a Performance Co-Pilot archive file.
pmlc-
Interactively configures active
pmloggerinstances. pmlogcheck- Identifies invalid data in a Performance Co-Pilot archive file.
pmlogconf-
Creates and modifies a
pmloggerconfiguration file. pmlogctl-
Manages non-primary instances of
pmlogger. pmloglabel- Verifies, modifies, or repairs the label of a Performance Co-Pilot archive file.
pmlogsummary- Calculates statistical information about performance metrics stored in a Performance Co-Pilot archive file.
pmprobe- Determines the availability of performance metrics.
pmsocks- Allows access to a Performance Co-Pilot hosts through a firewall.
pmstat- Periodically displays a brief summary of system performance.
pmstore- Modifies the values of performance metrics.
pmtrace- Provides a command line interface to the trace PMDA.
pmval- Displays the current value of a performance metric.
Tools distributed with the separately installed pcp-system-tools package
pcp-atop- Shows the system-level occupation of the most critical hardware resources from the performance point of view: CPU, memory, disk, and network.
pcp-atopsar-
Generates a system-level activity report over a variety of system resource utilization. The report is generated from a raw logfile previously recorded using
pmloggeror the-woption ofpcp-atop. pcp-dmcache- Displays information about configured Device Mapper Cache targets, such as: device IOPs, cache and metadata device utilization, as well as hit and miss rates and ratios for both reads and writes for each cache device.
pcp-dstat-
Displays metrics of one system at a time. To display metrics of multiple systems, use
--hostoption. pcp-free- Reports on free and used memory in a system.
pcp-htop-
Displays all processes running on a system along with their command line arguments in a manner similar to the
topcommand, but allows you to scroll vertically and horizontally as well as interact using a mouse. You can also view processes in a tree format and select and act on multiple processes at once. pcp-ipcs- Displays information about the inter-process communication (IPC) facilities that the calling process has read access for.
pcp-mpstat- Reports CPU and interrupt-related statistics.
pcp-numastat- Displays NUMA allocation statistics from the kernel memory allocator.
pcp-pidstat- Displays information about individual tasks or processes running on the system, such as CPU percentage, memory and stack usage, scheduling, and priority. Reports live data for the local host by default.
pcp-shping-
Samples and reports on the shell-ping service metrics exported by the
pmdashpingPerformance Metrics Domain Agent (PMDA). pcp-ss-
Displays socket statistics collected by the
pmdasocketsPMDA. pcp-tapestat- Reports I/O statistics for tape devices.
pcp-uptime- Displays how long the system has been running, how many users are currently logged on, and the system load averages for the past 1, 5, and 15 minutes.
pcp-verify- Inspects various aspects of a Performance Co-Pilot collector installation and reports on whether it is configured correctly for certain modes of operation.
pmiostat-
Reports I/O statistics for SCSI devices (by default) or device-mapper devices (with the
-xdevice-mapper option). pmrep- Reports on selected, easily customizable, performance metrics values.
Tools distributed with the separately installed pcp-gui package
pmchart- Plots performance metrics values available through the facilities of the Performance Co-Pilot.
pmdumptext- Outputs the values of performance metrics collected live or from a Performance Co-Pilot archive.
Tools distributed with the separately installed pcp-devel package
pmclient- Displays high-level system performance metrics by using the Performance Metrics Application Programming Interface (PMAPI).
pmdbg- Displays available Performance Co-Pilot debug control flags and their values.
pmerr- Displays available Performance Co-Pilot error codes and their corresponding error messages.
6.5. PCP deployment architectures
Performance Co-Pilot (PCP) supports multiple deployment architectures, based on the scale of the PCP deployment, and offers many options to accomplish advanced setups.
Available scaling deployment setup variants based on the recommended deployment set up by Red Hat, sizing factors, and configuration options include:
Since the PCP version 5.3.0 is unavailable in Red Hat Enterprise Linux 8.4 and the prior minor versions of Red Hat Enterprise Linux 8, Red Hat recommends localhost and pmlogger farm architectures.
For more information about known memory leaks in pmproxy in PCP versions before 5.3.0, see Memory leaks in pmproxy in PCP.
LocalhostEach service runs locally on the monitored machine. When you start a service without any configuration changes, this is the default deployment. Scaling beyond the individual node is not possible in this case.
By default, the deployment setup for Redis is standalone, localhost. However, Redis can optionally perform in a highly-available and highly scalable clustered fashion, where data is shared across multiple hosts. Another viable option is to deploy a Redis cluster in the cloud, or to utilize a managed Redis cluster from a cloud vendor.
DecentralizedThe only difference between localhost and decentralized setup is the centralized Redis service. In this model, the host executes
pmloggerservice on each monitored host and retrieves metrics from a localpmcdinstance. A localpmproxyservice then exports the performance metrics to a central Redis instance.Figure 6.1. Decentralized logging
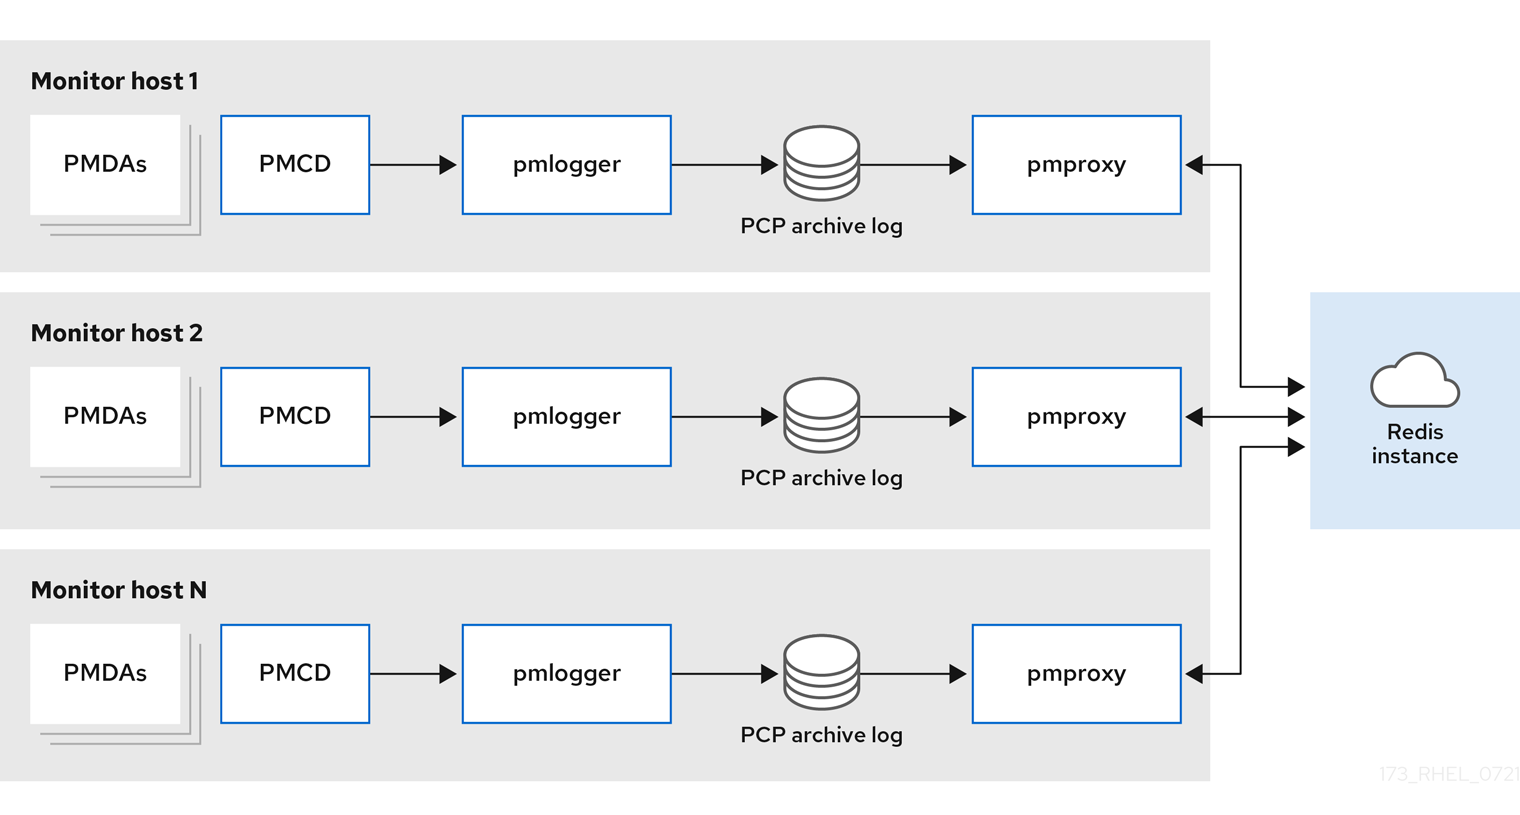
Centralized logging - pmlogger farmWhen the resource usage on the monitored hosts is constrained, another deployment option is a
pmloggerfarm, which is also known as centralized logging. In this setup, a single logger host executes multiplepmloggerprocesses, and each is configured to retrieve performance metrics from a different remotepmcdhost. The centralized logger host is also configured to execute thepmproxyservice, which discovers the resulting PCP archives logs and loads the metric data into a Redis instance.Figure 6.2. Centralized logging - pmlogger farm
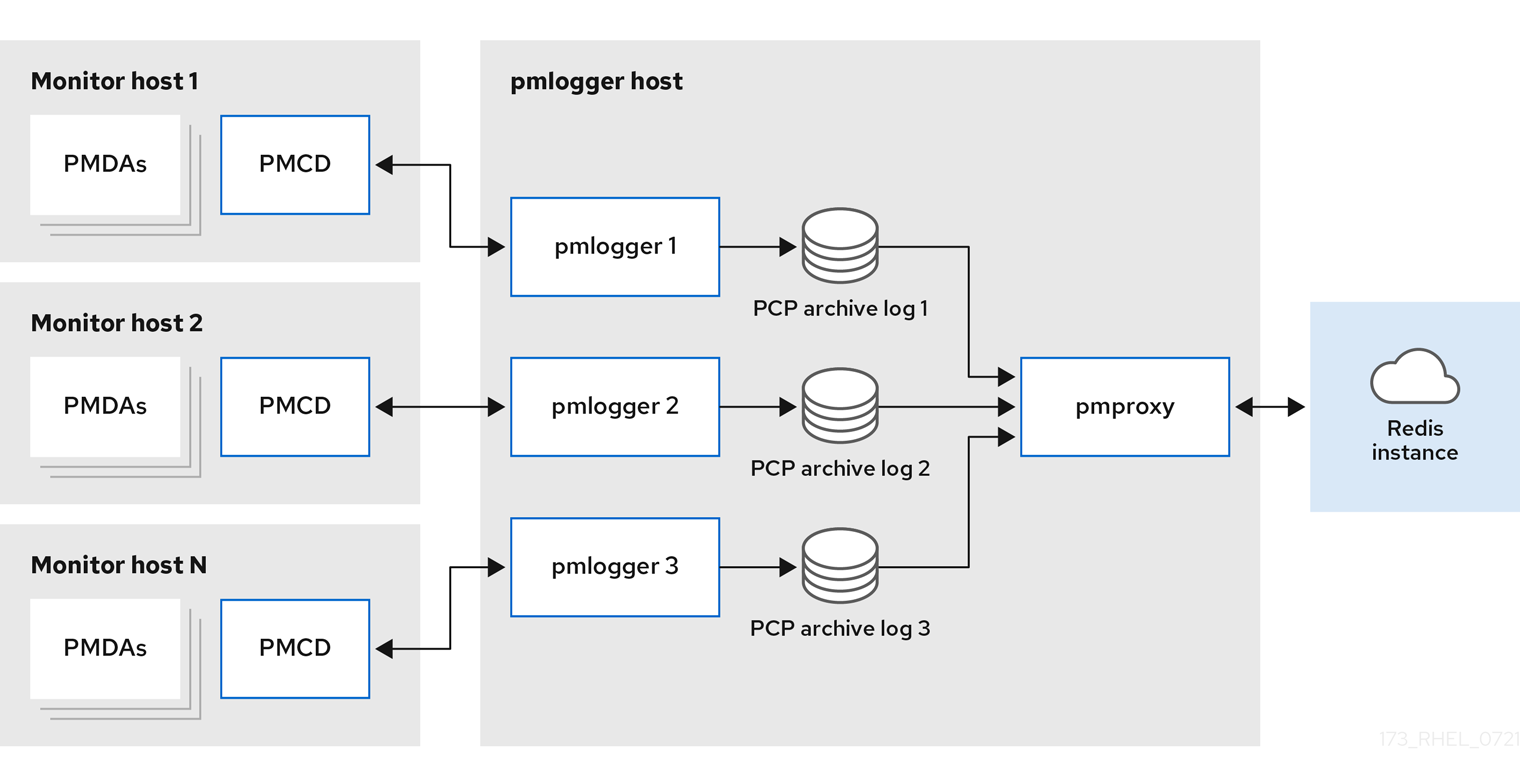
Federated - multiple pmlogger farmsFor large scale deployments, Red Hat recommends to deploy multiple
pmloggerfarms in a federated fashion. For example, onepmloggerfarm per rack or data center. Eachpmloggerfarm loads the metrics into a central Redis instance.Figure 6.3. Federated - multiple pmlogger farms
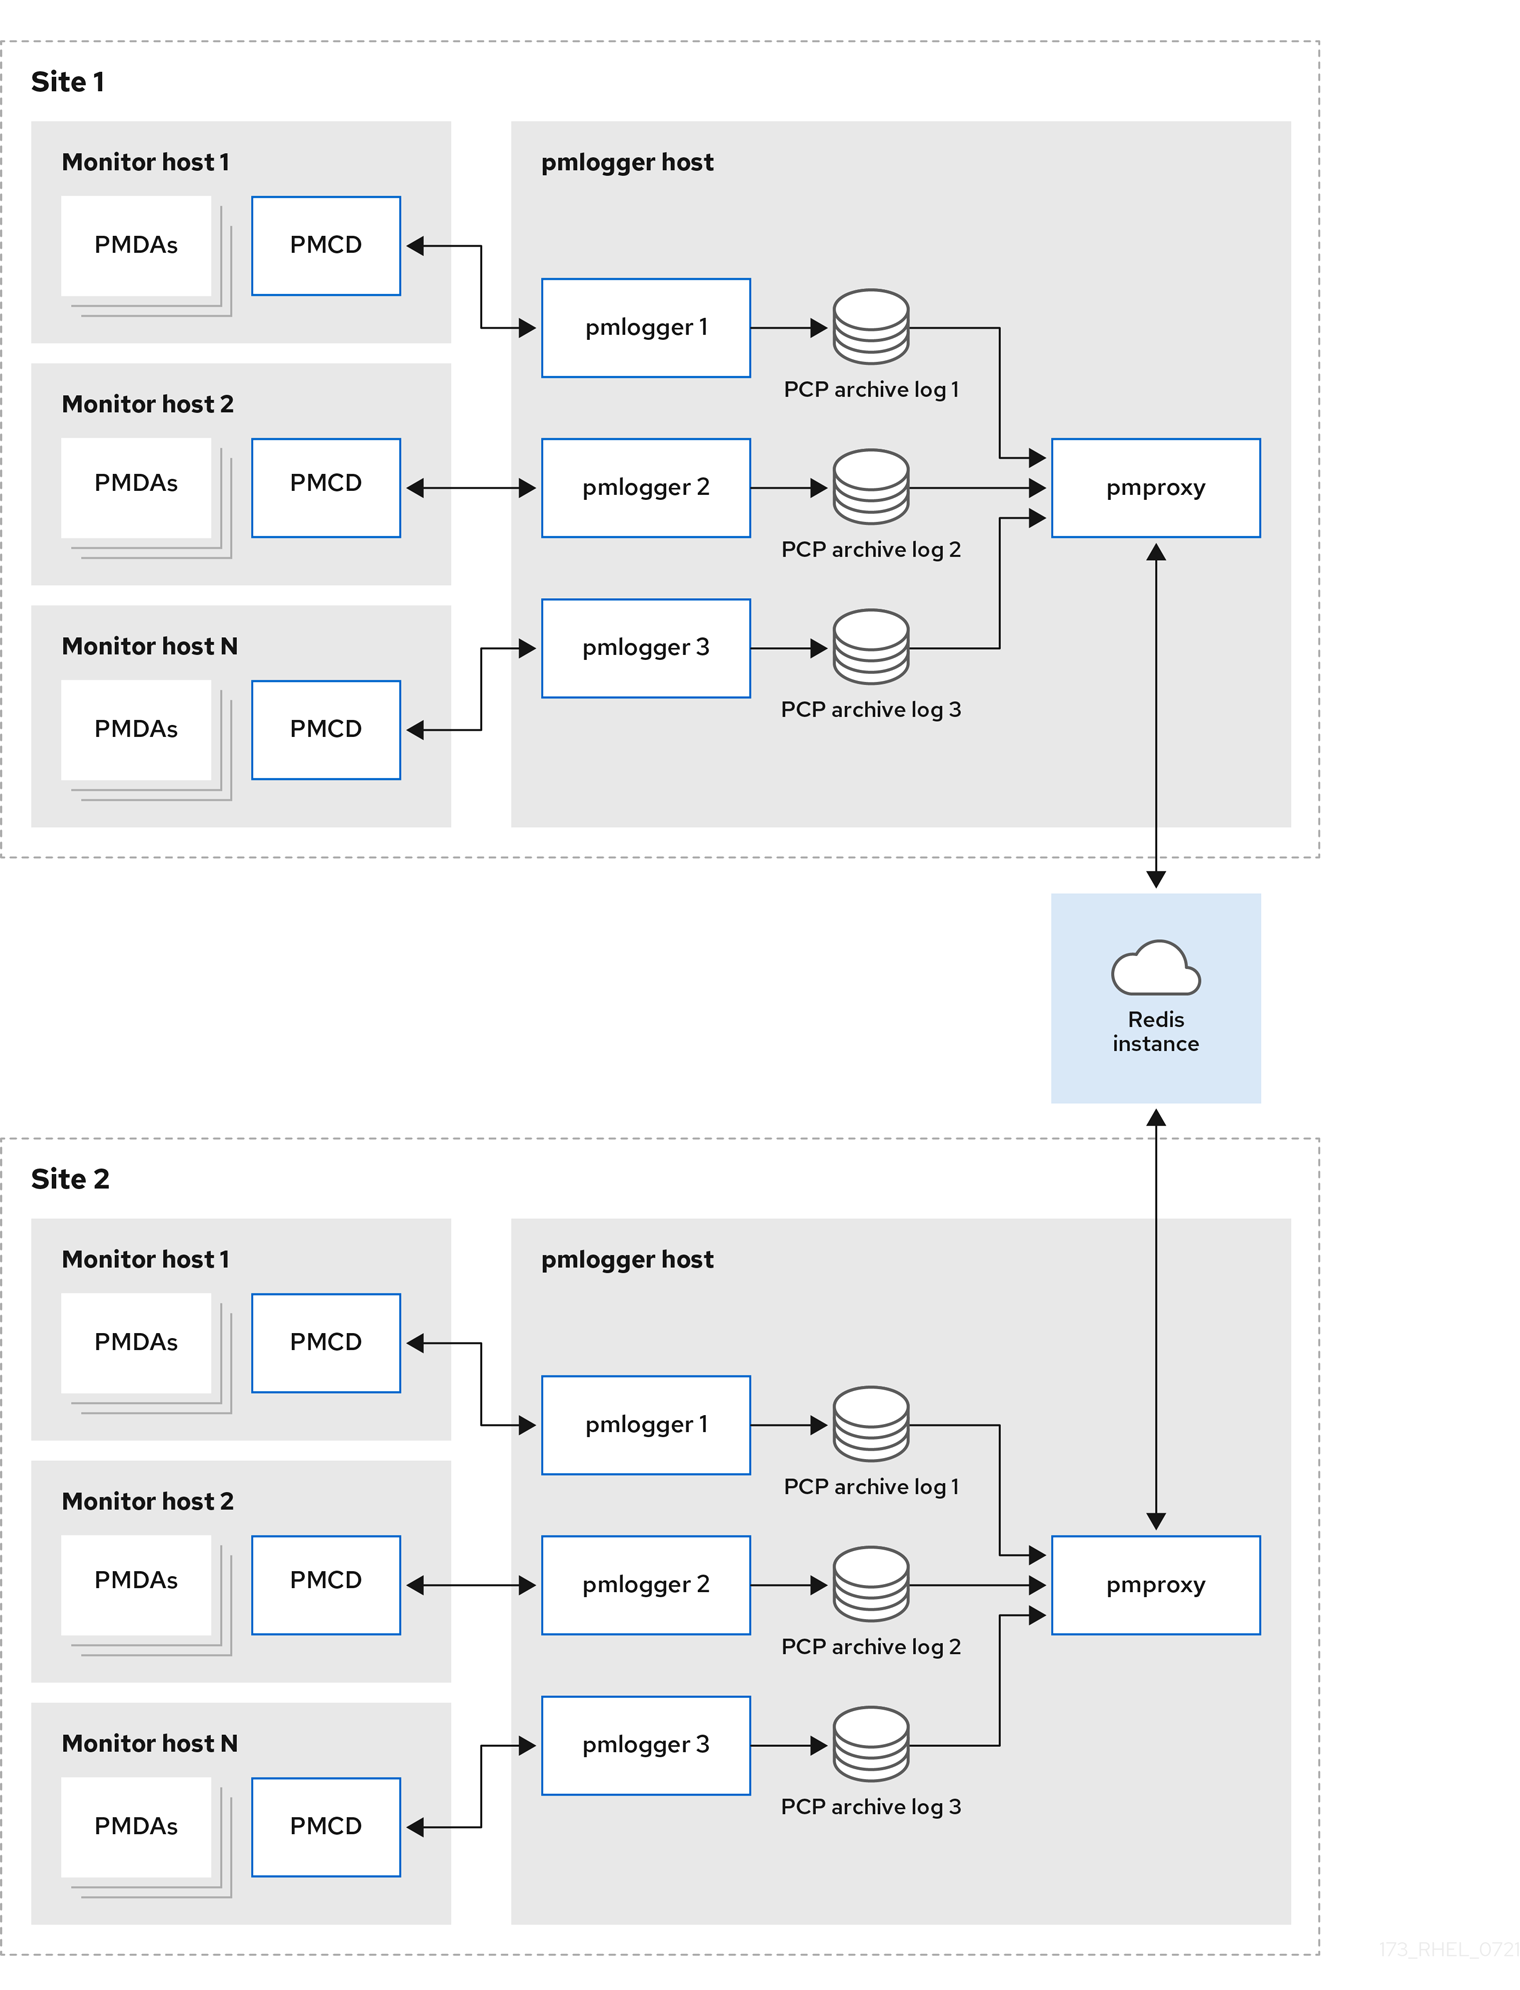
By default, the deployment setup for Redis is standalone, localhost. However, Redis can optionally perform in a highly-available and highly scalable clustered fashion, where data is shared across multiple hosts. Another viable option is to deploy a Redis cluster in the cloud, or to utilize a managed Redis cluster from a cloud vendor.
Additional resources
-
pcp(1),pmlogger(1),pmproxy(1), andpmcd(1)man pages - Recommended deployment architecture
6.6. Recommended deployment architecture
The following table describes the recommended deployment architectures based on the number of monitored hosts.
Table 6.1. Recommended deployment architecture
| Number of hosts (N) | 1-10 | 10-100 | 100-1000 |
|---|---|---|---|
|
| N | N | N |
|
| 1 to N | N/10 to N | N/100 to N |
|
| 1 to N | 1 to N | N/100 to N |
| Redis servers | 1 to N | 1 to N/10 | N/100 to N/10 |
| Redis cluster | No | Maybe | Yes |
| Recommended deployment setup | Localhost, Decentralized, or Centralized logging | Decentralized, Centralized logging, or Federated | Decentralized or Federated |
6.7. Sizing factors
The following are the sizing factors required for scaling:
Remote system size-
The number of CPUs, disks, network interfaces, and other hardware resources affects the amount of data collected by each
pmloggeron the centralized logging host. Logged Metrics-
The number and types of logged metrics play an important role. In particular, the
per-process proc.*metrics require a large amount of disk space, for example, with the standardpcp-zeroconfsetup, 10s logging interval, 11 MB without proc metrics versus 155 MB with proc metrics - a factor of 10 times more. Additionally, the number of instances for each metric, for example the number of CPUs, block devices, and network interfaces also impacts the required storage capacity. Logging Interval-
The interval how often metrics are logged, affects the storage requirements. The expected daily PCP archive file sizes are written to the
pmlogger.logfile for eachpmloggerinstance. These values are uncompressed estimates. Since PCP archives compress very well, approximately 10:1, the actual long term disk space requirements can be determined for a particular site. pmlogrewrite-
After every PCP upgrade, the
pmlogrewritetool is executed and rewrites old archives if there were changes in the metric metadata from the previous version and the new version of PCP. This process duration scales linear with the number of archives stored.
Additional resources
-
pmlogrewrite(1)andpmlogger(1)man pages
6.8. Configuration options for PCP scaling
The following are the configuration options, which are required for scaling:
sysctl and rlimit settings-
When archive discovery is enabled,
pmproxyrequires four descriptors for everypmloggerthat it is monitoring or log-tailing, along with the additional file descriptors for the service logs andpmproxyclient sockets, if any. Eachpmloggerprocess uses about 20 file descriptors for the remotepmcdsocket, archive files, service logs, and others. In total, this can exceed the default 1024 soft limit on a system running around 200pmloggerprocesses. Thepmproxyservice inpcp-5.3.0and later automatically increases the soft limit to the hard limit. On earlier versions of PCP, tuning is required if a high number ofpmloggerprocesses are to be deployed, and this can be accomplished by increasing the soft or hard limits forpmlogger. For more information, see How to set limits (ulimit) for services run by systemd. Local Archives-
The
pmloggerservice stores metrics of local and remotepmcdsin the/var/log/pcp/pmlogger/directory. To control the logging interval of the local system, update the/etc/pcp/pmlogger/control.d/configfilefile and add-t Xin the arguments, where X is the logging interval in seconds. To configure which metrics should be logged, executepmlogconf /var/lib/pcp/config/pmlogger/config.clienthostname. This command deploys a configuration file with a default set of metrics, which can optionally be further customized. To specify retention settings, that is when to purge old PCP archives, update the/etc/sysconfig/pmlogger_timersfile and specifyPMLOGGER_DAILY_PARAMS="-E -k X", where X is the amount of days to keep PCP archives. RedisThe
pmproxyservice sends logged metrics frompmloggerto a Redis instance. The following are the available two options to specify the retention settings in the/etc/pcp/pmproxy/pmproxy.confconfiguration file:-
stream.expirespecifies the duration when stale metrics should be removed, that is metrics which were not updated in a specified amount of time in seconds. -
stream.maxlenspecifies the maximum number of metric values for one metric per host. This setting should be the retention time divided by the logging interval, for example 20160 for 14 days of retention and 60s logging interval (60*60*24*14/60)
-
Additional resources
-
pmproxy(1),pmlogger(1), andsysctl(8)man pages
6.9. Example: Analyzing the centralized logging deployment
The following results were gathered on a centralized logging setup, also known as pmlogger farm deployment, with a default pcp-zeroconf 5.3.0 installation, where each remote host is an identical container instance running pmcd on a server with 64 CPU cores, 376 GB RAM, and one disk attached.
The logging interval is 10s, proc metrics of remote nodes are not included, and the memory values refer to the Resident Set Size (RSS) value.
Table 6.2. Detailed utilization statistics for 10s logging interval
| Number of Hosts | 10 | 50 |
|---|---|---|
| PCP Archives Storage per Day | 91 MB | 522 MB |
|
| 160 MB | 580 MB |
|
| 2 MB | 9 MB |
|
| 1.4 GB | 6.3 GB |
| Redis Memory per Day | 2.6 GB | 12 GB |
Table 6.3. Used resources depending on monitored hosts for 60s logging interval
| Number of Hosts | 10 | 50 | 100 |
|---|---|---|---|
| PCP Archives Storage per Day | 20 MB | 120 MB | 271 MB |
|
| 104 MB | 524 MB | 1049 MB |
|
| 0.38 MB | 1.75 MB | 3.48 MB |
|
| 2.67 GB | 5.5GB | 9 GB |
| Redis Memory per Day | 0.54 GB | 2.65 GB | 5.3 GB |
The pmproxy queues Redis requests and employs Redis pipelining to speed up Redis queries. This can result in high memory usage. For troubleshooting this issue, see Troubleshooting high memory usage.
6.10. Example: Analyzing the federated setup deployment
The following results were observed on a federated setup, also known as multiple pmlogger farms, consisting of three centralized logging (pmlogger farm) setups, where each pmlogger farm was monitoring 100 remote hosts, that is 300 hosts in total.
This setup of the pmlogger farms is identical to the configuration mentioned in the
Example: Analyzing the centralized logging deployment for 60s logging interval, except that the Redis servers were operating in cluster mode.
Table 6.4. Used resources depending on federated hosts for 60s logging interval
| PCP Archives Storage per Day | pmlogger Memory | Network per Day (In/Out) | pmproxy Memory | Redis Memory per Day |
|---|---|---|---|---|
| 277 MB | 1058 MB | 15.6 MB / 12.3 MB | 6-8 GB | 5.5 GB |
Here, all values are per host. The network bandwidth is higher due to the inter-node communication of the Redis cluster.
6.11. Troubleshooting high memory usage
The following scenarios can result in high memory usage:
-
The
pmproxyprocess is busy processing new PCP archives and does not have spare CPU cycles to process Redis requests and responses. - The Redis node or cluster is overloaded and cannot process incoming requests on time.
The pmproxy service daemon uses Redis streams and supports the configuration parameters, which are PCP tuning parameters and affects Redis memory usage and key retention. The /etc/pcp/pmproxy/pmproxy.conf file lists the available configuration options for pmproxy and the associated APIs.
The following procedure describes how to troubleshoot high memory usage issue.
Prerequisites
Install the
pcp-pmda-redispackage:# yum install pcp-pmda-redis
Install the redis PMDA:
# cd /var/lib/pcp/pmdas/redis && ./Install
Procedure
To troubleshoot high memory usage, execute the following command and observe the
inflightcolumn:$ pmrep :pmproxy backlog inflight reqs/s resp/s wait req err resp err changed throttled byte count count/s count/s s/s count/s count/s count/s count/s 14:59:08 0 0 N/A N/A N/A N/A N/A N/A N/A 14:59:09 0 0 2268.9 2268.9 28 0 0 2.0 4.0 14:59:10 0 0 0.0 0.0 0 0 0 0.0 0.0 14:59:11 0 0 0.0 0.0 0 0 0 0.0 0.0This column shows how many Redis requests are in-flight, which means they are queued or sent, and no reply was received so far.
A high number indicates one of the following conditions:
-
The
pmproxyprocess is busy processing new PCP archives and does not have spare CPU cycles to process Redis requests and responses. - The Redis node or cluster is overloaded and cannot process incoming requests on time.
-
The
To troubleshoot the high memory usage issue, reduce the number of
pmloggerprocesses for this farm, and add another pmlogger farm. Use the federated - multiple pmlogger farms setup.If the Redis node is using 100% CPU for an extended amount of time, move it to a host with better performance or use a clustered Redis setup instead.
To view the
pmproxy.redis.*metrics, use the following command:$ pminfo -ftd pmproxy.redis pmproxy.redis.responses.wait [wait time for responses] Data Type: 64-bit unsigned int InDom: PM_INDOM_NULL 0xffffffff Semantics: counter Units: microsec value 546028367374 pmproxy.redis.responses.error [number of error responses] Data Type: 64-bit unsigned int InDom: PM_INDOM_NULL 0xffffffff Semantics: counter Units: count value 1164 [...] pmproxy.redis.requests.inflight.bytes [bytes allocated for inflight requests] Data Type: 64-bit int InDom: PM_INDOM_NULL 0xffffffff Semantics: discrete Units: byte value 0 pmproxy.redis.requests.inflight.total [inflight requests] Data Type: 64-bit unsigned int InDom: PM_INDOM_NULL 0xffffffff Semantics: discrete Units: count value 0 [...]To view how many Redis requests are inflight, see the
pmproxy.redis.requests.inflight.totalmetric andpmproxy.redis.requests.inflight.bytesmetric to view how many bytes are occupied by all current inflight Redis requests.In general, the redis request queue would be zero but can build up based on the usage of large pmlogger farms, which limits scalability and can cause high latency for
pmproxyclients.Use the
pminfocommand to view information about performance metrics. For example, to view theredis.*metrics, use the following command:$ pminfo -ftd redis redis.redis_build_id [Build ID] Data Type: string InDom: 24.0 0x6000000 Semantics: discrete Units: count inst [0 or "localhost:6379"] value "87e335e57cffa755" redis.total_commands_processed [Total number of commands processed by the server] Data Type: 64-bit unsigned int InDom: 24.0 0x6000000 Semantics: counter Units: count inst [0 or "localhost:6379"] value 595627069 [...] redis.used_memory_peak [Peak memory consumed by Redis (in bytes)] Data Type: 32-bit unsigned int InDom: 24.0 0x6000000 Semantics: instant Units: count inst [0 or "localhost:6379"] value 572234920 [...]To view the peak memory usage, see the
redis.used_memory_peakmetric.
Additional resources
-
pmdaredis(1),pmproxy(1), andpminfo(1)man pages - PCP deployment architectures
Chapter 7. Logging performance data with pmlogger
With the PCP tool you can log the performance metric values and replay them later. This allows you to perform a retrospective performance analysis.
Using the pmlogger tool, you can:
- Create the archived logs of selected metrics on the system
- Specify which metrics are recorded on the system and how often
7.1. Modifying the pmlogger configuration file with pmlogconf
When the pmlogger service is running, PCP logs a default set of metrics on the host.
Use the pmlogconf utility to check the default configuration. If the pmlogger configuration file does not exist, pmlogconf creates it with a default metric values.
Prerequisites
- PCP is installed. For more information, see Installing and enabling PCP.
Procedure
Create or modify the
pmloggerconfiguration file:# pmlogconf -r /var/lib/pcp/config/pmlogger/config.default
-
Follow
pmlogconfprompts to enable or disable groups of related performance metrics and to control the logging interval for each enabled group.
Additional resources
-
pmlogconf(1)andpmlogger(1)man pages - System services and tools distributed with PCP
7.2. Editing the pmlogger configuration file manually
To create a tailored logging configuration with specific metrics and given intervals, edit the pmlogger configuration file manually. The default pmlogger configuration file is /var/lib/pcp/config/pmlogger/config.default. The configuration file specifies which metrics are logged by the primary logging instance.
In manual configuration, you can:
- Record metrics which are not listed in the automatic configuration.
- Choose custom logging frequencies.
- Add PMDA with the application metrics.
Prerequisites
- PCP is installed. For more information, see Installing and enabling PCP.
Procedure
Open and edit the
/var/lib/pcp/config/pmlogger/config.defaultfile to add specific metrics:# It is safe to make additions from here on ... # log mandatory on every 5 seconds { xfs.write xfs.write_bytes xfs.read xfs.read_bytes } log mandatory on every 10 seconds { xfs.allocs xfs.block_map xfs.transactions xfs.log } [access] disallow * : all; allow localhost : enquire;
Additional resources
-
pmlogger(1)man page - System services and tools distributed with PCP
7.3. Enabling the pmlogger service
The pmlogger service must be started and enabled to log the metric values on the local machine.
This procedure describes how to enable the pmlogger service.
Prerequisites
- PCP is installed. For more information, see Installing and enabling PCP.
Procedure
Start and enable the
pmloggerservice:# systemctl start pmlogger # systemctl enable pmlogger
Verification steps
Verify if the
pmloggerservice is enabled:# pcp Performance Co-Pilot configuration on workstation: platform: Linux workstation 4.18.0-80.el8.x86_64 #1 SMP Wed Mar 13 12:02:46 UTC 2019 x86_64 hardware: 12 cpus, 2 disks, 1 node, 36023MB RAM timezone: CEST-2 services: pmcd pmcd: Version 4.3.0-1, 8 agents, 1 client pmda: root pmcd proc xfs linux mmv kvm jbd2 pmlogger: primary logger: /var/log/pcp/pmlogger/workstation/20190827.15.54
Additional resources
-
pmlogger(1)man page - System services and tools distributed with PCP
-
/var/lib/pcp/config/pmlogger/config.defaultfile
7.4. Setting up a client system for metrics collection
This procedure describes how to set up a client system so that a central server can collect metrics from clients running PCP.
Prerequisites
- PCP is installed. For more information, see Installing and enabling PCP.
Procedure
Install the
pcp-system-toolspackage:# yum install pcp-system-tools
Configure an IP address for
pmcd:# echo "-i 192.168.4.62" >>/etc/pcp/pmcd/pmcd.optionsReplace 192.168.4.62 with the IP address, the client should listen on.
By default,
pmcdis listening on the localhost.Configure the firewall to add the public
zonepermanently:# firewall-cmd --permanent --zone=public --add-port=44321/tcp success # firewall-cmd --reload success
Set an SELinux boolean:
# setsebool -P pcp_bind_all_unreserved_ports on
Enable the
pmcdandpmloggerservices:# systemctl enable pmcd pmlogger # systemctl restart pmcd pmlogger
Verification steps
Verify if the
pmcdis correctly listening on the configured IP address:# ss -tlp | grep 44321 LISTEN 0 5 127.0.0.1:44321 0.0.0.0:* users:(("pmcd",pid=151595,fd=6)) LISTEN 0 5 192.168.4.62:44321 0.0.0.0:* users:(("pmcd",pid=151595,fd=0)) LISTEN 0 5 [::1]:44321 [::]:* users:(("pmcd",pid=151595,fd=7))
Additional resources
-
pmlogger(1),firewall-cmd(1),ss(8), andsetsebool(8)man pages - System services and tools distributed with PCP
-
/var/lib/pcp/config/pmlogger/config.defaultfile
7.5. Setting up a central server to collect data
This procedure describes how to create a central server to collect metrics from clients running PCP.
Prerequisites
- PCP is installed. For more information, see Installing and enabling PCP.
- Client is configured for metrics collection. For more information, see Setting up a client system for metrics collection.
Procedure
Install the
pcp-system-toolspackage:# yum install pcp-system-tools
Create the
/etc/pcp/pmlogger/control.d/remotefile with the following content:# DO NOT REMOVE OR EDIT THE FOLLOWING LINE $version=1.1 192.168.4.13 n n PCP_ARCHIVE_DIR/rhel7u4a -r -T24h10m -c config.rhel7u4a 192.168.4.14 n n PCP_ARCHIVE_DIR/rhel6u10a -r -T24h10m -c config.rhel6u10a 192.168.4.62 n n PCP_ARCHIVE_DIR/rhel8u1a -r -T24h10m -c config.rhel8u1a
Replace 192.168.4.13, 192.168.4.14 and 192.168.4.62 with the client IP addresses.
NoteIn Red Hat Enterpirse Linux 8.0, 8.1 and 8.2 use the following format for remote hosts in the control file: PCP_LOG_DIR/pmlogger/host_name.
Enable the
pmcdandpmloggerservices:# systemctl enable pmcd pmlogger # systemctl restart pmcd pmlogger
Verification steps
Ensure that you can access the latest archive file from each directory:
# for i in /var/log/pcp/pmlogger/rhel*/*.0; do pmdumplog -L $i; done
Log Label (Log Format Version 2)
Performance metrics from host rhel6u10a.local
  commencing Mon Nov 25 21:55:04.851 2019
  ending     Mon Nov 25 22:06:04.874 2019
Archive timezone: JST-9
PID for pmlogger: 24002
Log Label (Log Format Version 2)
Performance metrics from host rhel7u4a
  commencing Tue Nov 26 06:49:24.954 2019
  ending     Tue Nov 26 07:06:24.979 2019
Archive timezone: CET-1
PID for pmlogger: 10941
[..]
The archive files from the
/var/log/pcp/pmlogger/directory can be used for further analysis and graphing.
Additional resources
-
pmlogger(1)man page - System services and tools distributed with PCP
-
/var/lib/pcp/config/pmlogger/config.defaultfile
7.6. Replaying the PCP log archives with pmrep
After recording the metric data, you can replay the PCP log archives. To export the logs to text files and import them into spreadsheets, use PCP utilities such as pcp2csv, pcp2xml, pmrep or pmlogsummary.
Using the pmrep tool, you can:
- View the log files
- Parse the selected PCP log archive and export the values into an ASCII table
- Extract the entire archive log or only select metric values from the log by specifying individual metrics on the command line
Prerequisites
- PCP is installed. For more information, see Installing and enabling PCP.
-
The
pmloggerservice is enabled. For more information, see Enabling the pmlogger service. Install the
pcp-system-toolspackage:# yum install pcp-gui
Procedure
Display the data on the metric:
$ pmrep --start @3:00am --archive 20211128 --interval 5seconds --samples 10 --output csv disk.dev.write
Time,"disk.dev.write-sda","disk.dev.write-sdb"
2021-11-28 03:00:00,,
2021-11-28 03:00:05,4.000,5.200
2021-11-28 03:00:10,1.600,7.600
2021-11-28 03:00:15,0.800,7.100
2021-11-28 03:00:20,16.600,8.400
2021-11-28 03:00:25,21.400,7.200
2021-11-28 03:00:30,21.200,6.800
2021-11-28 03:00:35,21.000,27.600
2021-11-28 03:00:40,12.400,33.800
2021-11-28 03:00:45,9.800,20.600
The mentioned example displays the data on the
disk.dev.writemetric collected in an archive at a 5 second interval in comma-separated-value format.NoteReplace
20211128in this example with a filename containing thepmloggerarchive you want to display data for.
Additional resources
-
pmlogger(1),pmrep(1), andpmlogsummary(1)man pages - System services and tools distributed with PCP
Chapter 8. Monitoring performance with Performance Co-Pilot
Performance Co-Pilot (PCP) is a suite of tools, services, and libraries for monitoring, visualizing, storing, and analyzing system-level performance measurements.
As a system administrator, you can monitor the system’s performance using the PCP application in Red Hat Enterprise Linux 8.
8.1. Monitoring postfix with pmda-postfix
This procedure describes how to monitor performance metrics of the postfix mail server with pmda-postfix. It helps to check how many emails are received per second.
Prerequisites
- PCP is installed. For more information, see Installing and enabling PCP.
-
The
pmloggerservice is enabled. For more information, see Enabling the pmlogger service.
Procedure
Install the following packages:
Install the
pcp-system-tools:# yum install pcp-system-tools
Install the
pmda-postfixpackage to monitorpostfix:# yum install pcp-pmda-postfix postfix
Install the logging daemon:
# yum install rsyslog
Install the mail client for testing:
# yum install mutt
Enable the
postfixandrsyslogservices:# systemctl enable postfix rsyslog # systemctl restart postfix rsyslog
Enable the SELinux boolean, so that
pmda-postfixcan access the required log files:# setsebool -P pcp_read_generic_logs=on
Install the
PMDA:# cd /var/lib/pcp/pmdas/postfix/ # ./Install Updating the Performance Metrics Name Space (PMNS) ... Terminate PMDA if already installed ... Updating the PMCD control file, and notifying PMCD ... Waiting for pmcd to terminate ... Starting pmcd ... Check postfix metrics have appeared ... 7 metrics and 58 values
Verification steps
Verify the
pmda-postfixoperation:echo testmail | mutt root
Verify the available metrics:
# pminfo postfix

postfix.received
postfix.sent
postfix.queues.incoming
postfix.queues.maildrop
postfix.queues.hold
postfix.queues.deferred
postfix.queues.active
Additional resources
-
rsyslogd(8),postfix(1), andsetsebool(8)man pages - System services and tools distributed with PCP
8.2. Visually tracing PCP log archives with the PCP Charts application
After recording metric data, you can replay the PCP log archives as graphs. The metrics are sourced from one or more live hosts with alternative options to use metric data from PCP log archives as a source of historical data. To customize the PCP Charts application interface to display the data from the performance metrics, you can use line plot, bar graphs, or utilization graphs.
Using the PCP Charts application, you can:
- Replay the data in the PCP Charts application application and use graphs to visualize the retrospective data alongside live data of the system.
- Plot performance metric values into graphs.
- Display multiple charts simultaneously.
Prerequisites
- PCP is installed. For more information, see Installing and enabling PCP.
-
Logged performance data with the
pmlogger. For more information, see Logging performance data with pmlogger. Install the
pcp-guipackage:# yum install pcp-gui
Procedure
Launch the PCP Charts application from the command line:
# pmchart
Figure 8.1. PCP Charts application

The
pmtimeserver settings are located at the bottom. The start and pause button allows you to control:- The interval in which PCP polls the metric data
- The date and time for the metrics of historical data
- Click File and then New Chart to select metric from both the local machine and remote machines by specifying their host name or address. Advanced configuration options include the ability to manually set the axis values for the chart, and to manually choose the color of the plots.
Record the views created in the PCP Charts application:
Following are the options to take images or record the views created in the PCP Charts application:
- Click File and then Export to save an image of the current view.
- Click Record and then Start to start a recording. Click Record and then Stop to stop the recording. After stopping the recording, the recorded metrics are archived to be viewed later.
Optional: In the PCP Charts application, the main configuration file, known as the view, allows the metadata associated with one or more charts to be saved. This metadata describes all chart aspects, including the metrics used and the chart columns. Save the custom view configuration by clicking File and then Save View, and load the view configuration later.
The following example of the PCP Charts application view configuration file describes a stacking chart graph showing the total number of bytes read and written to the given XFS file system
loop1:#kmchart version 1 chart title "Filesystem Throughput /loop1" style stacking antialiasing off plot legend "Read rate" metric xfs.read_bytes instance "loop1" plot legend "Write rate" metric xfs.write_bytes instance "loop1"
Additional resources
-
pmchart(1)andpmtime(1)man pages - System services and tools distributed with PCP
8.3. Collecting data from SQL server using PCP
With Red Hat Enterprise Linux 8.2 or later, the SQL Server agent is available in Performance Co-Pilot (PCP), which helps you to monitor and analyze database performance issues.
This procedure describes how to collect data for Microsoft SQL Server via pcp on your system.
Prerequisites
- You have installed Microsoft SQL Server for Red Hat Enterprise Linux and established a 'trusted' connection to an SQL server.
- You have installed the Microsoft ODBC driver for SQL Server for Red Hat Enterprise Linux.
Procedure
Install PCP:
# yum install pcp-zeroconf
Install packages required for the
pyodbcdriver:# yum install gcc-c++ python3-devel unixODBC-devel # yum install python3-pyodbc
Install the
mssqlagent:Install the Microsoft SQL Server domain agent for PCP:
# yum install pcp-pmda-mssql
Edit the
/etc/pcp/mssql/mssql.conffile to configure the SQL server account’s username and password for themssqlagent. Ensure that the account you configure has access rights to performance data.username: user_name password: user_password
Replace user_name with the SQL Server account and user_password with the SQL Server user password for this account.
Install the agent:
# cd /var/lib/pcp/pmdas/mssql
# ./Install
Updating the Performance Metrics Name Space (PMNS) ...
Terminate PMDA if already installed ...
Updating the PMCD control file, and notifying PMCD ...
Check mssql metrics have appeared ... 168 metrics and 598 values
[...]
Verification steps
Using the
pcpcommand, verify if the SQL Server PMDA (mssql) is loaded and running:$ pcp Performance Co-Pilot configuration on rhel.local: platform: Linux rhel.local 4.18.0-167.el8.x86_64 #1 SMP Sun Dec 15 01:24:23 UTC 2019 x86_64 hardware: 2 cpus, 1 disk, 1 node, 2770MB RAM timezone: PDT+7 services: pmcd pmproxy pmcd: Version 5.0.2-1, 12 agents, 4 clients pmda: root pmcd proc pmproxy xfs linux nfsclient mmv kvm mssql jbd2 dm pmlogger: primary logger: /var/log/pcp/pmlogger/rhel.local/20200326.16.31 pmie: primary engine: /var/log/pcp/pmie/rhel.local/pmie.logView the complete list of metrics that PCP can collect from the SQL Server:
# pminfo mssql
After viewing the list of metrics, you can report the rate of transactions. For example, to report on the overall transaction count per second, over a five second time window:
# pmval -t 1 -T 5 mssql.databases.transactions
-
View the graphical chart of these metrics on your system by using the
pmchartcommand. For more information, see Visually tracing PCP log archives with the PCP Charts application.
Additional resources
-
pcp(1),pminfo(1),pmval(1),pmchart(1), andpmdamssql(1)man pages - Performance Co-Pilot for Microsoft SQL Server with RHEL 8.2 Red Hat Developers Blog post
Chapter 9. Performance analysis of XFS with PCP
The XFS PMDA ships as part of the pcp package and is enabled by default during the installation. It is used to gather performance metric data of XFS file systems in Performance Co-Pilot (PCP).
You can use PCP to analyze XFS file system’s performance.
9.1. Installing XFS PMDA manually
If the XFS PMDA is not listed in the pcp configuration output, install the PMDA agent manually.
This procedure describes how to manually install the PMDA agent.
Prerequisites
- PCP is installed. For more information, see Installing and enabling PCP.
Procedure
Navigate to the xfs directory:
# cd /var/lib/pcp/pmdas/xfs/
Install the XFS PMDA manually:
xfs]# ./Install

You will need to choose an appropriate configuration for install of
the “xfs” Performance Metrics Domain Agent (PMDA).

  collector     collect performance statistics on this system
  monitor       allow this system to monitor local and/or remote systems
  both          collector and monitor configuration for this system

Please enter c(ollector) or m(onitor) or (both) [b]
Updating the Performance Metrics Name Space (PMNS) ...
Terminate PMDA if already installed ...
Updating the PMCD control file, and notifying PMCD ...
Waiting for pmcd to terminate ...
Starting pmcd ...
Check xfs metrics have appeared ... 149 metrics and 149 values
Select the intended PMDA role by entering
cfor collector,mfor monitor, orbfor both. The PMDA installation script prompts you to specify one of the following PMDA roles:-
The
collectorrole allows the collection of performance metrics on the current system The
monitorrole allows the system to monitor local systems, remote systems, or bothThe default option is both
collectorandmonitor, which allows the XFS PMDA to operate correctly in most scenarios.
-
The
Verification steps
Verify that the
pmcdprocess is running on the host and the XFS PMDA is listed as enabled in the configuration:# pcp Performance Co-Pilot configuration on workstation: platform: Linux workstation 4.18.0-80.el8.x86_64 #1 SMP Wed Mar 13 12:02:46 UTC 2019 x86_64 hardware: 12 cpus, 2 disks, 1 node, 36023MB RAM timezone: CEST-2 services: pmcd pmcd: Version 4.3.0-1, 8 agents pmda: root pmcd proc xfs linux mmv kvm jbd2
Additional resources
-
pmcd(1)man page - System services and tools distributed with PCP
9.2. Examining XFS performance metrics with pminfo
PCP enables XFS PMDA to allow the reporting of certain XFS metrics per each of the mounted XFS file systems. This makes it easier to pinpoint specific mounted file system issues and evaluate performance.
The pminfo command provides per-device XFS metrics for each mounted XFS file system.
This procedure displays a list of all available metrics provided by the XFS PMDA.
Prerequisites
- PCP is installed. For more information, see Installing and enabling PCP.
Procedure
Display the list of all available metrics provided by the XFS PMDA:
# pminfo xfs
Display information for the individual metrics. The following examples examine specific XFS
readandwritemetrics using thepminfotool:Display a short description of the
xfs.write_bytesmetric:# pminfo --oneline xfs.write_bytes xfs.write_bytes [number of bytes written in XFS file system write operations]
Display a long description of the
xfs.read_bytesmetric:# pminfo --helptext xfs.read_bytes xfs.read_bytes Help: This is the number of bytes read via read(2) system calls to files in XFS file systems. It can be used in conjunction with the read_calls count to calculate the average size of the read operations to file in XFS file systems.
Obtain the current performance value of the
xfs.read_bytesmetric:# pminfo --fetch xfs.read_bytes xfs.read_bytes value 4891346238Obtain per-device XFS metrics with
pminfo:# pminfo --fetch --oneline xfs.perdev.read xfs.perdev.write xfs.perdev.read [number of XFS file system read operations] inst [0 or "loop1"] value 0 inst [0 or "loop2"] value 0 xfs.perdev.write [number of XFS file system write operations] inst [0 or "loop1"] value 86 inst [0 or "loop2"] value 0
Additional resources
-
pminfo(1)man page - PCP metric groups for XFS
- Per-device PCP metric groups for XFS
9.3. Resetting XFS performance metrics with pmstore
With PCP, you can modify the values of certain metrics, especially if the metric acts as a control variable, such as the xfs.control.reset metric. To modify a metric value, use the pmstore tool.
This procedure describes how to reset XFS metrics using the pmstore tool.
Prerequisites
- PCP is installed. For more information, see Installing and enabling PCP.
Procedure
Display the value of a metric:
$ pminfo -f xfs.write

xfs.write
    value 325262
Reset all the XFS metrics:
# pmstore xfs.control.reset 1

xfs.control.reset old value=0 new value=1
Verification steps
View the information after resetting the metric:
$ pminfo --fetch xfs.write

xfs.write
    value 0
Additional resources
-
pmstore(1)andpminfo(1)man pages - System services and tools distributed with PCP
- PCP metric groups for XFS
9.4. PCP metric groups for XFS
The following table describes the available PCP metric groups for XFS.
Table 9.1. Metric groups for XFS
| Metric Group | Metrics provided |
|
| General XFS metrics including the read and write operation counts, read and write byte counts. Along with counters for the number of times inodes are flushed, clustered and number of failure to cluster. |
|
| Range of metrics regarding the allocation of objects in the file system, these include number of extent and block creations/frees. Allocation tree lookup and compares along with extend record creation and deletion from the btree. |
|
| Metrics include the number of block map read/write and block deletions, extent list operations for insertion, deletions and lookups. Also operations counters for compares, lookups, insertions and deletion operations from the blockmap. |
|
| Counters for directory operations on XFS file systems for creation, entry deletions, count of “getdent” operations. |
|
| Counters for the number of meta-data transactions, these include the count for the number of synchronous and asynchronous transactions along with the number of empty transactions. |
|
| Counters for the number of times that the operating system looked for an XFS inode in the inode cache with different outcomes. These count cache hits, cache misses, and so on. |
|
| Counters for the number of log buffer writes over XFS file sytems includes the number of blocks written to disk. Metrics also for the number of log flushes and pinning. |
|
| Counts for the number of bytes of file data flushed out by the XFS flush deamon along with counters for number of buffers flushed to contiguous and non-contiguous space on disk. |
|
| Counts for the number of attribute get, set, remove and list operations over all XFS file systems. |
|
| Metrics for quota operation over XFS file systems, these include counters for number of quota reclaims, quota cache misses, cache hits and quota data reclaims. |
|
| Range of metrics regarding XFS buffer objects. Counters include the number of requested buffer calls, successful buffer locks, waited buffer locks, miss_locks, miss_retries and buffer hits when looking up pages. |
|
| Metrics regarding the operations of the XFS btree. |
|
| Configuration metrics which are used to reset the metric counters for the XFS stats. Control metrics are toggled by means of the pmstore tool. |
9.5. Per-device PCP metric groups for XFS
The following table describes the available per-device PCP metric group for XFS.
Table 9.2. Per-device PCP metric groups for XFS
| Metric Group | Metrics provided |
|
| General XFS metrics including the read and write operation counts, read and write byte counts. Along with counters for the number of times inodes are flushed, clustered and number of failure to cluster. |
|
| Range of metrics regarding the allocation of objects in the file system, these include number of extent and block creations/frees. Allocation tree lookup and compares along with extend record creation and deletion from the btree. |
|
| Metrics include the number of block map read/write and block deletions, extent list operations for insertion, deletions and lookups. Also operations counters for compares, lookups, insertions and deletion operations from the blockmap. |
|
| Counters for directory operations of XFS file systems for creation, entry deletions, count of “getdent” operations. |
|
| Counters for the number of meta-data transactions, these include the count for the number of synchronous and asynchronous transactions along with the number of empty transactions. |
|
| Counters for the number of times that the operating system looked for an XFS inode in the inode cache with different outcomes. These count cache hits, cache misses, and so on. |
|
| Counters for the number of log buffer writes over XFS filesytems includes the number of blocks written to disk. Metrics also for the number of log flushes and pinning. |
|
| Counts for the number of bytes of file data flushed out by the XFS flush deamon along with counters for number of buffers flushed to contiguous and non-contiguous space on disk. |
|
| Counts for the number of attribute get, set, remove and list operations over all XFS file systems. |
|
| Metrics for quota operation over XFS file systems, these include counters for number of quota reclaims, quota cache misses, cache hits and quota data reclaims. |
|
| Range of metrics regarding XFS buffer objects. Counters include the number of requested buffer calls, successful buffer locks, waited buffer locks, miss_locks, miss_retries and buffer hits when looking up pages. |
|
| Metrics regarding the operations of the XFS btree. |
Chapter 10. Setting up graphical representation of PCP metrics
Using a combination of pcp, grafana, pcp redis, pcp bpftrace, and pcp vector provides provides graphical representation of the live data or data collected by Performance Co-Pilot (PCP).
10.1. Setting up PCP with pcp-zeroconf
This procedure describes how to set up PCP on a system with the pcp-zeroconf package. Once the pcp-zeroconf package is installed, the system records the default set of metrics into archived files.
Procedure
Install the
pcp-zeroconfpackage:# yum install pcp-zeroconf
Verification steps
Ensure that the
pmloggerservice is active, and starts archiving the metrics:# pcp | grep pmlogger pmlogger: primary logger: /var/log/pcp/pmlogger/localhost.localdomain/20200401.00.12
Additional resources
-
pmloggerman page - Monitoring performance with Performance Co-Pilot
10.2. Setting up a grafana-server
Grafana generates graphs that are accessible from a browser. The grafana-server is a back-end server for the Grafana dashboard. It listens, by default, on all interfaces, and provides web services accessed through the web browser. The grafana-pcp plugin interacts with the pmproxy protocol in the backend.
This procedure describes how to set up a grafana-server.
Prerequisites
- PCP is configured. For more information, see Setting up PCP with pcp-zeroconf.
Procedure
Install the following packages:
# yum install grafana grafana-pcp
Restart and enable the following service:
# systemctl restart grafana-server
# systemctl enable grafana-server
Open the server’s firewall for network traffic to the Grafana service.
# firewall-cmd --permanent --add-service=grafana
success

# firewall-cmd --reload
success
Verification steps
Ensure that the
grafana-serveris listening and responding to requests:# ss -ntlp | grep 3000 LISTEN 0 128 *:3000 *:* users:(("grafana-server",pid=19522,fd=7))Ensure that the
grafana-pcpplugin is installed:# grafana-cli plugins ls | grep performancecopilot-pcp-app performancecopilot-pcp-app @ 3.1.0
Additional resources
-
pmproxy(1)andgrafana-serverman pages
10.3. Accessing the Grafana web UI
This procedure describes how to access the Grafana web interface.
Using the Grafana web interface, you can:
- add PCP Redis, PCP bpftrace, and PCP Vector data sources
- create dashboard
- view an overview of any useful metrics
- create alerts in PCP Redis
Prerequisites
- PCP is configured. For more information, see Setting up PCP with pcp-zeroconf.
-
The
grafana-serveris configured. For more information, see Setting up a grafana-server.
Procedure
On the client system, open a browser and access the
grafana-serveron port3000, using http://192.0.2.0:3000 link.Replace 192.0.2.0 with your machine IP.
For the first login, enter admin in both the Email or username and Password field.
Grafana prompts to set a New password to create a secured account. If you want to set it later, click Skip.
-
From the menu, hover over the
 Configuration icon and then click Plugins.
- In the Plugins tab, type performance co-pilot in the Search by name or type text box and then click Performance Co-Pilot (PCP) plugin.
- In the Plugins / Performance Co-Pilot pane, click .
Click Grafana
 icon. The Grafana Home page is displayed.
Figure 10.1. Home Dashboard
 Note
NoteThe top corner of the screen has a similar
 icon, but it controls the general Dashboard settings.
In the Grafana Home page, click Add your first data source to add PCP Redis, PCP bpftrace, and PCP Vector data sources. For more information about adding data source, see:
- To add pcp redis data source, view default dashboard, create a panel, and an alert rule, see Creating panels and alert in PCP Redis data source.
- To add pcp bpftrace data source and view the default dashboard, see Viewing the PCP bpftrace System Analysis dashboard.
- To add pcp vector data source, view the default dashboard, and to view the vector checklist, see Viewing the PCP Vector Checklist.
-
Optional: From the menu, hover over the admin profile
 icon to change the Preferences including Edit Profile, Change Password, or to Sign out.
Additional resources
-
grafana-cliandgrafana-serverman pages
10.4. Configuring PCP Redis
Use the PCP Redis data source to:
- View data archives
- Query time series using pmseries language
- Analyze data across multiple hosts
Prerequisites
- PCP is configured. For more information, see Setting up PCP with pcp-zeroconf.
-
The
grafana-serveris configured. For more information, see Setting up a grafana-server. -
Mail transfer agent, for example,
sendmailorpostfixis installed and configured.
Procedure
Install the
redispackage:# yum module install redis:6
NoteFrom Red Hat Enterprise Linux 8.4, Redis 6 is supported but the
yum updatecommand does not update Redis 5 to Redis 6. To update from Redis 5 to Redis 6, run:# yum module switch-to redis:6
Start and enable the following services:
# systemctl start pmproxy redis
# systemctl enable pmproxy redis
Restart the
grafana-server:# systemctl restart grafana-server
Verification steps
Ensure that the
pmproxyandredisare working:# pmseries disk.dev.read 2eb3e58d8f1e231361fb15cf1aa26fe534b4d9df
This command does not return any data if the
redispackage is not installed.
Additional resources
-
pmseries(1)man page
10.5. Creating panels and alert in PCP Redis data source
After adding the PCP Redis data source, you can view the dashboard with an overview of useful metrics, add a query to visualize the load graph, and create alerts that help you to view the system issues after they occur.
Prerequisites
- The PCP Redis is configured. For more information, see Configuring PCP Redis.
-
The
grafana-serveris accessible. For more information, see Accessing the Grafana web UI.
Procedure
- Log into the Grafana web UI.
- In the Grafana Home page, click Add your first data source.
- In the Add data source pane, type redis in the Filter by name or type text box and then click PCP Redis.
In the Data Sources / PCP Redis pane, perform the following:
-
Add
http://localhost:44322in the URL field and then click . Click → → to see a dashboard with an overview of any useful metrics.
Figure 10.2. PCP Redis: Host Overview

-
Add
Add a new panel:
-
From the menu, hover over the
 → → to add a panel.
-
In the Query tab, select the PCP Redis from the query list instead of the selected default option and in the text field of A, enter metric, for example,
kernel.all.loadto visualize the kernel load graph. - Optional: Add Panel title and Description, and update other options from the Settings.
- Click to apply changes and save the dashboard. Add Dashboard name.
Click to apply changes and go back to the dashboard.
Figure 10.3. PCP Redis query panel
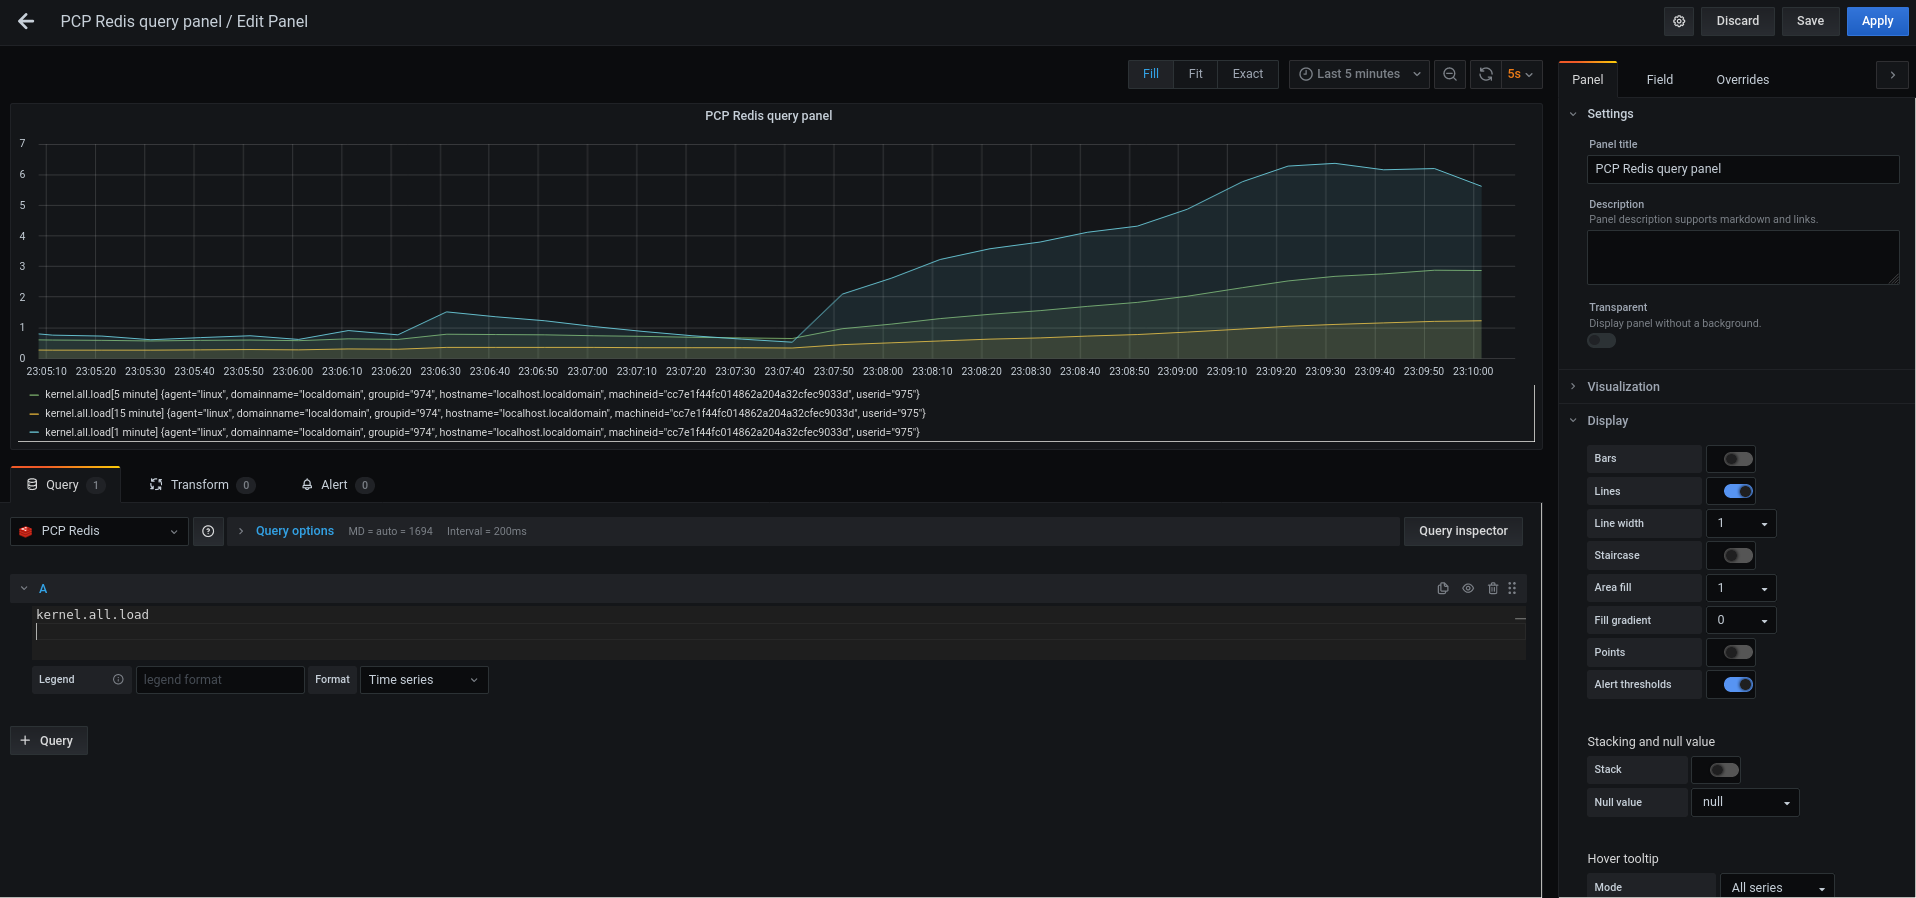
-
From the menu, hover over the
Create an alert rule:
-
In the PCP Redis query panel, click
 Alert and then click Create Alert.
- Edit the Name, Evaluate query, and For fields from the Rule, and specify the Conditions for your alert.
Click to apply changes and save the dashboard. Click to apply changes and go back to the dashboard.
Figure 10.4. Creating alerts in the PCP Redis panel
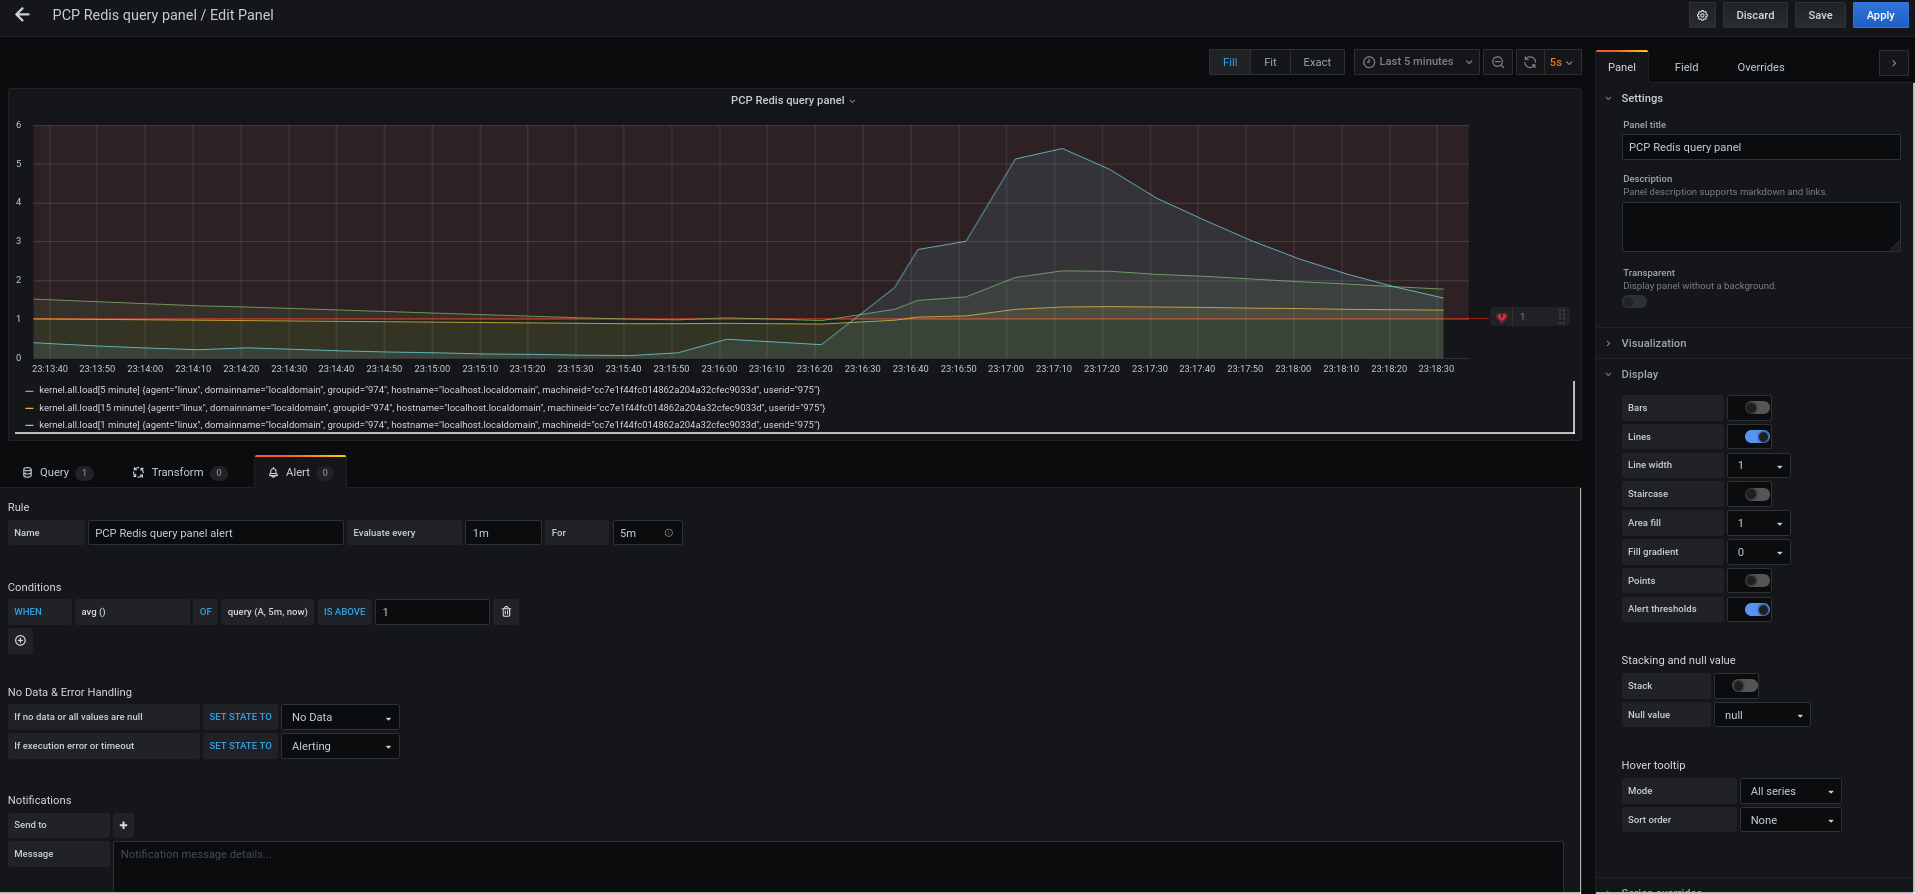
- Optional: In the same panel, scroll down and click icon to delete the created rule.
Optional: From the menu, click
 Alerting icon to view the created alert rules with different alert statuses, to edit the alert rule, or to pause the existing rule from the Alert Rules tab.
To add a notification channel for the created alert rule to receive an alert notification from Grafana, see Adding notification channels for alerts.
-
In the PCP Redis query panel, click
10.6. Adding notification channels for alerts
By adding notification channels, you can receive an alert notification from Grafana whenever the alert rule conditions are met and the system needs further monitoring.
You can receive these alerts after selecting any one type from the supported list of notifiers, which includes DingDing, Discord, Email, Google Hangouts Chat, HipChat, Kafka REST Proxy, LINE, Microsoft Teams, OpsGenie, PagerDuty, Prometheus Alertmanager, Pushover, Sensu, Slack, Telegram, Threema Gateway, VictorOps, and webhook.
Prerequisites
-
The
grafana-serveris accessible. For more information, see Accessing the Grafana web UI. - An alert rule is created. For more information, see Creating panels and alert in PCP Redis data source.
Configure SMTP and add a valid sender’s email address in the
grafana/grafana.inifile:# vi /etc/grafana/grafana.ini [smtp] enabled = true from_address = abc@gmail.comReplace abc@gmail.com by a valid email address.
Restart
grafana-server# systemctl restart grafana-server.service
Procedure
-
From the menu, hover over the
→ → .
In the Add notification channel details pane, perform the following:
- Enter your name in the Name text box
-
Select the communication Type, for example, Email and enter the email address. You can add multiple email addresses using the
;separator. - Optional: Configure Optional Email settings and Notification settings.
- Click .
Select a notification channel in the alert rule:
-
From the menu, hover over the
Alerting icon and then click Alert rules.
- From the Alert Rules tab, click the created alert rule.
- On the Notifications tab, select your notification channel name from the Send to option, and then add an alert message.
- Click .
-
From the menu, hover over the
Additional resources
10.7. Setting up authentication between PCP components
You can setup authentication using the scram-sha-256 authentication mechanism, which is supported by PCP through the Simple Authentication Security Layer (SASL) framework.
From Red Hat Enterprise Linux 8.3, PCP supports the scram-sha-256 authentication mechanism.
Procedure
Install the
saslframework for thescram-sha-256authentication mechanism:# yum install cyrus-sasl-scram cyrus-sasl-lib
Specify the supported authentication mechanism and the user database path in the
pmcd.conffile:# vi /etc/sasl2/pmcd.conf mech_list: scram-sha-256 sasldb_path: /etc/pcp/passwd.db
Create a new user:
# useradd -r metricsReplace metrics by your user name.
Add the created user in the user database:
# saslpasswd2 -a pmcd metrics

Password:
Again (for verification):
To add the created user, you are required to enter the metrics account password.
Set the permissions of the user database:
# chown root:pcp /etc/pcp/passwd.db
# chmod 640 /etc/pcp/passwd.db
Restart the
pmcdservice:# systemctl restart pmcd
Verification steps
Verify the
saslconfiguration:# pminfo -f -h "pcp://127.0.0.1?username=metrics" disk.dev.read Password: disk.dev.read inst [0 or "sda"] value 19540
Additional resources
-
saslauthd(8),pminfo(1), andsha256man pages - How can I setup authentication between PCP components, like PMDAs and pmcd in RHEL 8.2?
10.8. Installing PCP bpftrace
Install the PCP bpftrace agent to introspect a system and to gather metrics from the kernel and user-space tracepoints.
The bpftrace agent uses bpftrace scripts to gather the metrics. The bpftrace scripts use the enhanced Berkeley Packet Filter (eBPF).
This procedure describes how to install a pcp bpftrace.
Prerequisites
- PCP is configured. For more information, see Setting up PCP with pcp-zeroconf.
-
The
grafana-serveris configured. For more information, see Setting up a grafana-server. -
The
scram-sha-256authentication mechanism is configured. For more information, see Setting up authentication between PCP components.
Procedure
Install the
pcp-pmda-bpftracepackage:# yum install pcp-pmda-bpftrace
Edit the
bpftrace.conffile and add the user that you have created in the {setting-up-authentication-between-pcp-components}:# vi /var/lib/pcp/pmdas/bpftrace/bpftrace.conf [dynamic_scripts] enabled = true auth_enabled = true allowed_users = root,metricsReplace metrics by your user name.
Install
bpftracePMDA:# cd /var/lib/pcp/pmdas/bpftrace/ # ./Install Updating the Performance Metrics Name Space (PMNS) ... Terminate PMDA if already installed ... Updating the PMCD control file, and notifying PMCD ... Check bpftrace metrics have appeared ... 7 metrics and 6 values
The
pmda-bpftraceis now installed, and can only be used after authenticating your user. For more information, see Viewing the PCP bpftrace System Analysis dashboard.
Additional resources
-
pmdabpftrace(1)andbpftraceman pages
10.9. Viewing the PCP bpftrace System Analysis dashboard
Using the PCP bpftrace data source, you can access the live data from sources which are not available as normal data from the pmlogger or archives
In the PCP bpftrace data source, you can view the dashboard with an overview of useful metrics.
Prerequisites
- The PCP bpftrace is installed. For more information, see Installing PCP bpftrace.
-
The
grafana-serveris accessible. For more information, see Accessing the Grafana web UI.
Procedure
- Log into the Grafana web UI.
- In the Grafana Home page, click Add your first data source.
- In the Add data source pane, type bpftrace in the Filter by name or type text box and then click PCP bpftrace.
In the Data Sources / PCP bpftrace pane, perform the following:
-
Add
http://localhost:44322in the URL field. - Toggle the Basic Auth option and add the created user credentials in the User and Password field.
Click .
Figure 10.5. Adding PCP bpftrace in the data source
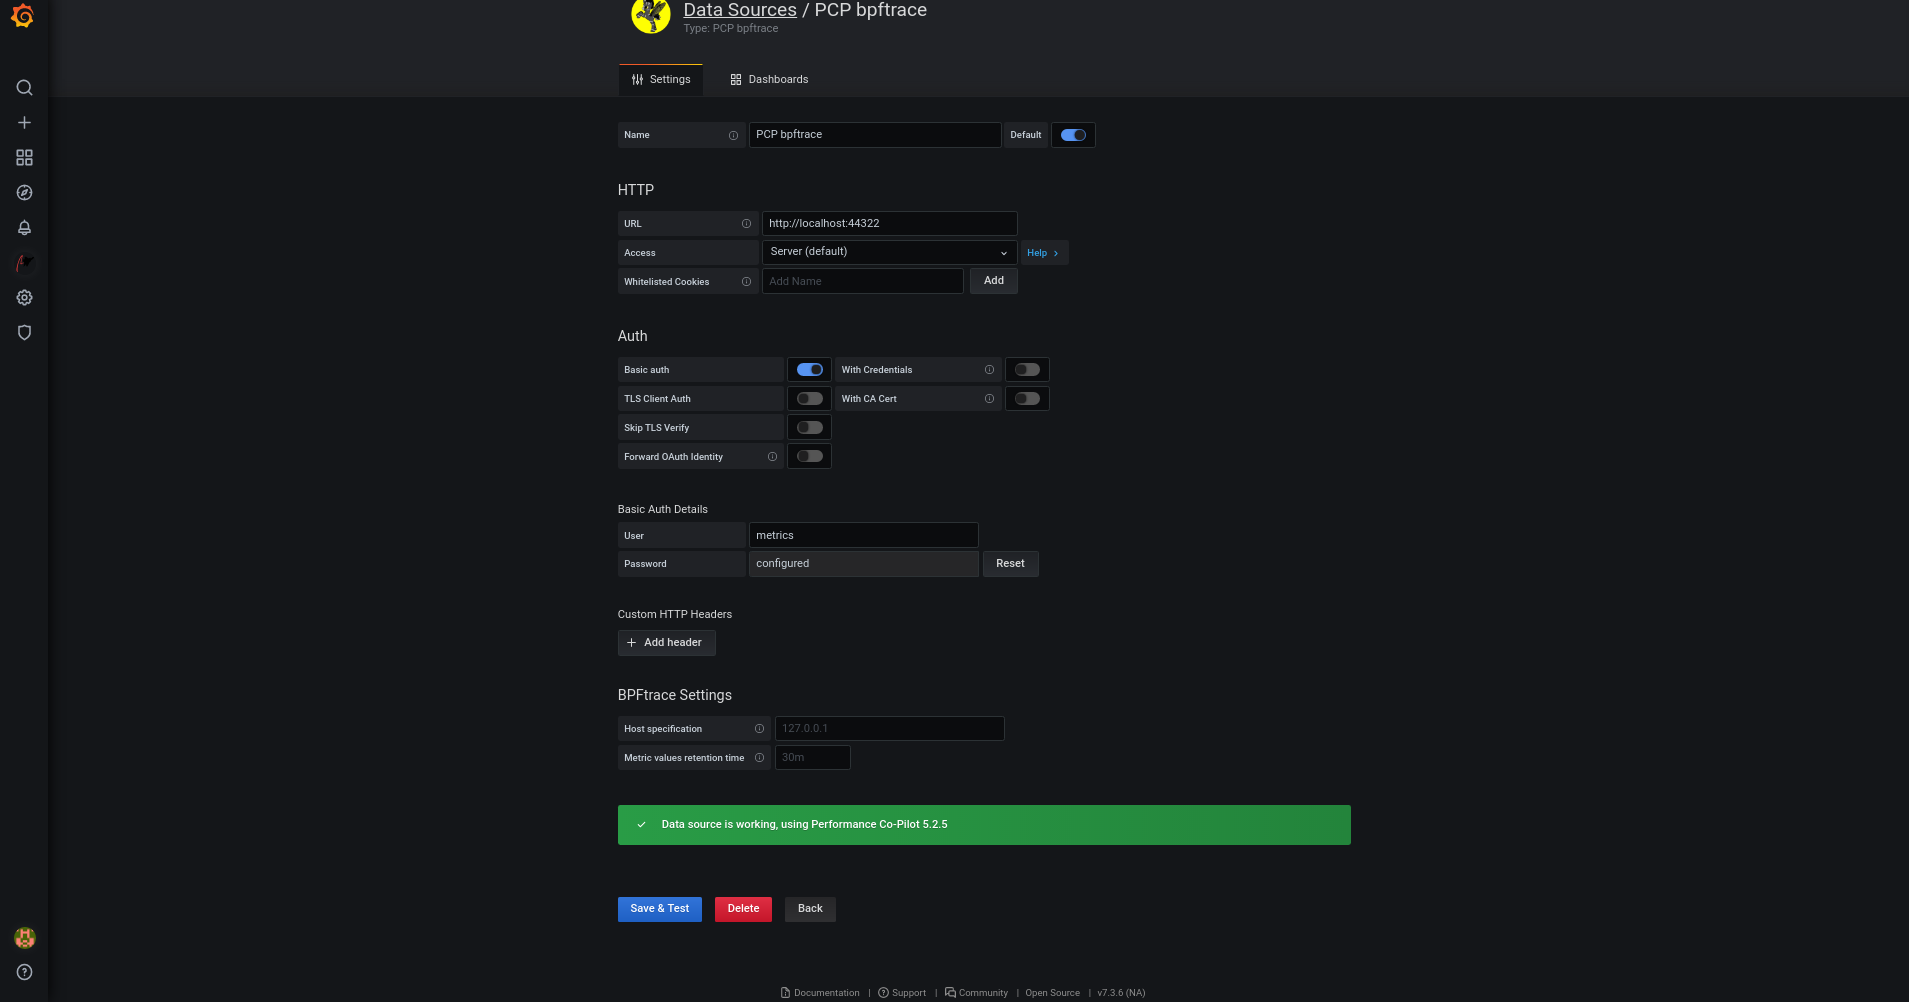
Click → → to see a dashboard with an overview of any useful metrics.
Figure 10.6. PCP bpftrace: System Analysis

-
Add
10.10. Installing PCP Vector
This procedure describes how to install a pcp vector.
Prerequisites
- PCP is configured. For more information, see Setting up PCP with pcp-zeroconf.
-
The
grafana-serveris configured. For more information, see Setting up a grafana-server.
Procedure
Install the
pcp-pmda-bccpackage:# yum install pcp-pmda-bcc
Install the
bccPMDA:# cd /var/lib/pcp/pmdas/bcc # ./Install [Wed Apr 1 00:27:48] pmdabcc(22341) Info: Initializing, currently in 'notready' state. [Wed Apr 1 00:27:48] pmdabcc(22341) Info: Enabled modules: [Wed Apr 1 00:27:48] pmdabcc(22341) Info: ['biolatency', 'sysfork', [...] Updating the Performance Metrics Name Space (PMNS) ... Terminate PMDA if already installed ... Updating the PMCD control file, and notifying PMCD ... Check bcc metrics have appeared ... 1 warnings, 1 metrics and 0 values
Additional resources
-
pmdabcc(1)man page
10.11. Viewing the PCP Vector Checklist
The PCP Vector data source displays live metrics and uses the pcp metrics. It analyzes data for individual hosts.
After adding the PCP Vector data source, you can view the dashboard with an overview of useful metrics and view the related troubleshooting or reference links in the checklist.
Prerequisites
- The PCP Vector is installed. For more information, see Installing PCP Vector.
-
The
grafana-serveris accessible. For more information, see Accessing the Grafana web UI.
Procedure
- Log into the Grafana web UI.
- In the Grafana Home page, click Add your first data source.
- In the Add data source pane, type vector in the Filter by name or type text box and then click PCP Vector.
In the Data Sources / PCP Vector pane, perform the following:
-
Add
http://localhost:44322in the URL field and then click . Click → → to see a dashboard with an overview of any useful metrics.
Figure 10.7. PCP Vector: Host Overview
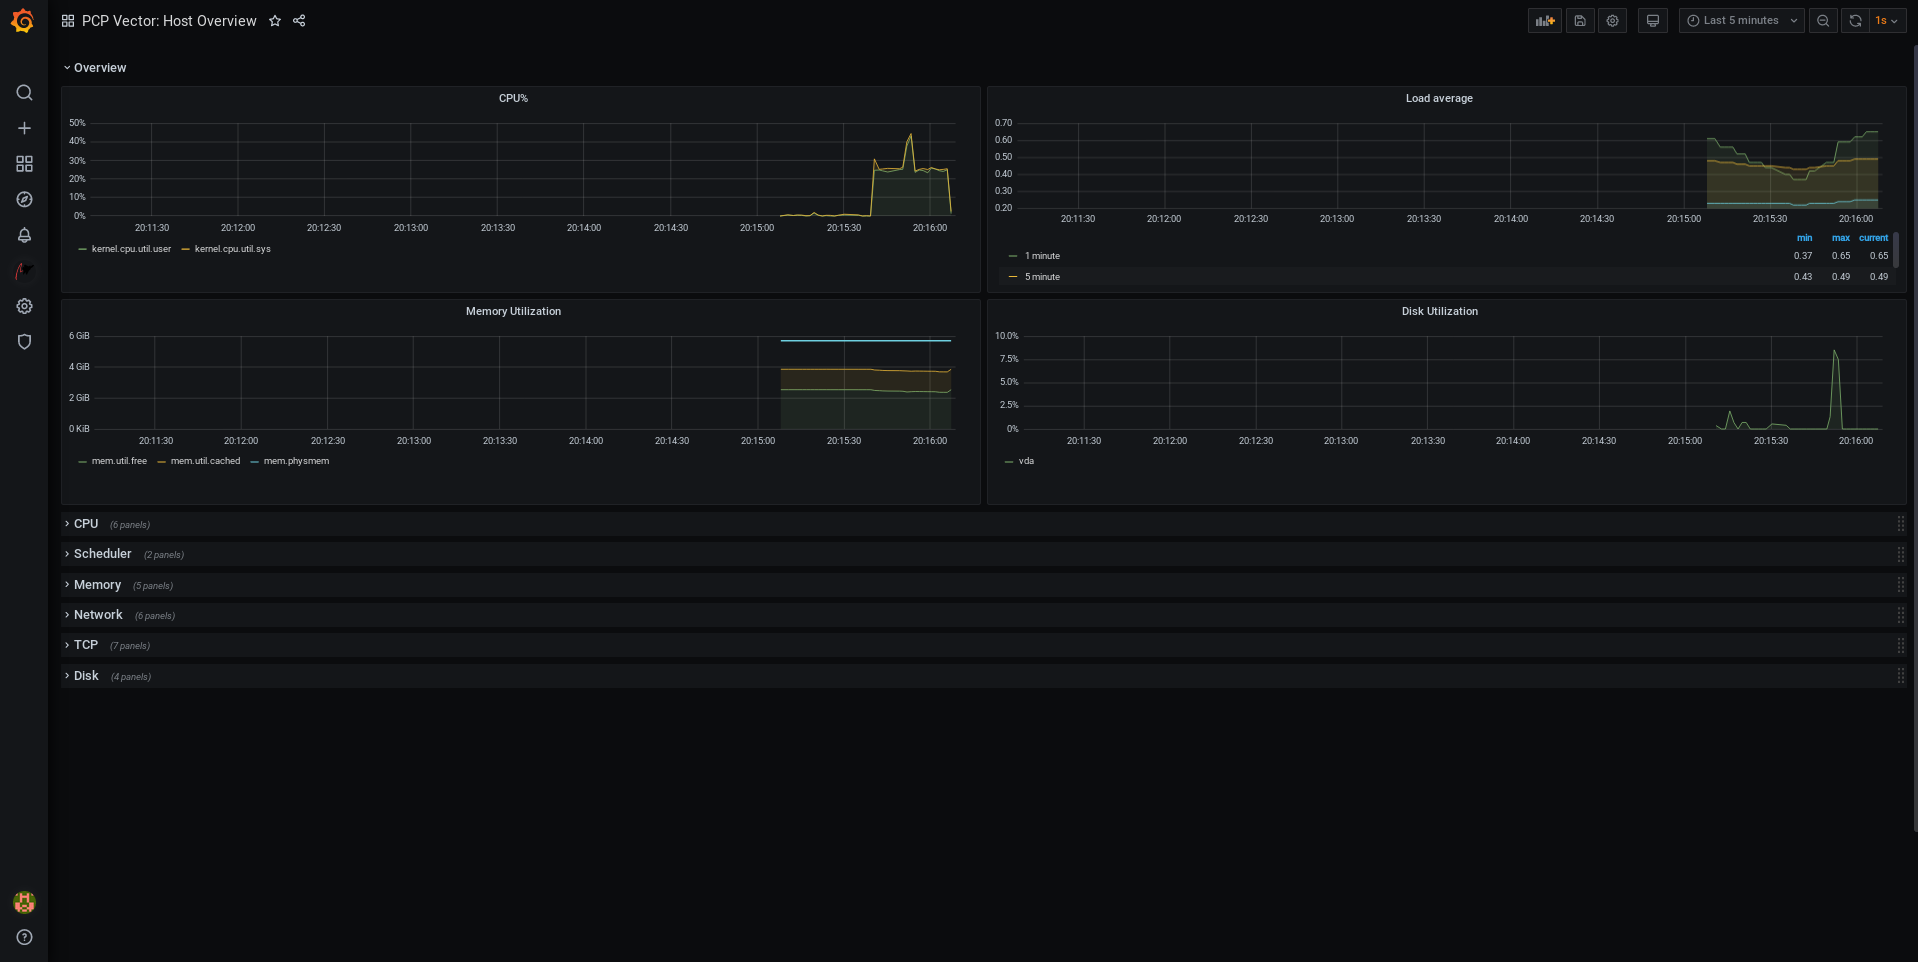
-
Add
From the menu, hover over the
 Performance Co-Pilot plugin and then click PCP Vector Checklist.
In the PCP checklist, click
 help or
 warning icon to view the related troubleshooting or reference links.
Figure 10.8. Performance Co-Pilot / PCP Vector Checklist
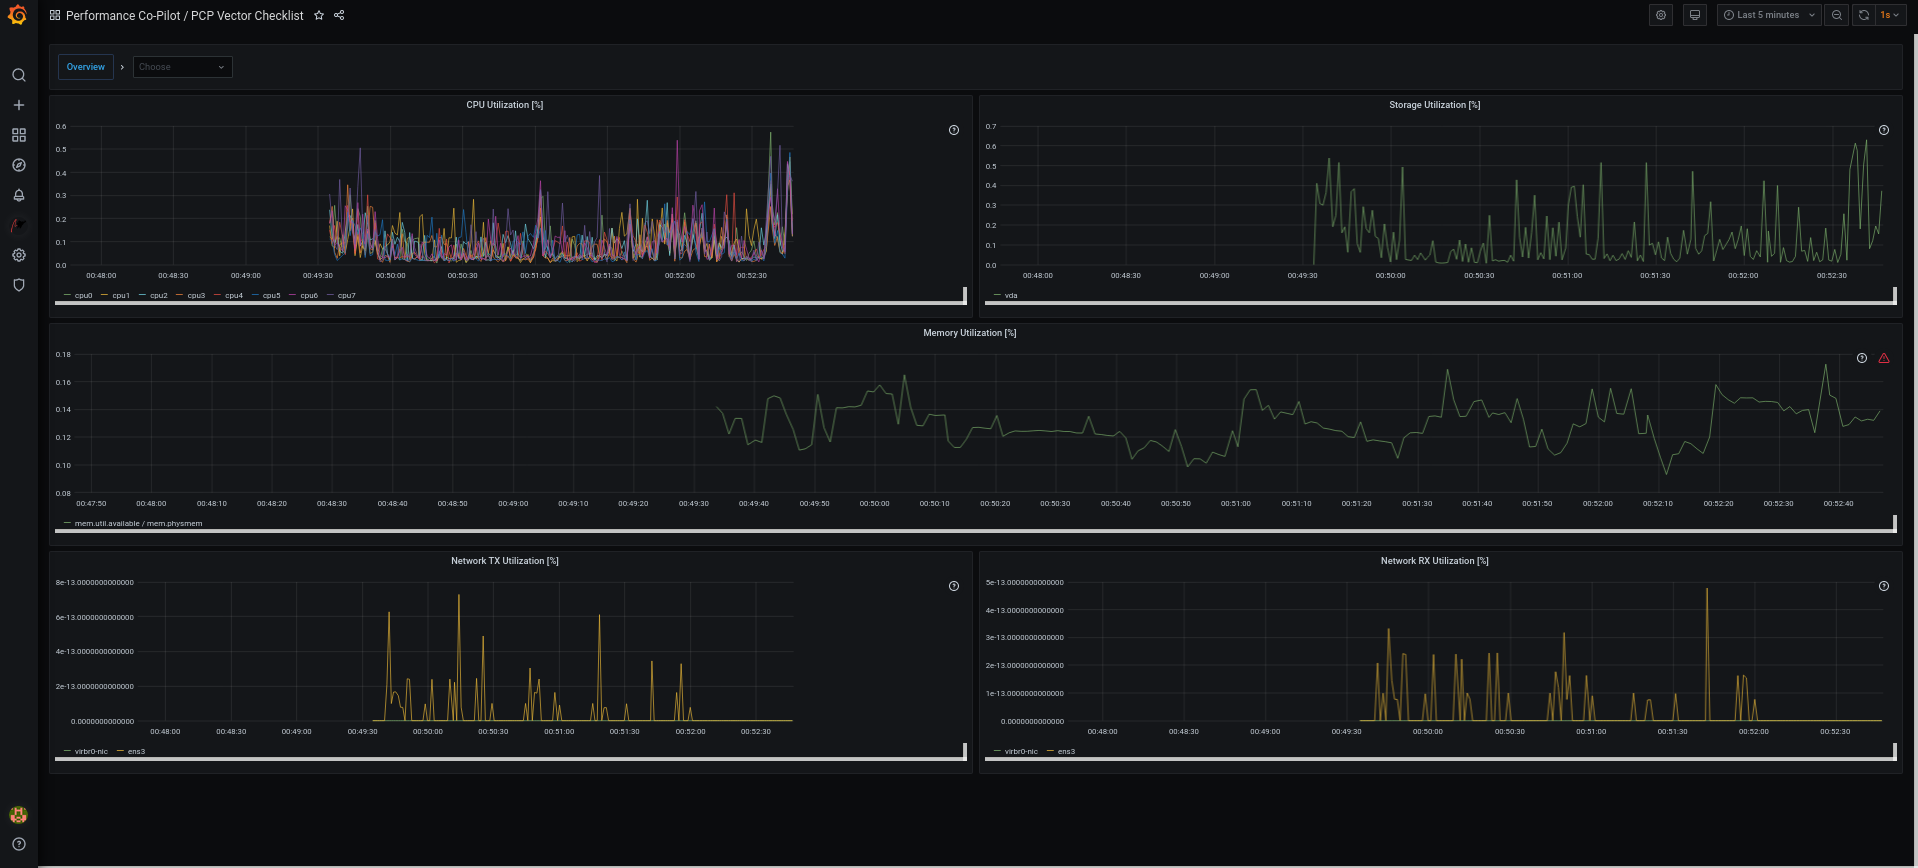
10.12. Troubleshooting Grafana issues
It is sometimes neccesary to troubleshoot Grafana issues, such as, Grafana does not display any data, the dashboard is black, or similar issues.
Procedure
Verify that the
pmloggerservice is up and running by executing the following command:$ systemctl status pmlogger
Verify if files were created or modified to the disk by executing the following command:
$ ls /var/log/pcp/pmlogger/$(hostname)/ -rlt
total 4024
-rw-r--r--. 1 pcp pcp   45996 Oct 13  2019 20191013.20.07.meta.xz
-rw-r--r--. 1 pcp pcp     412 Oct 13  2019 20191013.20.07.index
-rw-r--r--. 1 pcp pcp   32188 Oct 13  2019 20191013.20.07.0.xz
-rw-r--r--. 1 pcp pcp   44756 Oct 13  2019 20191013.20.30-00.meta.xz
[..]
Verify that the
pmproxyservice is running by executing the following command:$ systemctl status pmproxy
Verify that
pmproxyis running, time series support is enabled, and a connection to Redis is established by viewing the/var/log/pcp/pmproxy/pmproxy.logfile and ensure that it contains the following text:pmproxy(1716) Info: Redis slots, command keys, schema version setup
Here, 1716 is the PID of pmproxy, which will be different for every invocation of
pmproxy.Verify if the Redis database contains any keys by executing the following command:
$ redis-cli dbsize
(integer) 34837
Verify if any PCP metrics are in the Redis database and
pmproxyis able to access them by executing the following commands:$ pmseries disk.dev.read 2eb3e58d8f1e231361fb15cf1aa26fe534b4d9df $ pmseries "disk.dev.read[count:10]" 2eb3e58d8f1e231361fb15cf1aa26fe534b4d9df [Mon Jul 26 12:21:10.085468000 2021] 117971 70e83e88d4e1857a3a31605c6d1333755f2dd17c [Mon Jul 26 12:21:00.087401000 2021] 117758 70e83e88d4e1857a3a31605c6d1333755f2dd17c [Mon Jul 26 12:20:50.085738000 2021] 116688 70e83e88d4e1857a3a31605c6d1333755f2dd17c [...]$ redis-cli --scan --pattern "*$(pmseries 'disk.dev.read')" pcp:metric.name:series:2eb3e58d8f1e231361fb15cf1aa26fe534b4d9df pcp:values:series:2eb3e58d8f1e231361fb15cf1aa26fe534b4d9df pcp:desc:series:2eb3e58d8f1e231361fb15cf1aa26fe534b4d9df pcp:labelvalue:series:2eb3e58d8f1e231361fb15cf1aa26fe534b4d9df pcp:instances:series:2eb3e58d8f1e231361fb15cf1aa26fe534b4d9df pcp:labelflags:series:2eb3e58d8f1e231361fb15cf1aa26fe534b4d9df
Verify if there are any errors in the Grafana logs by executing the following command:
$ journalctl -e -u grafana-server
-- Logs begin at Mon 2021-07-26 11:55:10 IST, end at Mon 2021-07-26 12:30:15 IST. --
Jul 26 11:55:17 localhost.localdomain systemd[1]: Starting Grafana instance...
Jul 26 11:55:17 localhost.localdomain grafana-server[1171]: t=2021-07-26T11:55:17+0530 lvl=info msg="Starting Grafana" logger=server version=7.3.6 c>
Jul 26 11:55:17 localhost.localdomain grafana-server[1171]: t=2021-07-26T11:55:17+0530 lvl=info msg="Config loaded from" logger=settings file=/usr/s>
Jul 26 11:55:17 localhost.localdomain grafana-server[1171]: t=2021-07-26T11:55:17+0530 lvl=info msg="Config loaded from" logger=settings file=/etc/g>
[...]
Chapter 11. Optimizing the system performance using the web console
Learn how to set a performance profile in the RHEL web console to optimize the performance of the system for a selected task.
11.1. Performance tuning options in the web console
Red Hat Enterprise Linux 8 provides several performance profiles that optimize the system for the following tasks:
- Systems using the desktop
- Throughput performance
- Latency performance
- Network performance
- Low power consumption
- Virtual machines
The TuneD service optimizes system options to match the selected profile.
In the web console, you can set which performance profile your system uses.
Additional resources
11.2. Setting a performance profile in the web console
Depending on the task you want to perform, you can use the web console to optimize system performance by setting a suitable performance profile.
Prerequisites
- Make sure the web console is installed and accessible. For details, see Installing the web console.
Procedure
- Log into the 8 web console. For details, see Logging in to the web console.
- Click Overview.
In the Configuration section, click the current performance profile.

In the Change Performance Profile dialog box, set the required profile.
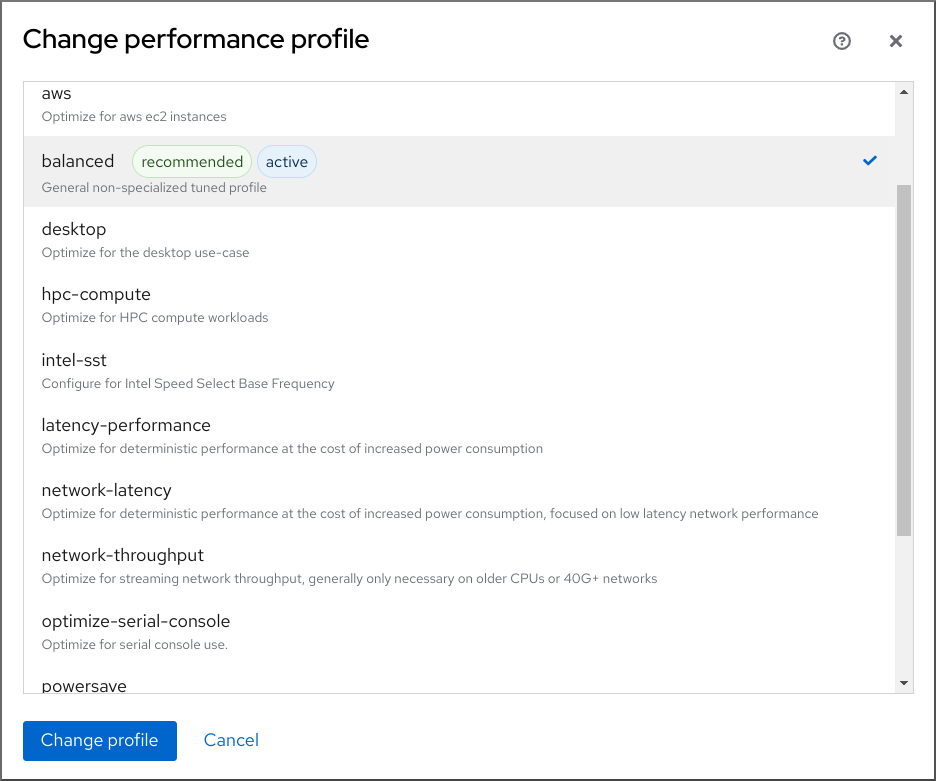
- Click .
Verification steps
- The Overview tab now shows the selected performance profile in the Configuration section.
11.3. Monitoring performance on the local system using the web console
Red Hat Enterprise Linux web console uses the Utilization Saturation and Errors (USE) Method for troubleshooting. The new performance metrics page has a historical view of your data organized chronologically with the newest data at the top.
In the Metrics and history page, you can view events, errors, and graphical representation for resource utilization and saturation.
Prerequisites
- The web console is installed and accessible. For details, see Installing the web console.
The
cockpit-pcppackage, which enables collecting the performance metrics, is installed:To install the package from the web console interface:
- Log in to the web console with administrative privileges. For details, see Logging in to the web console.
- In the Overview page, click View metrics and history.
- Click the button.
- In the Install software dialog window, click Install.
To install the package from the command-line interface, use:
# yum install cockpit-pcp
The Performance Co-Pilot (PCP) service is enabled:
# systemctl enable --now pmlogger.service pmproxy.service
Procedure
- Log into the 8 web console. For details, see Logging in to the web console.
- Click Overview.
In the Usage section, click View metrics and history.
The Metrics and history section opens:
-
The current system configuration and usage:
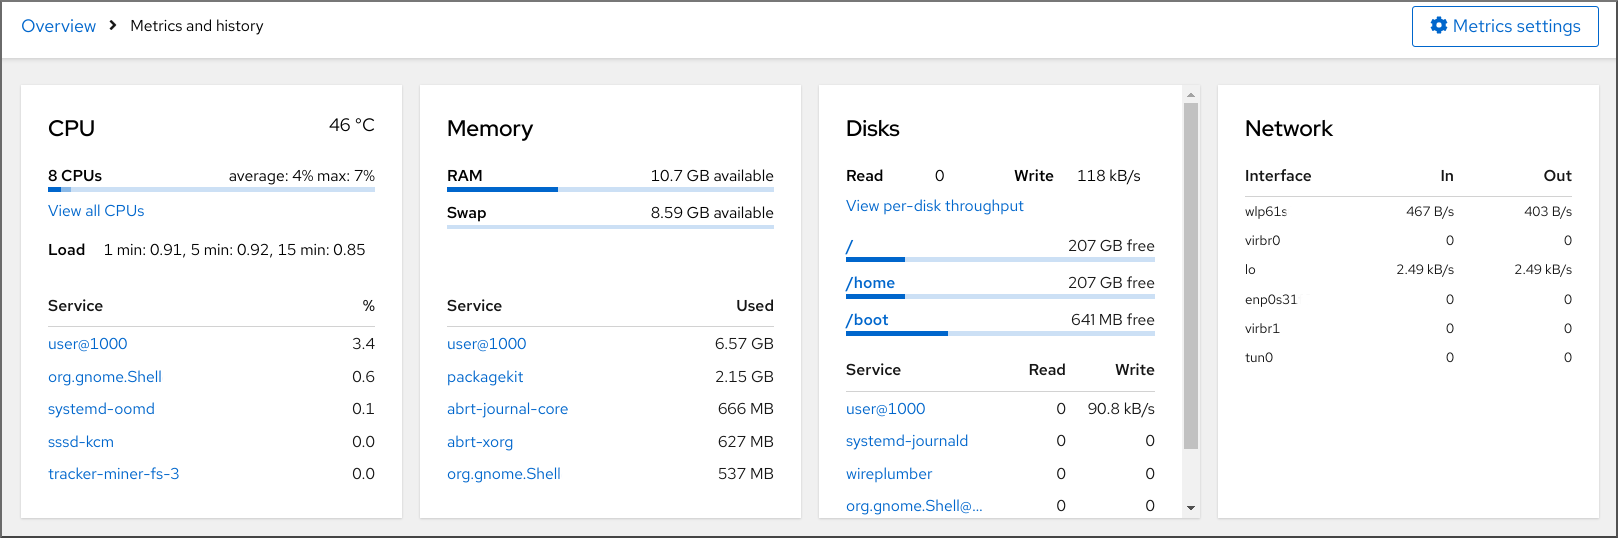
-
The performance metrics in a graphical form over a user-specified time interval:
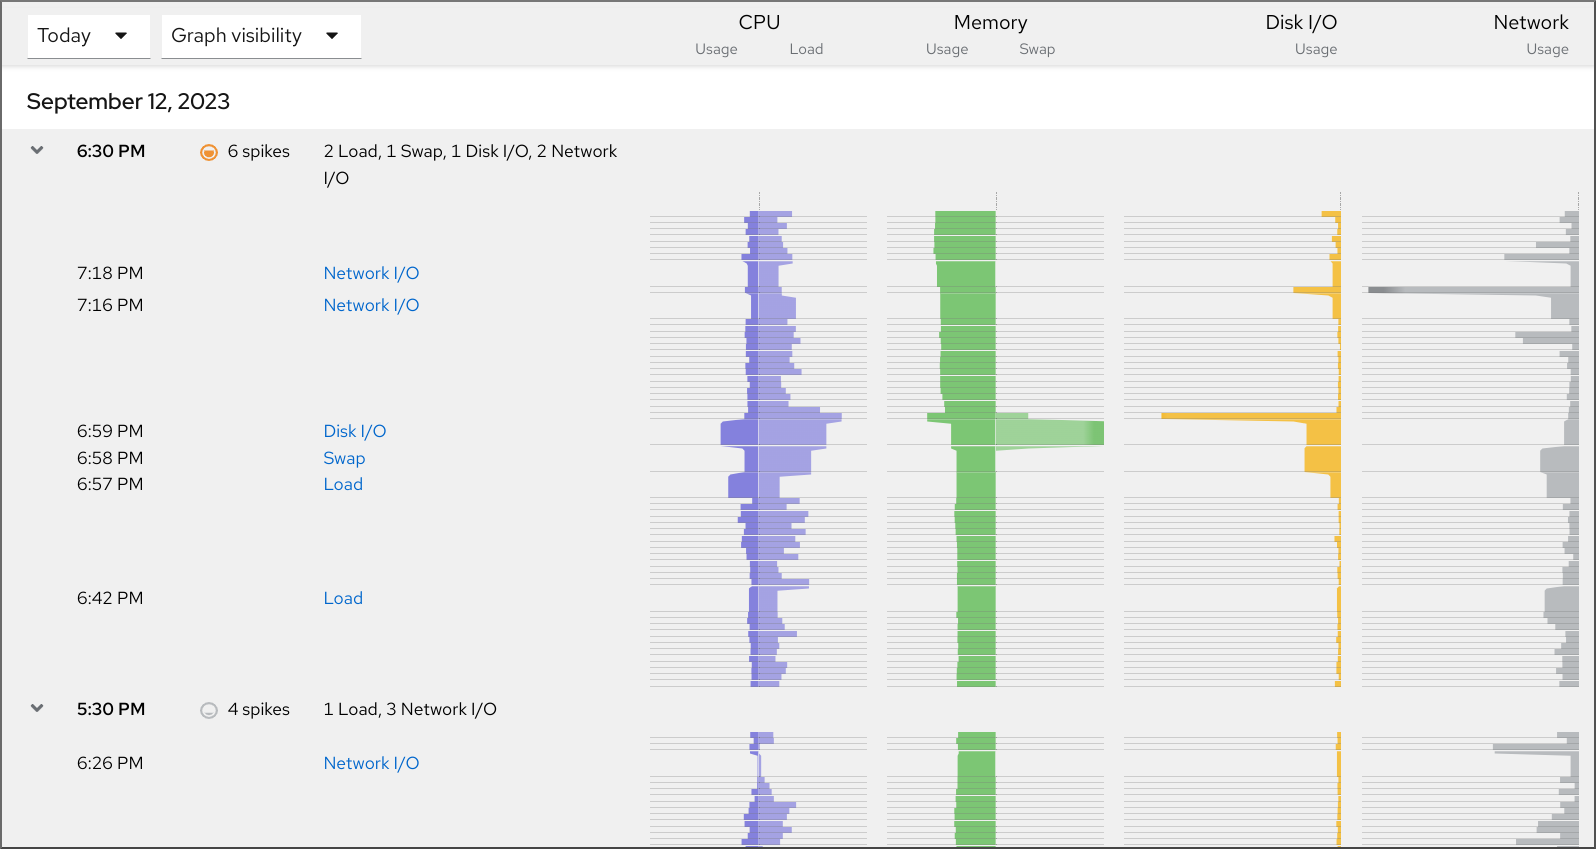
-
The current system configuration and usage:
11.4. Monitoring performance on several systems using the web console and Grafana
Grafana enables you to collect data from several systems at once and review a graphical representation of their collected Performance Co-Pilot (PCP) metrics. You can set up performance metrics monitoring and export for several systems in the web console interface.
Prerequisites
- The web console must be installed and accessible. For details, see link:Installing the web console.
Install the
cockpit-pcppackage.From the web console interface:
- Log in to the web console with administrative privileges. For details, see Logging in to the web console.
- In the Overview page, click View details and history.
- Click the button.
- In the Install software dialog window, click Install.
- Log out and in again to see the metrics history.
To install the package from the command-line interface, use:
# yum install cockpit-pcp
Enable the PCP service:
# systemctl enable --now pmlogger.service pmproxy.service- Set up Grafana dashboard. For more information, see Setting up a grafana-server.
Install the
redispackage.# yum install redisAlternatively, you can install the package from the web console interface later in the procedure.
Procedure
- In the Overview page, click View metrics and history in the Usage table.
- Click the button.
Move the Export to network slider to active position.

If you do not have the
redispackage installed, the web console prompts you to install it.-
To open the
pmproxyservice, select a zone from a drop-down list and click the button. - Click Save.
Verification
- Click Networking.
- In the Firewall table, click the button.
-
Search for
pmproxyin your selected zone.
Repeat this procedure on all the systems you want to watch.
Additional resources
Chapter 12. Setting the disk scheduler
The disk scheduler is responsible for ordering the I/O requests submitted to a storage device.
You can configure the scheduler in several different ways:
- Set the scheduler using TuneD, as described in Setting the disk scheduler using TuneD
-
Set the scheduler using
udev, as described in Setting the disk scheduler using udev rules - Temporarily change the scheduler on a running system, as described in Temporarily setting a scheduler for a specific disk
In Red Hat Enterprise Linux 8, block devices support only multi-queue scheduling. This enables the block layer performance to scale well with fast solid-state drives (SSDs) and multi-core systems.
The traditional, single-queue schedulers, which were available in Red Hat Enterprise Linux 7 and earlier versions, have been removed.
12.1. Available disk schedulers
The following multi-queue disk schedulers are supported in Red Hat Enterprise Linux 8:
none- Implements a first-in first-out (FIFO) scheduling algorithm. It merges requests at the generic block layer through a simple last-hit cache.
mq-deadlineAttempts to provide a guaranteed latency for requests from the point at which requests reach the scheduler.
The
mq-deadlinescheduler sorts queued I/O requests into a read or write batch and then schedules them for execution in increasing logical block addressing (LBA) order. By default, read batches take precedence over write batches, because applications are more likely to block on read I/O operations. Aftermq-deadlineprocesses a batch, it checks how long write operations have been starved of processor time and schedules the next read or write batch as appropriate.This scheduler is suitable for most use cases, but particularly those in which the write operations are mostly asynchronous.
bfqTargets desktop systems and interactive tasks.
The
bfqscheduler ensures that a single application is never using all of the bandwidth. In effect, the storage device is always as responsive as if it was idle. In its default configuration,bfqfocuses on delivering the lowest latency rather than achieving the maximum throughput.bfqis based oncfqcode. It does not grant the disk to each process for a fixed time slice but assigns a budget measured in number of sectors to the process.This scheduler is suitable while copying large files and the system does not become unresponsive in this case.
kyberThe scheduler tunes itself to achieve a latency goal by calculating the latencies of every I/O request submitted to the block I/O layer. You can configure the target latencies for read, in the case of cache-misses, and synchronous write requests.
This scheduler is suitable for fast devices, for example NVMe, SSD, or other low latency devices.
12.2. Different disk schedulers for different use cases
Depending on the task that your system performs, the following disk schedulers are recommended as a baseline prior to any analysis and tuning tasks:
Table 12.1. Disk schedulers for different use cases
| Use case | Disk scheduler |
|---|---|
| Traditional HDD with a SCSI interface |
Use |
| High-performance SSD or a CPU-bound system with fast storage |
Use |
| Desktop or interactive tasks |
Use |
| Virtual guest |
Use |
12.3. The default disk scheduler
Block devices use the default disk scheduler unless you specify another scheduler.
For non-volatile Memory Express (NVMe) block devices specifically, the default scheduler is none and Red Hat recommends not changing this.
The kernel selects a default disk scheduler based on the type of device. The automatically selected scheduler is typically the optimal setting. If you require a different scheduler, Red Hat recommends to use udev rules or the TuneD application to configure it. Match the selected devices and switch the scheduler only for those devices.
12.4. Determining the active disk scheduler
This procedure determines which disk scheduler is currently active on a given block device.
Procedure
Read the content of the
/sys/block/device/queue/schedulerfile:# cat /sys/block/device/queue/scheduler [mq-deadline] kyber bfq noneIn the file name, replace device with the block device name, for example
sdc.The active scheduler is listed in square brackets (
[ ]).
12.5. Setting the disk scheduler using TuneD
This procedure creates and enables a TuneD profile that sets a given disk scheduler for selected block devices. The setting persists across system reboots.
In the following commands and configuration, replace:
-
device with the name of the block device, for example
sdf -
selected-scheduler with the disk scheduler that you want to set for the device, for example
bfq
Prerequisites
-
The
TuneDservice is installed and enabled. For details, see Installing and enabling TuneD.
Procedure
Optional: Select an existing TuneD profile on which your profile will be based. For a list of available profiles, see TuneD profiles distributed with RHEL.
To see which profile is currently active, use:
$ tuned-adm active
Create a new directory to hold your TuneD profile:
# mkdir /etc/tuned/my-profileFind the system unique identifier of the selected block device:
$ udevadm info --query=property --name=/dev/device | grep -E '(WWN|SERIAL)'

ID_WWN=0x5002538d00000000_
ID_SERIAL=Generic-_SD_MMC_20120501030900000-0:0
ID_SERIAL_SHORT=20120501030900000
NoteThe command in the this example will return all values identified as a World Wide Name (WWN) or serial number associated with the specified block device. Although it is preferred to use a WWN, the WWN is not always available for a given device and any values returned by the example command are acceptable to use as the device system unique ID.
Create the
/etc/tuned/my-profile/tuned.confconfiguration file. In the file, set the following options:Optional: Include an existing profile:
[main]
include=existing-profile
Set the selected disk scheduler for the device that matches the WWN identifier:
[disk]
devices_udev_regex=IDNAME=device system unique id
elevator=selected-scheduler
Here:
-
Replace IDNAME with the name of the identifier being used (for example,
ID_WWN). Replace device system unique id with the value of the chosen identifier (for example,
0x5002538d00000000).To match multiple devices in the
devices_udev_regexoption, enclose the identifiers in parentheses and separate them with vertical bars:devices_udev_regex=(ID_WWN=0x5002538d00000000)|(ID_WWN=0x1234567800000000)
-
Replace IDNAME with the name of the identifier being used (for example,
Enable your profile:
# tuned-adm profile my-profile
Verification steps
Verify that the TuneD profile is active and applied:
$ tuned-adm active

Current active profile: my-profile
$ tuned-adm verify Verification succeeded, current system settings match the preset profile. See TuneD log file ('/var/log/tuned/tuned.log') for details.Read the contents of the
/sys/block/device/queue/schedulerfile:# cat /sys/block/device/queue/scheduler [mq-deadline] kyber bfq noneIn the file name, replace device with the block device name, for example
sdc.The active scheduler is listed in square brackets (
[]).
Additional resources
12.6. Setting the disk scheduler using udev rules
This procedure sets a given disk scheduler for specific block devices using udev rules. The setting persists across system reboots.
In the following commands and configuration, replace:
-
device with the name of the block device, for example
sdf -
selected-scheduler with the disk scheduler that you want to set for the device, for example
bfq
Procedure
Find the system unique identifier of the block device:
$ udevadm info --name=/dev/device | grep -E '(WWN|SERIAL)'
E: ID_WWN=0x5002538d00000000
E: ID_SERIAL=Generic-_SD_MMC_20120501030900000-0:0
E: ID_SERIAL_SHORT=20120501030900000
NoteThe command in the this example will return all values identified as a World Wide Name (WWN) or serial number associated with the specified block device. Although it is preferred to use a WWN, the WWN is not always available for a given device and any values returned by the example command are acceptable to use as the device system unique ID.
Configure the
udevrule. Create the/etc/udev/rules.d/99-scheduler.rulesfile with the following content:ACTION=="add|change", SUBSYSTEM=="block", ENV{IDNAME}=="device system unique id", ATTR{queue/scheduler}="selected-scheduler"Here:
-
Replace IDNAME with the name of the identifier being used (for example,
ID_WWN). -
Replace device system unique id with the value of the chosen identifier (for example,
0x5002538d00000000).
-
Replace IDNAME with the name of the identifier being used (for example,
Reload
udevrules:# udevadm control --reload-rules
Apply the scheduler configuration:
# udevadm trigger --type=devices --action=change
Verification steps
Verify the active scheduler:
# cat /sys/block/device/queue/scheduler
12.7. Temporarily setting a scheduler for a specific disk
This procedure sets a given disk scheduler for specific block devices. The setting does not persist across system reboots.
Procedure
Write the name of the selected scheduler to the
/sys/block/device/queue/schedulerfile:# echo selected-scheduler > /sys/block/device/queue/scheduler
In the file name, replace device with the block device name, for example
sdc.
Verification steps
Verify that the scheduler is active on the device:
# cat /sys/block/device/queue/scheduler
Chapter 13. Tuning the performance of a Samba server
Learn what settings can improve the performance of Samba in certain situations, and which settings can have a negative performance impact.
Parts of this section were adopted from the Performance Tuning documentation published in the Samba Wiki. License: CC BY 4.0. Authors and contributors: See the history tab on the Wiki page.
Prerequisites
Samba is set up as a file or print server
13.1. Setting the SMB protocol version
Each new SMB version adds features and improves the performance of the protocol. The recent Windows and Windows Server operating systems always supports the latest protocol version. If Samba also uses the latest protocol version, Windows clients connecting to Samba benefit from the performance improvements. In Samba, the default value of the server max protocol is set to the latest supported stable SMB protocol version.
To always have the latest stable SMB protocol version enabled, do not set the server max protocol parameter. If you set the parameter manually, you will need to modify the setting with each new version of the SMB protocol, to have the latest protocol version enabled.
The following procedure explains how to use the default value in the server max protocol parameter.
Procedure
-
Remove the
server max protocolparameter from the[global]section in the/etc/samba/smb.conffile. Reload the Samba configuration
# smbcontrol all reload-config
13.3. Settings that can have a negative performance impact
By default, the kernel in Red Hat Enterprise Linux is tuned for high network performance. For example, the kernel uses an auto-tuning mechanism for buffer sizes. Setting the socket options parameter in the /etc/samba/smb.conf file overrides these kernel settings. As a result, setting this parameter decreases the Samba network performance in most cases.
To use the optimized settings from the Kernel, remove the socket options parameter from the [global] section in the /etc/samba/smb.conf.
Chapter 14. Optimizing virtual machine performance
Virtual machines (VMs) always experience some degree of performance deterioration in comparison to the host. The following sections explain the reasons for this deterioration and provide instructions on how to minimize the performance impact of virtualization in RHEL 8, so that your hardware infrastructure resources can be used as efficiently as possible.
14.1. What influences virtual machine performance
VMs are run as user-space processes on the host. The hypervisor therefore needs to convert the host’s system resources so that the VMs can use them. As a consequence, a portion of the resources is consumed by the conversion, and the VM therefore cannot achieve the same performance efficiency as the host.
The impact of virtualization on system performance
More specific reasons for VM performance loss include:
- Virtual CPUs (vCPUs) are implemented as threads on the host, handled by the Linux scheduler.
- VMs do not automatically inherit optimization features, such as NUMA or huge pages, from the host kernel.
- Disk and network I/O settings of the host might have a significant performance impact on the VM.
- Network traffic typically travels to a VM through a software-based bridge.
- Depending on the host devices and their models, there might be significant overhead due to emulation of particular hardware.
The severity of the virtualization impact on the VM performance is influenced by a variety factors, which include:
- The number of concurrently running VMs.
- The amount of virtual devices used by each VM.
- The device types used by the VMs.
Reducing VM performance loss
RHEL 8 provides a number of features you can use to reduce the negative performance effects of virtualization. Notably:
-
The
TuneDservice can automatically optimize the resource distribution and performance of your VMs. - Block I/O tuning can improve the performances of the VM’s block devices, such as disks.
- NUMA tuning can increase vCPU performance.
- Virtual networking can be optimized in various ways.
Tuning VM performance can have adverse effects on other virtualization functions. For example, it can make migrating the modified VM more difficult.
14.2. Optimizing virtual machine performance by using TuneD
The TuneD utility is a tuning profile delivery mechanism that adapts RHEL for certain workload characteristics, such as requirements for CPU-intensive tasks or storage-network throughput responsiveness. It provides a number of tuning profiles that are pre-configured to enhance performance and reduce power consumption in a number of specific use cases. You can edit these profiles or create new profiles to create performance solutions tailored to your environment, including virtualized environments.
To optimize RHEL 8 for virtualization, use the following profiles:
-
For RHEL 8 virtual machines, use the virtual-guest profile. It is based on the generally applicable
throughput-performanceprofile, but also decreases the swappiness of virtual memory. - For RHEL 8 virtualization hosts, use the virtual-host profile. This enables more aggressive writeback of dirty memory pages, which benefits the host performance.
Prerequisites
-
The
TuneDservice is installed and enabled.
Procedure
To enable a specific TuneD profile:
List the available
TuneDprofiles.# tuned-adm list Available profiles: - balanced - General non-specialized TuneD profile - desktop - Optimize for the desktop use-case [...] - virtual-guest - Optimize for running inside a virtual guest - virtual-host - Optimize for running KVM guests Current active profile: balanced
Optional: Create a new
TuneDprofile or edit an existingTuneDprofile.For more information, see Customizing TuneD profiles.
Activate a
TuneDprofile.# tuned-adm profile selected-profileTo optimize a virtualization host, use the virtual-host profile.
# tuned-adm profile virtual-hostOn a RHEL guest operating system, use the virtual-guest profile.
# tuned-adm profile virtual-guest
Additional resources
14.3. Configuring virtual machine memory
To improve the performance of a virtual machine (VM), you can assign additional host RAM to the VM. Similarly, you can decrease the amount of memory allocated to a VM so the host memory can be allocated to other VMs or tasks.
To perform these actions, you can use the web console or the command-line interface.
14.3.1. Adding and removing virtual machine memory by using the web console
To improve the performance of a virtual machine (VM) or to free up the host resources it is using, you can use the web console to adjust amount of memory allocated to the VM.
Prerequisites
The guest OS is running the memory balloon drivers. To verify this is the case:
Ensure the VM’s configuration includes the
memballoondevice:# virsh dumpxml testguest | grep memballoon <memballoon model='virtio'> </memballoon>If this commands displays any output and the model is not set to
none, thememballoondevice is present.Ensure the balloon drivers are running in the guest OS.
-
In Windows guests, the drivers are installed as a part of the
virtio-windriver package. For instructions, see Installing paravirtualized KVM drivers for Windows virtual machines. -
In Linux guests, the drivers are generally included by default and activate when the
memballoondevice is present.
-
In Windows guests, the drivers are installed as a part of the
- The web console VM plug-in is installed on your system.
Procedure
Optional: Obtain the information about the maximum memory and currently used memory for a VM. This will serve as a baseline for your changes, and also for verification.
# virsh dominfo testguest
Max memory:     2097152 KiB
Used memory:    2097152 KiB
In the interface, click the VM whose information you want to see.
A new page opens with an Overview section with basic information about the selected VM and a Console section to access the VM’s graphical interface.
Click next to the
Memoryline in the Overview pane.The
Memory Adjustmentdialog appears.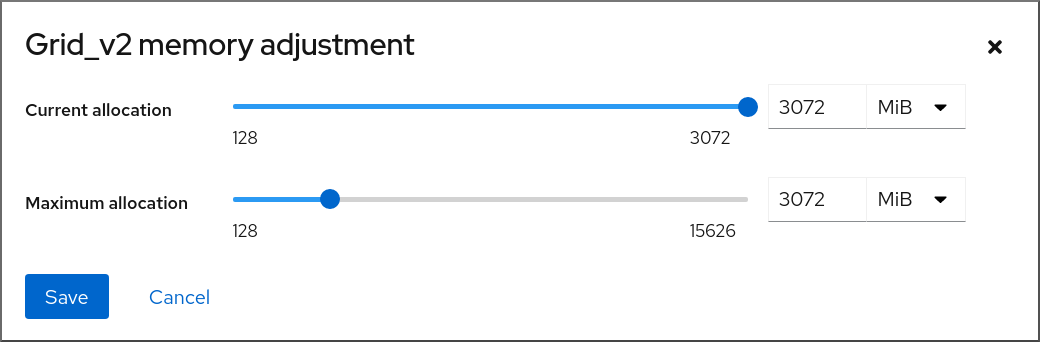
Configure the virtual CPUs for the selected VM.
Maximum allocation - Sets the maximum amount of host memory that the VM can use for its processes. You can specify the maximum memory when creating the VM or increase it later. You can specify memory as multiples of MiB or GiB.
Adjusting maximum memory allocation is only possible on a shut-off VM.
Current allocation - Sets the actual amount of memory allocated to the VM. This value can be less than the Maximum allocation but cannot exceed it. You can adjust the value to regulate the memory available to the VM for its processes. You can specify memory as multiples of MiB or GiB.
If you do not specify this value, the default allocation is the Maximum allocation value.
Click .
The memory allocation of the VM is adjusted.
14.3.2. Adding and removing virtual machine memory by using the command-line interface
To improve the performance of a virtual machine (VM) or to free up the host resources it is using, you can use the CLI to adjust amount of memory allocated to the VM.
Prerequisites
The guest OS is running the memory balloon drivers. To verify this is the case:
Ensure the VM’s configuration includes the
memballoondevice:# virsh dumpxml testguest | grep memballoon <memballoon model='virtio'> </memballoon>If this commands displays any output and the model is not set to
none, thememballoondevice is present.Ensure the ballon drivers are running in the guest OS.
-
In Windows guests, the drivers are installed as a part of the
virtio-windriver package. For instructions, see Installing paravirtualized KVM drivers for Windows virtual machines. -
In Linux guests, the drivers are generally included by default and activate when the
memballoondevice is present.
-
In Windows guests, the drivers are installed as a part of the
Procedure
Optional: Obtain the information about the maximum memory and currently used memory for a VM. This will serve as a baseline for your changes, and also for verification.
# virsh dominfo testguest
Max memory:     2097152 KiB
Used memory:    2097152 KiB
Adjust the maximum memory allocated to a VM. Increasing this value improves the performance potential of the VM, and reducing the value lowers the performance footprint the VM has on your host. Note that this change can only be performed on a shut-off VM, so adjusting a running VM requires a reboot to take effect.
For example, to change the maximum memory that the testguest VM can use to 4096 MiB:
# virt-xml testguest --edit --memory memory=4096,currentMemory=4096
Domain 'testguest' defined successfully.
Changes will take effect after the domain is fully powered off.
To increase the maximum memory of a running VM, you can attach a memory device to the VM. This is also referred to as memory hot plug. For details, see Attaching devices to virtual machines,
WarningRemoving memory devices from a running VM (also referred as a memory hot unplug) is not supported, and highly discouraged by Red Hat.
Optional: You can also adjust the memory currently used by the VM, up to the maximum allocation. This regulates the memory load that the VM has on the host until the next reboot, without changing the maximum VM allocation.
# virsh setmem testguest --current 2048
Verification
Confirm that the memory used by the VM has been updated:
# virsh dominfo testguest
Max memory:     4194304 KiB
Used memory:    2097152 KiB
Optional: If you adjusted the current VM memory, you can obtain the memory balloon statistics of the VM to evaluate how effectively it regulates its memory use.
 # virsh domstats --balloon testguest
Domain: 'testguest'
  balloon.current=365624
  balloon.maximum=4194304
  balloon.swap_in=0
  balloon.swap_out=0
  balloon.major_fault=306
  balloon.minor_fault=156117
  balloon.unused=3834448
  balloon.available=4035008
  balloon.usable=3746340
  balloon.last-update=1587971682
  balloon.disk_caches=75444
  balloon.hugetlb_pgalloc=0
  balloon.hugetlb_pgfail=0
  balloon.rss=1005456
14.3.3. Additional resources
14.4. Optimizing virtual machine I/O performance
The input and output (I/O) capabilities of a virtual machine (VM) can significantly limit the VM’s overall efficiency. To address this, you can optimize a VM’s I/O by configuring block I/O parameters.
14.4.1. Tuning block I/O in virtual machines
When multiple block devices are being used by one or more VMs, it might be important to adjust the I/O priority of specific virtual devices by modifying their I/O weights.
Increasing the I/O weight of a device increases its priority for I/O bandwidth, and therefore provides it with more host resources. Similarly, reducing a device’s weight makes it consume less host resources.
Each device’s weight value must be within the 100 to 1000 range. Alternatively, the value can be 0, which removes that device from per-device listings.
Procedure
To display and set a VM’s block I/O parameters:
Display the current
<blkio>parameters for a VM:# virsh dumpxml VM-name<domain> [...] <blkiotune> <weight>800</weight> <device> <path>/dev/sda</path> <weight>1000</weight> </device> <device> <path>/dev/sdb</path> <weight>500</weight> </device> </blkiotune> [...] </domain>Edit the I/O weight of a specified device:
# virsh blkiotune VM-name --device-weights device, I/O-weightFor example, the following changes the weight of the /dev/sda device in the liftrul VM to 500.
# virsh blkiotune liftbrul --device-weights /dev/sda, 500
14.4.2. Disk I/O throttling in virtual machines
When several VMs are running simultaneously, they can interfere with system performance by using excessive disk I/O. Disk I/O throttling in KVM virtualization provides the ability to set a limit on disk I/O requests sent from the VMs to the host machine. This can prevent a VM from over-utilizing shared resources and impacting the performance of other VMs.
To enable disk I/O throttling, set a limit on disk I/O requests sent from each block device attached to VMs to the host machine.
Procedure
Use the
virsh domblklistcommand to list the names of all the disk devices on a specified VM.# virsh domblklist rollin-coal Target Source ------------------------------------------------ vda /var/lib/libvirt/images/rollin-coal.qcow2 sda - sdb /home/horridly-demanding-processes.isoFind the host block device where the virtual disk that you want to throttle is mounted.
For example, if you want to throttle the
sdbvirtual disk from the previous step, the following output shows that the disk is mounted on the/dev/nvme0n1p3partition.$ lsblk NAME MAJ:MIN RM SIZE RO TYPE MOUNTPOINT zram0 252:0 0 4G 0 disk [SWAP] nvme0n1 259:0 0 238.5G 0 disk ├─nvme0n1p1 259:1 0 600M 0 part /boot/efi ├─nvme0n1p2 259:2 0 1G 0 part /boot └─nvme0n1p3 259:3 0 236.9G 0 part └─luks-a1123911-6f37-463c-b4eb-fxzy1ac12fea 253:0 0 236.9G 0 crypt /homeSet I/O limits for the block device by using the
virsh blkiotunecommand.# virsh blkiotune VM-name --parameter device,limitThe following example throttles the
sdbdisk on therollin-coalVM to 1000 read and write I/O operations per second and to 50 MB per second read and write throughput.# virsh blkiotune rollin-coal --device-read-iops-sec /dev/nvme0n1p3,1000 --device-write-iops-sec /dev/nvme0n1p3,1000 --device-write-bytes-sec /dev/nvme0n1p3,52428800 --device-read-bytes-sec /dev/nvme0n1p3,52428800
Additional information
- Disk I/O throttling can be useful in various situations, for example when VMs belonging to different customers are running on the same host, or when quality of service guarantees are given for different VMs. Disk I/O throttling can also be used to simulate slower disks.
- I/O throttling can be applied independently to each block device attached to a VM and supports limits on throughput and I/O operations.
-
Red Hat does not support using the
virsh blkdeviotunecommand to configure I/O throttling in VMs. For more information about unsupported features when using RHEL 8 as a VM host, see Unsupported features in RHEL 8 virtualization.
14.4.3. Enabling multi-queue virtio-scsi
When using virtio-scsi storage devices in your virtual machines (VMs), the multi-queue virtio-scsi feature provides improved storage performance and scalability. It enables each virtual CPU (vCPU) to have a separate queue and interrupt to use without affecting other vCPUs.
Procedure
To enable multi-queue virtio-scsi support for a specific VM, add the following to the VM’s XML configuration, where N is the total number of vCPU queues:
<controller type='scsi' index='0' model='virtio-scsi'>
   <driver queues='N' />
</controller>
14.5. Optimizing virtual machine CPU performance
Much like physical CPUs in host machines, vCPUs are critical to virtual machine (VM) performance. As a result, optimizing vCPUs can have a significant impact on the resource efficiency of your VMs. To optimize your vCPU:
- Adjust how many host CPUs are assigned to the VM. You can do this using the CLI or the web console.
Ensure that the vCPU model is aligned with the CPU model of the host. For example, to set the testguest1 VM to use the CPU model of the host:
# virt-xml testguest1 --edit --cpu host-model- Deactivate kernel same-page merging (KSM).
If your host machine uses Non-Uniform Memory Access (NUMA), you can also configure NUMA for its VMs. This maps the host’s CPU and memory processes onto the CPU and memory processes of the VM as closely as possible. In effect, NUMA tuning provides the vCPU with a more streamlined access to the system memory allocated to the VM, which can improve the vCPU processing effectiveness.
For details, see Configuring NUMA in a virtual machine and Sample vCPU performance tuning scenario.
14.5.1. Adding and removing virtual CPUs by using the command-line interface
To increase or optimize the CPU performance of a virtual machine (VM), you can add or remove virtual CPUs (vCPUs) assigned to the VM.
When performed on a running VM, this is also referred to as vCPU hot plugging and hot unplugging. However, note that vCPU hot unplug is not supported in RHEL 8, and Red Hat highly discourages its use.
Prerequisites
Optional: View the current state of the vCPUs in the targeted VM. For example, to display the number of vCPUs on the testguest VM:
# virsh vcpucount testguest
maximum      config         4
maximum      live           2
current      config         2
current      live           1
This output indicates that testguest is currently using 1 vCPU, and 1 more vCPu can be hot plugged to it to increase the VM’s performance. However, after reboot, the number of vCPUs testguest uses will change to 2, and it will be possible to hot plug 2 more vCPUs.
Procedure
Adjust the maximum number of vCPUs that can be attached to a VM, which takes effect on the VM’s next boot.
For example, to increase the maximum vCPU count for the testguest VM to 8:
# virsh setvcpus testguest 8 --maximum --configNote that the maximum may be limited by the CPU topology, host hardware, the hypervisor, and other factors.
Adjust the current number of vCPUs attached to a VM, up to the maximum configured in the previous step. For example:
To increase the number of vCPUs attached to the running testguest VM to 4:
# virsh setvcpus testguest 4 --liveThis increases the VM’s performance and host load footprint of testguest until the VM’s next boot.
To permanently decrease the number of vCPUs attached to the testguest VM to 1:
# virsh setvcpus testguest 1 --configThis decreases the VM’s performance and host load footprint of testguest after the VM’s next boot. However, if needed, additional vCPUs can be hot plugged to the VM to temporarily increase its performance.
Verification
Confirm that the current state of vCPU for the VM reflects your changes.
# virsh vcpucount testguest
maximum      config         8
maximum      live           4
current      config         1
current      live           4
Additional resources
14.5.2. Managing virtual CPUs by using the web console
By using the RHEL 8 web console, you can review and configure virtual CPUs used by virtual machines (VMs) to which the web console is connected.
Prerequisites
- The web console VM plug-in is installed on your system.
Procedure
In the interface, click the VM whose information you want to see.
A new page opens with an Overview section with basic information about the selected VM and a Console section to access the VM’s graphical interface.
Click next to the number of vCPUs in the Overview pane.
The vCPU details dialog appears.
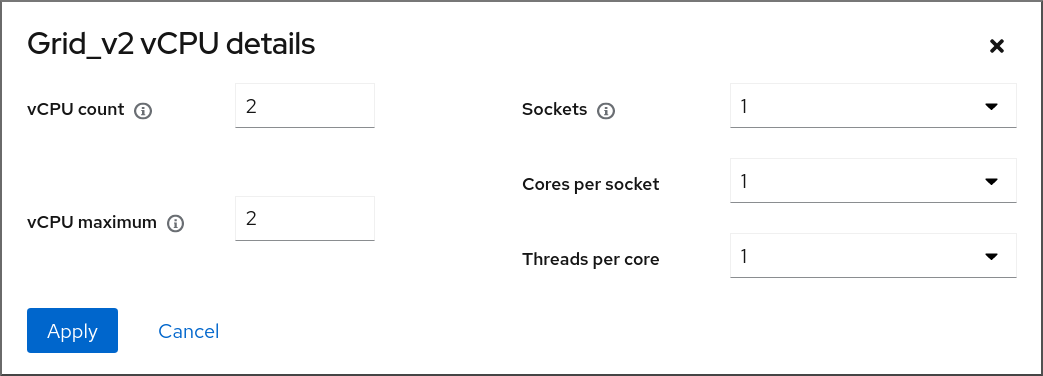
Configure the virtual CPUs for the selected VM.
vCPU Count - The number of vCPUs currently in use.
NoteThe vCPU count cannot be greater than the vCPU Maximum.
- vCPU Maximum - The maximum number of virtual CPUs that can be configured for the VM. If this value is higher than the vCPU Count, additional vCPUs can be attached to the VM.
- Sockets - The number of sockets to expose to the VM.
- Cores per socket - The number of cores for each socket to expose to the VM.
Threads per core - The number of threads for each core to expose to the VM.
Note that the Sockets, Cores per socket, and Threads per core options adjust the CPU topology of the VM. This may be beneficial for vCPU performance and may impact the functionality of certain software in the guest OS. If a different setting is not required by your deployment, keep the default values.
Click .
The virtual CPUs for the VM are configured.
NoteChanges to virtual CPU settings only take effect after the VM is restarted.
Additional resources
14.5.3. Configuring NUMA in a virtual machine
The following methods can be used to configure Non-Uniform Memory Access (NUMA) settings of a virtual machine (VM) on a RHEL 8 host.
Prerequisites
The host is a NUMA-compatible machine. To detect whether this is the case, use the
virsh nodeinfocommand and see theNUMA cell(s)line:# virsh nodeinfo CPU model: x86_64 CPU(s): 48 CPU frequency: 1200 MHz CPU socket(s): 1 Core(s) per socket: 12 Thread(s) per core: 2 NUMA cell(s): 2 Memory size: 67012964 KiB
If the value of the line is 2 or greater, the host is NUMA-compatible.
Procedure
For ease of use, you can set up a VM’s NUMA configuration by using automated utilities and services. However, manual NUMA setup is more likely to yield a significant performance improvement.
Automatic methods
Set the VM’s NUMA policy to
Preferred. For example, to do so for the testguest5 VM:# virt-xml testguest5 --edit --vcpus placement=auto # virt-xml testguest5 --edit --numatune mode=preferred
Enable automatic NUMA balancing on the host:
# echo 1 > /proc/sys/kernel/numa_balancingStart the
numadservice to automatically align the VM CPU with memory resources.# systemctl start numad
Manual methods
Pin specific vCPU threads to a specific host CPU or range of CPUs. This is also possible on non-NUMA hosts and VMs, and is recommended as a safe method of vCPU performance improvement.
For example, the following commands pin vCPU threads 0 to 5 of the testguest6 VM to host CPUs 1, 3, 5, 7, 9, and 11, respectively:
# virsh vcpupin testguest6 0 1
# virsh vcpupin testguest6 1 3
# virsh vcpupin testguest6 2 5
# virsh vcpupin testguest6 3 7
# virsh vcpupin testguest6 4 9
# virsh vcpupin testguest6 5 11
Afterwards, you can verify whether this was successful:
# virsh vcpupin testguest6
VCPU   CPU Affinity
----------------------
0      1
1      3
2      5
3      7
4      9
5      11
After pinning vCPU threads, you can also pin QEMU process threads associated with a specified VM to a specific host CPU or range of CPUs. For example, the following commands pin the QEMU process thread of testguest6 to CPUs 13 and 15, and verify this was successful:
# virsh emulatorpin testguest6 13,15
# virsh emulatorpin testguest6
emulator: CPU Affinity
----------------------------------
       *: 13,15
Finally, you can also specify which host NUMA nodes will be assigned specifically to a certain VM. This can improve the host memory usage by the VM’s vCPU. For example, the following commands set testguest6 to use host NUMA nodes 3 to 5, and verify this was successful:
# virsh numatune testguest6 --nodeset 3-5
# virsh numatune testguest6
For best performance results, it is recommended to use all of the manual tuning methods listed above
Additional resources
- Sample vCPU performance tuning scenario
-
View the current NUMA configuration of your system using the
numastatutility
14.5.4. Sample vCPU performance tuning scenario
To obtain the best vCPU performance possible, Red Hat recommends by using manual vcpupin, emulatorpin, and numatune settings together, for example like in the following scenario.
Starting scenario
Your host has the following hardware specifics:
- 2 NUMA nodes
- 3 CPU cores on each node
- 2 threads on each core
The output of
virsh nodeinfoof such a machine would look similar to:# virsh nodeinfo CPU model: x86_64 CPU(s): 12 CPU frequency: 3661 MHz CPU socket(s): 2 Core(s) per socket: 3 Thread(s) per core: 2 NUMA cell(s): 2 Memory size: 31248692 KiBYou intend to modify an existing VM to have 8 vCPUs, which means that it will not fit in a single NUMA node.
Therefore, you should distribute 4 vCPUs on each NUMA node and make the vCPU topology resemble the host topology as closely as possible. This means that vCPUs that run as sibling threads of a given physical CPU should be pinned to host threads on the same core. For details, see the Solution below:
Solution
Obtain the information about the host topology:
# virsh capabilitiesThe output should include a section that looks similar to the following:
<topology> <cells num="2"> <cell id="0"> <memory unit="KiB">15624346</memory> <pages unit="KiB" size="4">3906086</pages> <pages unit="KiB" size="2048">0</pages> <pages unit="KiB" size="1048576">0</pages> <distances> <sibling id="0" value="10" /> <sibling id="1" value="21" /> </distances> <cpus num="6"> <cpu id="0" socket_id="0" core_id="0" siblings="0,3" /> <cpu id="1" socket_id="0" core_id="1" siblings="1,4" /> <cpu id="2" socket_id="0" core_id="2" siblings="2,5" /> <cpu id="3" socket_id="0" core_id="0" siblings="0,3" /> <cpu id="4" socket_id="0" core_id="1" siblings="1,4" /> <cpu id="5" socket_id="0" core_id="2" siblings="2,5" /> </cpus> </cell> <cell id="1"> <memory unit="KiB">15624346</memory> <pages unit="KiB" size="4">3906086</pages> <pages unit="KiB" size="2048">0</pages> <pages unit="KiB" size="1048576">0</pages> <distances> <sibling id="0" value="21" /> <sibling id="1" value="10" /> </distances> <cpus num="6"> <cpu id="6" socket_id="1" core_id="3" siblings="6,9" /> <cpu id="7" socket_id="1" core_id="4" siblings="7,10" /> <cpu id="8" socket_id="1" core_id="5" siblings="8,11" /> <cpu id="9" socket_id="1" core_id="3" siblings="6,9" /> <cpu id="10" socket_id="1" core_id="4" siblings="7,10" /> <cpu id="11" socket_id="1" core_id="5" siblings="8,11" /> </cpus> </cell> </cells> </topology>- Optional: Test the performance of the VM by using the applicable tools and utilities.
Set up and mount 1 GiB huge pages on the host:
Add the following line to the host’s kernel command line:
default_hugepagesz=1G hugepagesz=1G
Create the
/etc/systemd/system/hugetlb-gigantic-pages.servicefile with the following content:[Unit] Description=HugeTLB Gigantic Pages Reservation DefaultDependencies=no Before=dev-hugepages.mount ConditionPathExists=/sys/devices/system/node ConditionKernelCommandLine=hugepagesz=1G [Service] Type=oneshot RemainAfterExit=yes ExecStart=/etc/systemd/hugetlb-reserve-pages.sh [Install] WantedBy=sysinit.target
Create the
/etc/systemd/hugetlb-reserve-pages.shfile with the following content:#!/bin/sh nodes_path=/sys/devices/system/node/ if [ ! -d $nodes_path ]; then echo "ERROR: $nodes_path does not exist" exit 1 fi reserve_pages() { echo $1 > $nodes_path/$2/hugepages/hugepages-1048576kB/nr_hugepages } reserve_pages 4 node1 reserve_pages 4 node2This reserves four 1GiB huge pages from node1 and four 1GiB huge pages from node2.
Make the script created in the previous step executable:
# chmod +x /etc/systemd/hugetlb-reserve-pages.shEnable huge page reservation on boot:
# systemctl enable hugetlb-gigantic-pages
Use the
virsh editcommand to edit the XML configuration of the VM you wish to optimize, in this example super-VM:# virsh edit super-vmAdjust the XML configuration of the VM in the following way:
-
Set the VM to use 8 static vCPUs. Use the
<vcpu/>element to do this. Pin each of the vCPU threads to the corresponding host CPU threads that it mirrors in the topology. To do so, use the
<vcpupin/>elements in the<cputune>section.Note that, as shown by the
virsh capabilitiesutility above, host CPU threads are not ordered sequentially in their respective cores. In addition, the vCPU threads should be pinned to the highest available set of host cores on the same NUMA node. For a table illustration, see the Sample topology section below.The XML configuration for steps a. and b. can look similar to:
<cputune>
  <vcpupin vcpu='0' cpuset='1'/>
  <vcpupin vcpu='1' cpuset='4'/>
  <vcpupin vcpu='2' cpuset='2'/>
  <vcpupin vcpu='3' cpuset='5'/>
  <vcpupin vcpu='4' cpuset='7'/>
  <vcpupin vcpu='5' cpuset='10'/>
  <vcpupin vcpu='6' cpuset='8'/>
  <vcpupin vcpu='7' cpuset='11'/>
  <emulatorpin cpuset='6,9'/>
</cputune>
Set the VM to use 1 GiB huge pages:
<memoryBacking>
  <hugepages>
    <page size='1' unit='GiB'/>
  </hugepages>
</memoryBacking>
Configure the VM’s NUMA nodes to use memory from the corresponding NUMA nodes on the host. To do so, use the
<memnode/>elements in the<numatune/>section:<numatune> <memory mode="preferred" nodeset="1"/> <memnode cellid="0" mode="strict" nodeset="0"/> <memnode cellid="1" mode="strict" nodeset="1"/> </numatune>
Ensure the CPU mode is set to
host-passthrough, and that the CPU uses cache inpassthroughmode:<cpu mode="host-passthrough"> <topology sockets="2" cores="2" threads="2"/> <cache mode="passthrough"/>
-
Set the VM to use 8 static vCPUs. Use the
Verification
Confirm that the resulting XML configuration of the VM includes a section similar to the following:
[...] <memoryBacking> <hugepages> <page size='1' unit='GiB'/> </hugepages> </memoryBacking> <vcpu placement='static'>8</vcpu> <cputune> <vcpupin vcpu='0' cpuset='1'/> <vcpupin vcpu='1' cpuset='4'/> <vcpupin vcpu='2' cpuset='2'/> <vcpupin vcpu='3' cpuset='5'/> <vcpupin vcpu='4' cpuset='7'/> <vcpupin vcpu='5' cpuset='10'/> <vcpupin vcpu='6' cpuset='8'/> <vcpupin vcpu='7' cpuset='11'/> <emulatorpin cpuset='6,9'/> </cputune> <numatune> <memory mode="preferred" nodeset="1"/> <memnode cellid="0" mode="strict" nodeset="0"/> <memnode cellid="1" mode="strict" nodeset="1"/> </numatune> <cpu mode="host-passthrough"> <topology sockets="2" cores="2" threads="2"/> <cache mode="passthrough"/> <numa> <cell id="0" cpus="0-3" memory="2" unit="GiB"> <distances> <sibling id="0" value="10"/> <sibling id="1" value="21"/> </distances> </cell> <cell id="1" cpus="4-7" memory="2" unit="GiB"> <distances> <sibling id="0" value="21"/> <sibling id="1" value="10"/> </distances> </cell> </numa> </cpu> </domain>- Optional: Test the performance of the VM by using the applicable tools and utilities to evaluate the impact of the VM’s optimization.
Sample topology
The following tables illustrate the connections between the vCPUs and the host CPUs they should be pinned to:
Table 14.1. Host topology
CPU threads
0
3
1
4
2
5
6
9
7
10
8
11
Cores
0
1
2
3
4
5
Sockets
0
1
NUMA nodes
0
1
Table 14.2. VM topology
vCPU threads
0
1
2
3
4
5
6
7
Cores
0
1
2
3
Sockets
0
1
NUMA nodes
0
1
Table 14.3. Combined host and VM topology
vCPU threads
0
1
2
3
4
5
6
7
Host CPU threads
0
3
1
4
2
5
6
9
7
10
8
11
Cores
0
1
2
3
4
5
Sockets
0
1
NUMA nodes
0
1
In this scenario, there are 2 NUMA nodes and 8 vCPUs. Therefore, 4 vCPU threads should be pinned to each node.
In addition, Red Hat recommends leaving at least a single CPU thread available on each node for host system operations.
Because in this example, each NUMA node houses 3 cores, each with 2 host CPU threads, the set for node 0 translates as follows:
<vcpupin vcpu='0' cpuset='1'/>
<vcpupin vcpu='1' cpuset='4'/>
<vcpupin vcpu='2' cpuset='2'/>
<vcpupin vcpu='3' cpuset='5'/>
14.5.5. Deactivating kernel same-page merging
Although kernel same-page merging (KSM) improves memory density, it increases CPU utilization, and might adversely affect overall performance depending on the workload. In such cases, you can improve the virtual machine (VM) performance by deactivating KSM.
Depending on your requirements, you can either deactivate KSM for a single session or persistently.
Procedure
To deactivate KSM for a single session, use the
systemctlutility to stopksmandksmtunedservices.# systemctl stop ksm # systemctl stop ksmtuned
To deactivate KSM persistently, use the
systemctlutility to disableksmandksmtunedservices.# systemctl disable ksm Removed /etc/systemd/system/multi-user.target.wants/ksm.service. # systemctl disable ksmtuned Removed /etc/systemd/system/multi-user.target.wants/ksmtuned.service.
Memory pages shared between VMs before deactivating KSM will remain shared. To stop sharing, delete all the PageKSM pages in the system by using the following command:
# echo 2 > /sys/kernel/mm/ksm/run
After anonymous pages replace the KSM pages, the khugepaged kernel service will rebuild transparent hugepages on the VM’s physical memory.
14.6. Optimizing virtual machine network performance
Due to the virtual nature of a VM’s network interface card (NIC), the VM loses a portion of its allocated host network bandwidth, which can reduce the overall workload efficiency of the VM. The following tips can minimize the negative impact of virtualization on the virtual NIC (vNIC) throughput.
Procedure
Use any of the following methods and observe if it has a beneficial effect on your VM network performance:
- Enable the vhost_net module
On the host, ensure the
vhost_netkernel feature is enabled:# lsmod | grep vhost vhost_net 32768 1 vhost 53248 1 vhost_net tap 24576 1 vhost_net tun 57344 6 vhost_netIf the output of this command is blank, enable the
vhost_netkernel module:# modprobe vhost_net- Set up multi-queue virtio-net
To set up the multi-queue virtio-net feature for a VM, use the
virsh editcommand to edit to the XML configuration of the VM. In the XML, add the following to the<devices>section, and replaceNwith the number of vCPUs in the VM, up to 16:<interface type='network'> <source network='default'/> <model type='virtio'/> <driver name='vhost' queues='N'/> </interface>If the VM is running, restart it for the changes to take effect.
- Batching network packets
In Linux VM configurations with a long transmission path, batching packets before submitting them to the kernel may improve cache utilization. To set up packet batching, use the following command on the host, and replace tap0 with the name of the network interface that the VMs use:
# ethtool -C tap0 rx-frames 64- SR-IOV
- If your host NIC supports SR-IOV, use SR-IOV device assignment for your vNICs. For more information, see Managing SR-IOV devices.
Additional resources
14.7. Virtual machine performance monitoring tools
To identify what consumes the most VM resources and which aspect of VM performance needs optimization, performance diagnostic tools, both general and VM-specific, can be used.
Default OS performance monitoring tools
For standard performance evaluation, you can use the utilities provided by default by your host and guest operating systems:
On your RHEL 8 host, as root, use the
toputility or the system monitor application, and look forqemuandvirtin the output. This shows how much host system resources your VMs are consuming.-
If the monitoring tool displays that any of the
qemuorvirtprocesses consume a large portion of the host CPU or memory capacity, use theperfutility to investigate. For details, see below. -
In addition, if a
vhost_netthread process, named for example vhost_net-1234, is displayed as consuming an excessive amount of host CPU capacity, consider using virtual network optimization features, such asmulti-queue virtio-net.
-
If the monitoring tool displays that any of the
On the guest operating system, use performance utilities and applications available on the system to evaluate which processes consume the most system resources.
-
On Linux systems, you can use the
toputility. - On Windows systems, you can use the Task Manager application.
-
On Linux systems, you can use the
perf kvm
You can use the perf utility to collect and analyze virtualization-specific statistics about the performance of your RHEL 8 host. To do so:
On the host, install the perf package:
# yum install perfUse one of the
perf kvm statcommands to display perf statistics for your virtualization host:-
For real-time monitoring of your hypervisor, use the
perf kvm stat livecommand. -
To log the perf data of your hypervisor over a period of time, activate the logging by using the
perf kvm stat recordcommand. After the command is canceled or interrupted, the data is saved in theperf.data.guestfile, which can be analyzed by using theperf kvm stat reportcommand.
-
For real-time monitoring of your hypervisor, use the
Analyze the
perfoutput for types ofVM-EXITevents and their distribution. For example, thePAUSE_INSTRUCTIONevents should be infrequent, but in the following output, the high occurrence of this event suggests that the host CPUs are not handling the running vCPUs well. In such a scenario, consider shutting down some of your active VMs, removing vCPUs from these VMs, or tuning the performance of the vCPUs.# perf kvm stat report Analyze events for all VMs, all VCPUs: VM-EXIT Samples Samples% Time% Min Time Max Time Avg time EXTERNAL_INTERRUPT 365634 31.59% 18.04% 0.42us 58780.59us 204.08us ( +- 0.99% ) MSR_WRITE 293428 25.35% 0.13% 0.59us 17873.02us 1.80us ( +- 4.63% ) PREEMPTION_TIMER 276162 23.86% 0.23% 0.51us 21396.03us 3.38us ( +- 5.19% ) PAUSE_INSTRUCTION 189375 16.36% 11.75% 0.72us 29655.25us 256.77us ( +- 0.70% ) HLT 20440 1.77% 69.83% 0.62us 79319.41us 14134.56us ( +- 0.79% ) VMCALL 12426 1.07% 0.03% 1.02us 5416.25us 8.77us ( +- 7.36% ) EXCEPTION_NMI 27 0.00% 0.00% 0.69us 1.34us 0.98us ( +- 3.50% ) EPT_MISCONFIG 5 0.00% 0.00% 5.15us 10.85us 7.88us ( +- 11.67% ) Total Samples:1157497, Total events handled time:413728274.66us.Other event types that can signal problems in the output of
perf kvm statinclude:-
INSN_EMULATION- suggests suboptimal VM I/O configuration.
-
For more information about using perf to monitor virtualization performance, see the perf-kvm man page.
numastat
To see the current NUMA configuration of your system, you can use the numastat utility, which is provided by installing the numactl package.
The following shows a host with 4 running VMs, each obtaining memory from multiple NUMA nodes. This is not optimal for vCPU performance, and warrants adjusting:
# numastat -c qemu-kvm

Per-node process memory usage (in MBs)
PID              Node 0 Node 1 Node 2 Node 3 Node 4 Node 5 Node 6 Node 7 Total
---------------  ------ ------ ------ ------ ------ ------ ------ ------ -----
51722 (qemu-kvm)     68     16    357   6936      2      3    147    598  8128
51747 (qemu-kvm)    245     11      5     18   5172   2532      1     92  8076
53736 (qemu-kvm)     62    432   1661    506   4851    136     22    445  8116
53773 (qemu-kvm)   1393      3      1      2     12      0      0   6702  8114
---------------  ------ ------ ------ ------ ------ ------ ------ ------ -----
Total              1769    463   2024   7462  10037   2672    169   7837 32434
In contrast, the following shows memory being provided to each VM by a single node, which is significantly more efficient.
# numastat -c qemu-kvm

Per-node process memory usage (in MBs)
PID              Node 0 Node 1 Node 2 Node 3 Node 4 Node 5 Node 6 Node 7 Total
---------------  ------ ------ ------ ------ ------ ------ ------ ------ -----
51747 (qemu-kvm)      0      0      7      0   8072      0      1      0  8080
53736 (qemu-kvm)      0      0      7      0      0      0   8113      0  8120
53773 (qemu-kvm)      0      0      7      0      0      0      1   8110  8118
59065 (qemu-kvm)      0      0   8050      0      0      0      0      0  8051
---------------  ------ ------ ------ ------ ------ ------ ------ ------ -----
Total 0 0 8072 0 8072 0 8114 8110 32368Chapter 15. Importance of power management
Reducing the overall power consumption of computer systems helps to save cost. Effectively optimizing energy consumption of each system component includes studying different tasks that your system performs, and configuring each component to ensure that its performance is correct for that job. Lowering the power consumption of a specific component or of the system as a whole leads to lower heat and performance.
Proper power management results in:
- heat reduction for servers and computing centers
- reduced secondary costs, including cooling, space, cables, generators, and uninterruptible power supplies (UPS)
- extended battery life for laptops
- lower carbon dioxide output
- meeting government regulations or legal requirements regarding Green IT, for example, Energy Star
- meeting company guidelines for new systems
This section describes the information regarding power management of your Red Hat Enterprise Linux systems.
15.1. Power management basics
Effective power management is built on the following principles:
An idle CPU should only wake up when neededSince Red Hat Enterprise Linux 6, the kernel runs
tickless, which means the previous periodic timer interrupts have been replaced with on-demand interrupts. Therefore, idle CPUs are allowed to remain idle until a new task is queued for processing, and CPUs that have entered lower power states can remain in these states longer. However, benefits from this feature can be offset if your system has applications that create unnecessary timer events. Polling events, such as checks for volume changes or mouse movement, are examples of such events.Red Hat Enterprise Linux includes tools using which you can identify and audit applications on the basis of their CPU usage. For more information see, Audit and analysis overview and Tools for auditing.
Unused hardware and devices should be disabled completely- This is true for devices that have moving parts, for example, hard disks. In addition to this, some applications may leave an unused but enabled device "open"; when this occurs, the kernel assumes that the device is in use, which can prevent the device from going into a power saving state.
Low activity should translate to low wattageIn many cases, however, this depends on modern hardware and correct BIOS configuration or UEFI on modern systems, including non-x86 architectures. Make sure that you are using the latest official firmware for your systems and that in the power management or device configuration sections of the BIOS the power management features are enabled. Some features to look for include:
- Collaborative Processor Performance Controls (CPPC) support for ARM64
- PowerNV support for IBM Power Systems
- SpeedStep
- PowerNow!
- Cool’n’Quiet
- ACPI (C-state)
Smart
If your hardware has support for these features and they are enabled in the BIOS, Red Hat Enterprise Linux uses them by default.
Different forms of CPU states and their effectsModern CPUs together with Advanced Configuration and Power Interface (ACPI) provide different power states. The three different states are:
- Sleep (C-states)
- Frequency and voltage (P-states)
Heat output (T-states or thermal states)
A CPU running on the lowest sleep state, consumes the least amount of watts, but it also takes considerably more time to wake it up from that state when needed. In very rare cases this can lead to the CPU having to wake up immediately every time it just went to sleep. This situation results in an effectively permanently busy CPU and loses some of the potential power saving if another state had been used.
A turned off machine uses the least amount of power- One of the best ways to save power is to turn off systems. For example, your company can develop a corporate culture focused on "green IT" awareness with a guideline to turn off machines during lunch break or when going home. You also might consolidate several physical servers into one bigger server and virtualize them using the virtualization technology, which is shipped with Red Hat Enterprise Linux.
15.2. Audit and analysis overview
The detailed manual audit, analysis, and tuning of a single system is usually the exception because the time and cost spent to do so typically outweighs the benefits gained from these last pieces of system tuning.
However, performing these tasks once for a large number of nearly identical systems where you can reuse the same settings for all systems can be very useful. For example, consider the deployment of thousands of desktop systems, or an HPC cluster where the machines are nearly identical. Another reason to do auditing and analysis is to provide a basis for comparison against which you can identify regressions or changes in system behavior in the future. The results of this analysis can be very helpful in cases where hardware, BIOS, or software updates happen regularly and you want to avoid any surprises with regard to power consumption. Generally, a thorough audit and analysis gives you a much better idea of what is really happening on a particular system.
Auditing and analyzing a system with regard to power consumption is relatively hard, even with the most modern systems available. Most systems do not provide the necessary means to measure power use via software. Exceptions exist though:
- iLO management console of Hewlett Packard server systems has a power management module that you can access through the web.
- IBM provides a similar solution in their BladeCenter power management module.
- On some Dell systems, the IT Assistant offers power monitoring capabilities as well.
Other vendors are likely to offer similar capabilities for their server platforms, but as can be seen there is no single solution available that is supported by all vendors. Direct measurements of power consumption are often only necessary to maximize savings as far as possible.
15.3. Tools for auditing
Red Hat Enterprise Linux 8 offers tools using which you can perform system auditing and analysis. Most of them can be used as supplementary sources of information in case you want to verify what you have discovered already or in case you need more in-depth information about certain parts.
Many of these tools are used for performance tuning as well, which include:
PowerTOP-
It identifies specific components of kernel and user-space applications that frequently wake up the CPU. Use the
powertopcommand as root to start the PowerTop tool andpowertop --calibrateto calibrate the power estimation engine. For more information about PowerTop, see Managing power consumption with PowerTOP. Diskdevstat and netdevstatThey are SystemTap tools that collect detailed information about the disk activity and network activity of all applications running on a system. Using the collected statistics by these tools, you can identify applications that waste power with many small I/O operations rather than fewer, larger operations. Using the
yum install tuned-utils-systemtap kernel-debuginfocommand as root, install thediskdevstatandnetdevstattool.To view the detailed information about the disk and network activity, use:
# diskdevstat

PID   UID   DEV   WRITE_CNT   WRITE_MIN   WRITE_MAX   WRITE_AVG   READ_CNT   READ_MIN   READ_MAX   READ_AVG   COMMAND

3575  1000  dm-2   59          0.000      0.365        0.006        5         0.000        0.000      0.000      mozStorage #5
3575  1000  dm-2    7          0.000      0.000        0.000        0         0.000        0.000      0.000      localStorage DB
[...]


# netdevstat

PID   UID   DEV       XMIT_CNT   XMIT_MIN   XMIT_MAX   XMIT_AVG   RECV_CNT   RECV_MIN   RECV_MAX   RECV_AVG   COMMAND
3572  991  enp0s31f6    40       0.000      0.882       0.108        0         0.000       0.000       0.000     openvpn
3575  1000 enp0s31f6    27       0.000      1.363       0.160        0         0.000       0.000       0.000     Socket Thread
[...]
With these commands, you can specify three parameters:
update_interval,total_duration, anddisplay_histogram.TuneD-
It is a profile-based system tuning tool that uses the
udevdevice manager to monitor connected devices, and enables both static and dynamic tuning of system settings. You can use thetuned-adm recommendcommand to determine which profile Red Hat recommends as the most suitable for a particular product. For more information about TuneD, see Getting started with TuneD and Customizing TuneD profiles. Using thepowertop2tuned utility, you can create custom TuneD profiles fromPowerTOPsuggestions. For information about thepowertop2tunedutility, see Optimizing power consumption. Virtual memory statistics (vmstat)It is provided by the
procps-ngpackage. Using this tool, you can view the detailed information about processes, memory, paging, block I/O, traps, and CPU activity.To view this information, use:
$ vmstat
procs -----------memory---------- ---swap-- -----io---- -system-- ------cpu-----
r  b  swpd  free    buff   cache   si   so  bi   bo   in  cs  us  sy id  wa  st
1  0   0   5805576 380856 4852848   0    0  119  73  814  640  2   2 96   0   0
Using the
vmstat -acommand, you can display active and inactive memory. For more information about othervmstatoptions, see thevmstatman page.iostatIt is provided by the
sysstatpackage. This tool is similar tovmstat, but only for monitoring I/O on block devices. It also provides more verbose output and statistics.To monitor the system I/O, use:
$ iostat avg-cpu: %user %nice %system %iowait %steal %idle 2.05 0.46 1.55 0.26 0.00 95.67 Device tps kB_read/s kB_wrtn/s kB_read kB_wrtn nvme0n1 53.54 899.48 616.99 3445229 2363196 dm-0 42.84 753.72 238.71 2886921 914296 dm-1 0.03 0.60 0.00 2292 0 dm-2 24.15 143.12 379.80 548193 1454712blktraceIt provides detailed information about how time is spent in the I/O subsystem.
To view this information in human readable format, use:
# blktrace -d /dev/dm-0 -o - | blkparse -i -

253,0   1    1   0.000000000  17694  Q   W 76423384 + 8 [kworker/u16:1]
253,0   2    1   0.001926913     0   C   W 76423384 + 8 [0]
[...]
Here, The first column, 253,0 is the device major and minor tuple. The second column, 1, gives information about the CPU, followed by columns for timestamps and PID of the process issuing the IO process.
The sixth column, Q, shows the event type, the 7th column, W for write operation, the 8th column, 76423384, is the block number, and the + 8 is the number of requested blocks.
The last field, [kworker/u16:1], is the process name.
By default, the
blktracecommand runs forever until the process is explicitly killed. Use the-woption to specify the run-time duration.turbostatIt is provided by the
kernel-toolspackage. It reports on processor topology, frequency, idle power-state statistics, temperature, and power usage on x86-64 processors.To view this summary, use:
# turbostat

CPUID(0): GenuineIntel 0x16 CPUID levels; 0x80000008 xlevels; family:model:stepping 0x6:8e:a (6:142:10)
CPUID(1): SSE3 MONITOR SMX EIST TM2 TSC MSR ACPI-TM HT TM
CPUID(6): APERF, TURBO, DTS, PTM, HWP, HWPnotify, HWPwindow, HWPepp, No-HWPpkg, EPB
[...]
By default,
turbostatprints a summary of counter results for the entire screen, followed by counter results every 5 seconds. Specify a different period between counter results with the-ioption, for example, executeturbostat -i 10to print results every 10 seconds instead.Turbostat is also useful for identifying servers that are inefficient in terms of power usage or idle time. It also helps to identify the rate of system management interrupts (SMIs) occurring on the system. It can also be used to verify the effects of power management tuning.
cpupowerIT is a collection of tools to examine and tune power saving related features of processors. Use the
cpupowercommand with thefrequency-info,frequency-set,idle-info,idle-set,set,info, andmonitoroptions to display and set processor related values.For example, to view available cpufreq governors, use:
$ cpupower frequency-info --governors
analyzing CPU 0:
  available cpufreq governors: performance powersave
For more information about
cpupower, see Viewing CPU related information.GNOME Power Manager- It is a daemon that is installed as part of the GNOME desktop environment. GNOME Power Manager notifies you of changes in your system’s power status; for example, a change from battery to AC power. It also reports battery status, and warns you when battery power is low.
Additional resources
-
powertop(1),diskdevstat(8),netdevstat(8),tuned(8),vmstat(8),iostat(1),blktrace(8),blkparse(8), andturbostat(8)man pages -
cpupower(1),cpupower-set(1),cpupower-info(1),cpupower-idle(1),cpupower-frequency-set(1),cpupower-frequency-info(1), andcpupower-monitor(1)man pages
Chapter 16. Managing power consumption with PowerTOP
As a system administrator, you can use the PowerTOP tool to analyze and manage power consumption.
16.1. The purpose of PowerTOP
PowerTOP is a program that diagnoses issues related to power consumption and provides suggestions on how to extend battery lifetime.
The PowerTOP tool can provide an estimate of the total power usage of the system and also individual power usage for each process, device, kernel worker, timer, and interrupt handler. The tool can also identify specific components of kernel and user-space applications that frequently wake up the CPU.
Red Hat Enterprise Linux 8 uses version 2.x of PowerTOP.
16.2. Using PowerTOP
Prerequisites
To be able to use PowerTOP, make sure that the
powertoppackage has been installed on your system:# yum install powertop
16.2.1. Starting PowerTOP
Procedure
To run PowerTOP, use the following command:
# powertop
Laptops should run on battery power when running the powertop command.
16.2.2. Calibrating PowerTOP
Procedure
On a laptop, you can calibrate the power estimation engine by running the following command:
# powertop --calibrateLet the calibration finish without interacting with the machine during the process.
Calibration takes time because the process performs various tests, cycles through brightness levels and switches devices on and off.
When the calibration process is completed, PowerTOP starts as normal. Let it run for approximately an hour to collect data.
When enough data is collected, power estimation figures will be displayed in the first column of the output table.
Note that powertop --calibrate can only be used on laptops.
16.2.3. Setting the measuring interval
By default, PowerTOP takes measurements in 20 seconds intervals.
If you want to change this measuring frequency, use the following procedure:
Procedure
Run the
powertopcommand with the--timeoption:# powertop --time=time in seconds
16.3. PowerTOP statistics
While it runs, PowerTOP gathers statistics from the system.
PowerTOP's output provides multiple tabs:
-
Overview -
Idle stats -
Frequency stats -
Device stats -
Tunables -
WakeUp
You can use the Tab and Shift+Tab keys to cycle through these tabs.
16.3.1. The Overview tab
In the Overview tab, you can view a list of the components that either send wakeups to the CPU most frequently or consume the most power. The items within the Overview tab, including processes, interrupts, devices, and other resources, are sorted according to their utilization.
The adjacent columns within the Overview tab provide the following pieces of information:
- Usage
- Power estimation of how the resource is being used.
- Events/s
- Wakeups per second. The number of wakeups per second indicates how efficiently the services or the devices and drivers of the kernel are performing. Less wakeups means that less power is consumed. Components are ordered by how much further their power usage can be optimized.
- Category
- Classification of the component; such as process, device, or timer.
- Description
- Description of the component.
If properly calibrated, a power consumption estimation for every listed item in the first column is shown as well.
Apart from this, the Overview tab includes the line with summary statistics such as:
- Total power consumption
- Remaining battery life (only if applicable)
- Summary of total wakeups per second, GPU operations per second, and virtual file system operations per second
16.3.2. The Idle stats tab
The Idle stats tab shows usage of C-states for all processors and cores, while the Frequency stats tab shows usage of P-states including the Turbo mode, if applicable, for all processors and cores. The duration of C- or P-states is an indication of how well the CPU usage has been optimized. The longer the CPU stays in the higher C- or P-states (for example C4 is higher than C3), the better the CPU usage optimization is. Ideally, residency is 90% or more in the highest C- or P-state when the system is idle.
16.3.3. The Device stats tab
The Device stats tab provides similar information to the Overview tab but only for devices.
16.3.4. The Tunables tab
The Tunables tab contains PowerTOP's suggestions for optimizing the system for lower power consumption.
Use the up and down keys to move through suggestions, and the enter key to toggle the suggestion on or off.
16.3.5. The WakeUp tab
The WakeUp tab displays the device wakeup settings available for users to change as and when required.
Use the up and down keys to move through the available settings, and the enter key to enable or disable a setting.
Figure 16.1. PowerTOP output

Additional resources
For more details on PowerTOP, see PowerTOP’s home page.
16.4. Why Powertop does not display Frequency stats values in some instances
While using the Intel P-State driver, PowerTOP only displays values in the Frequency Stats tab if the driver is in passive mode. But, even in this case, the values may be incomplete.
In total, there are three possible modes of the Intel P-State driver:
- Active mode with Hardware P-States (HWP)
- Active mode without HWP
- Passive mode
Switching to the ACPI CPUfreq driver results in complete information being displayed by PowerTOP. However, it is recommended to keep your system on the default settings.
To see what driver is loaded and in what mode, run:
# cat /sys/devices/system/cpu/cpu0/cpufreq/scaling_driver-
intel_pstateis returned if the Intel P-State driver is loaded and in active mode. -
intel_cpufreqis returned if the Intel P-State driver is loaded and in passive mode. -
acpi-cpufreqis returned if the ACPI CPUfreq driver is loaded.
While using the Intel P-State driver, add the following argument to the kernel boot command line to force the driver to run in passive mode:
intel_pstate=passive
To disable the Intel P-State driver and use, instead, the ACPI CPUfreq driver, add the following argument to the kernel boot command line:
intel_pstate=disable
16.5. Generating an HTML output
Apart from the powertop’s output in terminal, you can also generate an HTML report.
Procedure
Run the
powertopcommand with the--htmloption:# powertop --html=htmlfile.htmlReplace the
htmlfile.htmlparameter with the required name for the output file.
16.6. Optimizing power consumption
To optimize power consumption, you can use either the powertop service or the powertop2tuned utility.
16.6.1. Optimizing power consumption using the powertop service
You can use the powertop service to automatically enable all PowerTOP's suggestions from the Tunables tab on the boot:
Procedure
Enable the
powertopservice:# systemctl enable powertop
16.6.2. The powertop2tuned utility
The powertop2tuned utility allows you to create custom TuneD profiles from PowerTOP suggestions.
By default, powertop2tuned creates profiles in the /etc/tuned/ directory, and bases the custom profile on the currently selected TuneD profile. For safety reasons, all PowerTOP tunings are initially disabled in the new profile.
To enable the tunings, you can:
-
Uncomment them in the
/etc/tuned/profile_name/tuned.conf file. Use the
--enableor-eoption to generate a new profile that enables most of the tunings suggested by PowerTOP.Certain potentially problematic tunings, such as the USB autosuspend, are disabled by default and need to be uncommented manually.
16.6.3. Optimizing power consumption using the powertop2tuned utility
Prerequisites
The
powertop2tunedutility is installed on the system:# yum install tuned-utils
Procedure
Create a custom profile:
# powertop2tuned new_profile_nameActivate the new profile:
# tuned-adm profile new_profile_name
Additional information
For a complete list of options that
powertop2tunedsupports, use:$ powertop2tuned --help
16.6.4. Comparison of powertop.service and powertop2tuned
Optimizing power consumption with powertop2tuned is preferred over powertop.service for the following reasons:
-
The
powertop2tunedutility represents integration of PowerTOP into TuneD, which enables to benefit of advantages of both tools. -
The
powertop2tunedutility allows for fine-grained control of enabled tuning. -
With
powertop2tuned, potentially dangerous tuning are not automatically enabled. -
With
powertop2tuned, rollback is possible without reboot.
Chapter 17. Tuning CPU frequency to optimize energy consumption
You can optimize the power consumption of your system by using the available cpupower commands to set CPU speed on a system according to your requirements after setting up the required CPUfreq governor.
17.1. Supported cpupower tool commands
The cpupower tool is a collection of tools to examine and tune power saving related features of processors.
The cpupower tool supports the following commands:
idle-info-
Displays the available idle states and other statistics for the CPU idle driver using the
cpupower idle-infocommand. For more information, see CPU Idle States. idle-set-
Enables or disables specific CPU idle state using the
cpupower idle-setcommand as root. Use-dto disable and-eto enable a specific CPU idle state. frequency-info-
Displays the current
cpufreqdriver and availablecpufreqgovernors using thecpupower frequency-infocommand. For more information, see CPUfreq drivers, Core CPUfreq Governors, and Intel P-state CPUfreq governors. frequency-set-
Sets the
cpufreqand governors using thecpupower frequency-setcommand as root. For more information, see Setting up CPUfreq governor. setSets processor power saving policies using the
cpupower setcommand as root.Using the
--perf-biasoption, you can enable software on supported Intel processors to determine the balance between optimum performance and saving power. Assigned values range from0to15, where0is optimum performance and15is optimum power efficiency. By default, the--perf-biasoption applies to all cores. To apply it only to individual cores, add the--cpu cpulistoption.infoDisplays processor power related and hardware configurations, which you have enabled using the
cpupower setcommand. For example, if you assign the--perf-biasvalue as5:# cpupower set --perf-bias 5 # cpupower info analyzing CPU 0: perf-bias: 5
monitorDisplays the idle statistics and CPU demands using the
cpupower monitorcommand.# cpupower monitor | Nehalem || Mperf ||Idle_Stats CPU| C3 | C6 | PC3 | PC6 || C0 | Cx | Freq || POLL | C1 | C1E | C3 | C6 | C7s | C8 | C9 | C10 0| 1.95| 55.12| 0.00| 0.00|| 4.21| 95.79| 3875|| 0.00| 0.68| 2.07| 3.39| 88.77| 0.00| 0.00| 0.00| 0.00 [...]
Using the
-loption, you can list all available monitors on your system and the-moption to display information related to specific monitors. For example, to monitor information related to theMperfmonitor, use thecpupower monitor -m Mperfcommand as root.
Additional resources
-
cpupower(1),cpupower-idle-info(1),cpupower-idle-set(1),cpupower-frequency-set(1),cpupower-frequency-info(1),cpupower-set(1),cpupower-info(1), andcpupower-monitor(1)man pages
17.2. CPU Idle States
CPUs with the x86 architecture support various states, such as, few parts of the CPU are deactivated or using lower performance settings, known as C-states.
With this state, you can save power by partially deactivating CPUs that are not in use. There is no need to configure the C-state, unlike P-states that require a governor and potentially some set up to avoid undesirable power or performance issues. C-states are numbered from C0 upwards, with higher numbers representing decreased CPU functionality and greater power saving. C-states of a given number are broadly similar across processors, although the exact details of the specific feature sets of the state may vary between processor families. C-states 0–3 are defined as follows:
C0- In this state, the CPU is working and not idle at all.
C1, Halt- In this state, the processor is not executing any instructions but is typically not in a lower power state. The CPU can continue processing with practically no delay. All processors offering C-states need to support this state. Pentium 4 processors support an enhanced C1 state called C1E that actually is a state for lower power consumption.
C2, Stop-Clock- In this state, the clock is frozen for this processor but it keeps the complete state for its registers and caches, so after starting the clock again it can immediately start processing again. This is an optional state.
C3, Sleep- In this state, the processor goes to sleep and does not need to keep its cache up to date. Due to this reason, waking up from this state needs considerably more time than from the C2 state. This is an optional state.
You can view the available idle states and other statistics for the CPUidle driver using the following command:
$ cpupower idle-info
CPUidle governor: menu
analyzing CPU 0:

Number of idle states: 9
Available idle states: POLL C1 C1E C3 C6 C7s C8 C9 C10
[...]
Intel CPUs with the "Nehalem" microarchitecture features a C6 state, which can reduce the voltage supply of a CPU to zero, but typically reduces power consumption by between 80% and 90%. The kernel in Red Hat Enterprise Linux 8 includes optimizations for this new C-state.
Additional resources
-
cpupower(1)andcpupower-idle(1)man pages
17.3. Overview of CPUfreq
One of the most effective ways to reduce power consumption and heat output on your system is CPUfreq, which is supported by x86 and ARM64 architectures in Red Hat Enterprise Linux 8. CPUfreq, also referred to as CPU speed scaling, is the infrastructure in the Linux kernel that enables it to scale the CPU frequency in order to save power.
CPU scaling can be done automatically depending on the system load, in response to Advanced Configuration and Power Interface (ACPI) events, or manually by user-space programs, and it allows the clock speed of the processor to be adjusted on the fly. This enables the system to run at a reduced clock speed to save power. The rules for shifting frequencies, whether to a faster or slower clock speed and when to shift frequencies, are defined by the CPUfreq governor.
You can view the cpufreq information using the cpupower frequency-info command as root.
17.3.1. CPUfreq drivers
Using the cpupower frequency-info --driver command as root, you can view the current CPUfreq driver.
The following are the two available drivers for CPUfreq that can be used:
ACPI CPUfreq- Advanced Configuration and Power Interface (ACPI) CPUfreq driver is a kernel driver that controls the frequency of a particular CPU through ACPI, which ensures the communication between the kernel and the hardware.
Intel P-stateIn Red Hat Enterprise Linux 8, Intel P-state driver is supported. The driver provides an interface for controlling the P-state selection on processors based on the Intel Xeon E series architecture or newer architectures.
Currently, Intel P-state is used by default for supported CPUs. You can switch to using ACPI CPUfreq by adding the
intel_pstate=disablecommand to the kernel command line.Intel P-state implements the
setpolicy()callback. The driver decides what P-state to use based on the policy requested from thecpufreqcore. If the processor is capable of selecting its next P-state internally, the driver offloads this responsibility to the processor. If not, the driver implements algorithms to select the next P-state.Intel P-state provides its own
sysfsfiles to control the P-state selection. These files are located in the/sys/devices/system/cpu/intel_pstate/directory. Any changes made to the files are applicable to all CPUs.This directory contains the following files that are used for setting P-state parameters:
-
max_perf_pctlimits the maximum P-state requested by the driver expressed in a percentage of available performance. The available P-state performance can be reduced by theno_turbosetting. -
min_perf_pctlimits the minimum P-state requested by the driver, expressed in a percentage of the maximumno-turboperformance level. -
no_turbolimits the driver to selecting P-state below the turbo frequency range. -
turbo_pctdisplays the percentage of the total performance supported by hardware that is in the turbo range. This number is independent of whetherturbohas been disabled or not. -
num_pstatesdisplays the number of P-states that are supported by hardware. This number is independent of whether turbo has been disabled or not.
-
Additional resources
-
cpupower-frequency-info(1)man page
17.3.2. Core CPUfreq governors
A CPUfreq governor defines the power characteristics of the system CPU, which in turn affects the CPU performance. Each governor has its own unique behavior, purpose, and suitability in terms of workload. Using the cpupower frequency-info --governor command as root, you can view the available CPUfreq governors.
Red Hat Enterprise Linux 8 includes multiple core CPUfreq governors:
cpufreq_performance- It forces the CPU to use the highest possible clock frequency. This frequency is statically set and does not change. As such, this particular governor offers no power saving benefit. It is only suitable for hours of a heavy workload, and only during times wherein the CPU is rarely or never idle.
cpufreq_powersave-
It forces the CPU to use the lowest possible clock frequency. This frequency is statically set and does not change. This governor offers maximum power savings, but at the cost of the lowest CPU performance. The term "powersave" can sometimes be deceiving though, since in principle a slow CPU on full load consumes more power than a fast CPU that is not loaded. As such, while it may be advisable to set the CPU to use the
powersavegovernor during times of expected low activity, any unexpected high loads during that time can cause the system to actually consume more power. The Powersave governor is more of a speed limiter for the CPU than a power saver. It is most useful in systems and environments where overheating can be a problem. cpufreq_ondemand-
It is a dynamic governor, using which you can enable the CPU to achieve maximum clock frequency when the system load is high, and also minimum clock frequency when the system is idle. While this allows the system to adjust power consumption accordingly with respect to system load, it does so at the expense of latency between frequency switching. As such, latency can offset any performance or power saving benefits offered by the
ondemandgovernor if the system switches between idle and heavy workloads too often. For most systems, theondemandgovernor can provide the best compromise between heat emission, power consumption, performance, and manageability. When the system is only busy at specific times of the day, theondemandgovernor automatically switches between maximum and minimum frequency depending on the load without any further intervention. cpufreq_userspace-
It allows user-space programs, or any process running as root, to set the frequency. Of all the governors,
userspaceis the most customizable and depending on how it is configured, it can offer the best balance between performance and consumption for your system. cpufreq_conservative-
Similar to the
ondemandgovernor, theconservativegovernor also adjusts the clock frequency according to usage. However, theconservativegovernor switches between frequencies more gradually. This means that theconservativegovernor adjusts to a clock frequency that it considers best for the load, rather than simply choosing between maximum and minimum. While this can possibly provide significant savings in power consumption, it does so at an ever greater latency than theondemandgovernor.
You can enable a governor using cron jobs. This allows you to automatically set specific governors during specific times of the day. As such, you can specify a low-frequency governor during idle times, for example, after work hours, and return to a higher-frequency governor during hours of heavy workload.
For instructions on how to enable a specific governor, see Setting up CPUfreq governor.
17.3.3. Intel P-state CPUfreq governors
By default, the Intel P-state driver operates in active mode with or without Hardware p-state (HWP) depending on whether the CPU supports HWP.
Using the cpupower frequency-info --governor command as root, you can view the available CPUfreq governors.
The functionality of performance and powersave Intel P-state CPUfreq governors is different compared to core CPUfreq governors of the same names.
The Intel P-state driver can operate in the following three different modes:
Active mode with hardware-managed P-statesWhen active mode with HWP is used, the Intel P-state driver instructs the CPU to perform the P-state selection. The driver can provide frequency hints. However, the final selection depends on CPU internal logic. In active mode with HWP, the Intel P-state driver provides two P-state selection algorithms:
-
performance: With theperformancegovernor, the driver instructs internal CPU logic to be performance-oriented. The range of allowed P-states is restricted to the upper boundary of the range that the driver is allowed to use. -
powersave: With thepowersavegovernor, the driver instructs internal CPU logic to be powersave-oriented.
-
Active mode without hardware-managed P-statesWhen active mode without HWP is used, the Intel P-state driver provides two P-state selection algorithms:
-
performance: With theperformancegovernor, the driver chooses the maximum P-state it is allowed to use. -
powersave: With thepowersavegovernor, the driver chooses P-states proportional to the current CPU utilization. The behavior is similar to theondemandCPUfreq core governor.
-
Passive mode-
When the
passivemode is used, the Intel P-state driver functions the same as the traditional CPUfreq scaling driver. All available generic CPUFreq core governors can be used.
17.3.4. Setting up CPUfreq governor
All CPUfreq drivers are built in as part of the kernel-tools package, and selected automatically. To set up CPUfreq, you need to select a governor.
Prerequisites
To use
cpupower, install thekernel-toolspackage:# yum install kernel-tools
Procedure
View which governors are available for use for a specific CPU:
# cpupower frequency-info --governors
analyzing CPU 0:
  available cpufreq governors: performance powersave
Enable one of the governors on all CPUs:
# cpupower frequency-set --governor performanceReplace the
performancegovernor with thecpufreqgovernor name as per your requirement.To only enable a governor on specific cores, use
-cwith a range or comma-separated list of CPU numbers. For example, to enable theuserspacegovernor for CPUs 1-3 and 5, use:# cpupower -c 1-3,5 frequency-set --governor cpufreq_userspace
If the kernel-tools package is not installed, the CPUfreq settings can be viewed in the /sys/devices/system/cpu/cpuid/cpufreq/ directory. Settings and values can be changed by writing to these tunables. For example, to set the minimum clock speed of cpu0 to 360 MHz, use:
# echo 360000 > /sys/devices/system/cpu/cpu0/cpufreq/scaling_min_freq
Verification
Verify that the governor is enabled:
# cpupower frequency-info
analyzing CPU 0:
  driver: intel_pstate
  CPUs which run at the same hardware frequency: 0
  CPUs which need to have their frequency coordinated by software: 0
  maximum transition latency:  Cannot determine or is not supported.
  hardware limits: 400 MHz - 4.20 GHz
  available cpufreq governors: performance powersave
  current policy: frequency should be within 400 MHz and 4.20 GHz.
        The governor "performance" may decide which speed to use within this range.
  current CPU frequency: Unable to call hardware
  current CPU frequency: 3.88 GHz (asserted by call to kernel)
  boost state support:
    Supported: yes
    Active: yes
The current policy displays the recently enabled
cpufreqgovernor. In this case, it isperformance.
Additional resources
-
cpupower-frequency-info(1)andcpupower-frequency-set(1)man pages
Chapter 18. Getting started with perf
As a system administrator, you can use the perf tool to collect and analyze performance data of your system.
18.1. Introduction to perf
The perf user-space tool interfaces with the kernel-based subsystem Performance Counters for Linux (PCL). perf is a powerful tool that uses the Performance Monitoring Unit (PMU) to measure, record, and monitor a variety of hardware and software events. perf also supports tracepoints, kprobes, and uprobes.
18.2. Installing perf
This procedure installs the perf user-space tool.
Procedure
Install the
perftool:# yum install perf
18.3. Common perf commands
perf stat- This command provides overall statistics for common performance events, including instructions executed and clock cycles consumed. Options allow for selection of events other than the default measurement events.
perf record-
This command records performance data into a file,
perf.data, which can be later analyzed using theperf reportcommand. perf report-
This command reads and displays the performance data from the
perf.datafile created byperf record. perf list- This command lists the events available on a particular machine. These events will vary based on performance monitoring hardware and software configuration of the system.
perf top-
This command performs a similar function to the
toputility. It generates and displays a performance counter profile in realtime. perf trace-
This command performs a similar function to the
stracetool. It monitors the system calls used by a specified thread or process and all signals received by that application. perf help-
This command displays a complete list of
perfcommands.
Additional resources
-
Add the
--helpoption to a subcommand to open the man page.
Chapter 19. Profiling CPU usage in real time with perf top
You can use the perf top command to measure CPU usage of different functions in real time.
Prerequisites
-
You have the
perfuser space tool installed as described in Installing perf.
19.1. The purpose of perf top
The perf top command is used for real time system profiling and functions similarly to the top utility. However, where the top utility generally shows you how much CPU time a given process or thread is using, perf top shows you how much CPU time each specific function uses. In its default state, perf top tells you about functions being used across all CPUs in both the user-space and the kernel-space. To use perf top you need root access.
19.2. Profiling CPU usage with perf top
This procedure activates perf top and profiles CPU usage in real time.
Prerequisites
-
You have the
perfuser space tool installed as described in Installing perf. - You have root access
Procedure
Start the
perf topmonitoring interface:# perf top
The monitoring interface looks similar to the following:
Samples: 8K of event 'cycles', 2000 Hz, Event count (approx.): 4579432780 lost: 0/0 drop: 0/0
Overhead  Shared Object       Symbol
   2.20%  [kernel]            [k] do_syscall_64
   2.17%  [kernel]            [k] module_get_kallsym
   1.49%  [kernel]            [k] copy_user_enhanced_fast_string
   1.37%  libpthread-2.29.so  [.] pthread_mutex_lock 1.31% [unknown] [.] 0000000000000000 1.07% [kernel] [k] psi_task_change 1.04% [kernel] [k] switch_mm_irqs_off 0.94% [kernel] [k] fget
   0.74%  [kernel]            [k] entry_SYSCALL_64
   0.69%  [kernel]            [k] syscall_return_via_sysret
   0.69%  libxul.so           [.] 0x000000000113f9b0
   0.67%  [kernel]            [k] kallsyms_expand_symbol.constprop.0
   0.65%  firefox             [.] moz_xmalloc
   0.65%  libpthread-2.29.so  [.] __pthread_mutex_unlock_usercnt
   0.60%  firefox             [.] free
   0.60%  libxul.so           [.] 0x000000000241d1cd
   0.60%  [kernel]            [k] do_sys_poll
   0.58%  [kernel]            [k] menu_select
   0.56%  [kernel]            [k] _raw_spin_lock_irqsave
   0.55%  perf                [.] 0x00000000002ae0f3
In this example, the kernel function
do_syscall_64is using the most CPU time.
Additional resources
-
perf-top(1)man page
19.3. Interpretation of perf top output
The perf top monitoring interface displays the data in several columns:
- The "Overhead" column
- Displays the percent of CPU a given function is using.
- The "Shared Object" column
- Displays name of the program or library which is using the function.
- The "Symbol" column
-
Displays the function name or symbol. Functions executed in the kernel-space are identified by
[k]and functions executed in the user-space are identified by[.].
19.4. Why perf displays some function names as raw function addresses
For kernel functions, perf uses the information from the /proc/kallsyms file to map the samples to their respective function names or symbols. For functions executed in the user space, however, you might see raw function addresses because the binary is stripped.
The debuginfo package of the executable must be installed or, if the executable is a locally developed application, the application must be compiled with debugging information turned on (the -g option in GCC) to display the function names or symbols in such a situation.
It is not necessary to re-run the perf record command after installing the debuginfo associated with an executable. Simply re-run the perf report command.
Additional Resources
19.5. Enabling debug and source repositories
A standard installation of Red Hat Enterprise Linux does not enable the debug and source repositories. These repositories contain information needed to debug the system components and measure their performance.
Procedure
Enable the source and debug information package channels:
# subscription-manager repos --enable rhel-8-for-$(uname -i)-baseos-debug-rpms
# subscription-manager repos --enable rhel-8-for-$(uname -i)-baseos-source-rpms
# subscription-manager repos --enable rhel-8-for-$(uname -i)-appstream-debug-rpms
# subscription-manager repos --enable rhel-8-for-$(uname -i)-appstream-source-rpms
The
$(uname -i)part is automatically replaced with a matching value for architecture of your system:Architecture name Value 64-bit Intel and AMD
x86_64
64-bit ARM
aarch64
IBM POWER
ppc64le
64-bit IBM Z
s390x
19.6. Getting debuginfo packages for an application or library using GDB
Debugging information is required to debug code. For code that is installed from a package, the GNU Debugger (GDB) automatically recognizes missing debug information, resolves the package name and provides concrete advice on how to get the package.
Prerequisites
- The application or library you want to debug must be installed on the system.
-
GDB and the
debuginfo-installtool must be installed on the system. For details, see Setting up to debug applications. -
Repositories providing
debuginfoanddebugsourcepackages must be configured and enabled on the system. For details, see Enabling debug and source repositories.
Procedure
Start GDB attached to the application or library you want to debug. GDB automatically recognizes missing debugging information and suggests a command to run.
$ gdb -q /bin/ls
Reading symbols from /bin/ls...Reading symbols from .gnu_debugdata for /usr/bin/ls...(no debugging symbols found)...done.
(no debugging symbols found)...done.
Missing separate debuginfos, use: dnf debuginfo-install coreutils-8.30-6.el8.x86_64
(gdb)
Exit GDB: type q and confirm with Enter.
(gdb) q
Run the command suggested by GDB to install the required
debuginfopackages:# dnf debuginfo-install coreutils-8.30-6.el8.x86_64
The
dnfpackage management tool provides a summary of the changes, asks for confirmation and once you confirm, downloads and installs all the necessary files.-
In case GDB is not able to suggest the
debuginfopackage, follow the procedure described in Getting debuginfo packages for an application or library manually.
Additional resources
- How can I download or install debuginfo packages for RHEL systems? — Red Hat Knowledgebase solution
Chapter 20. Counting events during process execution with perf stat
You can use the perf stat command to count hardware and software events during process execution.
Prerequisites
-
You have the
perfuser space tool installed as described in Installing perf.
20.1. The purpose of perf stat
The perf stat command executes a specified command, keeps a running count of hardware and software event occurrences during the commands execution, and generates statistics of these counts. If you do not specify any events, then perf stat counts a set of common hardware and software events.
20.2. Counting events with perf stat
You can use perf stat to count hardware and software event occurrences during command execution and generate statistics of these counts. By default, perf stat operates in per-thread mode.
Prerequisites
-
You have the
perfuser space tool installed as described in Installing perf.
Procedure
Count the events.
Running the
perf statcommand without root access will only count events occurring in the user space:$ perf stat ls
Example 20.1. Output of perf stat ran without root access
Desktop  Documents  Downloads  Music  Pictures  Public  Templates  Videos

 Performance counter stats for 'ls':

              1.28 msec task-clock:u               #    0.165 CPUs utilized
                 0      context-switches:u         #    0.000 M/sec
                 0      cpu-migrations:u           #    0.000 K/sec
               104      page-faults:u              #    0.081 M/sec
         1,054,302      cycles:u                   #    0.823 GHz
         1,136,989      instructions:u             #    1.08  insn per cycle
           228,531      branches:u                 #  178.447 M/sec
            11,331      branch-misses:u            #    4.96% of all branches

       0.007754312 seconds time elapsed

       0.000000000 seconds user
       0.007717000 seconds sys
As you can see in the previous example, when
perf statruns without root access the event names are followed by:u, indicating that these events were counted only in the user-space.To count both user-space and kernel-space events, you must have root access when running
perf stat:# perf stat ls
Example 20.2. Output of perf stat ran with root access
Desktop  Documents  Downloads  Music  Pictures  Public  Templates  Videos

 Performance counter stats for 'ls':

              3.09 msec task-clock                #    0.119 CPUs utilized
                18      context-switches          #    0.006 M/sec
                 3      cpu-migrations            #    0.969 K/sec
               108      page-faults               #    0.035 M/sec
         6,576,004      cycles                    #    2.125 GHz
         5,694,223      instructions              #    0.87  insn per cycle
         1,092,372      branches                  #  352.960 M/sec
            31,515      branch-misses             #    2.89% of all branches

       0.026020043 seconds time elapsed

       0.000000000 seconds user
       0.014061000 seconds sys
By default,
perf statoperates in per-thread mode. To change to CPU-wide event counting, pass the-aoption toperf stat. To count CPU-wide events, you need root access:# perf stat -a ls
Additional resources
-
perf-stat(1)man page
20.3. Interpretation of perf stat output
perf stat executes a specified command and counts event occurrences during the commands execution and displays statistics of these counts in three columns:
- The number of occurrences counted for a given event
- The name of the event that was counted
When related metrics are available, a ratio or percentage is displayed after the hash sign (
#) in the right-most column.For example, when running in default mode,
perf statcounts both cycles and instructions and, therefore, calculates and displays instructions per cycle in the right-most column. You can see similar behavior with regard to branch-misses as a percent of all branches since both events are counted by default.
20.4. Attaching perf stat to a running process
You can attach perf stat to a running process. This will instruct perf stat to count event occurrences only in the specified processes during the execution of a command.
Prerequisites
-
You have the
perfuser space tool installed as described in Installing perf.
Procedure
Attach
perf statto a running process:$ perf stat -p ID1,ID2 sleep seconds
The previous example counts events in the processes with the IDs of
ID1andID2for a time period ofsecondsseconds as dictated by using thesleepcommand.
Additional resources
-
perf-stat(1)man page
Chapter 21. Recording and analyzing performance profiles with perf
The perf tool allows you to record performance data and analyze it at a later time.
Prerequisites
-
You have the
perfuser space tool installed as described in Installing perf.
21.1. The purpose of perf record
The perf record command samples performance data and stores it in a file, perf.data, which can be read and visualized with other perf commands. perf.data is generated in the current directory and can be accessed at a later time, possibly on a different machine.
If you do not specify a command for perf record to record during, it will record until you manually stop the process by pressing Ctrl+C. You can attach perf record to specific processes by passing the -p option followed by one or more process IDs. You can run perf record without root access, however, doing so will only sample performance data in the user space. In the default mode, perf record uses CPU cycles as the sampling event and operates in per-thread mode with inherit mode enabled.
21.2. Recording a performance profile without root access
You can use perf record without root access to sample and record performance data in the user-space only.
Prerequisites
-
You have the
perfuser space tool installed as described in Installing perf.
Procedure
Sample and record the performance data:
$ perf record commandReplace
commandwith the command you want to sample data during. If you do not specify a command, thenperf recordwill sample data until you manually stop it by pressing Ctrl+C.
Additional resources
-
perf-record(1)man page
21.3. Recording a performance profile with root access
You can use perf record with root access to sample and record performance data in both the user-space and the kernel-space simultaneously.
Prerequisites
-
You have the
perfuser space tool installed as described in Installing perf. - You have root access.
Procedure
Sample and record the performance data:
# perf record commandReplace
commandwith the command you want to sample data during. If you do not specify a command, thenperf recordwill sample data until you manually stop it by pressing Ctrl+C.
Additional resources
-
perf-record(1)man page
21.4. Recording a performance profile in per-CPU mode
You can use perf record in per-CPU mode to sample and record performance data in both and user-space and the kernel-space simultaneously across all threads on a monitored CPU. By default, per-CPU mode monitors all online CPUs.
Prerequisites
-
You have the
perfuser space tool installed as described in Installing perf.
Procedure
Sample and record the performance data:
# perf record -a commandReplace
commandwith the command you want to sample data during. If you do not specify a command, thenperf recordwill sample data until you manually stop it by pressing Ctrl+C.
Additional resources
-
perf-record(1)man page
21.5. Capturing call graph data with perf record
You can configure the perf record tool so that it records which function is calling other functions in the performance profile. This helps to identify a bottleneck if several processes are calling the same function.
Prerequisites
-
You have the
perfuser space tool installed as described in Installing perf.
Procedure
Sample and record performance data with the
--call-graphoption:$ perf record --call-graph method command
-
Replace
commandwith the command you want to sample data during. If you do not specify a command, thenperf recordwill sample data until you manually stop it by pressing Ctrl+C. Replace method with one of the following unwinding methods:
fp-
Uses the frame pointer method. Depending on compiler optimization, such as with binaries built with the GCC option
--fomit-frame-pointer, this may not be able to unwind the stack. dwarf- Uses DWARF Call Frame Information to unwind the stack.
lbr- Uses the last branch record hardware on Intel processors.
-
Replace
Additional resources
-
perf-record(1)man page
21.6. Analyzing perf.data with perf report
You can use perf report to display and analyze a perf.data file.
Prerequisites
-
You have the
perfuser space tool installed as described in Installing perf. -
There is a
perf.datafile in the current directory. -
If the
perf.datafile was created with root access, you need to runperf reportwith root access too.
Procedure
Display the contents of the
perf.datafile for further analysis:# perf report
This command displays output similar to the following:
Samples: 2K of event 'cycles', Event count (approx.): 235462960
Overhead  Command          Shared Object                     Symbol
   2.36%  kswapd0          [kernel.kallsyms]                 [k] page_vma_mapped_walk
   2.13%  sssd_kcm         libc-2.28.so                      [.] memset_avx2_erms 2.13% perf [kernel.kallsyms] [k] smp_call_function_single 1.53% gnome-shell libc-2.28.so [.] strcmp_avx2
   1.17%  gnome-shell      libglib-2.0.so.0.5600.4           [.] g_hash_table_lookup
   0.93%  Xorg             libc-2.28.so                      [.] memmove_avx_unaligned_erms 0.89% gnome-shell libgobject-2.0.so.0.5600.4 [.] g_object_unref 0.87% kswapd0 [kernel.kallsyms] [k] page_referenced_one 0.86% gnome-shell libc-2.28.so [.] memmove_avx_unaligned_erms
   0.83%  Xorg             [kernel.kallsyms]                 [k] alloc_vmap_area
   0.63%  gnome-shell      libglib-2.0.so.0.5600.4           [.] g_slice_alloc
   0.53%  gnome-shell      libgirepository-1.0.so.1.0.0      [.] g_base_info_unref
   0.53%  gnome-shell      ld-2.28.so                        [.] _dl_find_dso_for_object
   0.49%  kswapd0          [kernel.kallsyms]                 [k] vma_interval_tree_iter_next
   0.48%  gnome-shell      libpthread-2.28.so                [.] pthread_getspecific 0.47% gnome-shell libgirepository-1.0.so.1.0.0 [.] 0x0000000000013b1d 0.45% gnome-shell libglib-2.0.so.0.5600.4 [.] g_slice_free1 0.45% gnome-shell libgobject-2.0.so.0.5600.4 [.] g_type_check_instance_is_fundamentally_a 0.44% gnome-shell libc-2.28.so [.] malloc 0.41% swapper [kernel.kallsyms] [k] apic_timer_interrupt 0.40% gnome-shell ld-2.28.so [.] _dl_lookup_symbol_x 0.39% kswapd0 [kernel.kallsyms] [k] raw_callee_save___pv_queued_spin_unlock
Additional resources
-
perf-report(1)man page
21.7. Interpretation of perf report output
The table displayed by running the perf report command sorts the data into several columns:
- The 'Overhead' column
- Indicates what percentage of overall samples were collected in that particular function.
- The 'Command' column
- Tells you which process the samples were collected from.
- The 'Shared Object' column
- Displays the name of the ELF image where the samples come from (the name [kernel.kallsyms] is used when the samples come from the kernel).
- The 'Symbol' column
- Displays the function name or symbol.
In default mode, the functions are sorted in descending order with those with the highest overhead displayed first.
21.8. Generating a perf.data file that is readable on a different device
You can use the perf tool to record performance data into a perf.data file to be analyzed on a different device.
Prerequisites
-
You have the
perfuser space tool installed as described in Installing perf. -
The kernel
debuginfopackage is installed. For more information, see Getting debuginfo packages for an application or library using GDB.
Procedure
Capture performance data you are interested in investigating further:
# perf record -a --call-graph fp sleep secondsThis example would generate a
perf.dataover the entire system for a period ofsecondsseconds as dictated by the use of thesleepcommand. It would also capture call graph data using the frame pointer method.Generate an archive file containing debug symbols of the recorded data:
# perf archive
Verification steps
Verify that the archive file has been generated in your current active directory:
# ls perf.data*
The output will display every file in your current directory that begins with
perf.data. The archive file will be named either:perf.data.tar.gz
or
perf.data.tar.bz2
21.9. Analyzing a perf.data file that was created on a different device
You can use the perf tool to analyze a perf.data file that was generated on a different device.
Prerequisites
-
You have the
perfuser space tool installed as described in Installing perf. -
A
perf.datafile and associated archive file generated on a different device are present on the current device being used.
Procedure
-
Copy both the
perf.datafile and the archive file into your current active directory. Extract the archive file into
~/.debug:# mkdir -p ~/.debug # tar xf perf.data.tar.bz2 -C ~/.debugNoteThe archive file might also be named
perf.data.tar.gz.Open the
perf.datafile for further analysis:# perf report
21.10. Why perf displays some function names as raw function addresses
For kernel functions, perf uses the information from the /proc/kallsyms file to map the samples to their respective function names or symbols. For functions executed in the user space, however, you might see raw function addresses because the binary is stripped.
The debuginfo package of the executable must be installed or, if the executable is a locally developed application, the application must be compiled with debugging information turned on (the -g option in GCC) to display the function names or symbols in such a situation.
It is not necessary to re-run the perf record command after installing the debuginfo associated with an executable. Simply re-run the perf report command.
Additional Resources
21.11. Enabling debug and source repositories
A standard installation of Red Hat Enterprise Linux does not enable the debug and source repositories. These repositories contain information needed to debug the system components and measure their performance.
Procedure
Enable the source and debug information package channels:
# subscription-manager repos --enable rhel-8-for-$(uname -i)-baseos-debug-rpms
# subscription-manager repos --enable rhel-8-for-$(uname -i)-baseos-source-rpms
# subscription-manager repos --enable rhel-8-for-$(uname -i)-appstream-debug-rpms
# subscription-manager repos --enable rhel-8-for-$(uname -i)-appstream-source-rpms
The
$(uname -i)part is automatically replaced with a matching value for architecture of your system:Architecture name Value 64-bit Intel and AMD
x86_64
64-bit ARM
aarch64
IBM POWER
ppc64le
64-bit IBM Z
s390x
21.12. Getting debuginfo packages for an application or library using GDB
Debugging information is required to debug code. For code that is installed from a package, the GNU Debugger (GDB) automatically recognizes missing debug information, resolves the package name and provides concrete advice on how to get the package.
Prerequisites
- The application or library you want to debug must be installed on the system.
-
GDB and the
debuginfo-installtool must be installed on the system. For details, see Setting up to debug applications. -
Repositories providing
debuginfoanddebugsourcepackages must be configured and enabled on the system. For details, see Enabling debug and source repositories.
Procedure
Start GDB attached to the application or library you want to debug. GDB automatically recognizes missing debugging information and suggests a command to run.
$ gdb -q /bin/ls
Reading symbols from /bin/ls...Reading symbols from .gnu_debugdata for /usr/bin/ls...(no debugging symbols found)...done.
(no debugging symbols found)...done.
Missing separate debuginfos, use: dnf debuginfo-install coreutils-8.30-6.el8.x86_64
(gdb)
Exit GDB: type q and confirm with Enter.
(gdb) q
Run the command suggested by GDB to install the required
debuginfopackages:# dnf debuginfo-install coreutils-8.30-6.el8.x86_64
The
dnfpackage management tool provides a summary of the changes, asks for confirmation and once you confirm, downloads and installs all the necessary files.-
In case GDB is not able to suggest the
debuginfopackage, follow the procedure described in Getting debuginfo packages for an application or library manually.
Additional resources
- How can I download or install debuginfo packages for RHEL systems? — Red Hat Knowledgebase solution
Chapter 22. Investigating busy CPUs with perf
When investigating performance issues on a system, you can use the perf tool to identify and monitor the busiest CPUs in order to focus your efforts.
22.1. Displaying which CPU events were counted on with perf stat
You can use perf stat to display which CPU events were counted on by disabling CPU count aggregation. You must count events in system-wide mode by using the -a flag in order to use this functionality.
Prerequisites
-
You have the
perfuser space tool installed as described in Installing perf.
Procedure
Count the events with CPU count aggregation disabled:
# perf stat -a -A sleep secondsThe previous example displays counts of a default set of common hardware and software events recorded over a time period of
secondsseconds, as dictated by using thesleepcommand, over each individual CPU in ascending order, starting withCPU0. As such, it may be useful to specify an event such as cycles:# perf stat -a -A -e cycles sleep seconds
22.2. Displaying which CPU samples were taken on with perf report
The perf record command samples performance data and stores this data in a perf.data file which can be read with the perf report command. The perf record command always records which CPU samples were taken on. You can configure perf report to display this information.
Prerequisites
-
You have the
perfuser space tool installed as described in Installing perf. -
There is a
perf.datafile created withperf recordin the current directory. If theperf.datafile was created with root access, you need to runperf reportwith root access too.
Procedure
Display the contents of the
perf.datafile for further analysis while sorting by CPU:# perf report --sort cpu
You can sort by CPU and command to display more detailed information about where CPU time is being spent:
# perf report --sort cpu,comm
This example will list commands from all monitored CPUs by total overhead in descending order of overhead usage and identify the CPU the command was executed on.
Additional resources
22.3. Displaying specific CPUs during profiling with perf top
You can configure perf top to display specific CPUs and their relative usage while profiling your system in real time.
Prerequisites
-
You have the
perfuser space tool installed as described in Installing perf.
Procedure
Start the
perf topinterface while sorting by CPU:# perf top --sort cpu
This example will list CPUs and their respective overhead in descending order of overhead usage in real time.
You can sort by CPU and command for more detailed information of where CPU time is being spent:
# perf top --sort cpu,comm
This example will list commands by total overhead in descending order of overhead usage and identify the CPU the command was executed on in real time.
22.4. Monitoring specific CPUs with perf record and perf report
You can configure perf record to only sample specific CPUs of interest and analyze the generated perf.data file with perf report for further analysis.
Prerequisites
-
You have the
perfuser space tool installed as described in Installing perf.
Procedure
Sample and record the performance data in the specific CPU’s, generating a
perf.datafile:Using a comma separated list of CPUs:
# perf record -C 0,1 sleep seconds
The previous example samples and records data in CPUs 0 and 1 for a period of
secondsseconds as dictated by the use of thesleepcommand.Using a range of CPUs:
# perf record -C 0-2 sleep seconds
The previous example samples and records data in all CPUs from CPU 0 to 2 for a period of
secondsseconds as dictated by the use of thesleepcommand.
Display the contents of the
perf.datafile for further analysis:# perf report
This example will display the contents of
perf.data. If you are monitoring several CPUs and want to know which CPU data was sampled on, see Displaying which CPU samples were taken on with perf report.
Chapter 23. Monitoring application performance with perf
You can use the perf tool to monitor and analyze application performance.
23.1. Attaching perf record to a running process
You can attach perf record to a running process. This will instruct perf record to only sample and record performance data in the specified processes.
Prerequisites
-
You have the
perfuser space tool installed as described in Installing perf.
Procedure
Attach
perf recordto a running process:$ perf record -p ID1,ID2 sleep seconds
The previous example samples and records performance data of the processes with the process ID’s
ID1andID2for a time period ofsecondsseconds as dictated by using thesleepcommand. You can also configureperfto record events in specific threads:$ perf record -t ID1,ID2 sleep seconds
NoteWhen using the
-tflag and stipulating thread ID’s,perfdisables inheritance by default. You can enable inheritance by adding the--inheritoption.
23.2. Capturing call graph data with perf record
You can configure the perf record tool so that it records which function is calling other functions in the performance profile. This helps to identify a bottleneck if several processes are calling the same function.
Prerequisites
-
You have the
perfuser space tool installed as described in Installing perf.
Procedure
Sample and record performance data with the
--call-graphoption:$ perf record --call-graph method command
-
Replace
commandwith the command you want to sample data during. If you do not specify a command, thenperf recordwill sample data until you manually stop it by pressing Ctrl+C. Replace method with one of the following unwinding methods:
fp-
Uses the frame pointer method. Depending on compiler optimization, such as with binaries built with the GCC option
--fomit-frame-pointer, this may not be able to unwind the stack. dwarf- Uses DWARF Call Frame Information to unwind the stack.
lbr- Uses the last branch record hardware on Intel processors.
-
Replace
Additional resources
-
perf-record(1)man page
23.3. Analyzing perf.data with perf report
You can use perf report to display and analyze a perf.data file.
Prerequisites
-
You have the
perfuser space tool installed as described in Installing perf. -
There is a
perf.datafile in the current directory. -
If the
perf.datafile was created with root access, you need to runperf reportwith root access too.
Procedure
Display the contents of the
perf.datafile for further analysis:# perf report
This command displays output similar to the following:
Samples: 2K of event 'cycles', Event count (approx.): 235462960
Overhead  Command          Shared Object                     Symbol
   2.36%  kswapd0          [kernel.kallsyms]                 [k] page_vma_mapped_walk
   2.13%  sssd_kcm         libc-2.28.so                      [.] memset_avx2_erms 2.13% perf [kernel.kallsyms] [k] smp_call_function_single 1.53% gnome-shell libc-2.28.so [.] strcmp_avx2
   1.17%  gnome-shell      libglib-2.0.so.0.5600.4           [.] g_hash_table_lookup
   0.93%  Xorg             libc-2.28.so                      [.] memmove_avx_unaligned_erms 0.89% gnome-shell libgobject-2.0.so.0.5600.4 [.] g_object_unref 0.87% kswapd0 [kernel.kallsyms] [k] page_referenced_one 0.86% gnome-shell libc-2.28.so [.] memmove_avx_unaligned_erms
   0.83%  Xorg             [kernel.kallsyms]                 [k] alloc_vmap_area
   0.63%  gnome-shell      libglib-2.0.so.0.5600.4           [.] g_slice_alloc
   0.53%  gnome-shell      libgirepository-1.0.so.1.0.0      [.] g_base_info_unref
   0.53%  gnome-shell      ld-2.28.so                        [.] _dl_find_dso_for_object
   0.49%  kswapd0          [kernel.kallsyms]                 [k] vma_interval_tree_iter_next
   0.48%  gnome-shell      libpthread-2.28.so                [.] pthread_getspecific 0.47% gnome-shell libgirepository-1.0.so.1.0.0 [.] 0x0000000000013b1d 0.45% gnome-shell libglib-2.0.so.0.5600.4 [.] g_slice_free1 0.45% gnome-shell libgobject-2.0.so.0.5600.4 [.] g_type_check_instance_is_fundamentally_a 0.44% gnome-shell libc-2.28.so [.] malloc 0.41% swapper [kernel.kallsyms] [k] apic_timer_interrupt 0.40% gnome-shell ld-2.28.so [.] _dl_lookup_symbol_x 0.39% kswapd0 [kernel.kallsyms] [k] raw_callee_save___pv_queued_spin_unlock
Additional resources
-
perf-report(1)man page
Chapter 24. Creating uprobes with perf
24.1. Creating uprobes at the function level with perf
You can use the perf tool to create dynamic tracepoints at arbitrary points in a process or application. These tracepoints can then be used in conjunction with other perf tools such as perf stat and perf record to better understand the process or applications behavior.
Prerequisites
-
You have the
perfuser space tool installed as described in Installing perf.
Procedure
Create the uprobe in the process or application you are interested in monitoring at a location of interest within the process or application:
# perf probe -x /path/to/executable -a function
Added new event:
  probe_executable:function   (on function in /path/to/executable)

You can now use it in all perf tools, such as:

        perf record -e probe_executable:function -aR sleep 1
Additional resources
24.2. Creating uprobes on lines within a function with perf
These tracepoints can then be used in conjunction with other perf tools such as perf stat and perf record to better understand the process or applications behavior.
Prerequisites
-
You have the
perfuser space tool installed as described in Installing perf. You have gotten the debugging symbols for your executable:
# objdump -t ./your_executable | headNoteTo do this, the
debuginfopackage of the executable must be installed or, if the executable is a locally developed application, the application must be compiled with debugging information, the-goption in GCC.
Procedure
View the function lines where you can place a uprobe:
$ perf probe -x ./your_executable -L mainOutput of this command looks similar to:
<main@/home/user/my_executable:0>
              0  int main(int argc, const char **argv)
              1  {
                        int err;
                        const char *cmd;
                        char sbuf[STRERR_BUFSIZE];

                        /* libsubcmd init */
              7         exec_cmd_init("perf", PREFIX, PERF_EXEC_PATH, EXEC_PATH_ENVIRONMENT);
              8         pager_init(PERF_PAGER_ENVIRONMENT);
Create the uprobe for the desired function line:
# perf probe -x ./my_executable main:8
Added new event:
          probe_my_executable:main_L8   (on main:8 in /home/user/my_executable)

        You can now use it in all perf tools, such as:

                perf record -e probe_my_executable:main_L8 -aR sleep 1
24.3. Perf script output of data recorded over uprobes
A common method to analyze data collected using uprobes is using the perf script command to read a perf.data file and display a detailed trace of the recorded workload.
In the perf script example output:
- A uprobe is added to the function isprime() in a program called my_prog
- a is a function argument added to the uprobe. Alternatively, a could be an arbitrary variable visible in the code scope of where you add your uprobe:
# perf script
    my_prog  1367 [007] 10802159.906593: probe_my_prog:isprime: (400551) a=2
    my_prog  1367 [007] 10802159.906623: probe_my_prog:isprime: (400551) a=3
    my_prog  1367 [007] 10802159.906625: probe_my_prog:isprime: (400551) a=4
    my_prog  1367 [007] 10802159.906627: probe_my_prog:isprime: (400551) a=5
    my_prog  1367 [007] 10802159.906629: probe_my_prog:isprime: (400551) a=6
    my_prog  1367 [007] 10802159.906631: probe_my_prog:isprime: (400551) a=7
    my_prog  1367 [007] 10802159.906633: probe_my_prog:isprime: (400551) a=13
    my_prog  1367 [007] 10802159.906635: probe_my_prog:isprime: (400551) a=17
    my_prog  1367 [007] 10802159.906637: probe_my_prog:isprime: (400551) a=19
Chapter 25. Profiling memory accesses with perf mem
You can use the perf mem command to sample memory accesses on your system.
25.1. The purpose of perf mem
The mem subcommand of the perf tool enables the sampling of memory accesses (loads and stores). The perf mem command provides information about memory latency, types of memory accesses, functions causing cache hits and misses, and, by recording the data symbol, the memory locations where these hits and misses occur.
25.2. Sampling memory access with perf mem
This procedure describes how to use the perf mem command to sample memory accesses on your system. The command takes the same options as perf record and perf report as well as some options exclusive to the mem subcommand. The recorded data is stored in a perf.data file in the current directory for later analysis.
Prerequisites
-
You have the
perfuser space tool installed as described in Installing perf.
Procedure
Sample the memory accesses:
# perf mem record -a sleep secondsThis example samples memory accesses across all CPUs for a period of seconds seconds as dictated by the
sleepcommand. You can replace thesleepcommand for any command during which you want to sample memory access data. By default,perf memsamples both memory loads and stores. You can select only one memory operation by using the-toption and specifying either "load" or "store" betweenperf memandrecord. For loads, information over the memory hierarchy level, TLB memory accesses, bus snoops, and memory locks is captured.Open the
perf.datafile for analysis:# perf mem report
If you have used the example commands, the output is:
Available samples
35k cpu/mem-loads,ldlat=30/P
54k cpu/mem-stores/P
The
cpu/mem-loads,ldlat=30/Pline denotes data collected over memory loads and thecpu/mem-stores/Pline denotes data collected over memory stores. Highlight the category of interest and press Enter to view the data:Samples: 35K of event 'cpu/mem-loads,ldlat=30/P', Event count (approx.): 4067062 Overhead Samples Local Weight Memory access Symbol Shared Object Data Symbol Data Object Snoop TLB access Locked 0.07% 29 98 L1 or L1 hit [.] 0x000000000000a255 libspeexdsp.so.1.5.0 [.] 0x00007f697a3cd0f0 anon None L1 or L2 hit No 0.06% 26 97 L1 or L1 hit [.] 0x000000000000a255 libspeexdsp.so.1.5.0 [.] 0x00007f697a3cd0f0 anon None L1 or L2 hit No 0.06% 25 96 L1 or L1 hit [.] 0x000000000000a255 libspeexdsp.so.1.5.0 [.] 0x00007f697a3cd0f0 anon None L1 or L2 hit No 0.06% 1 2325 Uncached or N/A hit [k] pci_azx_readl [kernel.kallsyms] [k] 0xffffb092c06e9084 [kernel.kallsyms] None L1 or L2 hit No 0.06% 1 2247 Uncached or N/A hit [k] pci_azx_readl [kernel.kallsyms] [k] 0xffffb092c06e8164 [kernel.kallsyms] None L1 or L2 hit No 0.05% 1 2166 L1 or L1 hit [.] 0x00000000038140d6 libxul.so [.] 0x00007ffd7b84b4a8 [stack] None L1 or L2 hit No 0.05% 1 2117 Uncached or N/A hit [k] check_for_unclaimed_mmio [kernel.kallsyms] [k] 0xffffb092c1842300 [kernel.kallsyms] None L1 or L2 hit No 0.05% 22 95 L1 or L1 hit [.] 0x000000000000a255 libspeexdsp.so.1.5.0 [.] 0x00007f697a3cd0f0 anon None L1 or L2 hit No 0.05% 1 1898 L1 or L1 hit [.] 0x0000000002a30e07 libxul.so [.] 0x00007f610422e0e0 anon None L1 or L2 hit No 0.05% 1 1878 Uncached or N/A hit [k] pci_azx_readl [kernel.kallsyms] [k] 0xffffb092c06e8164 [kernel.kallsyms] None L2 miss No 0.04% 18 94 L1 or L1 hit [.] 0x000000000000a255 libspeexdsp.so.1.5.0 [.] 0x00007f697a3cd0f0 anon None L1 or L2 hit No 0.04% 1 1593 Local RAM or RAM hit [.] 0x00000000026f907d libxul.so [.] 0x00007f3336d50a80 anon Hit L2 miss No 0.03% 1 1399 L1 or L1 hit [.] 0x00000000037cb5f1 libxul.so [.] 0x00007fbe81ef5d78 libxul.so None L1 or L2 hit No 0.03% 1 1229 LFB or LFB hit [.] 0x0000000002962aad libxul.so [.] 0x00007fb6f1be2b28 anon None L2 miss No 0.03% 1 1202 LFB or LFB hit [.] __pthread_mutex_lock libpthread-2.29.so [.] 0x00007fb75583ef20 anon None L1 or L2 hit No 0.03% 1 1193 Uncached or N/A hit [k] pci_azx_readl [kernel.kallsyms] [k] 0xffffb092c06e9164 [kernel.kallsyms] None L2 miss No 0.03% 1 1191 L1 or L1 hit [k] azx_get_delay_from_lpib [kernel.kallsyms] [k] 0xffffb092ca7efcf0 [kernel.kallsyms] None L1 or L2 hit No
Alternatively, you can sort your results to investigate different aspects of interest when displaying the data. For example, to sort data over memory loads by type of memory accesses occurring during the sampling period in descending order of overhead they account for:
# perf mem -t load report --sort=mem
For example, the output can be:
Samples: 35K of event 'cpu/mem-loads,ldlat=30/P', Event count (approx.): 40670 Overhead Samples Memory access 31.53% 9725 LFB or LFB hit 29.70% 12201 L1 or L1 hit 23.03% 9725 L3 or L3 hit 12.91% 2316 Local RAM or RAM hit 2.37% 743 L2 or L2 hit 0.34% 9 Uncached or N/A hit 0.10% 69 I/O or N/A hit 0.02% 825 L3 miss
Additional resources
-
perf-mem(1)man page.
25.3. Interpretation of perf mem report output
The table displayed by running the perf mem report command without any modifiers sorts the data into several columns:
- The 'Overhead' column
- Indicates percentage of overall samples collected in that particular function.
- The 'Samples' column
- Displays the number of samples accounted for by that row.
- The 'Local Weight' column
- Displays the access latency in processor core cycles.
- The 'Memory Access' column
- Displays the type of memory access that occurred.
- The 'Symbol' column
- Displays the function name or symbol.
- The 'Shared Object' column
- Displays the name of the ELF image where the samples come from (the name [kernel.kallsyms] is used when the samples come from the kernel).
- The 'Data Symbol' column
- Displays the address of the memory location that row was targeting.
Oftentimes, due to dynamic allocation of memory or stack memory being accessed, the 'Data Symbol' column will display a raw address.
- The "Snoop" column
- Displays bus transactions.
- The 'TLB Access' column
- Displays TLB memory accesses.
- The 'Locked' column
- Indicates if a function was or was not memory locked.
In default mode, the functions are sorted in descending order with those with the highest overhead displayed first.
Chapter 26. Detecting false sharing
False sharing occurs when a processor core on a Symmetric Multi Processing (SMP) system modifies data items on the same cache line that is in use by other processors to access other data items that are not being shared between the processors.
This initial modification requires that the other processors using the cache line invalidate their copy and request an updated one despite the processors not needing, or even necessarily having access to, an updated version of the modified data item.
You can use the perf c2c command to detect false sharing.
26.1. The purpose of perf c2c
The c2c subcommand of the perf tool enables Shared Data Cache-to-Cache (C2C) analysis. You can use the perf c2c command to inspect cache-line contention to detect both true and false sharing.
Cache-line contention occurs when a processor core on a Symmetric Multi Processing (SMP) system modifies data items on the same cache line that is in use by other processors. All other processors using this cache-line must then invalidate their copy and request an updated one. This can lead to degraded performance.
The perf c2c command provides the following information:
- Cache lines where contention has been detected
- Processes reading and writing the data
- Instructions causing the contention
- The Non-Uniform Memory Access (NUMA) nodes involved in the contention
26.2. Detecting cache-line contention with perf c2c
Use the perf c2c command to detect cache-line contention in a system.
The perf c2c command supports the same options as perf record as well as some options exclusive to the c2c subcommand. The recorded data is stored in a perf.data file in the current directory for later analysis.
Prerequisites
-
The
perfuser space tool is installed. For more information, see installing perf.
Procedure
Use
perf c2cto detect cache-line contention:# perf c2c record -a sleep seconds
This example samples and records cache-line contention data across all CPU’s for a period of
secondsas dictated by thesleepcommand. You can replace thesleepcommand with any command you want to collect cache-line contention data over.
Additional resources
-
perf-c2c(1)man page
26.3. Visualizing a perf.data file recorded with perf c2c record
This procedure describes how to visualize the perf.data file, which is recorded using the perf c2c command.
Prerequisites
-
The
perfuser space tool is installed. For more information, see Installing perf. -
A
perf.datafile recorded using theperf c2ccommand is available in the current directory. For more information, see Detecting cache-line contention with perf c2c.
Procedure
Open the
perf.datafile for further analysis:# perf c2c report --stdio
This command visualizes the
perf.datafile into several graphs within the terminal:================================================= Trace Event Information ================================================= Total records : 329219 Locked Load/Store Operations : 14654 Load Operations : 69679 Loads - uncacheable : 0 Loads - IO : 0 Loads - Miss : 3972 Loads - no mapping : 0 Load Fill Buffer Hit : 11958 Load L1D hit : 17235 Load L2D hit : 21 Load LLC hit : 14219 Load Local HITM : 3402 Load Remote HITM : 12757 Load Remote HIT : 5295 Load Local DRAM : 976 Load Remote DRAM : 3246 Load MESI State Exclusive : 4222 Load MESI State Shared : 0 Load LLC Misses : 22274 LLC Misses to Local DRAM : 4.4% LLC Misses to Remote DRAM : 14.6% LLC Misses to Remote cache (HIT) : 23.8% LLC Misses to Remote cache (HITM) : 57.3% Store Operations : 259539 Store - uncacheable : 0 Store - no mapping : 11 Store L1D Hit : 256696 Store L1D Miss : 2832 No Page Map Rejects : 2376 Unable to parse data source : 1 ================================================= Global Shared Cache Line Event Information ================================================= Total Shared Cache Lines : 55 Load HITs on shared lines : 55454 Fill Buffer Hits on shared lines : 10635 L1D hits on shared lines : 16415 L2D hits on shared lines : 0 LLC hits on shared lines : 8501 Locked Access on shared lines : 14351 Store HITs on shared lines : 109953 Store L1D hits on shared lines : 109449 Total Merged records : 126112 ================================================= c2c details ================================================= Events : cpu/mem-loads,ldlat=30/P : cpu/mem-stores/P Cachelines sort on : Remote HITMs Cacheline data groupping : offset,pid,iaddr ================================================= Shared Data Cache Line Table ================================================= # # Total Rmt ----- LLC Load Hitm ----- ---- Store Reference ---- --- Load Dram ---- LLC Total ----- Core Load Hit ----- -- LLC Load Hit -- # Index Cacheline records Hitm Total Lcl Rmt Total L1Hit L1Miss Lcl Rmt Ld Miss Loads FB L1 L2 Llc Rmt # ..... .................. ....... ....... ....... ....... ....... ....... ....... ....... ........ ........ ....... ....... ....... ....... ....... ........ ........ # 0 0x602180 149904 77.09% 12103 2269 9834 109504 109036 468 727 2657 13747 40400 5355 16154 0 2875 529 1 0x602100 12128 22.20% 3951 1119 2832 0 0 0 65 200 3749 12128 5096 108 0 2056 652 2 0xffff883ffb6a7e80 260 0.09% 15 3 12 161 161 0 1 1 15 99 25 50 0 6 1 3 0xffffffff81aec000 157 0.07% 9 0 9 1 0 1 0 7 20 156 50 59 0 27 4 4 0xffffffff81e3f540 179 0.06% 9 1 8 117 97 20 0 10 25 62 11 1 0 24 7 ================================================= Shared Cache Line Distribution Pareto ================================================= # # ----- HITM ----- -- Store Refs -- Data address ---------- cycles ---------- cpu Shared # Num Rmt Lcl L1 Hit L1 Miss Offset Pid Code address rmt hitm lcl hitm load cnt Symbol Object Source:Line Node{cpu list} # ..... ....... ....... ....... ....... .................. ....... .................. ........ ........ ........ ........ ................... .................... ........................... .... # ------------------------------------------------------------- 0 9834 2269 109036 468 0x602180 ------------------------------------------------------------- 65.51% 55.88% 75.20% 0.00% 0x0 14604 0x400b4f 27161 26039 26017 9 [.] read_write_func no_false_sharing.exe false_sharing_example.c:144 0{0-1,4} 1{24-25,120} 2{48,54} 3{169} 0.41% 0.35% 0.00% 0.00% 0x0 14604 0x400b56 18088 12601 26671 9 [.] read_write_func no_false_sharing.exe false_sharing_example.c:145 0{0-1,4} 1{24-25,120} 2{48,54} 3{169} 0.00% 0.00% 24.80% 100.00% 0x0 14604 0x400b61 0 0 0 9 [.] read_write_func no_false_sharing.exe false_sharing_example.c:145 0{0-1,4} 1{24-25,120} 2{48,54} 3{169} 7.50% 9.92% 0.00% 0.00% 0x20 14604 0x400ba7 2470 1729 1897 2 [.] read_write_func no_false_sharing.exe false_sharing_example.c:154 1{122} 2{144} 17.61% 20.89% 0.00% 0.00% 0x28 14604 0x400bc1 2294 1575 1649 2 [.] read_write_func no_false_sharing.exe false_sharing_example.c:158 2{53} 3{170} 8.97% 12.96% 0.00% 0.00% 0x30 14604 0x400bdb 2325 1897 1828 2 [.] read_write_func no_false_sharing.exe false_sharing_example.c:162 0{96} 3{171} ------------------------------------------------------------- 1 2832 1119 0 0 0x602100 ------------------------------------------------------------- 29.13% 36.19% 0.00% 0.00% 0x20 14604 0x400bb3 1964 1230 1788 2 [.] read_write_func no_false_sharing.exe false_sharing_example.c:155 1{122} 2{144} 43.68% 34.41% 0.00% 0.00% 0x28 14604 0x400bcd 2274 1566 1793 2 [.] read_write_func no_false_sharing.exe false_sharing_example.c:159 2{53} 3{170} 27.19% 29.40% 0.00% 0.00% 0x30 14604 0x400be7 2045 1247 2011 2 [.] read_write_func no_false_sharing.exe false_sharing_example.c:163 0{96} 3{171}
26.4. Interpretation of perf c2c report output
The visualization displayed by running the perf c2c report --stdio command sorts the data into several tables:
Trace Events Information-
This table provides a high level summary of all the load and store samples, which are collected by the
perf c2c recordcommand. Global Shared Cache Line Event Information- This table provides statistics over the shared cache lines.
c2c Details-
This table provides information about what events were sampled and how the
perf c2c reportdata is organized within the visualization. Shared Data Cache Line Table- This table provides a one line summary for the hottest cache lines where false sharing is detected and is sorted in descending order by the amount of remote Hitm detected per cache line by default.
Shared Cache Line Distribution ParetoThis tables provides a variety of information about each cache line experiencing contention:
-
The cache lines are numbered in the NUM column, starting at
0. - The virtual address of each cache line is contained in the Data address Offset column and followed subsequently by the offset into the cache line where different accesses occurred.
- The Pid column contains the process ID.
- The Code Address column contains the instruction pointer code address.
- The columns under the cycles label show average load latencies.
- The cpu cnt column displays how many different CPUs samples came from (essentially, how many different CPUs were waiting for the data indexed at that given location).
- The Symbol column displays the function name or symbol.
-
The Shared Object column displays the name of the ELF image where the samples come from (the name [
kernel.kallsyms] is used when the samples come from the kernel). - The Source:Line column displays the source file and line number.
- The Node{cpu list} column displays which specific CPUs samples came from for each node.
-
The cache lines are numbered in the NUM column, starting at
26.5. Detecting false sharing with perf c2c
This procedure describes how to detect false sharing using the perf c2c command.
Prerequisites
-
The
perfuser space tool is installed. For more information, see installing perf. -
A
perf.datafile recorded using theperf c2ccommand is available in the current directory. For more information, see Detecting cache-line contention with perf c2c.
Procedure
Open the
perf.datafile for further analysis:# perf c2c report --stdio
This opens the
perf.datafile in the terminal.In the "Trace Event Information" table, locate the row containing the values for LLC Misses to Remote Cache (HITM):
The percentage in the value column of the LLC Misses to Remote Cache (HITM) row represents the percentage of LLC misses that were occurring across NUMA nodes in modified cache-lines and is a key indicator false sharing has occurred.
================================================= Trace Event Information ================================================= Total records : 329219 Locked Load/Store Operations : 14654 Load Operations : 69679 Loads - uncacheable : 0 Loads - IO : 0 Loads - Miss : 3972 Loads - no mapping : 0 Load Fill Buffer Hit : 11958 Load L1D hit : 17235 Load L2D hit : 21 Load LLC hit : 14219 Load Local HITM : 3402 Load Remote HITM : 12757 Load Remote HIT : 5295 Load Local DRAM : 976 Load Remote DRAM : 3246 Load MESI State Exclusive : 4222 Load MESI State Shared : 0 Load LLC Misses : 22274 LLC Misses to Local DRAM : 4.4% LLC Misses to Remote DRAM : 14.6% LLC Misses to Remote cache (HIT) : 23.8% LLC Misses to Remote cache (HITM) : 57.3% Store Operations : 259539 Store - uncacheable : 0 Store - no mapping : 11 Store L1D Hit : 256696 Store L1D Miss : 2832 No Page Map Rejects : 2376 Unable to parse data source : 1Inspect the Rmt column of the LLC Load Hitm field of the Shared Data Cache Line Table:
================================================= Shared Data Cache Line Table ================================================= # # Total Rmt ----- LLC Load Hitm ----- ---- Store Reference ---- --- Load Dram ---- LLC Total ----- Core Load Hit ----- -- LLC Load Hit -- # Index Cacheline records Hitm Total Lcl Rmt Total L1Hit L1Miss Lcl Rmt Ld Miss Loads FB L1 L2 Llc Rmt # ..... .................. ....... ....... ....... ....... ....... ....... ....... ....... ........ ........ ....... ....... ....... ....... ....... ........ ........ # 0 0x602180 149904 77.09% 12103 2269 9834 109504 109036 468 727 2657 13747 40400 5355 16154 0 2875 529 1 0x602100 12128 22.20% 3951 1119 2832 0 0 0 65 200 3749 12128 5096 108 0 2056 652 2 0xffff883ffb6a7e80 260 0.09% 15 3 12 161 161 0 1 1 15 99 25 50 0 6 1 3 0xffffffff81aec000 157 0.07% 9 0 9 1 0 1 0 7 20 156 50 59 0 27 4 4 0xffffffff81e3f540 179 0.06% 9 1 8 117 97 20 0 10 25 62 11 1 0 24 7This table is sorted in descending order by the amount of remote Hitm detected per cache line. A high number in the Rmt column of the LLC Load Hitm section indicates false sharing and requires further inspection of the cache line on which it occurred to debug the false sharing activity.
Chapter 27. Getting started with flamegraphs
As a system administrator, you can use flamegraphs to create visualizations of system performance data recorded with the perf tool. As a software developer, you can use flamegraphs to create visualizations of application performance data recorded with the perf tool.
Sampling stack traces is a common technique for profiling CPU performance with the perf tool. Unfortunately, the results of profiling stack traces with perf can be extremely verbose and labor-intensive to analyze. flamegraphs are visualizations created from data recorded with perf to make identifying hot code-paths faster and easier.
27.1. Installing flamegraphs
To begin using flamegraphs, install the required package.
Procedure
Install the
flamegraphspackage:# yum install js-d3-flame-graph
27.2. Creating flamegraphs over the entire system
This procedure describes how to visualize performance data recorded over an entire system using flamegraphs.
Prerequisites
-
flamegraphsare installed as described in installing flamegraphs. -
The
perftool is installed as described in installing perf.
Procedure
Record the data and create the visualization:
# perf script flamegraph -a -F 99 sleep 60
This command samples and records performance data over the entire system for 60 seconds, as stipulated by use of the
sleepcommand, and then constructs the visualization which will be stored in the current active directory asflamegraph.html. The command samples call-graph data by default and takes the same arguments as theperftool, in this particular case:-a- Stipulates to record data over the entire system.
-F- To set the sampling frequency per second.
Verification steps
For analysis, view the generated visualization:
# xdg-open flamegraph.html
This command opens the visualization in the default browser:

27.3. Creating flamegraphs over specific processes
You can use flamegraphs to visualize performance data recorded over specific running processes.
Prerequisites
-
flamegraphsare installed as described in installing flamegraphs. -
The
perftool is installed as described in installing perf.
Procedure
Record the data and create the visualization:
# perf script flamegraph -a -F 99 -p
ID1,ID2sleep 60This command samples and records performance data of the processes with the process ID’s
ID1andID2for 60 seconds, as stipulated by use of thesleepcommand, and then constructs the visualization which will be stored in the current active directory asflamegraph.html. The command samples call-graph data by default and takes the same arguments as theperftool, in this particular case:-a- Stipulates to record data over the entire system.
-F- To set the sampling frequency per second.
-p- To stipulate specific process ID’s to sample and record data over.
Verification steps
For analysis, view the generated visualization:
# xdg-open flamegraph.html
This command opens the visualization in the default browser:
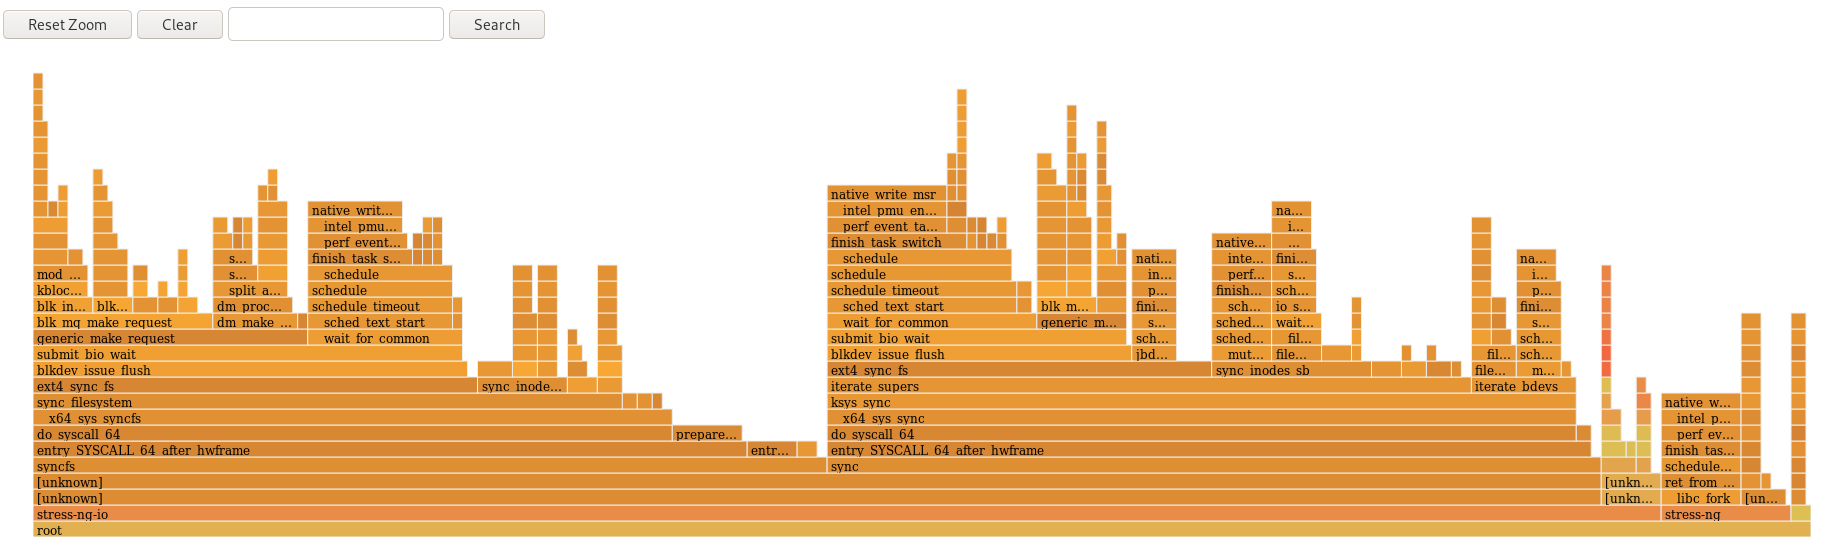
27.4. Interpreting flamegraphs
Each box in the flamegraph represents a different function in the stack. The y-axis shows the depth of the stack with the topmost box in each stack being the function that was actually on-CPU and everything below it being ancestry. The x-axis displays the population of the sampled call-graph data.
The children of a stack in a given row are displayed based on the number of samples taken of each respective function in descending order along the x-axis; the x-axis does not represent the passing of time. The wider an individual box is, the more frequent it was on-CPU or part of an on-CPU ancestry at the time the data was being sampled.
Procedure
To reveal the names of functions which may have not been displayed previously and further investigate the data click on a box within the flamegraph to zoom into the stack at that given location:
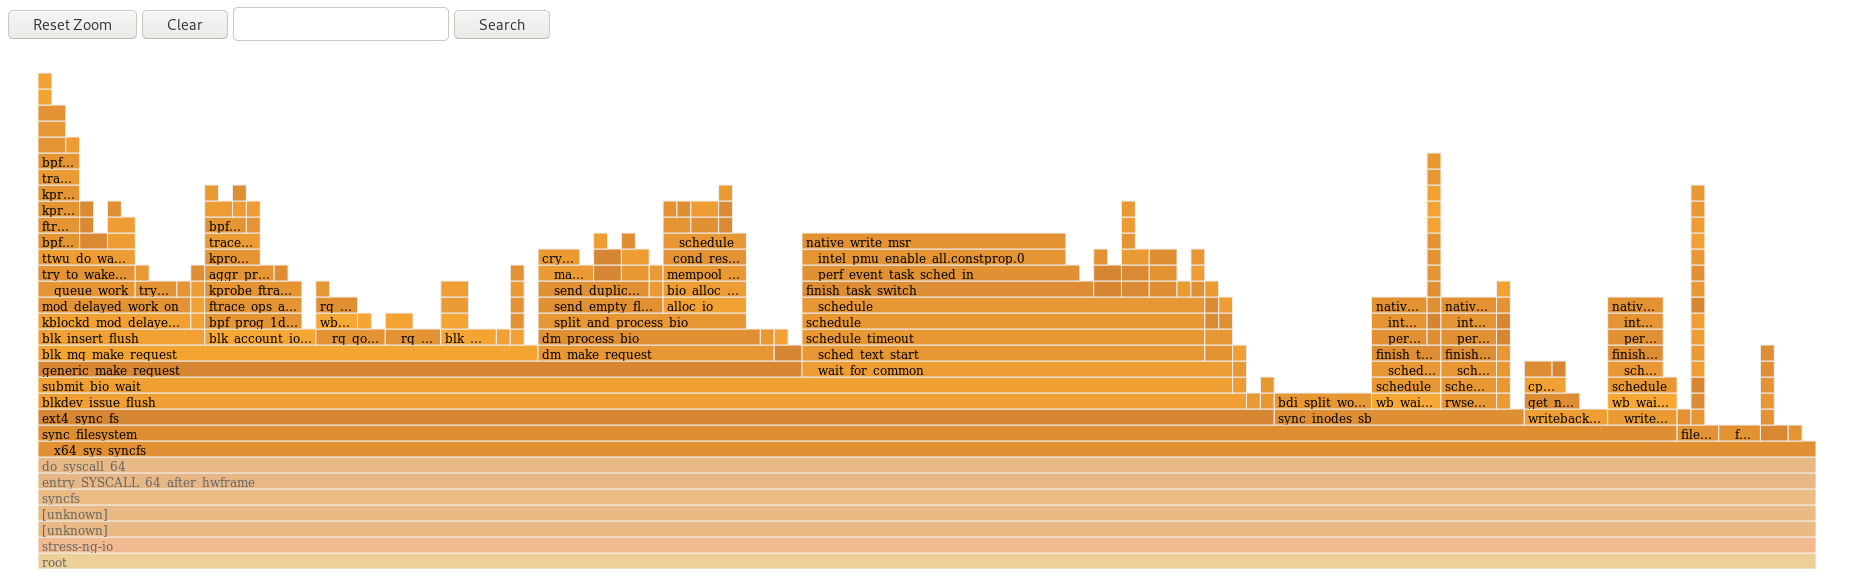
- To return to the default view of the flamegraph, click .
Boxes representing user-space functions may be labeled as Unknown in flamegraphs because the binary of the function is stripped. The debuginfo package of the executable must be installed or, if the executable is a locally developed application, the application must be compiled with debugging information. Use the -g option in GCC, to display the function names or symbols in such a situation.
Chapter 28. Monitoring processes for performance bottlenecks using perf circular buffers
You can create circular buffers that take event-specific snapshots of data with the perf tool in order to monitor performance bottlenecks in specific processes or parts of applications running on your system. In such cases, perf only writes data to a perf.data file for later analysis if a specified event is detected.
28.1. Circular buffers and event-specific snapshots with perf
When investigating performance issues in a process or application with perf, it may not be affordable or appropriate to record data for hours preceding a specific event of interest occurring. In such cases, you can use perf record to create custom circular buffers that take snapshots after specific events.
The --overwrite option makes perf record store all data in an overwritable circular buffer. When the buffer gets full, perf record automatically overwrites the oldest records which, therefore, never get written to a perf.data file.
Using the --overwrite and --switch-output-event options together configures a circular buffer that records and dumps data continuously until it detects the --switch-output-event trigger event. The trigger event signals to perf record that something of interest to the user has occurred and to write the data in the circular buffer to a perf.data file. This collects specific data you are interested in while simultaneously reducing the overhead of the running perf process by not writing data you do not want to a perf.data file.
28.2. Collecting specific data to monitor for performance bottlenecks using perf circular buffers
With the perf tool, you can create circular buffers that are triggered by events you specify in order to only collect data you are interested in. To create circular buffers that collect event-specific data, use the --overwrite and --switch-output-event options for perf.
Prerequisites
-
You have the
perfuser space tool installed as described in Installing perf. You have placed a uprobe in the process or application you are interested in monitoring at a location of interest within the process or application:
# perf probe -x /path/to/executable -a function Added new event: probe_executable:function (on function in /path/to/executable) You can now use it in all perf tools, such as: perf record -e probe_executable:function -aR sleep 1
Procedure
Create the circular buffer with the uprobe as the trigger event:
# perf record --overwrite -e cycles --switch-output-event probe_executable:function ./executable [ perf record: dump data: Woken up 1 times ] [ perf record: Dump perf.data.2021021012231959 ] [ perf record: dump data: Woken up 1 times ] [ perf record: Dump perf.data.2021021012232008 ] ^C[ perf record: dump data: Woken up 1 times ] [ perf record: Dump perf.data.2021021012232082 ] [ perf record: Captured and wrote 5.621 MB perf.data.<timestamp> ]This example initiates the executable and collects cpu cycles, specified after the
-eoption, untilperfdetects the uprobe, the trigger event specified after the--switch-output-eventoption. At that point,perftakes a snapshot of all the data in the circular buffer and stores it in a uniqueperf.datafile identified by timestamp. This example produced a total of 2 snapshots, the lastperf.datafile was forced by pressing Ctrl+c.
Chapter 29. Adding and removing tracepoints from a running perf collector without stopping or restarting perf
By using the control pipe interface to enable and disable different tracepoints in a running perf collector, you can dynamically adjust what data you are collecting without having to stop or restart perf. This ensures you do not lose performance data that would have otherwise been recorded during the stopping or restarting process.
29.1. Adding tracepoints to a running perf collector without stopping or restarting perf
Add tracepoints to a running perf collector using the control pipe interface to adjust the data you are recording without having to stop perf and losing performance data.
Prerequisites
-
You have the
perfuser space tool installed as described in Installing perf.
Procedure
Configure the control pipe interface:
# mkfifo control ack perf.pipe
Run
perf recordwith the control file setup and events you are interested in enabling:# perf record --control=fifo:control,ack -D -1 --no-buffering -e 'sched:*' -o - > perf.pipeIn this example, declaring
'sched:*'after the-eoption startsperf recordwith scheduler events.In a second terminal, start the read side of the control pipe:
# cat perf.pipe | perf --no-pager script -i -
Starting the read side of the control pipe triggers the following message in the first terminal:
Events disabled
In a third terminal, enable a tracepoint using the control file:
# echo 'enable sched:sched_process_fork' > controlThis command triggers
perfto scan the current event list in the control file for the declared event. If the event is present, the tracepoint is enabled and the following message appears in the first terminal:event sched:sched_process_fork enabled
Once the tracepoint is enabled, the second terminal displays the output from
perfdetecting the tracepoint:bash 33349 [034] 149587.674295: sched:sched_process_fork: comm=bash pid=33349 child_comm=bash child_pid=34056
29.2. Removing tracepoints from a running perf collector without stopping or restarting perf
Remove tracepoints from a running perf collector using the control pipe interface to reduce the scope of data you are collecting without having to stop perf and losing performance data.
Prerequisites
-
You have the
perfuser space tool installed as described in Installing perf. -
You have added tracepoints to a running
perfcollector via the control pipe interface. For more information, see Adding tracepoints to a running perf collector without stopping or restarting perf.
Procedure
Remove the tracepoint:
# echo 'disable sched:sched_process_fork' > controlNoteThis example assumes you have previously loaded scheduler events into the control file and enabled the tracepoint
sched:sched_process_fork.This command triggers
perfto scan the current event list in the control file for the declared event. If the event is present, the tracepoint is disabled and the following message appears in the terminal used to configure the control pipe:event sched:sched_process_fork disabled
Chapter 30. Profiling memory allocation with numastat
With the numastat tool, you can display statistics over memory allocations in a system.
The numastat tool displays data for each NUMA node separately. You can use this information to investigate memory performance of your system or the effectiveness of different memory policies on your system.
30.1. Default numastat statistics
By default, the numastat tool displays statistics over these categories of data for each NUMA node:
numa_hit- The number of pages that were successfully allocated to this node.
numa_miss-
The number of pages that were allocated on this node because of low memory on the intended node. Each
numa_missevent has a correspondingnuma_foreignevent on another node. numa_foreign-
The number of pages initially intended for this node that were allocated to another node instead. Each
numa_foreignevent has a correspondingnuma_missevent on another node. interleave_hit- The number of interleave policy pages successfully allocated to this node.
local_node- The number of pages successfully allocated on this node by a process on this node.
other_node- The number of pages allocated on this node by a process on another node.
High numa_hit values and low numa_miss values (relative to each other) indicate optimal performance.
30.2. Viewing memory allocation with numastat
You can view the memory allocation of the system by using the numastat tool.
Prerequisites
Install the
numactlpackage:# yum install numactl
Procedure
View the memory allocation of your system:
$ numastat node0 node1 numa_hit 76557759 92126519 numa_miss 30772308 30827638 numa_foreign 30827638 30772308 interleave_hit 106507 103832 local_node 76502227 92086995 other_node 30827840 30867162
Additional resources
-
numastat(8)man page
Chapter 31. Configuring an operating system to optimize CPU utilization
You can configure the operating system to optimize CPU utilization across their workloads.
31.1. Tools for monitoring and diagnosing processor issues
The following are the tools available in Red Hat Enterprise Linux 8 to monitor and diagnose processor-related performance issues:
-
turbostattool prints counter results at specified intervals to help administrators identify unexpected behavior in servers, such as excessive power usage, failure to enter deep sleep states, or system management interrupts (SMIs) being created unnecessarily. -
numactlutility provides a number of options to manage processor and memory affinity. Thenumactlpackage includes thelibnumalibrary which offers a simple programming interface to the NUMA policy supported by the kernel, and can be used for more fine-grained tuning than thenumactlapplication. -
numastattool displays per-NUMA node memory statistics for the operating system and its processes, and shows administrators whether the process memory is spread throughout a system or is centralized on specific nodes. This tool is provided by thenumactlpackage. -
numadis an automatic NUMA affinity management daemon. It monitors NUMA topology and resource usage within a system in order to dynamically improve NUMA resource allocation and management. -
/proc/interruptsfile displays the interrupt request (IRQ) number, the number of similar interrupt requests handled by each processor in the system, the type of interrupt sent, and a comma-separated list of devices that respond to the listed interrupt request. pqosutility is available in theintel-cmt-catpackage. It monitors CPU cache and memory bandwidth on recent Intel processors. It monitors:- The instructions per cycle (IPC).
- The count of last level cache MISSES.
- The size in kilobytes that the program executing in a given CPU occupies in the LLC.
- The bandwidth to local memory (MBL).
- The bandwidth to remote memory (MBR).
-
x86_energy_perf_policytool allows administrators to define the relative importance of performance and energy efficiency. This information can then be used to influence processors that support this feature when they select options that trade off between performance and energy efficiency. -
tasksettool is provided by theutil-linuxpackage. It allows administrators to retrieve and set the processor affinity of a running process, or launch a process with a specified processor affinity.
Additional resources
-
turbostat(8),numactl(8),numastat(8),numa(7),numad(8),pqos(8),x86_energy_perf_policy(8), andtaskset(1)man pages
31.2. Types of system topology
In modern computing, the idea of a CPU is a misleading one, as most modern systems have multiple processors. The topology of the system is the way these processors are connected to each other and to other system resources. This can affect system and application performance, and the tuning considerations for a system.
The following are the two primary types of topology used in modern computing:
Symmetric Multi-Processor (SMP) topology- SMP topology allows all processors to access memory in the same amount of time. However, because shared and equal memory access inherently forces serialized memory accesses from all the CPUs, SMP system scaling constraints are now generally viewed as unacceptable. For this reason, practically all modern server systems are NUMA machines.
Non-Uniform Memory Access (NUMA) topologyNUMA topology was developed more recently than SMP topology. In a NUMA system, multiple processors are physically grouped on a socket. Each socket has a dedicated area of memory and processors that have local access to that memory, these are referred to collectively as a node. Processors on the same node have high speed access to that node’s memory bank, and slower access to memory banks not on their node.
Therefore, there is a performance penalty when accessing non-local memory. Thus, performance sensitive applications on a system with NUMA topology should access memory that is on the same node as the processor executing the application, and should avoid accessing remote memory wherever possible.
Multi-threaded applications that are sensitive to performance may benefit from being configured to execute on a specific NUMA node rather than a specific processor. Whether this is suitable depends on your system and the requirements of your application. If multiple application threads access the same cached data, then configuring those threads to execute on the same processor may be suitable. However, if multiple threads that access and cache different data execute on the same processor, each thread may evict cached data accessed by a previous thread. This means that each thread 'misses' the cache and wastes execution time fetching data from memory and replacing it in the cache. Use the
perftool to check for an excessive number of cache misses.
31.2.1. Displaying system topologies
There are a number of commands that help understand the topology of a system. This procedure describes how to determine the system topology.
Procedure
To display an overview of your system topology:
$ numactl --hardware available: 4 nodes (0-3) node 0 cpus: 0 4 8 12 16 20 24 28 32 36 node 0 size: 65415 MB node 0 free: 43971 MB [...]
To gather the information about the CPU architecture, such as the number of CPUs, threads, cores, sockets, and NUMA nodes:
$ lscpu Architecture: x86_64 CPU op-mode(s): 32-bit, 64-bit Byte Order: Little Endian CPU(s): 40 On-line CPU(s) list: 0-39 Thread(s) per core: 1 Core(s) per socket: 10 Socket(s): 4 NUMA node(s): 4 Vendor ID: GenuineIntel CPU family: 6 Model: 47 Model name: Intel(R) Xeon(R) CPU E7- 4870 @ 2.40GHz Stepping: 2 CPU MHz: 2394.204 BogoMIPS: 4787.85 Virtualization: VT-x L1d cache: 32K L1i cache: 32K L2 cache: 256K L3 cache: 30720K NUMA node0 CPU(s): 0,4,8,12,16,20,24,28,32,36 NUMA node1 CPU(s): 2,6,10,14,18,22,26,30,34,38 NUMA node2 CPU(s): 1,5,9,13,17,21,25,29,33,37 NUMA node3 CPU(s): 3,7,11,15,19,23,27,31,35,39
To view a graphical representation of your system:
# yum install hwloc-gui # lstopo
Figure 31.1. The
lstopooutput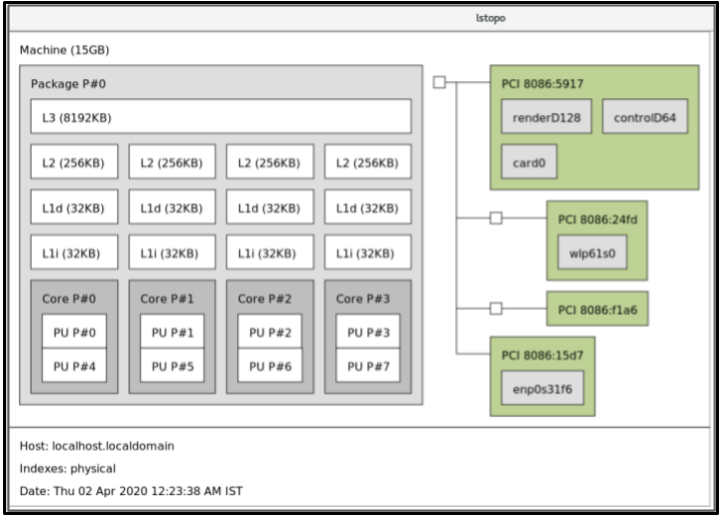
To view the detailed textual output:
# yum install hwloc # lstopo-no-graphics Machine (15GB) Package L#0 + L3 L#0 (8192KB) L2 L#0 (256KB) + L1d L#0 (32KB) + L1i L#0 (32KB) + Core L#0 PU L#0 (P#0) PU L#1 (P#4) HostBridge L#0 PCI 8086:5917 GPU L#0 "renderD128" GPU L#1 "controlD64" GPU L#2 "card0" PCIBridge PCI 8086:24fd Net L#3 "wlp61s0" PCIBridge PCI 8086:f1a6 PCI 8086:15d7 Net L#4 "enp0s31f6"
Additional resources
-
numactl(8),lscpu(1), andlstopo(1)man pages
31.3. Configuring kernel tick time
By default, Red Hat Enterprise Linux 8 uses a tickless kernel, which does not interrupt idle CPUs in order to reduce power usage and allow new processors to take advantage of deep sleep states.
Red Hat Enterprise Linux 8 also offers a dynamic tickless option, which is useful for latency-sensitive workloads, such as high performance computing or realtime computing. By default, the dynamic tickless option is disabled. Red Hat recommends using the cpu-partitioning TuneD profile to enable the dynamic tickless option for cores specified as isolated_cores.
This procedure describes how to manually persistently enable dynamic tickless behavior.
Procedure
To enable dynamic tickless behavior in certain cores, specify those cores on the kernel command line with the
nohz_fullparameter. On a 16 core system, enable thenohz_full=1-15kernel option:# grubby --update-kernel=ALL --args="nohz_full=1-15"
This enables dynamic tickless behavior on cores
1through15, moving all timekeeping to the only unspecified core (core0).When the system boots, manually move the
rcuthreads to the non-latency-sensitive core, in this case core0:# for i in `pgrep rcu[^c]` ; do taskset -pc 0 $i ; done
-
Optional: Use the
isolcpusparameter on the kernel command line to isolate certain cores from user-space tasks. Optional: Set the CPU affinity for the kernel’s
write-back bdi-flushthreads to the housekeeping core:echo 1 > /sys/bus/workqueue/devices/writeback/cpumask
Verification steps
Once the system is rebooted, verify if
dynticksare enabled:# journalctl -xe | grep dynticks Mar 15 18:34:54 rhel-server kernel: NO_HZ: Full dynticks CPUs: 1-15.
Verify that the dynamic tickless configuration is working correctly:
# perf stat -C 1 -e irq_vectors:local_timer_entry taskset -c 1 sleep 3
This command measures ticks on CPU 1 while telling CPU 1 to sleep for 3 seconds.
The default kernel timer configuration shows around 3100 ticks on a regular CPU:
# perf stat -C 0 -e irq_vectors:local_timer_entry taskset -c 0 sleep 3 Performance counter stats for 'CPU(s) 0': 3,107 irq_vectors:local_timer_entry 3.001342790 seconds time elapsedWith the dynamic tickless kernel configured, you should see around 4 ticks instead:
# perf stat -C 1 -e irq_vectors:local_timer_entry taskset -c 1 sleep 3 Performance counter stats for 'CPU(s) 1': 4 irq_vectors:local_timer_entry 3.001544078 seconds time elapsed
Additional resources
31.4. Overview of an interrupt request
An interrupt request or IRQ is a signal for immediate attention sent from a piece of hardware to a processor. Each device in a system is assigned one or more IRQ numbers which allow it to send unique interrupts. When interrupts are enabled, a processor that receives an interrupt request immediately pauses execution of the current application thread in order to address the interrupt request.
Because interrupt halts normal operation, high interrupt rates can severely degrade system performance. It is possible to reduce the amount of time taken by interrupts by configuring interrupt affinity or by sending a number of lower priority interrupts in a batch (coalescing a number of interrupts).
Interrupt requests have an associated affinity property, smp_affinity, which defines the processors that handle the interrupt request. To improve application performance, assign interrupt affinity and process affinity to the same processor, or processors on the same core. This allows the specified interrupt and application threads to share cache lines.
On systems that support interrupt steering, modifying the smp_affinity property of an interrupt request sets up the hardware so that the decision to service an interrupt with a particular processor is made at the hardware level with no intervention from the kernel.
31.4.1. Balancing interrupts manually
If your BIOS exports its NUMA topology, the irqbalance service can automatically serve interrupt requests on the node that is local to the hardware requesting service.
Procedure
- Check which devices correspond to the interrupt requests that you want to configure.
Find the hardware specification for your platform. Check if the chipset on your system supports distributing interrupts.
- If it does, you can configure interrupt delivery as described in the following steps. Additionally, check which algorithm your chipset uses to balance interrupts. Some BIOSes have options to configure interrupt delivery.
- If it does not, your chipset always routes all interrupts to a single, static CPU. You cannot configure which CPU is used.
Check which Advanced Programmable Interrupt Controller (APIC) mode is in use on your system:
$ journalctl --dmesg | grep APIC
Here,
-
If your system uses a mode other than
flat, you can see a line similar toSetting APIC routing to physical flat. If you can see no such message, your system uses
flatmode.If your system uses
x2apicmode, you can disable it by adding thenox2apicoption to the kernel command line in thebootloaderconfiguration.Only non-physical flat mode (
flat) supports distributing interrupts to multiple CPUs. This mode is available only for systems that have up to8CPUs.
-
If your system uses a mode other than
-
Calculate the
smp_affinity mask. For more information about how to calculate thesmp_affinity mask, see Setting the smp_affinity mask.
Additional resources
-
journalctl(1)andtaskset(1)man pages
31.4.2. Setting the smp_affinity mask
The smp_affinity value is stored as a hexadecimal bit mask representing all processors in the system. Each bit configures a different CPU. The least significant bit is CPU 0.
The default value of the mask is f, which means that an interrupt request can be handled on any processor in the system. Setting this value to 1 means that only processor 0 can handle the interrupt.
Procedure
In binary, use the value 1 for CPUs that handle the interrupts. For example, to set CPU 0 and CPU 7 to handle interrupts, use
0000000010000001as the binary code:Table 31.1. Binary Bits for CPUs
CPU
15
14
13
12
11
10
9
8
7
6
5
4
3
2
1
0
Binary
0
0
0
0
0
0
0
0
1
0
0
0
0
0
0
1
Convert the binary code to hexadecimal:
For example, to convert the binary code using Python:
>>> hex(int('0000000010000001', 2)) '0x81'On systems with more than 32 processors, you must delimit the
smp_affinityvalues for discrete 32 bit groups. For example, if you want only the first 32 processors of a 64 processor system to service an interrupt request, use0xffffffff,00000000.The interrupt affinity value for a particular interrupt request is stored in the associated
/proc/irq/irq_number/smp_affinityfile. Set thesmp_affinitymask in this file:# echo mask > /proc/irq/irq_number/smp_affinity
Additional resources
-
journalctl(1),irqbalance(1), andtaskset(1)man pages
Chapter 32. Tuning scheduling policy
In Red Hat Enterprise Linux, the smallest unit of process execution is called a thread. The system scheduler determines which processor runs a thread, and for how long the thread runs. However, because the scheduler’s primary concern is to keep the system busy, it may not schedule threads optimally for application performance.
For example, say an application on a NUMA system is running on Node A when a processor on Node B becomes available. To keep the processor on Node B busy, the scheduler moves one of the application’s threads to Node B. However, the application thread still requires access to memory on Node A. But, this memory will take longer to access because the thread is now running on Node B and Node A memory is no longer local to the thread. Thus, it may take longer for the thread to finish running on Node B than it would have taken to wait for a processor on Node A to become available, and then to execute the thread on the original node with local memory access.
32.1. Categories of scheduling policies
Performance sensitive applications often benefit from the designer or administrator determining where threads are run. The Linux scheduler implements a number of scheduling policies which determine where and for how long a thread runs.
The following are the two major categories of scheduling policies:
Normal policies- Normal threads are used for tasks of normal priority.
Realtime policiesRealtime policies are used for time-sensitive tasks that must complete without interruptions. Realtime threads are not subject to time slicing. This means the thread runs until they block, exit, voluntarily yield, or are preempted by a higher priority thread.
The lowest priority realtime thread is scheduled before any thread with a normal policy. For more information, see Static priority scheduling with SCHED_FIFO and Round robin priority scheduling with SCHED_RR.
Additional resources
-
sched(7),sched_setaffinity(2),sched_getaffinity(2),sched_setscheduler(2), andsched_getscheduler(2)man pages
32.2. Static priority scheduling with SCHED_FIFO
The SCHED_FIFO, also called static priority scheduling, is a realtime policy that defines a fixed priority for each thread. This policy allows administrators to improve event response time and reduce latency. It is recommended to not execute this policy for an extended period of time for time sensitive tasks.
When SCHED_FIFO is in use, the scheduler scans the list of all the SCHED_FIFO threads in order of priority and schedules the highest priority thread that is ready to run. The priority level of a SCHED_FIFO thread can be any integer from 1 to 99, where 99 is treated as the highest priority. Red Hat recommends starting with a lower number and increasing priority only when you identify latency issues.
Because realtime threads are not subject to time slicing, Red Hat does not recommend setting a priority as 99. This keeps your process at the same priority level as migration and watchdog threads; if your thread goes into a computational loop and these threads are blocked, they will not be able to run. Systems with a single processor will eventually hang in this situation.
Administrators can limit SCHED_FIFO bandwidth to prevent realtime application programmers from initiating realtime tasks that monopolize the processor.
The following are some of the parameters used in this policy:
/proc/sys/kernel/sched_rt_period_us-
This parameter defines the time period, in microseconds, that is considered to be one hundred percent of the processor bandwidth. The default value is
1000000 μs, or1 second. /proc/sys/kernel/sched_rt_runtime_us-
This parameter defines the time period, in microseconds, that is devoted to running real-time threads. The default value is
950000 μs, or0.95 seconds.
32.3. Round robin priority scheduling with SCHED_RR
The SCHED_RR is a round-robin variant of the SCHED_FIFO. This policy is useful when multiple threads need to run at the same priority level.
Like SCHED_FIFO, SCHED_RR is a realtime policy that defines a fixed priority for each thread. The scheduler scans the list of all SCHED_RR threads in order of priority and schedules the highest priority thread that is ready to run. However, unlike SCHED_FIFO, threads that have the same priority are scheduled in a round-robin style within a certain time slice.
You can set the value of this time slice in milliseconds with the sched_rr_timeslice_ms kernel parameter in the /proc/sys/kernel/sched_rr_timeslice_ms file. The lowest value is 1 millisecond.
32.4. Normal scheduling with SCHED_OTHER
The SCHED_OTHER is the default scheduling policy in Red Hat Enterprise Linux 8. This policy uses the Completely Fair Scheduler (CFS) to allow fair processor access to all threads scheduled with this policy. This policy is most useful when there are a large number of threads or when data throughput is a priority, as it allows more efficient scheduling of threads over time.
When this policy is in use, the scheduler creates a dynamic priority list based partly on the niceness value of each process thread. Administrators can change the niceness value of a process, but cannot change the scheduler’s dynamic priority list directly.
32.5. Setting scheduler policies
Check and adjust scheduler policies and priorities by using the chrt command line tool. It can start new processes with the desired properties, or change the properties of a running process. It can also be used for setting the policy at runtime.
Procedure
View the process ID (PID) of the active processes:
# ps
Use the
--pidor-poption with thepscommand to view the details of the particular PID.Check the scheduling policy, PID, and priority of a particular process:
# chrt -p 468 pid 468's current scheduling policy: SCHED_FIFO pid 468's current scheduling priority: 85 # chrt -p 476 pid 476's current scheduling policy: SCHED_OTHER pid 476's current scheduling priority: 0
Here, 468 and 476 are PID of a process.
Set the scheduling policy of a process:
For example, to set the process with PID 1000 to SCHED_FIFO, with a priority of 50:
# chrt -f -p 50 1000For example, to set the process with PID 1000 to SCHED_OTHER, with a priority of 0:
# chrt -o -p 0 1000For example, to set the process with PID 1000 to SCHED_RR, with a priority of 10:
# chrt -r -p 10 1000To start a new application with a particular policy and priority, specify the name of the application:
# chrt -f 36 /bin/my-app
Additional resources
32.6. Policy options for the chrt command
Using the chrt command, you can view and set the scheduling policy of a process.
The following table describes the appropriate policy options, which can be used to set the scheduling policy of a process.
Table 32.1. Policy Options for the chrt Command
| Short option | Long option | Description |
|---|---|---|
|
|
|
Set schedule to |
|
|
|
Set schedule to |
|
|
|
Set schedule to |
32.7. Changing the priority of services during the boot process
Using the systemd service, it is possible to set up real-time priorities for services launched during the boot process. The unit configuration directives are used to change the priority of a service during the boot process.
The boot process priority change is done by using the following directives in the service section:
CPUSchedulingPolicy=-
Sets the CPU scheduling policy for executed processes. It is used to set
other,fifo, andrrpolicies. CPUSchedulingPriority=-
Sets the CPU scheduling priority for executed processes. The available priority range depends on the selected CPU scheduling policy. For real-time scheduling policies, an integer between
1(lowest priority) and99(highest priority) can be used.
The following procedure describes how to change the priority of a service, during the boot process, using the mcelog service.
Prerequisites
Install the TuneD package:
# yum install tuned
Enable and start the TuneD service:
# systemctl enable --now tuned
Procedure
View the scheduling priorities of running threads:
# tuna --show_threads thread ctxt_switches pid SCHED_ rtpri affinity voluntary nonvoluntary cmd 1 OTHER 0 0xff 3181 292 systemd 2 OTHER 0 0xff 254 0 kthreadd 3 OTHER 0 0xff 2 0 rcu_gp 4 OTHER 0 0xff 2 0 rcu_par_gp 6 OTHER 0 0 9 0 kworker/0:0H-kblockd 7 OTHER 0 0xff 1301 1 kworker/u16:0-events_unbound 8 OTHER 0 0xff 2 0 mm_percpu_wq 9 OTHER 0 0 266 0 ksoftirqd/0 [...]Create a supplementary
mcelogservice configuration directory file and insert the policy name and priority in this file:# cat << EOF > /etc/systemd/system/mcelog.service.d/priority.conf [Service] CPUSchedulingPolicy=fifo CPUSchedulingPriority=20 EOF
Reload the
systemdscripts configuration:# systemctl daemon-reload
Restart the
mcelogservice:# systemctl restart mcelog
Verification steps
Display the
mcelogpriority set bysystemdissue:# tuna -t mcelog -P thread ctxt_switches pid SCHED_ rtpri affinity voluntary nonvoluntary cmd 826 FIFO 20 0,1,2,3 13 0 mcelog
Additional resources
-
systemd(1)andtuna(8)man pages - Description of the priority range
32.8. Priority map
Priorities are defined in groups, with some groups dedicated to certain kernel functions. For real-time scheduling policies, an integer between 1 (lowest priority) and 99 (highest priority) can be used.
The following table describes the priority range, which can be used while setting the scheduling policy of a process.
Table 32.2. Description of the priority range
| Priority | Threads | Description |
|---|---|---|
| 1 | Low priority kernel threads |
This priority is usually reserved for the tasks that need to be just above |
| 2 - 49 | Available for use | The range used for typical application priorities. |
| 50 | Default hard-IRQ value | |
| 51 - 98 | High priority threads | Use this range for threads that execute periodically and must have quick response times. Do not use this range for CPU-bound threads as you will starve interrupts. |
| 99 | Watchdogs and migration | System threads that must run at the highest priority. |
32.9. TuneD cpu-partitioning profile
For tuning Red Hat Enterprise Linux 8 for latency-sensitive workloads, Red Hat recommends to use the cpu-partitioning TuneD profile.
Prior to Red Hat Enterprise Linux 8, the low-latency Red Hat documentation described the numerous low-level steps needed to achieve low-latency tuning. In Red Hat Enterprise Linux 8, you can perform low-latency tuning more efficiently by using the cpu-partitioning TuneD profile. This profile is easily customizable according to the requirements for individual low-latency applications.
The following figure is an example to demonstrate how to use the cpu-partitioning profile. This example uses the CPU and node layout.
Figure 32.1. Figure cpu-partitioning
You can configure the cpu-partitioning profile in the /etc/tuned/cpu-partitioning-variables.conf file using the following configuration options:
- Isolated CPUs with load balancing
In the cpu-partitioning figure, the blocks numbered from 4 to 23, are the default isolated CPUs. The kernel scheduler’s process load balancing is enabled on these CPUs. It is designed for low-latency processes with multiple threads that need the kernel scheduler load balancing.
You can configure the cpu-partitioning profile in the
/etc/tuned/cpu-partitioning-variables.conffile using theisolated_cores=cpu-listoption, which lists CPUs to isolate that will use the kernel scheduler load balancing.The list of isolated CPUs is comma-separated or you can specify a range using a dash, such as
3-5. This option is mandatory. Any CPU missing from this list is automatically considered a housekeeping CPU.- Isolated CPUs without load balancing
In the cpu-partitioning figure, the blocks numbered 2 and 3, are the isolated CPUs that do not provide any additional kernel scheduler process load balancing.
You can configure the cpu-partitioning profile in the
/etc/tuned/cpu-partitioning-variables.conffile using theno_balance_cores=cpu-listoption, which lists CPUs to isolate that will not use the kernel scheduler load balancing.Specifying the
no_balance_coresoption is optional, however any CPUs in this list must be a subset of the CPUs listed in theisolated_coreslist.Application threads using these CPUs need to be pinned individually to each CPU.
- Housekeeping CPUs
-
Any CPU not isolated in the
cpu-partitioning-variables.conffile is automatically considered a housekeeping CPU. On the housekeeping CPUs, all services, daemons, user processes, movable kernel threads, interrupt handlers, and kernel timers are permitted to execute.
Additional resources
-
tuned-profiles-cpu-partitioning(7)man page
32.10. Using the TuneD cpu-partitioning profile for low-latency tuning
This procedure describes how to tune a system for low-latency using the TuneD’s cpu-partitioning profile. It uses the example of a low-latency application that can use cpu-partitioning and the CPU layout as mentioned in the cpu-partitioning figure.
The application in this case uses:
- One dedicated reader thread that reads data from the network will be pinned to CPU 2.
- A large number of threads that process this network data will be pinned to CPUs 4-23.
- A dedicated writer thread that writes the processed data to the network will be pinned to CPU 3.
Prerequisites
-
You have installed the
cpu-partitioningTuneD profile by using theyum install tuned-profiles-cpu-partitioningcommand as root.
Procedure
Edit
/etc/tuned/cpu-partitioning-variables.conffile and add the following information:# All isolated CPUs: isolated_cores=2-23 # Isolated CPUs without the kernel’s scheduler load balancing: no_balance_cores=2,3
Set the
cpu-partitioningTuneD profile:# tuned-adm profile cpu-partitioning
Reboot
After rebooting, the system is tuned for low-latency, according to the isolation in the cpu-partitioning figure. The application can use taskset to pin the reader and writer threads to CPUs 2 and 3, and the remaining application threads on CPUs 4-23.
Additional resources
-
tuned-profiles-cpu-partitioning(7)man page
32.11. Customizing the cpu-partitioning TuneD profile
You can extend the TuneD profile to make additional tuning changes.
For example, the cpu-partitioning profile sets the CPUs to use cstate=1. In order to use the cpu-partitioning profile but to additionally change the CPU cstate from cstate1 to cstate0, the following procedure describes a new TuneD profile named my_profile, which inherits the cpu-partitioning profile and then sets C state-0.
Procedure
Create the
/etc/tuned/my_profiledirectory:# mkdir /etc/tuned/my_profileCreate a
tuned.conffile in this directory, and add the following content:# vi /etc/tuned/my_profile/tuned.conf [main] summary=Customized tuning on top of cpu-partitioning include=cpu-partitioning [cpu] force_latency=cstate.id:0|1Use the new profile:
# tuned-adm profile my_profile
In the shared example, a reboot is not required. However, if the changes in the my_profile profile require a reboot to take effect, then reboot your machine.
Additional resources
-
tuned-profiles-cpu-partitioning(7)man page
Chapter 33. Factors affecting I/O and file system performance
The appropriate settings for storage and file system performance are highly dependent on the storage purpose.
I/O and file system performance can be affected by any of the following factors:
- Data write or read patterns
- Sequential or random
- Buffered or Direct IO
- Data alignment with underlying geometry
- Block size
- File system size
- Journal size and location
- Recording access times
- Ensuring data reliability
- Pre-fetching data
- Pre-allocating disk space
- File fragmentation
- Resource contention
33.1. Tools for monitoring and diagnosing I/O and file system issues
The following tools are available in Red Hat Enterprise Linux 8 for monitoring system performance and diagnosing performance problems related to I/O, file systems, and their configuration:
-
vmstattool reports on processes, memory, paging, block I/O, interrupts, and CPU activity across the entire system. It can help administrators determine whether the I/O subsystem is responsible for any performance issues. If analysis withvmstatshows that the I/O subsystem is responsible for reduced performance, administrators can use theiostattool to determine the responsible I/O device. -
iostatreports on I/O device load in your system. It is provided by thesysstatpackage. -
blktraceprovides detailed information about how time is spent in the I/O subsystem. The companion utilityblkparsereads the raw output fromblktraceand produces a human readable summary of input and output operations recorded byblktrace. bttanalyzesblktraceoutput and displays the amount of time that data spends in each area of the I/O stack, making it easier to spot bottlenecks in the I/O subsystem. This utility is provided as part of theblktracepackage. Some of the important events tracked by theblktracemechanism and analyzed bybttare:-
Queuing of the I/O event (
Q) -
Dispatch of the I/O to the driver event (
D) -
Completion of I/O event (
C)
-
Queuing of the I/O event (
-
iowatchercan use theblktraceoutput to graph I/O over time. It focuses on the Logical Block Address (LBA) of disk I/O, throughput in megabytes per second, the number of seeks per second, and I/O operations per second. This can help to identify when you are hitting the operations-per-second limit of a device. BPF Compiler Collection (BCC) is a library, which facilitates the creation of the extended Berkeley Packet Filter (
eBPF) programs. TheeBPFprograms are triggered on events, such as disk I/O, TCP connections, and process creations. The BCC tools are installed in the/usr/share/bcc/tools/directory. The followingbcc-toolshelps to analyze performance:-
biolatencysummarizes the latency in block device I/O (disk I/O) in histogram. This allows the distribution to be studied, including two modes for device cache hits and for cache misses, and latency outliers. -
biosnoopis a basic block I/O tracing tool for displaying each I/O event along with the issuing process ID, and the I/O latency. Using this tool, you can investigate disk I/O performance issues. -
biotopis used for block i/o operations in the kernel. -
filelifetool traces thestat()syscalls. -
fileslowertraces slow synchronous file reads and writes. -
filetopdisplays file reads and writes by process. ext4slower,nfsslower, andxfsslowerare tools that show file system operations slower than a certain threshold, which defaults to10ms.For more information, see the Analyzing system performance with BPF Compiler Collection.
-
-
bpftaceis a tracing language foreBPFused for analyzing performance issues. It also provides trace utilities like BCC for system observation, which is useful for investigating I/O performance issues. The following
SystemTapscripts may be useful in diagnosing storage or file system performance problems:-
disktop.stp: Checks the status of reading or writing disk every 5 seconds and outputs the top ten entries during that period. -
iotime.stp: Prints the amount of time spent on read and write operations, and the number of bytes read and written. -
traceio.stp: Prints the top ten executable based on cumulative I/O traffic observed, every second. -
traceio2.stp: Prints the executable name and process identifier as reads and writes to the specified device occur. -
Inodewatch.stp: Prints the executable name and process identifier each time a read or write occurs to the specified inode on the specified major or minor device. -
inodewatch2.stp: Prints the executable name, process identifier, and attributes each time the attributes are changed on the specified inode on the specified major or minor device.
-
Additional resources
-
vmstat(8),iostat(1),blktrace(8),blkparse(1),btt(1),bpftrace, andiowatcher(1)man pages - Analyzing system performance with BPF Compiler Collection
33.2. Available tuning options for formatting a file system
Some file system configuration decisions cannot be changed after the device is formatted.
The following are the options available before formatting a storage device:
Size- Create an appropriately-sized file system for your workload. Smaller file systems require less time and memory for file system checks. However, if a file system is too small, its performance suffers from high fragmentation.
Block sizeThe block is the unit of work for the file system. The block size determines how much data can be stored in a single block, and therefore the smallest amount of data that is written or read at one time.
The default block size is appropriate for most use cases. However, your file system performs better and stores data more efficiently if the block size or the size of multiple blocks is the same as or slightly larger than the amount of data that is typically read or written at one time. A small file still uses an entire block. Files can be spread across multiple blocks, but this can create additional runtime overhead.
Additionally, some file systems are limited to a certain number of blocks, which in turn limits the maximum size of the file system. Block size is specified as part of the file system options when formatting a device with the
mkfscommand. The parameter that specifies the block size varies with the file system.GeometryFile system geometry is concerned with the distribution of data across a file system. If your system uses striped storage, like RAID, you can improve performance by aligning data and metadata with the underlying storage geometry when you format the device.
Many devices export recommended geometry, which is then set automatically when the devices are formatted with a particular file system. If your device does not export these recommendations, or you want to change the recommended settings, you must specify geometry manually when you format the device with the
mkfscommand.The parameters that specify file system geometry vary with the file system.
External journals- Journaling file systems document the changes that will be made during a write operation in a journal file prior to the operation being executed. This reduces the likelihood that a storage device will become corrupted in the event of a system crash or power failure, and speeds up the recovery process.
Red Hat does not recommend using the external journals option.
Metadata-intensive workloads involve very frequent updates to the journal. A larger journal uses more memory, but reduces the frequency of write operations. Additionally, you can improve the seek time of a device with a metadata-intensive workload by placing its journal on dedicated storage that is as fast as, or faster than, the primary storage.
Ensure that external journals are reliable. Losing an external journal device causes file system corruption. External journals must be created at format time, with journal devices being specified at mount time.
Additional resources
-
mkfs(8)andmount(8)man pages - Overview of available file systems
33.3. Available tuning options for mounting a file system
The following are the options available to most file systems and can be specified as the device is mounted:
Access TimeEvery time a file is read, its metadata is updated with the time at which access occurred (
atime). This involves additional write I/O. Therelatimeis the defaultatimesetting for most file systems.However, if updating this metadata is time consuming, and if accurate access time data is not required, you can mount the file system with the
noatimemount option. This disables updates to metadata when a file is read. It also enablesnodiratimebehavior, which disables updates to metadata when a directory is read.
Disabling atime updates by using the noatime mount option can break applications that rely on them, for example, backup programs.
Read-aheadRead-aheadbehavior speeds up file access by pre-fetching data that is likely to be needed soon and loading it into the page cache, where it can be retrieved more quickly than if it were on disk. The higher the read-ahead value, the further ahead the system pre-fetches data.Red Hat Enterprise Linux attempts to set an appropriate read-ahead value based on what it detects about your file system. However, accurate detection is not always possible. For example, if a storage array presents itself to the system as a single LUN, the system detects the single LUN, and does not set the appropriate read-ahead value for an array.
Workloads that involve heavy streaming of sequential I/O often benefit from high read-ahead values. The storage-related tuned profiles provided with Red Hat Enterprise Linux raise the read-ahead value, as does using LVM striping, but these adjustments are not always sufficient for all workloads.
Additional resources
-
mount(8),xfs(5), andext4(5)man pages
33.4. Types of discarding unused blocks
Regularly discarding blocks that are not in use by the file system is a recommended practice for both solid-state disks and thinly-provisioned storage.
The following are the two methods of discarding unused blocks:
Batch discard-
This type of discard is part of the
fstrimcommand. It discards all unused blocks in a file system that match criteria specified by the administrator. Red Hat Enterprise Linux 8 supports batch discard on XFS and ext4 formatted devices that support physical discard operations. Online discardThis type of discard operation is configured at mount time with the discard option, and runs in real time without user intervention. However, it only discards blocks that are transitioning from used to free. Red Hat Enterprise Linux 8 supports online discard on XFS and ext4 formatted devices.
Red Hat recommends batch discard, except where online discard is required to maintain performance, or where batch discard is not feasible for the system’s workload.
Pre-allocation marks disk space as being allocated to a file without writing any data into that space. This can be useful in limiting data fragmentation and poor read performance. Red Hat Enterprise Linux 8 supports pre-allocating space on XFS, ext4, and GFS2 file systems. Applications can also benefit from pre-allocating space by using the fallocate(2) glibc call.
Additional resources
-
mount(8)andfallocate(2)man pages
33.5. Solid-state disks tuning considerations
Solid-state disks (SSD) use NAND flash chips rather than rotating magnetic platters to store persistent data. SSD provides a constant access time for data across their full Logical Block Address range, and does not incur measurable seek costs like their rotating counterparts. They are more expensive per gigabyte of storage space and have a lesser storage density, but they also have lower latency and greater throughput than HDDs.
Performance generally degrades as the used blocks on an SSD approach the capacity of the disk. The degree of degradation varies by vendor, but all devices experience degradation in this circumstance. Enabling discard behavior can help to alleviate this degradation. For more information, see Types of discarding unused blocks.
The default I/O scheduler and virtual memory options are suitable for use with SSDs. Consider the following factors when configuring settings that can affect SSD performance:
I/O SchedulerAny I/O scheduler is expected to perform well with most SSDs. However, as with any other storage type, Red Hat recommends benchmarking to determine the optimal configuration for a given workload. When using SSDs, Red Hat advises changing the I/O scheduler only for benchmarking particular workloads. For instructions on how to switch between I/O schedulers, see the
/usr/share/doc/kernel-version/Documentation/block/switching-sched.txtfile.For single queue HBA, the default I/O scheduler is
deadline. For multiple queue HBA, the default I/O scheduler isnone. For information about how to set the I/O scheduler, see Setting the disk scheduler.Virtual Memory-
Like the I/O scheduler, virtual memory (VM) subsystem requires no special tuning. Given the fast nature of I/O on SSD, try turning down the
vm_dirty_background_ratioandvm_dirty_ratiosettings, as increased write-out activity does not usually have a negative impact on the latency of other operations on the disk. However, this tuning can generate more overall I/O, and is therefore not generally recommended without workload-specific testing. Swap- An SSD can also be used as a swap device, and is likely to produce good page-out and page-in performance.
33.6. Generic block device tuning parameters
The generic tuning parameters listed here are available in the /sys/block/sdX/queue/ directory.
The following listed tuning parameters are separate from I/O scheduler tuning, and are applicable to all I/O schedulers:
add_random-
Some I/O events contribute to the entropy pool for the
/dev/random. This parameter can be set to0if the overhead of these contributions become measurable. iostatsBy default,
iostatsis enabled and the default value is1. Settingiostatsvalue to0disables the gathering of I/O statistics for the device, which removes a small amount of overhead with the I/O path. Settingiostatsto0might slightly improve performance for very high performance devices, such as certain NVMe solid-state storage devices. It is recommended to leaveiostatsenabled unless otherwise specified for the given storage model by the vendor.If you disable
iostats, the I/O statistics for the device are no longer present within the/proc/diskstatsfile. The content of/sys/diskstatsfile is the source of I/O information for monitoring I/O tools, such assaroriostats. Therefore, if you disable theiostatsparameter for a device, the device is no longer present in the output of I/O monitoring tools.max_sectors_kbSpecifies the maximum size of an I/O request in kilobytes. The default value is
512KB. The minimum value for this parameter is determined by the logical block size of the storage device. The maximum value for this parameter is determined by the value of themax_hw_sectors_kb.Red Hat recommends
max_sectors_kbto always be a multiple of the optimal I/O size and the internal erase block size. Use a value oflogical_block_sizefor either parameter if they are zero or not specified by the storage device.nomerges-
Most workloads benefit from request merging. However, disabling merges can be useful for debugging purposes. By default, the
nomergesparameter is set to0, which enables merging. To disable simple one-hit merging, setnomergesto1. To disable all types of merging, setnomergesto2. nr_requests-
It is the maximum allowed number of the queued I/O. If the current I/O scheduler is
none, this number can only be reduced; otherwise the number can be increased or reduced. optimal_io_size- Some storage devices report an optimal I/O size through this parameter. If this value is reported, Red Hat recommends that applications issue I/O aligned to and in multiples of the optimal I/O size wherever possible.
read_ahead_kbDefines the maximum number of kilobytes that the operating system may read ahead during a sequential read operation. As a result, the necessary information is already present within the kernel page cache for the next sequential read, which improves read I/O performance.
Device mappers often benefit from a high
read_ahead_kbvalue.128KB for each device to be mapped is a good starting point, but increasing theread_ahead_kbvalue up to request queue’smax_sectors_kbof the disk might improve performance in application environments where sequential reading of large files takes place.rotational-
Some solid-state disks do not correctly advertise their solid-state status, and are mounted as traditional rotational disks. Manually set the
rotationalvalue to0to disable unnecessary seek-reducing logic in the scheduler. rq_affinity-
The default value of the
rq_affinityis1. It completes the I/O operations on one CPU core, which is in the same CPU group of the issued CPU core. To perform completions only on the processor that issued the I/O request, set therq_affinityto2. To disable the mentioned two abilities, set it to0. scheduler-
To set the scheduler or scheduler preference order for a particular storage device, edit the
/sys/block/devname/queue/schedulerfile, where devname is the name of the device you want to configure.
Chapter 34. Tuning the network performance
Tuning the network settings is a complex process with many factors to consider. For example, this includes the CPU-to-memory architecture, the amount of CPU cores, and more. Red Hat Enterprise Linux uses default settings that are optimized for most scenarios. However, in certain cases, it can be necessary to tune network settings to increase the throughput or latency or to solve problems, such as packet drops.
34.1. Tuning network adapter settings
In high-speed networks with 40 Gbps and faster, certain default values of network adapter-related kernel settings can be a cause of packet drops and performance degradation. Tuning these settings can prevent such problems.
34.1.1. Increasing the ring buffer size to reduce a high packet drop rate by using nmcli
Increase the size of an Ethernet device’s ring buffers if the packet drop rate causes applications to report a loss of data, timeouts, or other issues.
Receive ring buffers are shared between the device driver and network interface controller (NIC). The card assigns a transmit (TX) and receive (RX) ring buffer. As the name implies, the ring buffer is a circular buffer where an overflow overwrites existing data. There are two ways to move data from the NIC to the kernel, hardware interrupts and software interrupts, also called SoftIRQs.
The kernel uses the RX ring buffer to store incoming packets until the device driver can process them. The device driver drains the RX ring, typically by using SoftIRQs, which puts the incoming packets into a kernel data structure called an sk_buff or skb to begin its journey through the kernel and up to the application that owns the relevant socket.
The kernel uses the TX ring buffer to hold outgoing packets which should be sent to the network. These ring buffers reside at the bottom of the stack and are a crucial point at which packet drop can occur, which in turn will adversely affect network performance.
Procedure
Display the packet drop statistics of the interface:
# ethtool -S enp1s0 ... rx_queue_0_drops: 97326 rx_queue_1_drops: 63783 ...
Note that the output of the command depends on the network card and the driver.
High values in
discardordropcounters indicate that the available buffer fills up faster than the kernel can process the packets. Increasing the ring buffers can help to avoid such loss.Display the maximum ring buffer sizes:
# ethtool -g enp1s0 Ring parameters for enp1s0: Pre-set maximums: RX: 4096 RX Mini: 0 RX Jumbo: 16320 TX: 4096 Current hardware settings: RX: 255 RX Mini: 0 RX Jumbo: 0 TX: 255
If the values in the
Pre-set maximumssection are higher than in theCurrent hardware settingssection, you can change the settings in the next steps.Identify the NetworkManager connection profile that uses the interface:
# nmcli connection show NAME UUID TYPE DEVICE Example-Connection a5eb6490-cc20-3668-81f8-0314a27f3f75 ethernet enp1s0
Update the connection profile, and increase the ring buffers:
To increase the RX ring buffer, enter:
# nmcli connection modify Example-Connection ethtool.ring-rx 4096To increase the TX ring buffer, enter:
# nmcli connection modify Example-Connection ethtool.ring-tx 4096
Reload the NetworkManager connection:
# nmcli connection up Example-ConnectionImportantDepending on the driver your NIC uses, changing in the ring buffer can shortly interrupt the network connection.
Additional resources
34.1.2. Tuning the network device backlog queue to avoid packet drops
When a network card receives packets and before the kernel protocol stack processes them, the kernel stores these packets in backlog queues. The kernel maintains a separate queue for each CPU core.
If the backlog queue for a core is full, the kernel drops all further incoming packets that the netif_receive_skb() kernel function assigns to this queue. If the server contains a 10 Gbps or faster network adapter or multiple 1 Gbps adapters, tune the backlog queue size to avoid this problem.
Prerequisites
- A 10 Gbps or faster or multiple 1 Gbps network adapters
Procedure
Determine whether tuning the backlog queue is needed, display the counters in the
/proc/net/softnet_statfile:# awk '{for (i=1; i<=NF; i++) printf strtonum("0x" $i) (i==NF?"\n":" ")}' /proc/net/softnet_stat | column -t 221951548 0 0 0 0 0 0 0 0 0 0 0 0 192058677 18862 0 0 0 0 0 0 0 0 0 0 1 455324886 0 0 0 0 0 0 0 0 0 0 0 2 ...This
awkcommand converts the values in/proc/net/softnet_statfrom hexadecimal to decimal format and displays them in table format. Each line represents a CPU core starting with core 0.The relevant columns are:
- First column: The total number of received frames
- Second column: The number of dropped frames because of a full backlog queue
- Last column: The CPU core number
If the values in the second column of the
/proc/net/softnet_statfile increment over time, increase the size of the backlog queue:Display the current backlog queue size:
# sysctl net.core.netdev_max_backlog net.core.netdev_max_backlog = 1000
Create the
/etc/sysctl.d/10-netdev_max_backlog.conffile with the following content:net.core.netdev_max_backlog = 2000Set the
net.core.netdev_max_backlogparameter to a double of the current value.Load the settings from the
/etc/sysctl.d/10-netdev_max_backlog.conffile:# sysctl -p /etc/sysctl.d/10-netdev_max_backlog.conf
Verification
Monitor the second column in the
/proc/net/softnet_statfile:# awk '{for (i=1; i<=NF; i++) printf strtonum("0x" $i) (i==NF?"\n":" ")}' /proc/net/softnet_stat | column -tIf the values still increase, double the
net.core.netdev_max_backlogvalue again. Repeat this process until the packet drop counters no longer increase.
34.1.3. Increasing the transmit queue length of a NIC to reduce the number of transmit errors
The kernel stores packets in a transmit queue before transmitting them. The default length (1000 packets) is typically sufficient for 10 Gbps, and often also for 40 Gbps networks. However, in faster networks, or if you encounter an increasing number of transmit errors on an adapter, increase the queue length.
Procedure
Display the current transmit queue length:
# ip -s link show enp1s0 2: enp1s0: <BROADCAST,MULTICAST,UP,LOWER_UP> mtu 1500 qdisc fq_codel state UP mode DEFAULT group default qlen 1000 ...
In this example, the transmit queue length (
qlen) of theenp1s0interface is1000.Monitor the dropped packets counter of a network interface’s software transmit queue:
# tc -s qdisc show dev enp1s0 qdisc fq_codel 0: root refcnt 2 limit 10240p flows 1024 quantum 1514 target 5ms interval 100ms memory_limit 32Mb ecn drop_batch 64 Sent 16889923 bytes 426862765 pkt (dropped 191980, overlimits 0 requeues 2) ...
If you encounter a high or increasing transmit error count, set a higher transmit queue length:
Identify the NetworkManager connection profile that uses this interface:
# nmcli connection show NAME UUID TYPE DEVICE Example-Connection a5eb6490-cc20-3668-81f8-0314a27f3f75 ethernet enp1s0
Create the
/etc/NetworkManager/dispatcher.d/99-set-tx-queue-length-upNetworkManager dispatcher script with the following content:#!/bin/bash # Set TX queue length on enp1s0 to 2000 if [ "$1" == "enp1s0" ] && [ "$2" == "up" ] ; then ip link set dev enp1s0 txqueuelen 2000 fiSet the executable bit on the
/etc/NetworkManager/dispatcher.d/99-set-tx-queue-length-upfile:# chmod +x /etc/NetworkManager/dispatcher.d/99-set-tx-queue-length-upApply the changes:
# nmcli connection up Example-Connection
Verification
Display the transmit queue length:
# ip -s link show enp1s0 2: enp1s0: <BROADCAST,MULTICAST,UP,LOWER_UP> mtu 1500 qdisc fq_codel state UP mode DEFAULT group default qlen 2000 ...
Monitor the dropped packets counter:
# tc -s qdisc show dev enp1s0If the
droppedcounter still increases, double the transmit queue length again. Repeat this process until the counter no longer increases.
34.2. Tuning IRQ balancing
On multi-core hosts, you can increase the performance by ensuring that Red Hat Enterprise Linux balances interrupt queues (IRQs) to distribute the interrupts across CPU cores.
34.2.1. Interrupts and interrupt handlers
When a network interface controller (NIC) receives incoming data, it copies the data into kernel buffers by using Direct Memory Access (DMA). The NIC then notifies the kernel about this data by triggering a hard interrupt. These interrupts are processed by interrupt handlers which do minimal work, as they have already interrupted another task and the handlers cannot interrupt themselves. Hard interrupts can be costly in terms of CPU usage, especially if they use kernel locks.
The hard interrupt handler then leaves the majority of packet reception to a software interrupt request (SoftIRQ) process. The kernel can schedule these processes more fairly.
Example 34.1. Displaying hardware interrupts
The kernel stores the interrupt counters in the /proc/interrupts file. To display the counters for a specific NIC, such as enp1s0, enter:
# egrep "CPU|enp1s0" /proc/interrupts CPU0 CPU1 CPU2 CPU3 CPU4 CPU5 105: 141606 0 0 0 0 0 IR-PCI-MSI-edge enp1s0-rx-0 106: 0 141091 0 0 0 0 IR-PCI-MSI-edge enp1s0-rx-1 107: 2 0 163785 0 0 0 IR-PCI-MSI-edge enp1s0-rx-2 108: 3 0 0 194370 0 0 IR-PCI-MSI-edge enp1s0-rx-3 109: 0 0 0 0 0 0 IR-PCI-MSI-edge enp1s0-tx
Each queue has an interrupt vector in the first column assigned to it. The kernel initializes these vectors when the system boots or when a user loads the NIC driver module. Each receive (RX) and transmit (TX) queue is assigned a unique vector that informs the interrupt handler which NIC or queue the interrupt is coming from. The columns represent the number of incoming interrupts for every CPU core.
34.2.2. Software interrupt requests
Software interrupt requests (SoftIRQs) clear the receive ring buffers of network adapters. The kernel schedules SoftIRQ routines to run at a time when other tasks will not be interrupted. On Red Hat Enterprise Linux, processes named ksoftirqd/cpu-number run these routines and call driver-specific code functions.
To monitor the SoftIRQ counters for each CPU core, enter:
# watch -n1 'egrep "CPU|NET_RX|NET_TX" /proc/softirqs'
CPU0 CPU1 CPU2 CPU3 CPU4 CPU5 CPU6 CPU7
NET_TX: 49672 52610 28175 97288 12633 19843 18746 220689
NET_RX: 96 1615 789 46 31 1735 1315 470798The command dynamically updates the output. Press Ctrl+C to interrupt the output.
34.2.3. NAPI Polling
New API (NAPI) is an extension to the device driver packet processing framework to improve the efficiency of incoming network packets. Hard interrupts are expensive because they usually cause a context switch from the kernel space to the user space and back again, and cannot interrupt themselves. Even with interrupt coalescence, the interrupt handler monopolizes a CPU core completely. With NAPI, the driver can use a polling mode instead of being hard-interrupted by the kernel for every packet that is received.
Under normal operation, the kernel issues an initial hard interrupt, followed by a soft interrupt request (SoftIRQ) handler that polls the network card using NAPI routines. To prevent SoftIRQs from monopolizing a CPU core, the polling routine has a budget that determines the CPU time the SoftIRQ can consume. On completion of the SoftIRQ poll routine, the kernel exits the routine and schedules it to run again at a later time to repeat the process of receiving packets from the network card.
34.2.4. The irqbalance service
On systems both with and without Non-Uniform Memory Access (NUMA) architecture, the irqbalance service balances interrupts effectively across CPU cores, based on system conditions. The irqbalance service runs in the background and monitors the CPU load every 10 seconds. The service moves interrupts to other CPU cores when a CPU’s load is too high. As a result, the system performs well and handles load more efficiently.
If irqbalance is not running, usually the CPU core 0 handles most of the interrupts. Even at moderate load, this CPU core can become busy trying to handle the workload of all the hardware in the system. As a consequence, interrupts or interrupt-based work can be missed or delayed. This can result in low network and storage performance, packet loss, and potentially other issues.
Disabling irqbalance can negatively impact the network throughput.
On systems with only a single CPU core, the irqbalance service provides no benefit and exits on its own.
By default, the irqbalance service is enabled and running on Red Hat Enterprise Linux. To re-enable the service if you disabled it, enter:
# systemctl enable --now irqbalanceAdditional resources
- Do we need irqbalance? solution
- How should I configure network interface IRQ channels? solution
34.2.5. Increasing the time SoftIRQs can run on the CPU
If SoftIRQs do not run long enough, the rate of incoming data could exceed the kernel’s capability to drain the buffer fast enough. As a result, the network interface controller (NIC) buffers overflow and packets are lost.
If softirqd processes could not retrieve all packets from interfaces in one NAPI polling cycle, it is an indicator that the SoftIRQs do not have enough CPU time. This could be the case on hosts with fast NICs, such as 10 Gbps and faster. If you increase the values of the net.core.netdev_budget and net.core.netdev_budget_usecs kernel parameters, you can control the time and number of packets softirqd can process in a polling cycle.
Procedure
To determine whether tuning the
net.core.netdev_budgetparameter is needed, display the counters in the/proc/net/softnet_statfile:# awk '{for (i=1; i<=NF; i++) printf strtonum("0x" $i) (i==NF?"\n":" ")}' /proc/net/softnet_stat | column -t 221951548 0 0 0 0 0 0 0 0 0 0 0 0 192058677 0 20380 0 0 0 0 0 0 0 0 0 1 455324886 0 0 0 0 0 0 0 0 0 0 0 2 ...This
awkcommand converts the values in/proc/net/softnet_statfrom hexadecimal to decimal format and displays them in the table format. Each line represents a CPU core starting with core 0.The relevant columns are:
- First column: The total number of received frames.
-
Third column: The number times
softirqdprocesses that could not retrieve all packets from interfaces in one NAPI polling cycle. - Last column: The CPU core number.
If the counters in the third column of the
/proc/net/softnet_statfile increment over time, tune the system:Display the current values of the
net.core.netdev_budget_usecsandnet.core.netdev_budgetparameters:# sysctl net.core.netdev_budget_usecs net.core.netdev_budget net.core.netdev_budget_usecs = 2000 net.core.netdev_budget = 300With these settings,
softirqdprocesses have up to 2000 microseconds to process up to 300 messages from the NIC in one polling cycle. Polling ends based on which condition is met first.Create the
/etc/sysctl.d/10-netdev_budget.conffile with the following content:net.core.netdev_budget = 600 net.core.netdev_budget_usecs = 4000
Set the parameters to a double of their current values.
Load the settings from the
/etc/sysctl.d/10-netdev_budget.conffile:# sysctl -p /etc/sysctl.d/10-netdev_budget.conf
Verification
Monitor the third column in the
/proc/net/softnet_statfile:# awk '{for (i=1; i<=NF; i++) printf strtonum("0x" $i) (i==NF?"\n":" ")}' /proc/net/softnet_stat | column -tIf the values still increase, set
net.core.netdev_budget_usecsandnet.core.netdev_budgetto higher values. Repeat this process until the counters no longer increase.
34.3. Improving the network latency
CPU power management features can cause unwanted delays in time-sensitive application processing. You can disable some or all of these power management features to improve the network latency.
For example, if the latency is higher when the server is idle than under heavy load, CPU power management settings could influence the latency.
Disabling CPU power management features can cause a higher power consumption and heat loss.
34.3.1. How the CPU power states influence the network latency
The consumption state (C-states) of CPUs optimize and reduce the power consumption of computers. The C-states are numbered, starting at C0. In C0, the processor is fully powered and executing. In C1, the processor is fully powered but not executing. The higher the number of the C-state, the more components the CPU turns off.
Whenever a CPU core is idle, the built-in power saving logic steps in and attempts to move the core from the current C-state to a higher one by turning off various processor components. If the CPU core must process data, Red Hat Enterprise Linux (RHEL) sends an interrupt to the processor to wake up the core and set its C-state back to C0.
Moving out of deep C-states back to C0 takes time due to turning power back on to various components of the processor. On multi-core systems, it can also happen that many of the cores are simultaneously idle and, therefore, in deeper C-states. If RHEL tries to wake them up at the same time, the kernel can generate a large number of Inter-Processor Interrupts (IPIs) while all cores return from deep C-states. Due to locking that is required while processing interrupts, the system can then stall for some time while handling all the interrupts. This can result in large delays in the application response to events.
Example 34.2. Displaying times in C-state per core
The Idle Stats page in the PowerTOP application displays how much time the CPU cores spend in each C-state:
Pkg(HW) | Core(HW) | CPU(OS) 0 CPU(OS) 4
| | C0 active 2.5% 2.2%
| | POLL 0.0% 0.0 ms 0.0% 0.1 ms
| | C1 0.1% 0.2 ms 0.0% 0.1 ms
C2 (pc2) 63.7% | |
C3 (pc3) 0.0% | C3 (cc3) 0.1% | C3 0.1% 0.1 ms 0.1% 0.1 ms
C6 (pc6) 0.0% | C6 (cc6) 8.3% | C6 5.2% 0.6 ms 6.0% 0.6 ms
C7 (pc7) 0.0% | C7 (cc7) 76.6% | C7s 0.0% 0.0 ms 0.0% 0.0 ms
C8 (pc8) 0.0% | | C8 6.3% 0.9 ms 5.8% 0.8 ms
C9 (pc9) 0.0% | | C9 0.4% 3.7 ms 2.2% 2.2 ms
C10 (pc10) 0.0% | |
| | C10 80.8% 3.7 ms 79.4% 4.4 ms
| | C1E 0.1% 0.1 ms 0.1% 0.1 ms
...Additional resources
34.3.2. C-state settings in the EFI firmware
In most systems with an EFI firmware, you can enable and disable the individual consumption states (C-states). However, on Red Hat Enterprise Linux (RHEL), the idle driver determines whether the kernel uses the settings from the firmware:
-
intel_idle: This is the default driver on hosts with an Intel CPU and ignores the C-state settings from the EFI firmware. -
acpi_idle: RHEL uses this driver on hosts with CPUs from vendors other than Intel and ifintel_idleis disabled. By default, theacpi_idledriver uses the C-state settings from the EFI firmware.
Additional resources
-
/usr/share/doc/kernel-doc-<version>/Documentation/admin-guide/pm/cpuidle.rstprovided by thekernel-docpackage
34.3.3. Disabling C-states by using a custom TuneD profile
The TuneD service uses the Power Management Quality of Service (PMQOS) interface of the kernel to set consumption states (C-states) locking. The kernel idle driver can communicate with this interface to dynamically limit the C-states. This prevents that administrators must hard code a maximum C-state value by using kernel command line parameters.
Prerequisites
-
The
tunedpackage is installed. -
The
tunedservice is enabled and running.
Procedure
Display the active profile:
# tuned-adm active Current active profile: network-latency
Create a directory for the custom TuneD profile:
# mkdir /etc/tuned/network-latency-custom/Create the
/etc/tuned/network-latency-custom/tuned.conffile with the following content:[main] include=network-latency [cpu] force_latency=cstate.id:1|2
This custom profile inherits all settings from the
network-latencyprofile. Theforce_latencyTuneD parameter specifies the latency in microseconds (µs). If the C-state latency is higher than the specified value, the idle driver in Red Hat Enterprise Linux prevents the CPU from moving to a higher C-state. Withforce_latency=cstate.id:1|2, TuneD first checks if the/sys/devices/system/cpu/cpu_<number>_/cpuidle/state_<cstate.id>_/directory exists. In this case, TuneD reads the latency value from thelatencyfile in this directory. If the directory does not exist, TuneD uses 2 microseconds as a fallback value.Activate the
network-latency-customprofile:# tuned-adm profile network-latency-custom
Additional resources
34.3.4. Disabling C-states by using a kernel command line option
The processor.max_cstate and intel_idle.max_cstat kernel command line parameters configure the maximum consumption states (C-state) CPU cores can use. For example, setting the parameters to 1 ensures that the CPU will never request a C-state below C1.
Use this method to test whether the latency of applications on a host are being affected by C-states. To not hard code a specific state, consider using a more dynamic solution. See Disabling C-states by using a custom TuneD profile.
Prerequisites
-
The
tunedservice is not running or configured to not update C-state settings.
Procedure
Display the idle driver the system uses:
# cat /sys/devices/system/cpu/cpuidle/current_driver intel_idle
If the host uses the
intel_idledriver, set theintel_idle.max_cstatekernel parameter to define the highest C-state that CPU cores should be able to use:# grubby --update-kernel=ALL --args="intel_idle.max_cstate=0"Setting
intel_idle.max_cstate=0disables theintel_idledriver. Consequently, the kernel uses theacpi_idledriver that uses the C-state values set in the EFI firmware. For this reason, also setprocessor.max_cstateto override these C-state settings.On every host, independent from the CPU vendor, set the highest C-state that CPU cores should be able to use:
# grubby --update-kernel=ALL --args="processor.max_cstate=0"ImportantIf you set
processor.max_cstate=0in addition tointel_idle.max_cstate=0, theacpi_idledriver overrides the value ofprocessor.max_cstateand sets it to1. As a result, withprocessor.max_cstate=0 intel_idle.max_cstate=0, the highest C-state the kernel will use is C1, not C0.Restart the host for the changes to take effect:
# reboot
Verification
Display the maximum C-state:
# cat /sys/module/processor/parameters/max_cstate 1If the host uses the
intel_idledriver, display the maximum C-state:# cat /sys/module/intel_idle/parameters/max_cstate 0
Additional resources
- What are CPU "C-states" and how to disable them if needed?
-
/usr/share/doc/kernel-doc-<version>/Documentation/admin-guide/pm/cpuidle.rstprovided by thekernel-docpackage
34.4. Improving the throughput of large amounts of contiguous data streams
According to the IEEE 802.3 standard, a default Ethernet frame without Virtual Local Area Network (VLAN) tag has a maximum size of 1518 bytes. Each of these frames includes an 18 bytes header, leaving 1500 bytes for payload. Consequently, for every 1500 bytes of data the server transmits over the network, 18 bytes (1.2%) Ethernet frame header are overhead and transmitted as well. Headers from layer 3 and 4 protocols increase the overhead per packet further.
Consider employing jumbo frames to save overhead if hosts on your network often send numerous contiguous data streams, such as backup servers or file servers hosting numerous huge files. Jumbo frames are non-standardized frames that have a larger Maximum Transmission Unit (MTU) than the standard Ethernet payload size of 1500 bytes. For example, if you configure jumbo frames with the maximum allowed MTU of 9000 bytes payload, the overhead of each frame reduces to 0.2%.
Depending on the network and services, it can be beneficial to enable jumbo frames only in specific parts of a network, such as the storage backend of a cluster. This avoids packet fragmentation.
34.4.1. Considerations before configuring jumbo frames
Depending on your hardware, applications, and services in your network, jumbo frames can have different impacts. Decide carefully whether enabling jumbo frames provides a benefit in your scenario.
Prerequisites
All network devices on the transmission path must support jumbo frames and use the same Maximum Transmission Unit (MTU) size. In the opposite case, you can face the following problems:
- Dropped packets.
- Higher latency due to fragmented packets.
- Increased risk of packet loss caused by fragmentation. For example, if a router fragments a single 9000-bytes frame into six 1500-bytes frames, and any of those 1500-byte frames are lost, the whole frame is lost because it cannot be reassembled.
In the following diagram, all hosts in the three subnets must use the same MTU if a host from network A sends a packet to a host in network C:
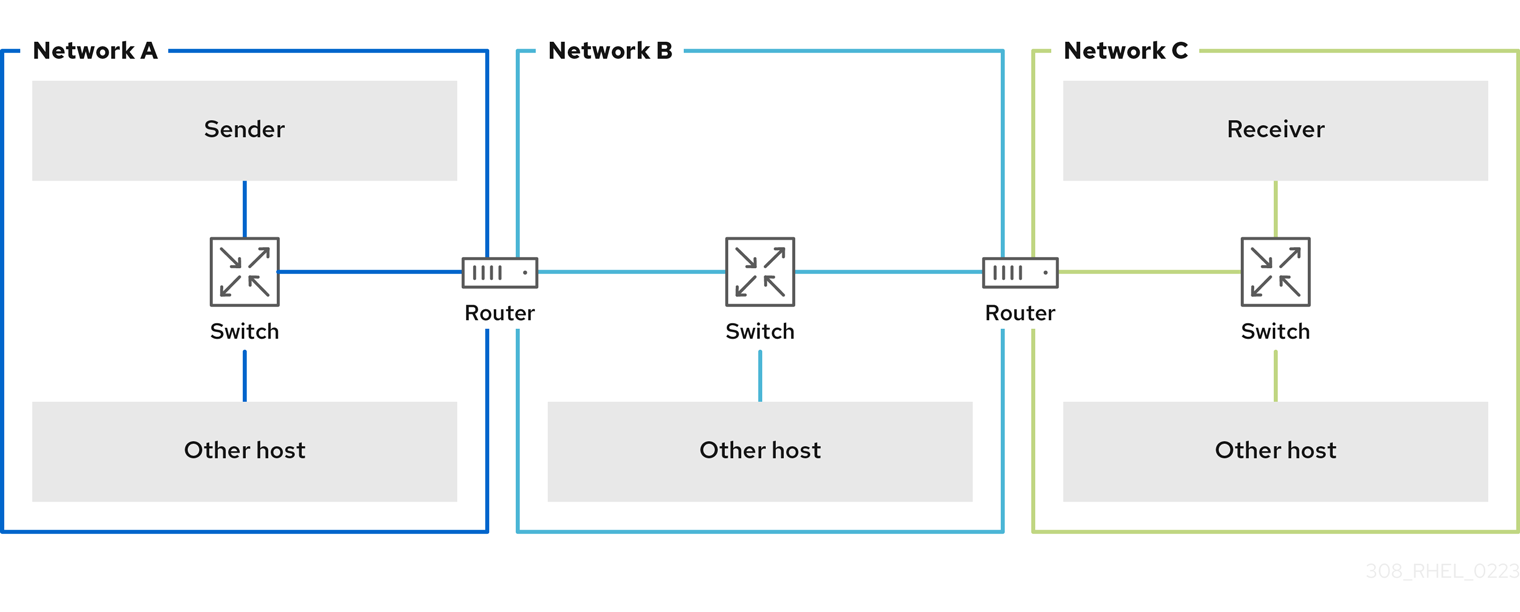
Benefits of jumbo frames
- Higher throughput: Each frame contains more user data while the protocol overhead is fixed.
- Lower CPU utilization: Jumbo frames cause fewer interrupts and, therefore, save CPU cycles.
Drawbacks of jumbo frames
- Higher latency: Larger frames delay packets that follow.
- Increased memory buffer usage: Larger frames can fill buffer queue memory more quickly.
34.4.2. Configuring the MTU in an existing NetworkManager connection profile
If your network requires a different Maximum Transmission Unit (MTU) than the default, you can configure this setting in the corresponding NetworkManager connection profile.
Jumbo frames are network packets with a payload of between 1500 and 9000 bytes. All devices in the same broadcast domain have to support those frames.
Prerequisites
- All devices in the broadcast domain use the same MTU.
- You know the MTU of the network.
- You already configured a connection profile for the network with the divergent MTU.
Procedure
Optional: Display the current MTU:
# ip link show ... 3: enp1s0: <BROADCAST,MULTICAST,UP,LOWER_UP> mtu 1500 qdisc fq_codel state UP mode DEFAULT group default qlen 1000 link/ether 52:54:00:74:79:56 brd ff:ff:ff:ff:ff:ff ...
Optional: Display the NetworkManager connection profiles:
# nmcli connection show NAME UUID TYPE DEVICE Example f2f33f29-bb5c-3a07-9069-be72eaec3ecf ethernet enp1s0 ...
Set the MTU in the profile that manages the connection to the network with the divergent MTU:
# nmcli connection modify Example mtu 9000Reactivate the connection:
# nmcli connection up Example
Verification
Display the MTU setting:
# ip link show ... 3: enp1s0: <BROADCAST,MULTICAST,UP,LOWER_UP> mtu 9000 qdisc fq_codel state UP mode DEFAULT group default qlen 1000 link/ether 52:54:00:74:79:56 brd ff:ff:ff:ff:ff:ff ...
Verify that no host on the transmission paths fragments the packets:
On the receiver side, display the IP reassembly statistics of the kernel:
# nstat -az IpReasm* #kernel IpReasmTimeout 0 0.0 IpReasmReqds 0 0.0 IpReasmOKs 0 0.0 IpReasmFails 0 0.0If the counters return
0, packets were not reassembled.On the sender side, transmit an ICMP request with the prohibit-fragmentation-bit:
# ping -c1 -Mdo -s 8972 destination_hostIf the command succeeds, the packet was not fragmented.
Calculate the value for the
-spacket size option as follows: MTU size - 8 bytes ICMP header - 20 bytes IPv4 header = packet size
34.5. Tuning TCP connections for high throughput
Tune TCP-related settings on Red Hat Enterprise Linux to increase the throughput, reduce the latency, or prevent problems, such as packet loss.
34.5.1. Testing the TCP throughput using iperf3
The iperf3 utility provides a server and client mode to perform network throughput tests between two hosts.
The throughput of applications depends on many factors, such as the buffer sizes that the application uses. Therefore, the results measured with testing utilities, such as iperf3, can be significantly different from those of applications on a server under production workload.
Prerequisites
-
The
iperf3package is installed on both the client and server. - No other services on either host cause network traffic that substantially affects the test result.
- For 40 Gbps and faster connections, the network card supports Accelerated Receive Flow Steering (ARFS) and the feature is enabled on the interface.
Procedure
Optional: Display the maximum network speed of the network interface controller (NIC) on both the server and client:
# ethtool enp1s0 | grep "Speed" Speed: 100000Mb/sOn the server:
Temporarily open the default
iperf3TCP port 5201 in thefirewalldservice:# firewall-cmd --add-port=5201/tcp # firewall-cmd --reload
Start
iperf3in server mode:# iperf3 --serverThe service now is waiting for incoming client connections.
On the client:
Start measuring the throughput:
# iperf3 --time 60 --zerocopy --client 192.0.2.1--time <seconds>: Defines the time in seconds when the client stops the transmission.Set this parameter to a value that you expect to work and increase it in later measurements. If the server sends packets at a faster rate than the devices on the transmit path or the client can process, packets can be dropped.
-
--zerocopy: Enables a zero copy method instead of using thewrite()system call. You require this option only if you want to simulate a zero-copy-capable application or to reach 40 Gbps and more on a single stream. -
--client <server>: Enables the client mode and sets the IP address or name of the server that runs theiperf3server.
Wait until
iperf3completes the test. Both the server and the client display statistics every second and a summary at the end. For example, the following is a summary displayed on a client:[ ID] Interval Transfer Bitrate Retr [ 5] 0.00-60.00 sec 101 GBytes 14.4 Gbits/sec 0 sender [ 5] 0.00-60.04 sec 101 GBytes 14.4 Gbits/sec receiver
In this example, the average bitrate was 14.4 Gbps.
On the server:
-
Press Ctrl+C to stop the
iperf3server. Close the TCP port 5201 in
firewalld:# firewall-cmd --remove-port=5201/tcp # firewall-cmd --reload
-
Press Ctrl+C to stop the
Additional resources
-
iperf3(1)man page
34.5.2. The system-wide TCP socket buffer settings
Socket buffers temporarily store data that the kernel has received or should send:
- The read socket buffer holds packets that the kernel has received but which the application has not read yet.
- The write socket buffer holds packets that an application has written to the buffer but which the kernel has not passed to the IP stack and network driver yet.
If a TCP packet is too large and exceeds the buffer size or packets are sent or received at a too fast rate, the kernel drops any new incoming TCP packet until the data is removed from the buffer. In this case, increasing the socket buffers can prevent packet loss.
Both the net.ipv4.tcp_rmem (read) and net.ipv4.tcp_wmem (write) socket buffer kernel settings contain three values:
net.ipv4.tcp_rmem = 4096 131072 6291456 net.ipv4.tcp_wmem = 4096 16384 4194304
The displayed values are in bytes and Red Hat Enterprise Linux uses them in the following way:
- The first value is the minimum buffer size. New sockets cannot have a smaller size.
- The second value is the default buffer size. If an application sets no buffer size, this is the default value.
-
The third value is the maximum size of automatically tuned buffers. Using the
setsockopt()function with theSO_SNDBUFsocket option in an application disables this maximum buffer size.
Note that the net.ipv4.tcp_rmem and net.ipv4.tcp_wmem parameters set the socket sizes for both the IPv4 and IPv6 protocols.
34.5.3. Increasing the system-wide TCP socket buffers
The system-wide TCP socket buffers temporarily store data that the kernel has received or should send. Both net.ipv4.tcp_rmem (read) and net.ipv4.tcp_wmem (write) socket buffer kernel settings each contain three settings: A minimum, default, and maximum value.
Setting too large buffer sizes wastes memory. Each socket can be set to the size that the application requests, and the kernel doubles this value. For example, if an application requests a 256 KiB socket buffer size and opens 1 million sockets, the system can use up to 512 GB RAM (512 KiB x 1 million) only for the potential socket buffer space.
Additionally, a too large value for the maximum buffer size can increase the latency.
Prerequisites
- You encountered a significant rate of dropped TCP packets.
Procedure
Determine the latency of the connection. For example, ping from the client to server to measure the average Round Trip Time (RTT):
# ping -c 10 server.example.com ... --- server.example.com ping statistics --- 10 packets transmitted, 10 received, 0% packet loss, time 9014ms rtt min/avg/max/mdev = 117.208/117.056/119.333/0.616 ms
In this example, the latency is 117 ms.
Use the following formula to calculate the Bandwidth Delay Product (BDP) for the traffic you want to tune:
connection speed in bytes * latency in ms = BDP in bytes
For example, to calculate the BDP for a 10 Gbps connection that has a 117 ms latency:
(10 * 1000 * 1000 * 1000 / 8) * 117 = 10683760 bytes
Create the
/etc/sysctl.d/10-tcp-socket-buffers.conffile and either set the maximum read or write buffer size, or both, based on your requirements:net.ipv4.tcp_rmem = 4096 262144 21367520 net.ipv4.tcp_wmem = 4096 24576 21367520
Specify the values in bytes. Use the following rule of thumb when you try to identify optimized values for your environment:
-
Default buffer size (second value): Increase this value only slightly or set it to
524288(512 KiB) at most. A too high default buffer size can cause buffer collapsing and, consequently, latency spikes. - Maximum buffer size (third value): A value double to triple of the BDP is often sufficient.
-
Default buffer size (second value): Increase this value only slightly or set it to
Load the settings from the
/etc/sysctl.d/10-tcp-socket-buffers.conffile:# sysctl -p /etc/sysctl.d/10-tcp-socket-buffers.confConfigure your applications to use a larger socket buffer size. The third value in the
net.ipv4.tcp_rmemandnet.ipv4.tcp_wmemparameters defines the maximum buffer size that thesetsockopt()function in an application can request.For further details, see the documentation of the programming language of your application. If you are not the developer of the application, contact the developer.
If you have changed the second value in the
net.ipv4.tcp_rmemornet.ipv4.tcp_wmemparameter, restart the applications to use the new TCP buffer sizes.If you have changed only the third value, you do not need to restart the application because auto-tuning applies these settings dynamically.
Verification
- Optional: Test the TCP throughput using iperf3.
Monitor the packet drop statistics using the same method that you used when you encountered the packet drops.
If packet drops still occur but at a lower rate, increase the buffer sizes further.
Additional resources
- What are the implications of changing socket buffer sizes? solution
-
tcp(7)man page -
socket(7)man page
34.5.4. TCP Window Scaling
The TCP Window Scaling feature, which is enabled by default in Red Hat Enterprise Linux, is an extension of the TCP protocol that significantly improves the throughput.
For example, on a 1 Gbps connection with 1.5 ms Round Trip Time (RTT):
- With TCP Window Scaling enabled, approximately 630 Mbps are realistic.
- With TCP Window Scaling disabled, the throughput goes down to 380 Mbps.
One of the features TCP provides is flow control. With flow control, a sender can send as much data as the receiver can receive, but no more. To achieve this, the receiver advertises a window value, which is the amount of data a sender can send.
TCP originally supported window sizes up to 64 KiB, but at high Bandwidth Delay Products (BDP), this value becomes a restriction because the sender cannot send more than 64 KiB at a time. High-speed connections can transfer much more than 64 KiB of data at a given time. For example, a 10 Gbps link with 1 ms of latency between systems can have more than 1 MiB of data in transit at a given time. It would be inefficient if a host sends only 64 KiB, then pauses until the other host receives that 64 KiB.
To remove this bottleneck, the TCP Window Scaling extension allows the TCP window value to be arithmetically shifted left to increase the window size beyond 64 KiB. For example, the largest window value of 65535 shifted 7 places to the left, resulting in a window size of almost 8 MiB. This enables transferring much more data at a given time.
TCP Window Scaling is negotiated during the three-way TCP handshake that opens every TCP connection. Both sender and receiver must support TCP Window Scaling for the feature to work. If either or both participants do not advertise window scaling ability in their handshake, the connection reverts to using the original 16-bit TCP window size.
By default, TCP Window Scaling is enabled in Red Hat Enterprise Linux:
# sysctl net.ipv4.tcp_window_scaling
net.ipv4.tcp_window_scaling = 1
If TCP Window Scaling is disabled (0) on your server, revert the setting in the same way as you set it.
Additional resources
34.5.5. How TCP SACK reduces the packet drop rate
The TCP Selective Acknowledgment (TCP SACK) feature, which is enabled by default in Red Hat Enterprise Linux (RHEL), is an enhancement of the TCP protocol and increases the efficiency of TCP connections.
In TCP transmissions, the receiver sends an ACK packet to the sender for every packet it receives. For example, a client sends the TCP packets 1-10 to the server but the packets number 5 and 6 get lost. Without TCP SACK, the server drops packets 7-10, and the client must retransmit all packets from the point of loss, which is inefficient. With TCP SACK enabled on both hosts, the client must re-transmit only the lost packets 5 and 6.
Disabling TCP SACK decreases the performance and causes a higher packet drop rate on the receiver side in a TCP connection.
By default, TCP SACK is enabled in RHEL. To verify:
# sysctl net.ipv4.tcp_sack
1
If TCP SACK is disabled (0) on your server, revert the setting in the same way as you set it.
34.6. Tuning UDP connections
Before you start tuning Red Hat Enterprise Linux to improve the throughput of UDP traffic, it is important to have the realistic expectations. UDP is a simple protocol. Compared to TCP, UDP does not contain features, such as flow control, congestion control, and data reliability. This makes it difficult to reach reliable communication over UDP with a throughput rate that is close to the maximum speed of the network interface controller (NIC).
34.6.1. Detecting packet drops
There are multiple levels in the network stack in which the kernel can drop packets. Red Hat Enterprise Linux provides different utilities to display statistics of these levels. Use them to identify potential problems.
Note that you can ignore a very small rate of dropped packets. However, if you encounter a significant rate, consider tuning measures.
The kernel drops network packets if the networking stack cannot handle the incoming traffic.
Procedure
Identify if the network interface controller (NIC) drops packets:
Display the NIC and driver-specific statistics:
# ethtool -S enp1s0 NIC statistics: ... rx_queue_0_drops: 17657 ...
The naming of the statistics and if they are available depend on the NIC and the driver.
Display the interface statistics:
# ip -s link show enp1s0 2: enp1s0: <BROADCAST,MULTICAST,UP,LOWER_UP> mtu 1500 qdisc fq_codel state UP mode DEFAULT group default qlen 1000 link/ether 52:54:00:74:79:56 brd ff:ff:ff:ff:ff:ff RX: bytes packets errors dropped missed mcast_ 84697611107 56866482 0 10904 0 0 TX: bytes packets errors dropped carrier collsns_ 5540028184 3722234 0 0 0 0
RXrepresents the statistics of received packets andTXof transmitted packets.
Identify UDP protocol-specific packet drops due to too small socket buffers or slow application processing:
# nstat -az UdpSndbufErrors UdpRcvbufErrors #kernel UdpSndbufErrors 4 0.0 UdpRcvbufErrors 45716659 0.0The second column in the output lists the counters.
Additional resources
34.6.2. Testing the UDP throughput using iperf3
The iperf3 utility provides a server and client mode to perform network throughput tests between two hosts.
The throughput of applications depend on many factors, such as the buffer sizes that the application uses. Therefore, the results measured with testing utilities, such as iperf3, can significantly be different from those of applications on a server under production workload.
Prerequisites
-
The
iperf3package is installed on both the client and server. - No other services on both hosts cause network traffic that substantially affects the test result.
- Optional: You increased the maximum UDP socket sizes on both the server and the client. For details, see Increasing the system-wide UDP socket buffers.
Procedure
Optional: Display the maximum network speed of the network interface controller (NIC) on both the server and client:
# ethtool enp1s0 | grep "Speed" Speed: 10000Mb/sOn the server:
Display the maximum UDP socket read buffer size, and note the value:
# sysctl net.core.rmem_max net.core.rmem_max = 16777216
The displayed value is in bytes.
Temporarily open the default
iperf3port 5201 in thefirewalldservice:# firewall-cmd --add-port=5201/tcp --add-port=5201/udp # firewall-cmd --reload
Note that,
iperf3opens only a TCP socket on the server. If a clients wants to use UDP, it first connects to this TCP port, and then the server opens a UDP socket on the same port number for performing the UDP traffic throughput test. For this reason, you must open port 5201 for both the TCP and UDP protocol in the local firewall.Start
iperf3in server mode:# iperf3 --serverThe service now waits for incoming client connections.
On the client:
Display the Maximum Transmission Unit (MTU) of the interface that the client will use for the connection to the server, and note the value:
# ip link show enp1s0 2: enp1s0: <BROADCAST,MULTICAST,UP,LOWER_UP> mtu 1500 qdisc fq_codel state UP mode DEFAULT group default qlen 1000 ...
Display the maximum UDP socket write buffer size, and note the value:
# sysctl net.core.wmem_max net.core.wmem_max = 16777216
The displayed value is in bytes.
Start measuring the throughput:
# iperf3 --udp --time 60 --window 16777216 --length 1472 --bitrate 2G --client 192.0.2.1-
--udp: Use the UDP protocol for the test. -
--time <seconds>: Defines the time in seconds when the client stops the transmission. -
--window <size>: Sets the UDP socket buffer size. Ideally, the sizes are the same on both the client and server. In case that they are different, set this parameter to the value that is smaller:net.core.wmem_maxon the client ornet.core.rmem_maxon the server. -
--length <size>: Sets the length of the buffer to read and write. Set this option to the largest unfragmented payload. Calculate the ideal value as follows: MTU - IP header (20 bytes for IPv4 and 40 bytes for IPv6) - 8 bytes UDP header. --bitrate <rate>: Limits the bit rate to the specified value in bits per second. You can specify units, such as2Gfor 2 Gbps.Set this parameter to a value that you expect to work and increase it in later measurements. If the server sends packets at a faster rate than the devices on the transmit path or the client can process them, packets can be dropped.
-
--client <server>: Enables the client mode and sets the IP address or name of the server that runs theiperf3server.
-
Wait until
iperf3completes the test. Both the server and the client display statistics every second and a summary at the end. For example, the following is a summary displayed on a client:[ ID] Interval Transfer Bitrate Jitter Lost/Total Datagrams [ 5] 0.00-60.00 sec 14.0 GBytes 2.00 Gbits/sec 0.000 ms 0/10190216 (0%) sender [ 5] 0.00-60.04 sec 14.0 GBytes 2.00 Gbits/sec 0.002 ms 0/10190216 (0%) receiver
In this example, the average bit rate was 2 Gbps, and no packets were lost.
On the server:
-
Press Ctrl+C to stop the
iperf3server. Close port 5201 in
firewalld:# firewall-cmd --remove-port=5201/tcp --remove-port=5201/udp # firewall-cmd --reload
-
Press Ctrl+C to stop the
Additional resources
-
iperf3(1)man page
34.6.3. Impact of the MTU size on UDP traffic throughput
If your application uses a large UDP message size, using jumbo frames can improve the throughput. According to the IEEE 802.3 standard, a default Ethernet frame without Virtual Local Area Network (VLAN) tag has a maximum size of 1518 bytes. Each of these frames includes an 18 bytes header, leaving 1500 bytes for payload. Consequently, for every 1500 bytes of data the server transmits over the network, 18 bytes (1.2%) are overhead.
Jumbo frames are non-standardized frames that have a larger Maximum Transmission Unit (MTU) than the standard Ethernet payload size of 1500 bytes. For example, if you configure jumbo Frames with the maximum allowed MTU of 9000 bytes payload, the overhead of each frame reduces to 0.2%.
All network devices on the transmission path and the involved broadcast domains must support jumbo frames and use the same MTU. Packet fragmentation and reassembly due to inconsistent MTU settings on the transmission path reduces the network throughput.
Different connection types have certain MTU limitations:
- Ethernet: the MTU is limited to 9000 bytes.
- IP over InfiniBand (IPoIB) in datagram mode: The MTU is limited to 4 bytes less than the InfiniBand MTU.
- In-memory networking commonly supports larger MTUs. For details, see the respective documentation.
34.6.4. Impact of the CPU speed on UDP traffic throughput
In bulk transfers, the UDP protocol is much less efficient than TCP, mainly due to the missing packet aggregation in UDP. By default, the Generic Receive Offload (GRO) and Transmit Segmentation Offload (TSO) features are not enabled. Consequently, the CPU frequency can limit the UDP throughput for bulk transfer on high speed links.
For example, on a tuned host with a high Maximum Transmission Unit (MTU) and large socket buffers, a 3 GHz CPU can process the traffic of a 10 GBit NIC that sends or receives UDP traffic at full speed. However, you can expect about 1-2 Gbps speed loss for every 100 MHz CPU speed under 3 GHz when you transmit UDP traffic. Also, if a CPU speed of 3 GHz can closely achieve 10 Gbps, the same CPU restricts UDP traffic on a 40 GBit NIC to roughly 20-25 Gbps.
34.6.5. Increasing the system-wide UDP socket buffers
Socket buffers temporarily store data that the kernel has received or should send:
- The read socket buffer holds packets that the kernel has received but which the application has not read yet.
- The write socket buffer holds packets that an application has written to the buffer but which the kernel has not passed to the IP stack and network driver yet.
If a UDP packet is too large and exceeds the buffer size or packets are sent or received at a too fast rate, the kernel drops any new incoming UDP packet until the data is removed from the buffer. In this case, increasing the socket buffers can prevent packet loss.
Setting too large buffer sizes wastes memory. Each socket can be set to the size that the application requests, and the kernel doubles this value. For example, if an application requests a 256 KiB socket buffer size and opens 1 million sockets, the system requires 512 GB RAM (512 KiB x 1 million) only for the potential socket buffer space.
Prerequisites
- You encountered a significant rate of dropped UDP packets.
Procedure
Create the
/etc/sysctl.d/10-udp-socket-buffers.conffile and either set the maximum read or write buffer size, or both, based on your requirements:net.core.rmem_max = 16777216 net.core.wmem_max = 16777216
Specify the values in bytes. The values in this example set the maximum size of buffers to 16 MiB. The default values of both parameters are
212992bytes (208 KiB).Load the settings from the
/etc/sysctl.d/10-udp-socket-buffers.conffile:# sysctl -p /etc/sysctl.d/10-udp-socket-buffers.confConfigure your applications to use the larger socket buffer sizes.
The
net.core.rmem_maxandnet.core.wmem_maxparameters define the maximum buffer size that thesetsockopt()function in an application can request. Note that, if you configure your application to not use thesetsockopt()function, the kernel uses the values from thermem_defaultandwmem_defaultparameters.For further details, see the documentation of the programming language of your application. If you are not the developer of the application, contact the developer.
- Restart the applications to use the new UDP buffer sizes.
Verification
Monitor the packet drop statistics using the same method as you used when you encountered the packet drops.
If packet drops still occur but at a lower rate, increase the buffer sizes further.
Additional resources
- What are the implications of changing socket buffer sizes? solution
-
udp(7)man page -
socket(7)man page
34.7. Identifying application read socket buffer bottlenecks
If TCP applications do not clear the read socket buffers frequently enough, performance can suffer and packets can be lost. Red Hat Enterprise Linux provides different utilities to identify such problems.
34.7.1. Identifying receive buffer collapsing and pruning
When the data in the receive queue exceeds the receive buffer size, the TCP stack tries to free some space by removing unnecessary metadata from the socket buffer. This step is known as collapsing.
If collapsing fails to free sufficient space for additional traffic, the kernel prunes new data that arrives. This means that the kernel removes the data from the memory and the packet is lost.
To avoid collapsing and pruning operations, monitor whether TCP buffer collapsing and pruning happens on your server and, in this case, tune the TCP buffers.
Procedure
Use the
nstatutility to query theTcpExtTCPRcvCollapsedandTcpExtRcvPrunedcounters:# nstat -az TcpExtTCPRcvCollapsed TcpExtRcvPruned #kernel TcpExtRcvPruned 0 0.0 TcpExtTCPRcvCollapsed 612859 0.0Wait some time and re-run the
nstatcommand:# nstat -az TcpExtTCPRcvCollapsed TcpExtRcvPruned #kernel TcpExtRcvPruned 0 0.0 TcpExtTCPRcvCollapsed 620358 0.0If the values of the counters have increased compared to the first run, tuning is required:
-
If the application uses the
setsockopt(SO_RCVBUF)call, consider removing it. With this call, the application only uses the receive buffer size specified in the call and turns off the socket’s ability to auto-tune its size. -
If the application does not use the
setsockopt(SO_RCVBUF)call, tune the default and maximum values of the TCP read socket buffer.
-
If the application uses the
Display the receive backlog queue (
Recv-Q):# ss -nti State Recv-Q Send-Q Local Address:Port Peer Address:Port Process ESTAB 0 0 192.0.2.1:443 192.0.2.125:41574 :7,7 ... lastrcv:543 ... ESTAB 78 0 192.0.2.1:443 192.0.2.56:42612 :7,7 ... lastrcv:658 ... ESTAB 88 0 192.0.2.1:443 192.0.2.97:40313 :7,7 ... lastrcv:5764 ... ...Run the
ss -ntcommand multiple times with a few seconds waiting time between each run.If the output lists only one case of a high value in the
Recv-Qcolumn, the application was between two receive operations. However, if the values inRecv-Qstays constant whilelastrcvcontinually grows, orRecv-Qcontinually increases over time, one of the following problems can be the cause:- The application does not check its socket buffers often enough. Contact the application vendor for details about how you can solve this problem.
The application does not get enough CPU time. To further debug this problem:
Display on which CPU cores the application runs:
# ps -eo pid,tid,psr,pcpu,stat,wchan:20,comm PID TID PSR %CPU STAT WCHAN COMMAND ... 44594 44594 5 0.0 Ss do_select httpd 44595 44595 3 0.0 S skb_wait_for_more_pa httpd 44596 44596 5 0.0 Sl pipe_read httpd 44597 44597 5 0.0 Sl pipe_read httpd 44602 44602 5 0.0 Sl pipe_read httpd ...The
PSRcolumn displays the CPU cores the process is currently assigned to.- Identify other processes running on the same cores and consider assigning them to other cores.
Additional resources
34.8. Tuning applications with a large number of incoming requests
If you run an application that handles a large number of incoming requests, such as web servers, it can be necessary to tune Red Hat Enterprise Linux to optimize the performance.
34.8.1. Tuning the TCP listen backlog to process a high number of TCP connection attempts
When an application opens a TCP socket in LISTEN state, the kernel limits the number of accepted client connections this socket can handle. If clients try to establish more connections than the application can process, the new connections get lost or the kernel sends SYN cookies to the client.
If the system is under normal workload and too many connections from legitimate clients cause the kernel to send SYN cookies, tune Red Hat Enterprise Linux (RHEL) to avoid them.
Prerequisites
-
RHEL logs
possible SYN flooding on port <ip_address>:<port_number>error messages in the Systemd journal. - The high number of connection attempts are from valid sources and not caused by an attack.
Procedure
To verify whether tuning is required, display the statistics for the affected port:
# ss -ntl '( sport = :443 )' State Recv-Q Send-Q Local Address:Port Peer Address:Port Process LISTEN 650 500 192.0.2.1:443 0.0.0.0:*
If the current number of connections in the backlog (
Recv-Q) is larger than the socket backlog (Send-Q), the listen backlog is still not large enough and tuning is required.Optional: Display the current TCP listen backlog limit:
# sysctl net.core.somaxconn net.core.somaxconn = 4096
Create the
/etc/sysctl.d/10-socket-backlog-limit.conffile, and set a larger listen backlog limit:net.core.somaxconn = 8192Note that applications can request a larger listen backlog than specified in the
net.core.somaxconnkernel parameter but the kernel limits the application to the number you set in this parameter.Load the setting from the
/etc/sysctl.d/10-socket-backlog-limit.conffile:# sysctl -p /etc/sysctl.d/10-socket-backlog-limit.confReconfigure the application to use the new listen backlog limit:
-
If the application provides a config option for the limit, update it. For example, the Apache HTTP Server provides the
ListenBacklogconfiguration option to set the listen backlog limit for this service. - If you cannot configure the limit, recompile the application.
-
If the application provides a config option for the limit, update it. For example, the Apache HTTP Server provides the
- Restart the application.
Verification
-
Monitor the Systemd journal for further occurrences of
possible SYN flooding on port <port_number>error messages. Monitor the current number of connections in the backlog and compare it with the socket backlog:
# ss -ntl '( sport = :443 )' State Recv-Q Send-Q Local Address:Port Peer Address:Port Process LISTEN 0 500 192.0.2.1:443 0.0.0.0:*
If the current number of connections in the backlog (
Recv-Q) is larger than the socket backlog (Send-Q), the listen backlog is not large enough and further tuning is required.
Additional resources
- kernel: Possible SYN flooding on port #. Sending cookies solution
- Listening TCP server ignores SYN or ACK for new connection handshake solution
-
listen(2)man page
34.9. Avoiding listen queue lock contention
Queue lock contention can cause packet drops and higher CPU usage and, consequently, a higher latency. You can avoid queue lock contention on the receive (RX) and transmit (TX) queue by tuning your application and using transmit packet steering.
34.9.1. Avoiding RX queue lock contention: The SO_REUSEPORT and SO_REUSEPORT_BPF socket options
On a multi-core system, you can improve the performance of multi-threaded network server applications if the application opens the port by using the SO_REUSEPORT or SO_REUSEPORT_BPF socket option. If the application does not use one of these socket options, all threads are forced to share a single socket to receive the incoming traffic. Using a single socket causes:
- Significant contention on the receive buffer, which can cause packet drops and higher CPU usage.
- A significant increase of CPU usage
- Possibly packet drops
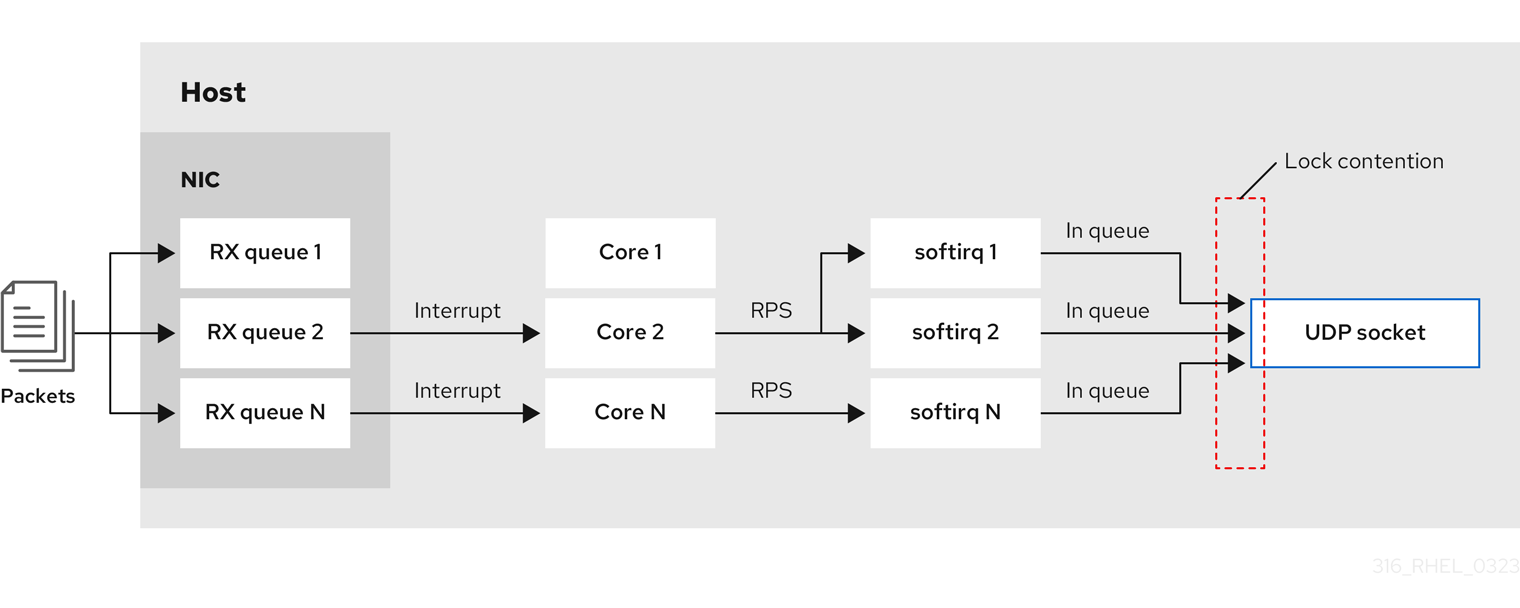
With the SO_REUSEPORT or SO_REUSEPORT_BPF socket option, multiple sockets on one host can bind to the same port:
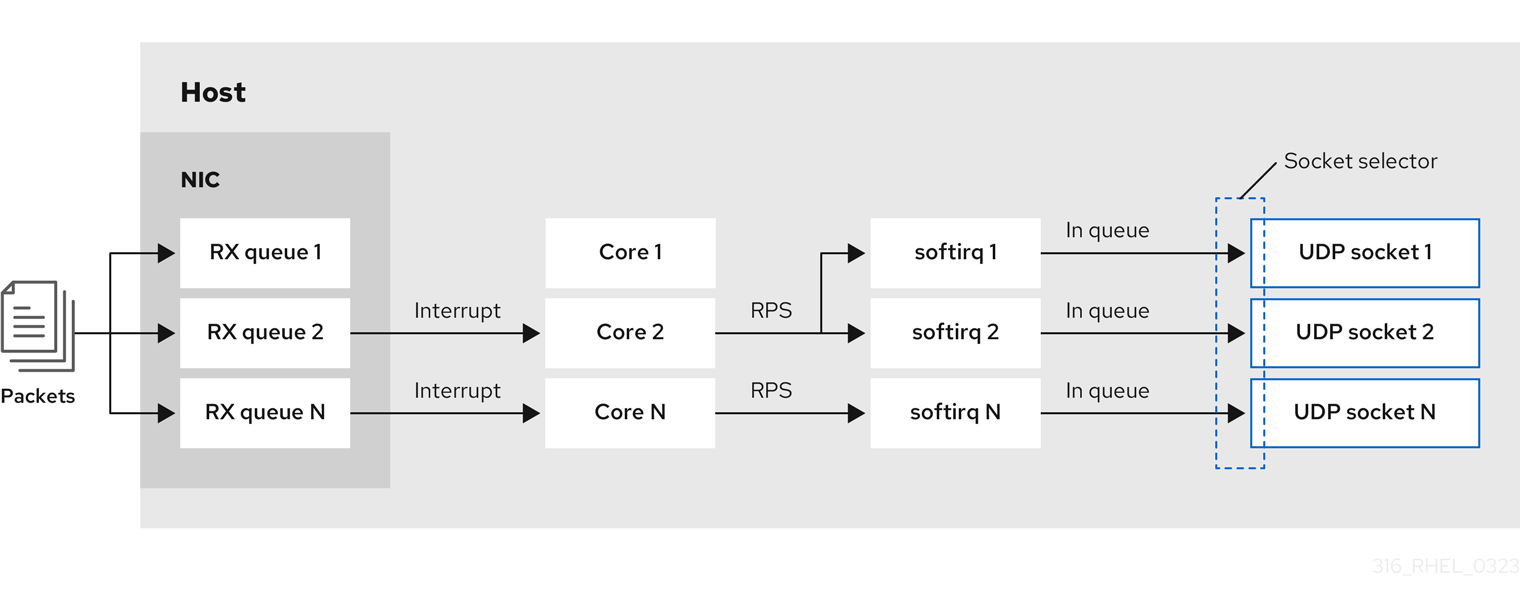
Red Hat Enterprise Linux provides a code example of how to use the SO_REUSEPORT socket options in the kernel sources. To access the code example:
Enable the
rhel-8-for-x86_64-baseos-debug-rpmsrepository:# subscription-manager repos --enable rhel-8-for-x86_64-baseos-debug-rpmsInstall the
kernel-debuginfo-common-x86_64package:# yum install kernel-debuginfo-common-x86_64-
The code example is now available in the
/usr/src/debug/kernel-<version>/linux-<version>/tools/testing/selftests/net/reuseport_bpf_cpu.cfile.
Additional resources
-
socket(7)man page -
/usr/src/debug/kernel-<version>/linux-<version>/tools/testing/selftests/net/reuseport_bpf_cpu.c
34.9.2. Avoiding TX queue lock contention: Transmit packet steering
In hosts with a network interface controller (NIC) that supports multiple queues, transmit packet steering (XPS) distributes the processing of outgoing network packets among several queues. This enables multiple CPUs to process the outgoing network traffic and to avoid transmit queue lock contention and, consequently, packet drops.
Certain drivers, such as ixgbe, i40e, and mlx5 automatically configure XPS. To identify if the driver supports this capability, consult the documentation of your NIC driver. Consult your NIC driver’s documentation to identify if the driver supports this capability. If the driver does not support XPS auto-tuning, you can manually assign CPU cores to the transmit queues.
Red Hat Enterprise Linux does not provide an option to permanently assign transmit queues to CPU cores. Use the commands in a script and run it when the system boots.
Prerequisites
- The NIC supports multiple queues.
-
The
numactlpackage is installed.
Procedure
Display the count of available queues:
# ethtool -l enp1s0 Channel parameters for enp1s0: Pre-set maximums: RX: 0 TX: 0 Other: 0 Combined: 4 Current hardware settings: RX: 0 TX: 0 Other: 0 Combined: 1
The
Pre-set maximumssection shows the total number of queues andCurrent hardware settingsthe number of queues that are currently assigned to the receive, transmit, other, or combined queues.Optional: If you require queues on specific channels, assign them accordingly. For example, to assign the 4 queues to the
Combinedchannel, enter:# ethtool -L enp1s0 combined 4Display to which Non-Uniform Memory Access (NUMA) node the NIC is assigned:
# cat /sys/class/net/enp1s0/device/numa_node 0If the file is not found or the command returns
-1, the host is not a NUMA system.If the host is a NUMA system, display which CPUs are assigned to which NUMA node:
# lscpu | grep NUMA NUMA node(s): 2 NUMA node0 CPU(s): 0-3 NUMA node1 CPU(s): 4-7In the example above, the NIC has 4 queues and the NIC is assigned to NUMA node 0. This node uses the CPU cores 0-3. Consequently, map each transmit queue to one of the CPU cores from 0-3:
# echo 1 > /sys/class/net/enp1s0/queues/tx-0/xps_cpus # echo 2 > /sys/class/net/enp1s0/queues/tx-1/xps_cpus # echo 4 > /sys/class/net/enp1s0/queues/tx-2/xps_cpus # echo 8 > /sys/class/net/enp1s0/queues/tx-3/xps_cpus
If the number of CPU cores and transmit (TX) queues is the same, use a 1 to 1 mapping to avoid any kind of contention on the TX queue. Otherwise, if you map multiple CPUs on the same TX queue, transmit operations on different CPUs will cause TX queue lock contention and negatively impacts the transmit throughput.
Note that you must pass the bitmap, containing the CPU’s core numbers, to the queues. Use the following command to calculate the bitmap:
# printf %x $((1 << <core_number> ))
Verification
Identify the process IDs (PIDs) of services that send traffic:
# pidof <process_name> 12345 98765
Pin the PIDs to cores that use XPS:
# numactl -C 0-3 12345 98765Monitor the
requeuescounter while the process send traffic:# tc -s qdisc qdisc fq_codel 0: dev enp10s0u1 root refcnt 2 limit 10240p flows 1024 quantum 1514 target 5ms interval 100ms memory_limit 32Mb ecn drop_batch 64 Sent 125728849 bytes 1067587 pkt (dropped 0, overlimits 0 requeues 30) backlog 0b 0p requeues 30 ...
If the
requeuescounter no longer increases at a significant rate, TX queue lock contention no longer happens.
Additional resources
-
/usr/share/doc/kernel-doc-_<version>/Documentation/networking/scaling.rst
34.9.3. Disabling the Generic Receive Offload feature on servers with high UDP traffic
Applications that use high-speed UDP bulk transfer should enable and use UDP Generic Receive Offload (GRO) on the UDP socket. However, you can disable GRO to increase the throughput if the following conditions apply:
- The application does not support GRO and the feature cannot be added.
TCP throughput is not relevant.
WarningDisabling GRO significantly reduces the receive throughput of TCP traffic. Therefore, do not disable GRO on hosts where TCP performance is relevant.
Prerequisites
- The host mainly processes UDP traffic.
- The application does not use GRO.
- The host does not use UDP tunnel protocols, such as VXLAN.
- The host does not run virtual machines (VMs) or containers.
Procedure
Optional: Display the NetworkManager connection profiles:
# nmcli connection show NAME UUID TYPE DEVICE example f2f33f29-bb5c-3a07-9069-be72eaec3ecf ethernet enp1s0
Disable GRO support in the connection profile:
# nmcli connection modify example ethtool.feature-gro offReactivate the connection profile:
# nmcli connection up example
Verification
Verify that GRO is disabled:
# ethtool -k enp1s0 | grep generic-receive-offload generic-receive-offload: off- Monitor the throughput on the server. Re-enable GRO in the NetworkManager profile if the setting has negative side effects to other applications on the host.
Additional resources
34.10. Tuning the device driver and NIC
In RHEL, kernel modules provide drivers for network interface controllers (NICs). These modules support parameters to tune and optimize the device driver and the NIC. For example, if the driver supports delaying the generation of receive interrupts, you can reduce the value of the corresponding parameter to avoid running out of receive descriptors.
Not all modules support custom parameters, and the features depend on the hardware, as well as the driver and firmware version.
34.10.1. Configuring custom NIC driver parameters
Many kernel modules support setting parameters to tune the driver and the network interface controller (NIC). You can customize the settings according to the hardware and the driver.
If you set parameters on a kernel module, RHEL applies these settings to all devices that use this driver.
Prerequisites
- A NIC is installed in the host.
- The kernel module that provides the driver for the NIC supports the required tuning feature.
- You are logged in locally or using a network interface that is different from the one that uses the driver for which you want to change the parameters.
Procedure
Identify the driver:
# ethtool -i enp0s31f6 driver: e1000e version: ... firmware-version: ... ...
Note that certain features can require a specific driver and firmware version.
Display the available parameters of the kernel module:
# modinfo -p e1000e ... SmartPowerDownEnable:Enable PHY smart power down (array of int) parm:RxIntDelay:Receive Interrupt Delay (array of int)For further details on the parameters, see the kernel module’s documentation. For modules in RHEL, see the documentation in the
/usr/share/doc/kernel-doc-<version>/Documentation/networking/device_drivers/directory that is provided by thekernel-docpackage.Create the
/etc/modprobe.d/nic-parameters.conffile and specify the parameters for the module:options <module_name> <parameter1>=<value> <parameter2>=<value>
For example, to enable the port power saving mechanism and set the generation of receive interrupts to 4 units, enter:
options e1000e SmartPowerDownEnable=1 RxIntDelay=4Unload the module:
# modprobe -r e1000eWarningUnloading a module that an active network interface uses, immediately terminates the connection and you can lock yourself out of the server.
Load the module:
# modprobe e1000eReactivate the network connections:
# nmcli connection up <profile_name>
Verification
Display the kernel messages:
# dmesg ... [35309.225765] e1000e 0000:00:1f.6: Transmit Interrupt Delay set to 16 [35309.225769] e1000e 0000:00:1f.6: PHY Smart Power Down Enabled ...Note that not all modules log parameter settings to the kernel ring buffer.
Certain kernel modules create files for each module parameter in the
/sys/module/<driver>/parameters/directory. Each of these files contain the current value of this parameter. You can display these files to verify a setting:# cat /sys/module/<driver_name>/parameters/<parameter_name>
34.11. Configuring network adapter offload settings
To reduce CPU load, certain network adapters use offloading features which move the network processing load to the network interface controller (NIC). For example, with Encapsulating Security Payload (ESP) offload, the NIC performs ESP operations to accelerate IPsec connections and reduce CPU load.
By default, most offloading features in Red Hat Enterprise Linux are enabled. Only disable them in the following cases:
- Temporarily disable offload features for troubleshooting purposes.
- Permanently disable offload features when a specific feature negatively impacts your host.
If a performance-related offload feature is not enabled by default in a network driver, you can enable it manually.
34.11.1. Temporarily setting an offload feature
If you expect that an offload feature causes problems or reduces the performance of your host, you can attempt to narrow down the cause by temporarily enabling or disabling it, depending on its current state.
If you temporarily enable or disable an offload feature, it returns to its previous value on the next reboot.
Prerequisites
- The network card supports offload features.
Procedure
Display the interface’s available offload features and their current state:
# ethtool -k enp1s0 ... esp-hw-offload: on ntuple-filters: off rx-vlan-filter: off [fixed] ...
The output depends on the capabilities of the hardware and its driver. Note that you cannot change the state of features that are flagged with
[fixed].Temporarily disable an offload feature:
# ethtool -K <interface> <feature> [on|off]For example, to temporarily disable IPsec Encapsulating Security Payload (ESP) offload on the
enp10s0u1interface, enter:# ethtool -K enp10s0u1 esp-hw-offload offFor example, to temporarily enable accelerated Receive Flow Steering (aRFS) filtering on the
enp10s0u1interface, enter:# ethtool -K enp10s0u1 ntuple-filters on
Verification
Display the states of the offload features:
# ethtool -k enp1s0 ... esp-hw-offload: off ntuple-filters: on ...
Test whether the problem you encountered before changing the offload feature still exists.
If the problem no longer exists after changing a specific offload feature:
- Contact Red Hat Support and report the problem.
- Consider permanently setting the offload feature until a fix is available.
If the problem still exists after disabling a specific offload feature:
-
Reset the setting to its previous state by using the
ethtool -K <interface> <feature> [on|off]command. - Enable or disable a different offload feature to narrow down the problem.
-
Reset the setting to its previous state by using the
Additional resources
-
ethtool(8)man page
34.11.2. Permanently setting an offload feature
If you have identified a specific offload feature that limits the performance on your host, you can permanently enable or disable it, depending on its current state.
If you permanently enable or disable an offload feature, NetworkManager ensures that the feature still has this state after a reboot.
Prerequisites
- You identified a specific offload feature to limit the performance on your host.
Procedure
Identify the connection profile that uses the network interface on which you want to change the state of the offload feature:
# nmcli connection show NAME UUID TYPE DEVICE Example a5eb6490-cc20-3668-81f8-0314a27f3f75 ethernet enp1ss0 ...
Permanently change the state of the offload feature:
# nmcli connection modify <connection_name> <feature> [on|off]For example, to permanently disable IPsec Encapsulating Security Payload (ESP) offload in the
Exampleconnection profile, enter:# nmcli connection modify Example ethtool.feature-esp-hw-offload offFor example, to permanently enable accelerated Receive Flow Steering (aRFS) filtering in the
Exampleconnection profile, enter:# nmcli connection modify Example ethtool.feature-ntuple on
Reactivate the connection profile:
# nmcli connection up Example
Verification
Display the output states of the offload features:
# ethtool -k enp1s0 ... esp-hw-offload: off ntuple-filters: on ...
Additional resources
-
nm-settings-nmcli(5)man page
34.12. Tuning interrupt coalescence settings
Interrupt coalescence is a mechanism for reducing the number of interrupts generated by a network card. Generally, fewer interrupts can enhance the latency and overall performance of your network.
Tuning the interrupt coalescence settings involves adjusting the parameters that control:
- The number of packets that are combined into a single interrupt.
- The delay before generating an interrupt.
The optimal coalescence settings depend on the specific network conditions and hardware in use. Therefore, it might take several attempts to find the settings that work best for your environment and needs.
34.12.1. Optimizing RHEL for latency or throughput-sensitive services
The goal of coalesce tuning is to minimize the number of interrupts required for a given workload. In high-throughput situations, the goal is to have as few interrupts as possible while maintaining a high data rate. In low-latency situations, more interrupts can be used to handle traffic quickly.
You can adjust the settings on your network card to increase or decrease the number of packets that are combined into a single interrupt. As a result, you can achieve improved throughput or latency for your traffic.
Procedure
Identify the network interface that is experiencing the bottleneck:
# ethtool -S enp1s0 NIC statistics: rx_packets: 1234 tx_packets: 5678 rx_bytes: 12345678 tx_bytes: 87654321 rx_errors: 0 tx_errors: 0 rx_missed: 0 tx_dropped: 0 coalesced_pkts: 0 coalesced_events: 0 coalesced_aborts: 0Identify the packet counters containing "drop", "discard", or "error" in their name. These particular statistics measure the actual packet loss at the network interface card (NIC) packet buffer, which can be caused by NIC coalescence.
Monitor values of packet counters you identified in the previous step.
Compare them to the expected values for your network to determine whether any particular interface experiences a bottleneck. Some common signs of a network bottleneck include, but are not limited to:
- Many errors on a network interface
- High packet loss
Heavy usage of the network interface
NoteOther important factors are for example CPU usage, memory usage, and disk I/O when identifying a network bottleneck.
View the current coalescence settings:
# ethtool enp1s0 Settings for enp1s0: Supported ports: [ TP ] Supported link modes: 10baseT/Half 10baseT/Full 100baseT/Half 100baseT/Full 1000baseT/Full Supported pause frame use: No Supports auto-negotiation: Yes Advertised link modes: 10baseT/Half 10baseT/Full 100baseT/Half 100baseT/Full 1000baseT/Full Advertised pause frame use: No Advertised auto-negotiation: Yes Speed: 1000Mb/s Duplex: Full Port: Twisted Pair PHYAD: 0 Transceiver: internal Auto-negotiation: on MDI-X: Unknown Supports Wake-on: g Wake-on: g Current message level: 0x00000033 (51) drv probe link Link detected: yesIn this output, monitor the
SpeedandDuplexfields. These fields display information about the network interface operation and whether it is running at its expected values.Check the current interrupt coalescence settings:
# ethtool -c enp1s0 Coalesce parameters for enp1s0: Adaptive RX: off Adaptive TX: off RX usecs: 100 RX frames: 8 RX usecs irq: 100 RX frames irq: 8 TX usecs: 100 TX frames: 8 TX usecs irq: 100 TX frames irq: 8-
The
usecsvalues refer to the number of microseconds that the receiver or transmitter waits before generating an interrupt. -
The
framesvalues refer to the number of frames that the receiver or transmitter waits before generating an interrupt. The
irqvalues are used to configure the interrupt moderation when the network interface is already handling an interrupt.NoteNot all network interface cards support reporting and changing all values from the example output.
-
The
Adaptive RX/TXvalue represents the adaptive interrupt coalescence mechanism, which adjusts the interrupt coalescence settings dynamically. Based on the packet conditions, the NIC driver auto-calculates coalesce values whenAdaptive RX/TXare enabled (the algorithm differs for every NIC driver).
-
The
Modify the coalescence settings as needed. For example:
While
ethtool.coalesce-adaptive-rxis disabled, configureethtool.coalesce-rx-usecsto set the delay before generating an interrupt to 100 microseconds for the RX packets:# nmcli connection modify enp1s0 ethtool.coalesce-rx-usecs 100Enable
ethtool.coalesce-adaptive-rxwhileethtool.coalesce-rx-usecsis set to its default value:# nmcli connection modify enp1s0 ethtool.coalesce-adaptive-rx onRed Hat recommends that modifying the Adaptive-RX setting as follows:
-
Users concerned with low latency (sub-50us) should not enable
Adaptive-RX. -
Users concerned with throughput can probably enable
Adaptive-RXwith no harm. If they do not want to use the adaptive interrupt coalescence mechanism, they can try setting large values like 100us, or 250us toethtool.coalesce-rx-usecs. - Users unsure about their needs should not modify this setting until an issue occurs.
-
Users concerned with low latency (sub-50us) should not enable
Re-activate the connection:
# nmcli connection up enp1s0
Verification steps
Monitor the network performance and check for dropped packets:
# ethtool -S enp1s0 NIC statistics: rx_packets: 1234 tx_packets: 5678 rx_bytes: 12345678 tx_bytes: 87654321 rx_errors: 0 tx_errors: 0 rx_missed: 0 tx_dropped: 0 coalesced_pkts: 12 coalesced_events: 34 coalesced_aborts: 56 ...The value of the
rx_errors,rx_dropped,tx_errors, andtx_droppedfields should be 0 or close to it (up to few hundreds, depending on the network traffic and system resources). A high value in these fields indicates a network problem. Your counters can have different names. Closely monitor packet counters containing "drop", "discard", or "error" in their name.The value of the
rx_packets,tx_packets,rx_bytes, andtx_bytesshould increase over time. If the values do not increase, there might be a network problem. The packet counters can have different names, depending on your NIC driver.ImportantThe
ethtoolcommand output can vary depending on the NIC and driver in use.Users with focus on extremely low latency can use application-level metrics or the kernel packet time-stamping API for their monitoring purposes.
34.13. Benefits of TCP Timestamps
TCP Timestamps are optional information in the TCP header and an extension of the TCP protocol. By default, TCP Timestamps are enabled in Red Hat Enterprise Linux, and the kernel uses TCP Timestamps to better estimate the round trip time (RTT) in TCP connections. This results in more accurate TCP window and buffer calculations.
Additionally, TCP Timestamps provide an alternative method to determine the age and order of a segment, and protect against wrapped sequence numbers. TCP packet headers record the sequence number in a 32-bit field. On a 10 Gbps connection, the value of this field can wrap after 1.7 seconds. Without TCP Timestamps, the receiver could not determine whether a segment with a wrapped sequence number is a new segment or an old duplicate. With TCP Timestamps, however, the receiver can make the correct choice to receive or discard the segment. Therefore, enabling TCP Timestamps on systems with fast network interfaces is essential.
The net.ipv4.tcp_timestamps kernel parameter can have one of the following values:
-
0: TCP Timestamps are disabled. -
1: TCP Timestamps are enabled (default). 2: TCP Timestamps are enabled but without random offsets.ImportantWithout random offsets for each connection, it is possible to approximately determine the host’s uptime and fingerprint and use this information in attacks.
By default, TCP Timestamps are enabled in Red Hat Enterprise Linux and use random offsets for each connection instead of only storing the current time:
# sysctl net.ipv4.tcp_timestamps
net.ipv4.tcp_timestamps = 1
If the net.ipv4.tcp_timestamps parameter has a different value than the default (1), revert the setting in the same way as you set it.
Additional resources
34.14. Flow control for Ethernet networks
On an Ethernet link, continuous data transmission between a network interface and a switch port can lead to full buffer capacity. Full buffer capacity results in network congestion. In this case, when the sender transmits data at a higher rate than the processing capacity of the receiver, packet loss can occur due to the lower data processing capacity of a network interface on the other end of the link which is a switch port.
The flow control mechanism manages data transmission across the Ethernet link where each sender and receiver has different sending and receiving capacities. To avoid packet loss, the Ethernet flow control mechanism temporarily suspends the packet transmission to manage a higher transmission rate from a switch port. Note that routers do not forward pause frames beyond a switch port.
When receive (RX) buffers become full, a receiver sends pause frames to the transmitter. The transmitter then stops data transmission for a short sub-second time frame, while continuing to buffer incoming data during this pause period. This duration provides enough time for the receiver to empty its interface buffers and prevent buffer overflow.
Either end of the Ethernet link can send pause frames to another end. If the receive buffers of a network interface are full, the network interface will send pause frames to the switch port. Similarly, when the receive buffers of a switch port are full, the switch port sends pause frames to the network interface.
By default, most of the network drivers in Red Hat Enterprise Linux have pause frame support enabled. To display the current settings of a network interface, enter:
# ethtool --show-pause enp1s0
Pause parameters for enp1s0:
...
RX: on
TX: on
...Verify with your switch vendor to confirm if your switch supports pause frames.
Additional resources
Chapter 35. Configuring an operating system to optimize memory access
You can configure the operating system to optimize memory access across workloads with the tools that are included in RHEL
35.1. Tools for monitoring and diagnosing system memory issues
The following tools are available in Red Hat Enterprise Linux 8 for monitoring system performance and diagnosing performance problems related to system memory:
-
vmstattool, provided by theprocps-ngpackage, displays reports of a system’s processes, memory, paging, block I/O, traps, disks, and CPU activity. It provides an instantaneous report of the average of these events since the machine was last turned on, or since the previous report. valgrindframework provides instrumentation to user-space binaries. Install this tool, using theyum install valgrindcommand. It includes a number of tools, that you can use to profile and analyze program performance, such as:memcheckoption is the defaultvalgrindtool. It detects and reports on a number of memory errors that can be difficult to detect and diagnose, such as:- Memory access that should not occur
- Undefined or uninitialized value use
- Incorrectly freed heap memory
- Pointer overlap
Memory leaks
NoteMemcheck can only report these errors, it cannot prevent them from occurring. However,
memchecklogs an error message immediately before the error occurs.
-
cachegrindoption simulates application interaction with a system’s cache hierarchy and branch predictor. It gathers statistics for the duration of application’s execution and outputs a summary to the console. -
massifoption measures the heap space used by a specified application. It measures both useful space and any additional space allocated for bookkeeping and alignment purposes.
Additional resources
-
vmstat(8)andvalgrind(1)man pages -
/usr/share/doc/valgrind-version/valgrind_manual.pdffile
35.2. Overview of a system’s memory
The Linux Kernel is designed to maximize the utilization of a system’s memory resources (RAM). Due to these design characteristics, and depending on the memory requirements of the workload, part of the system’s memory is in use within the kernel on behalf of the workload, while a small part of the memory is free. This free memory is reserved for special system allocations, and for other low or high priority system services.
The rest of the system’s memory is dedicated to the workload itself, and divided into the following two categories:
File memoryPages added in this category represent parts of files in permanent storage. These pages, from the page cache, can be mapped or unmapped in an application’s address spaces. You can use applications to map files into their address space using the
mmapsystem calls, or to operate on files via the buffered I/O read or write system calls.Buffered I/O system calls, as well as applications that map pages directly, can re-utilize unmapped pages. As a result, these pages are stored in the cache by the kernel, especially when the system is not running any memory intensive tasks, to avoid re-issuing costly I/O operations over the same set of pages.
Anonymous memory- Pages in this category are in use by a dynamically allocated process, or are not related to files in permanent storage. This set of pages back up the in-memory control structures of each task, such as the application stack and heap areas.
Figure 35.1. Memory usage patterns

35.3. Virtual memory parameters
The virtual memory parameters are listed in the /proc/sys/vm directory.
The following are the available virtual memory parameters:
vm.dirty_ratio-
Is a percentage value. When this percentage of the total system memory is modified, the system begins writing the modifications to the disk with the
pdflushoperation. The default value is20percent. vm.dirty_background_ratio-
A percentage value. When this percentage of total system memory is modified, the system begins writing the modifications to the disk in the background. The default value is
10percent. vm.overcommit_memoryDefines the conditions that determine whether a large memory request is accepted or denied.The default value is
0.By default, the kernel performs checks if a virtual memory allocation request fits into the present amount of memory (total + swap) and rejects only large requests. Otherwise virtual memory allocations are granted, and this means they allow memory overcommitment.
Setting the
overcommit_memoryparameter’s value:-
When this parameter is set to
1, the kernel performs no memory overcommit handling. This increases the possibility of memory overload, but improves performance for memory-intensive tasks. -
When this parameter is set to
2, the kernel denies requests for memory equal to or larger than the sum of the total available swap space and the percentage of physical RAM specified in theovercommit_ratio. This reduces the risk of overcommitting memory, but is recommended only for systems with swap areas larger than their physical memory.
-
When this parameter is set to
vm.overcommit_ratio-
Specifies the percentage of physical RAM considered when
overcommit_memoryis set to2. The default value is50. vm.max_map_count-
Defines the maximum number of memory map areas that a process can use. The default value is
65530. Increase this value if your application needs more memory map areas. vm.min_free_kbytesSets the size of the reserved free pages pool. It is also responsible for setting the
min_page,low_page, andhigh_pagethresholds that govern the behavior of the Linux kernel’s page reclaim algorithms. It also specifies the minimum number of kilobytes to keep free across the system. This calculates a specific value for each low memory zone, each of which is assigned a number of reserved free pages in proportion to their size.Setting the
vm.min_free_kbytesparameter’s value:- Increasing the parameter value effectively reduces the application working set usable memory. Therefore, you might want to use it for only kernel-driven workloads, where driver buffers need to be allocated in atomic contexts.
Decreasing the parameter value might render the kernel unable to service system requests, if memory becomes heavily contended in the system.
WarningExtreme values can be detrimental to the system’s performance. Setting the
vm.min_free_kbytesto an extremely low value prevents the system from reclaiming memory effectively, which can result in system crashes and failure to service interrupts or other kernel services. However, settingvm.min_free_kbytestoo high considerably increases system reclaim activity, causing allocation latency due to a false direct reclaim state. This might cause the system to enter an out-of-memory state immediately.The
vm.min_free_kbytesparameter also sets a page reclaim watermark, calledmin_pages. This watermark is used as a factor when determining the two other memory watermarks,low_pages, andhigh_pages, that govern page reclaim algorithms.
/proc/PID/oom_adjIn the event that a system runs out of memory, and the
panic_on_oomparameter is set to0, theoom_killerfunction kills processes, starting with the process that has the highestoom_score, until the system recovers.The
oom_adjparameter determines theoom_scoreof a process. This parameter is set per process identifier. A value of-17disables theoom_killerfor that process. Other valid values range from-16to15.
Processes created by an adjusted process inherit the oom_score of that process.
vm.swappinessThe swappiness value, ranging from
0to200, controls the degree to which the system favors reclaiming memory from the anonymous memory pool, or the page cache memory pool.Setting the
swappinessparameter’s value:- Higher values favor file-mapped driven workloads while swapping out the less actively accessed processes’ anonymous mapped memory of RAM. This is useful for file-servers or streaming applications that depend on data, from files in the storage, to reside on memory to reduce I/O latency for the service requests.
Low values favor anonymous-mapped driven workloads while reclaiming the page cache (file mapped memory). This setting is useful for applications that do not depend heavily on the file system information, and heavily utilize dynamically allocated and private memory, such as mathematical and number crunching applications, and few hardware virtualization supervisors like QEMU.
The default value of the
vm.swappinessparameter is60.Warning-
Setting the
vm.swappinessto0aggressively avoids swapping anonymous memory out to a disk, this increases the risk of processes being killed by theoom_killerfunction when under memory or I/O intensive workloads. If you are using
cgroupsV1, the per-cgroup swappiness value exclusive tocgroupsV1will result in the system-wide swappiness configured by thevm.swappinessparameter having little-to-no effect on the swap behavior of the system. This issue might lead to unexpected and inconsistent swap behavior.In such cases, consider using the
vm.force_cgroup_v2_swappinessparameter.For more information, see the Premature swapping with swappiness=0 while there is still plenty of pagecache to be reclaimed KCS solution.
-
Setting the
force_cgroup_v2_swappiness-
This control is used to deprecate the per-cgroup swappiness value available only in
cgroupsV1. Most of all system and user processes are run within a cgroup. Cgroup swappiness values default to 60. This can lead to effects where systems swappiness value has little effect on the swap behavior of their system. If a user does not care about the per-cgroup swappiness feature they can configure their system withforce_cgroup_v2_swappiness=1to have more consistent swappiness behavior across their whole system.
Additional resources
-
sysctl(8)man page - Setting memory-related kernel parameters
35.4. File system parameters
The file system parameters are listed in the /proc/sys/fs directory. The following are the available file system parameters:
aio-max-nr-
Defines the maximum allowed number of events in all active asynchronous input/output contexts. The default value is
65536, and modifying this value does not pre-allocate or resize any kernel data structures. file-maxDetermines the maximum number of file handles for the entire system. The default value on Red Hat Enterprise Linux 8 is either
8192or one tenth of the free memory pages available at the time the kernel starts, whichever is higher.Raising this value can resolve errors caused by a lack of available file handles.
Additional resources
-
sysctl(8)man page
35.5. Kernel parameters
The default values for the kernel parameters are located in the /proc/sys/kernel/ directory. These are set default values provided by the kernel or values specified by a user via sysctl.
The following are the available kernel parameters used to set up limits for the msg* and shm* System V IPC (sysvipc) system calls:
msgmax-
Defines the maximum allowed size in bytes of any single message in a message queue. This value must not exceed the size of the queue (
msgmnb). Use thesysctl msgmaxcommand to determine the currentmsgmaxvalue on your system. msgmnb-
Defines the maximum size in bytes of a single message queue. Use the
sysctl msgmnbcommand to determine the currentmsgmnbvalue on your system. msgmni-
Defines the maximum number of message queue identifiers, and therefore the maximum number of queues. Use the
sysctl msgmnicommand to determine the currentmsgmnivalue on your system. shmall-
Defines the total amount of shared memory
pagesthat can be used on the system at one time. For example, a page is4096bytes on the AMD64 and Intel 64 architecture. Use thesysctl shmallcommand to determine the currentshmallvalue on your system. shmmax-
Defines the maximum size in bytes of a single shared memory segment allowed by the kernel. Shared memory segments up to 1Gb are now supported in the kernel. Use the
sysctl shmmaxcommand to determine the currentshmmaxvalue on your system. shmmni-
Defines the system-wide maximum number of shared memory segments. The default value is
4096on all systems.
Additional resources
-
sysvipc(7)andsysctl(8)man pages
Chapter 36. Configuring huge pages
Physical memory is managed in fixed-size chunks called pages. On the x86_64 architecture, supported by Red Hat Enterprise Linux 8, the default size of a memory page is 4 KB. This default page size has proved to be suitable for general-purpose operating systems, such as Red Hat Enterprise Linux, which supports many different kinds of workloads.
However, specific applications can benefit from using larger page sizes in certain cases. For example, an application that works with a large and relatively fixed data set of hundreds of megabytes or even dozens of gigabytes can have performance issues when using 4 KB pages. Such data sets can require a huge amount of 4 KB pages, which can lead to overhead in the operating system and the CPU.
This section provides information about huge pages available in RHEL 8 and how you can configure them.
36.1. Available huge page features
With Red Hat Enterprise Linux 8, you can use huge pages for applications that work with big data sets, and improve the performance of such applications.
The following are the huge page methods, which are supported in RHEL 8:
HugeTLB pagesHugeTLB pages are also called static huge pages. There are two ways of reserving HugeTLB pages:
- At boot time: It increases the possibility of success because the memory has not yet been significantly fragmented. However, on NUMA machines, the number of pages is automatically split among the NUMA nodes.
For more information about parameters that influence HugeTLB page behavior at boot time, see Parameters for reserving HugeTLB pages at boot time and how to use these parameters to configure HugeTLB pages at boot time, see Configuring HugeTLB at boot time.
- At run time: It allows you to reserve the huge pages per NUMA node. If the run-time reservation is done as early as possible in the boot process, the probability of memory fragmentation is lower.
For more information about parameters that influence HugeTLB page behavior at run time, see Parameters for reserving HugeTLB pages at run time and how to use these parameters to configure HugeTLB pages at run time, see Configuring HugeTLB at run time.
Transparent HugePages (THP)With THP, the kernel automatically assigns huge pages to processes, and therefore there is no need to manually reserve the static huge pages. The following are the two modes of operation in THP:
-
system-wide: Here, the kernel tries to assign huge pages to a process whenever it is possible to allocate the huge pages and the process is using a large contiguous virtual memory area. per-process: Here, the kernel only assigns huge pages to the memory areas of individual processes which you can specify using themadvise() system call.NoteThe THP feature only supports
2 MBpages.
-
For more information about parameters that influence HugeTLB page behavior at boot time, see Enabling transparent hugepages and Disabling transparent hugepages.
36.2. Parameters for reserving HugeTLB pages at boot time
Use the following parameters to influence HugeTLB page behavior at boot time.
For more infomration on how to use these parameters to configure HugeTLB pages at boot time, see Configuring HugeTLB at boot time.
Table 36.1. Parameters used to configure HugeTLB pages at boot time
| Parameter | Description | Default value |
|---|---|---|
|
| Defines the number of persistent huge pages configured in the kernel at boot time. In a NUMA system, huge pages, that have this parameter defined, are divided equally between nodes.
You can assign huge pages to specific nodes at runtime by changing the value of the nodes in the |
The default value is
To update this value at boot, change the value of this parameter in the |
|
| Defines the size of persistent huge pages configured in the kernel at boot time. |
Valid values are |
|
| Defines the default size of persistent huge pages configured in the kernel at boot time. |
Valid values are |
36.3. Configuring HugeTLB at boot time
The page size, which the HugeTLB subsystem supports, depends on the architecture. The x86_64 architecture supports 2 MB huge pages and 1 GB gigantic pages.
This procedure describes how to reserve a 1 GB page at boot time.
Procedure
To create a HugeTLB pool for
1 GBpages, enable thedefault_hugepagesz=1Gandhugepagesz=1Gkernel options:# grubby --update-kernel=ALL --args="default_hugepagesz=1G hugepagesz=1G"
Create a new file called
hugetlb-gigantic-pages.servicein the/usr/lib/systemd/system/directory and add the following content:[Unit] Description=HugeTLB Gigantic Pages Reservation DefaultDependencies=no Before=dev-hugepages.mount ConditionPathExists=/sys/devices/system/node ConditionKernelCommandLine=hugepagesz=1G [Service] Type=oneshot RemainAfterExit=yes ExecStart=/usr/lib/systemd/hugetlb-reserve-pages.sh [Install] WantedBy=sysinit.target
Create a new file called
hugetlb-reserve-pages.shin the/usr/lib/systemd/directory and add the following content:While adding the following content, replace number_of_pages with the number of 1GB pages you want to reserve, and node with the name of the node on which to reserve these pages.
#!/bin/sh nodes_path=/sys/devices/system/node/ if [ ! -d $nodes_path ]; then echo "ERROR: $nodes_path does not exist" exit 1 fi reserve_pages() { echo $1 > $nodes_path/$2/hugepages/hugepages-1048576kB/nr_hugepages } reserve_pages number_of_pages nodeFor example, to reserve two
1 GBpages on node0 and one 1GB page on node1, replace the number_of_pages with 2 for node0 and 1 for node1:reserve_pages 2 node0 reserve_pages 1 node1
Create an executable script:
# chmod +x /usr/lib/systemd/hugetlb-reserve-pages.sh
Enable early boot reservation:
# systemctl enable hugetlb-gigantic-pages
-
You can try reserving more
1 GBpages at runtime by writing tonr_hugepagesat any time. However, to prevent failures due to memory fragmentation, reserve1 GBpages early during the boot process. - Reserving static huge pages can effectively reduce the amount of memory available to the system, and prevents it from properly utilizing its full memory capacity. Although a properly sized pool of reserved huge pages can be beneficial to applications that utilize it, an oversized or unused pool of reserved huge pages will eventually be detrimental to overall system performance. When setting a reserved huge page pool, ensure that the system can properly utilize its full memory capacity.
Additional resources
-
systemd.service(5)man page -
/usr/share/doc/kernel-doc-kernel_version/Documentation/vm/hugetlbpage.txtfile
36.4. Parameters for reserving HugeTLB pages at run time
Use the following parameters to influence HugeTLB page behavior at run time.
For more information about how to use these parameters to configure HugeTLB pages at run time, see Configuring HugeTLB at run time.
Table 36.2. Parameters used to configure HugeTLB pages at run time
| Parameter | Description | File name |
|---|---|---|
|
| Defines the number of huge pages of a specified size assigned to a specified NUMA node. |
|
|
| Defines the maximum number of additional huge pages that can be created and used by the system through overcommitting memory. Writing any non-zero value into this file indicates that the system obtains that number of huge pages from the kernel’s normal page pool if the persistent huge page pool is exhausted. As these surplus huge pages become unused, they are then freed and returned to the kernel’s normal page pool. |
|
36.5. Configuring HugeTLB at run time
This procedure describes how to add 20 2048 kB huge pages to node2.
To reserve pages based on your requirements, replace:
- 20 with the number of huge pages you wish to reserve,
- 2048kB with the size of the huge pages,
- node2 with the node on which you wish to reserve the pages.
Procedure
Display the memory statistics:
# numastat -cm | egrep 'Node|Huge' Node 0 Node 1 Node 2 Node 3 Total add AnonHugePages 0 2 0 8 10 HugePages_Total 0 0 0 0 0 HugePages_Free 0 0 0 0 0 HugePages_Surp 0 0 0 0 0Add the number of huge pages of a specified size to the node:
# echo 20 > /sys/devices/system/node/node2/hugepages/hugepages-2048kB/nr_hugepages
Verification steps
Ensure that the number of huge pages are added:
# numastat -cm | egrep 'Node|Huge' Node 0 Node 1 Node 2 Node 3 Total AnonHugePages 0 2 0 8 10 HugePages_Total 0 0 40 0 40 HugePages_Free 0 0 40 0 40 HugePages_Surp 0 0 0 0 0
Additional resources
-
numastat(8)man page
36.6. Enabling transparent hugepages
THP is enabled by default in Red Hat Enterprise Linux 8. However, you can enable or disable THP.
This procedure describes how to enable THP.
Procedure
Check the current status of THP:
# cat /sys/kernel/mm/transparent_hugepage/enabled
Enable THP:
# echo always > /sys/kernel/mm/transparent_hugepage/enabled
To prevent applications from allocating more memory resources than necessary, disable the system-wide transparent huge pages and only enable them for the applications that explicitly request it through the
madvise:# echo madvise > /sys/kernel/mm/transparent_hugepage/enabled
Sometimes, providing low latency to short-lived allocations has higher priority than immediately achieving the best performance with long-lived allocations. In such cases, you can disable direct compaction while leaving THP enabled.
Direct compaction is a synchronous memory compaction during the huge page allocation. Disabling direct compaction provides no guarantee of saving memory, but can decrease the risk of higher latencies during frequent page faults. Note that if the workload benefits significantly from THP, the performance decreases. Disable direct compaction:
# echo madvise > /sys/kernel/mm/transparent_hugepage/defrag
Additional resources
-
madvise(2)man page - Disabling transparent hugepages.
36.7. Disabling transparent hugepages
THP is enabled by default in Red Hat Enterprise Linux 8. However, you can enable or disable THP.
This procedure describes how to disable THP.
Procedure
Check the current status of THP:
# cat /sys/kernel/mm/transparent_hugepage/enabled
Disable THP:
# echo never > /sys/kernel/mm/transparent_hugepage/enabled
36.8. Impact of page size on translation lookaside buffer size
Reading address mappings from the page table is time-consuming and resource-expensive, so CPUs are built with a cache for recently-used addresses, called the Translation Lookaside Buffer (TLB). However, the default TLB can only cache a certain number of address mappings.
If a requested address mapping is not in the TLB, called a TLB miss, the system still needs to read the page table to determine the physical to virtual address mapping. Because of the relationship between application memory requirements and the size of pages used to cache address mappings, applications with large memory requirements are more likely to suffer performance degradation from TLB misses than applications with minimal memory requirements. It is therefore important to avoid TLB misses wherever possible.
Both HugeTLB and Transparent Huge Page features allow applications to use pages larger than 4 KB. This allows addresses stored in the TLB to reference more memory, which reduces TLB misses and improves application performance.
Chapter 37. Getting started with SystemTap
As a system administrator, you can use SystemTap to identify underlying causes of a bug or performance problem on a running Linux system.
As an application developer, you can use SystemTap to monitor in fine detail how your application behaves within the Linux system.
37.1. The purpose of SystemTap
SystemTap is a tracing and probing tool that you can use to study and monitor the activities of your operating system (particularly, the kernel) in fine detail. SystemTap provides information similar to the output of tools such as netstat, ps, top, and iostat. However, SystemTap provides more filtering and analysis options for collected information. In SystemTap scripts, you specify the information that SystemTap gathers.
SystemTap aims to supplement the existing suite of Linux monitoring tools by providing users with the infrastructure to track kernel activity and combining this capability with two attributes:
- Flexibility
- the SystemTap framework enables you to develop simple scripts for investigating and monitoring a wide variety of kernel functions, system calls, and other events that occur in kernel space. With this, SystemTap is not so much a tool as it is a system that allows you to develop your own kernel-specific forensic and monitoring tools.
- Ease-of-Use
- SystemTap enables you to monitor kernel activity without having to recompile the kernel or reboot the system.
37.2. Installing SystemTap
To begin using SystemTap, install the required packages. To use SystemTap on more than one kernel where a system has multiple kernels installed, install the corresponding required kernel packages for each kernel version.
Prerequisites
- You have enabled debug repositories as described in Enabling debug and source repositories.
Procedure
Install the required SystemTap packages:
# yum install systemtap
Install the required kernel packages:
Using
stap-prep:# stap-prep
If
stap-prepdoes not work, install the required kernel packages manually:# yum install kernel-debuginfo-$(uname -r) kernel-debuginfo-common-$(uname -i)-$(uname -r) kernel-devel-$(uname -r)
$(uname -i)is automatically replaced with the hardware platform of your system and$(uname -r)is automatically replaced with the version of your running kernel.
Verification steps
If the kernel to be probed with SystemTap is currently in use, test if your installation was successful:
# stap -v -e 'probe kernel.function("vfs_read") {printf("read performed\n"); exit()}'A successful SystemTap deployment results in an output similar to the following:
Pass 1: parsed user script and 45 library script(s) in 340usr/0sys/358real ms. Pass 2: analyzed script: 1 probe(s), 1 function(s), 0 embed(s), 0 global(s) in 290usr/260sys/568real ms. Pass 3: translated to C into "/tmp/stapiArgLX/stap_e5886fa50499994e6a87aacdc43cd392_399.c" in 490usr/430sys/938real ms. Pass 4: compiled C into "stap_e5886fa50499994e6a87aacdc43cd392_399.ko" in 3310usr/430sys/3714real ms. Pass 5: starting run. 1 read performed 2 Pass 5: run completed in 10usr/40sys/73real ms. 3
The last three lines of output (beginning with
Pass 5) indicate that:
37.3. Privileges to run SystemTap
Running SystemTap scripts requires elevated system privileges but, in some instances, non-privileged users might need to run SystemTap instrumentation on their machine.
To allow users to run SystemTap without root access, add users to both of these user groups:
stapdevMembers of this group can use
stapto run SystemTap scripts, orstaprunto run SystemTap instrumentation modules.Running
stapinvolves compiling SystemTap scripts into kernel modules and loading them into the kernel. This requires elevated privileges to the system, which are granted tostapdevmembers. Unfortunately, such privileges also grant effective root access tostapdevmembers. As such, only grantstapdevgroup membership to users who can be trusted with root access.stapusr-
Members of this group can only use
staprunto run SystemTap instrumentation modules. In addition, they can only run those modules from the/lib/modules/kernel_version/systemtap/directory. This directory must be owned only by the root user, and must only be writable by the root user.
37.4. Running SystemTap scripts
You can run SystemTap scripts from standard input or from a file.
Sample scripts that are distributed with the installation of SystemTap can be found in the /usr/share/systemtap/examples directory.
Prerequisites
- SystemTap and the associated required kernel packages are installed as described in Installing Systemtap.
To run SystemTap scripts as a normal user, add the user to the SystemTap groups:
# usermod --append --groups stapdev,stapusr user-name
Procedure
Run the SystemTap script:
From standard input:
# echo "probe timer.s(1) {exit()}" | stap -This command instructs
stapto run the script passed byechoto standard input. To addstapoptions, insert them before the-character. For example, to make the results from this command more verbose, the command is:# echo "probe timer.s(1) {exit()}" | stap -v -From a file:
# stap file_name
Chapter 38. Cross-instrumentation of SystemTap
Cross-instrumentation of SystemTap is creating SystemTap instrumentation modules from a SystemTap script on one system to be used on another system that does not have SystemTap fully deployed.
38.1. SystemTap cross-instrumentation
When you run a SystemTap script, a kernel module is built out of that script. SystemTap then loads the module into the kernel.
Normally, SystemTap scripts can run only on systems where SystemTap is deployed. To run SystemTap on ten systems, SystemTap needs to be deployed on all those systems. In some cases, this might be neither feasible nor desired. For example, corporate policy might prohibit you from installing packages that provide compilers or debug information about specific machines, which will prevent the deployment of SystemTap.
To work around this, use cross-instrumentation. Cross-instrumentation is the process of generating SystemTap instrumentation modules from a SystemTap script on one system to be used on another system. This process offers the following benefits:
The kernel information packages for various machines can be installed on a single host machine.
ImportantKernel packaging bugs may prevent the installation. In such cases, the
kernel-debuginfoandkernel-develpackages for the host system and target system must match. If a bug occurs, report the bug at https://bugzilla.redhat.com/.Each target machine needs only one package to be installed to use the generated SystemTap instrumentation module:
systemtap-runtime.ImportantThe host system must be the same architecture and running the same distribution of Linux as the target system in order for the built instrumentation module to work.
- instrumentation module
- The kernel module built from a SystemTap script; the SystemTap module is built on the host system, and will be loaded on the target kernel of the target system.
- host system
- The system on which the instrumentation modules (from SystemTap scripts) are compiled, to be loaded on target systems.
- target system
- The system in which the instrumentation module is being built (from SystemTap scripts).
- target kernel
- The kernel of the target system. This is the kernel that loads and runs the instrumentation module.
38.2. Initializing cross-instrumentation of SystemTap
Initialize cross-instrumentation of SystemTap to build SystemTap instrumentation modules from a SystemTap script on one system and use them on another system that does not have SystemTap fully deployed.
Prerequisites
- SystemTap is installed on the host system as described in Installing Systemtap.
The
systemtap-runtimepackage is installed on each target system:# yum install systemtap-runtime
- Both the host system and target system are the same architecture.
- Both the host system and target system are running the same major version of Red Hat Enterprise Linux (such as Red Hat Enterprise Linux 8), they can be running different minor versions (such as 8.1 and 8.2).
Kernel packaging bugs may prevent multiple kernel-debuginfo and kernel-devel packages from being installed on one system. In such cases, the minor version for the host system and target system must match. If a bug occurs, report it at https://bugzilla.redhat.com/.
Procedure
Determine the kernel running on each target system:
$ uname -r
Repeat this step for each target system.
- On the host system, install the target kernel and related packages for each target system by the method described in Installing Systemtap.
Build an instrumentation module on the host system, copy this module to and run this module on on the target system either:
Using remote implementation:
# stap --remote target_system script
This command remotely implements the specified script on the target system. You must ensure an SSH connection can be made to the target system from the host system for this to be successful.
Manually:
Build the instrumentation module on the host system:
# stap -r kernel_version script -m module_name -p 4
Here, kernel_version refers to the version of the target kernel determined in step 1, script refers to the script to be converted into an instrumentation module, and module_name is the desired name of the instrumentation module. The
-p4option tells SystemTap to not load and run the compiled module.Once the instrumentation module is compiled, copy it to the target system and load it using the following command:
# staprun module_name.ko
Chapter 39. Monitoring network activity with SystemTap
You can use helpful example SystemTap scripts available in the /usr/share/systemtap/testsuite/systemtap.examples/ directory, upon installing the systemtap-testsuite package, to monitor and investigate the network activity of your system.
39.1. Profiling network activity with SystemTap
You can use the nettop.stp example SystemTap script to profile network activity. The script tracks which processes are generating network traffic on the system, and provides the following information about each process:
- PID
- The ID of the listed process.
- UID
- User ID. A user ID of 0 refers to the root user.
- DEV
- Which ethernet device the process used to send or receive data (for example, eth0, eth1).
- XMIT_PK
- The number of packets transmitted by the process.
- RECV_PK
- The number of packets received by the process.
- XMIT_KB
- The amount of data sent by the process, in kilobytes.
- RECV_KB
- The amount of data received by the service, in kilobytes.
Prerequisites
- You have installed SystemTap as described in Installing SystemTap.
Procedure
Run the
nettop.stpscript:# stap --example nettop.stp
The
nettop.stpscript provides network profile sampling every 5 seconds.Output of the
nettop.stpscript looks similar to the following:[...] PID UID DEV XMIT_PK RECV_PK XMIT_KB RECV_KB COMMAND 0 0 eth0 0 5 0 0 swapper 11178 0 eth0 2 0 0 0 synergyc PID UID DEV XMIT_PK RECV_PK XMIT_KB RECV_KB COMMAND 2886 4 eth0 79 0 5 0 cups-polld 11362 0 eth0 0 61 0 5 firefox 0 0 eth0 3 32 0 3 swapper 2886 4 lo 4 4 0 0 cups-polld 11178 0 eth0 3 0 0 0 synergyc PID UID DEV XMIT_PK RECV_PK XMIT_KB RECV_KB COMMAND 0 0 eth0 0 6 0 0 swapper 2886 4 lo 2 2 0 0 cups-polld 11178 0 eth0 3 0 0 0 synergyc 3611 0 eth0 0 1 0 0 Xorg PID UID DEV XMIT_PK RECV_PK XMIT_KB RECV_KB COMMAND 0 0 eth0 3 42 0 2 swapper 11178 0 eth0 43 1 3 0 synergyc 11362 0 eth0 0 7 0 0 firefox 3897 0 eth0 0 1 0 0 multiload-apple
39.2. Tracing functions called in network socket code with SystemTap
You can use the socket-trace.stp example SystemTap script to trace functions called from the kernel’s net/socket.c file. This helps you identify, in finer detail, how each process interacts with the network at the kernel level.
Prerequisites
- You have installed SystemTap as described in Installing SystemTap.
Procedure
Run the
socket-trace.stpscript:# stap --example socket-trace.stp
A 3-second excerpt of the output of the
socket-trace.stpscript looks similar to the following:[...] 0 Xorg(3611): -> sock_poll 3 Xorg(3611): <- sock_poll 0 Xorg(3611): -> sock_poll 3 Xorg(3611): <- sock_poll 0 gnome-terminal(11106): -> sock_poll 5 gnome-terminal(11106): <- sock_poll 0 scim-bridge(3883): -> sock_poll 3 scim-bridge(3883): <- sock_poll 0 scim-bridge(3883): -> sys_socketcall 4 scim-bridge(3883): -> sys_recv 8 scim-bridge(3883): -> sys_recvfrom 12 scim-bridge(3883):-> sock_from_file 16 scim-bridge(3883):<- sock_from_file 20 scim-bridge(3883):-> sock_recvmsg 24 scim-bridge(3883):<- sock_recvmsg 28 scim-bridge(3883): <- sys_recvfrom 31 scim-bridge(3883): <- sys_recv 35 scim-bridge(3883): <- sys_socketcall [...]
39.3. Monitoring network packet drops with SystemTap
The network stack in Linux can discard packets for various reasons. Some Linux kernels include a tracepoint, kernel.trace("kfree_skb")`, which tracks where packets are discarded.
The dropwatch.stp SystemTap script uses kernel.trace("kfree_skb") to trace packet discards; the script summarizes what locations discard packets in every 5-second interval.
Prerequisites
- You have installed SystemTap as described in Installing SystemTap.
Procedure
Run the
dropwatch.stpscript:# stap --example dropwatch.stp
Running the
dropwatch.stpscript for 15 seconds results in output similar to the following:Monitoring for dropped packets 51 packets dropped at location 0xffffffff8024cd0f 2 packets dropped at location 0xffffffff8044b472 51 packets dropped at location 0xffffffff8024cd0f 1 packets dropped at location 0xffffffff8044b472 97 packets dropped at location 0xffffffff8024cd0f 1 packets dropped at location 0xffffffff8044b472 Stopping dropped packet monitor
NoteTo make the location of packet drops more meaningful, see the
/boot/System.map-$(uname -r)file. This file lists the starting addresses for each function, enabling you to map the addresses in the output of thedropwatch.stpscript to a specific function name. Given the following snippet of the/boot/System.map-$(uname -r)file, the address0xffffffff8024cd0fmaps to the functionunix_stream_recvmsgand the address0xffffffff8044b472maps to the functionarp_rcv:[...] ffffffff8024c5cd T unlock_new_inode ffffffff8024c5da t unix_stream_sendmsg ffffffff8024c920 t unix_stream_recvmsg ffffffff8024cea1 t udp_v4_lookup_longway [...] ffffffff8044addc t arp_process ffffffff8044b360 t arp_rcv ffffffff8044b487 t parp_redo ffffffff8044b48c t arp_solicit [...]
Chapter 40. Profiling kernel activity with SystemTap
You can profile the kernel activity by monitoring function calls with the following scripts.
40.1. Counting function calls with SystemTap
You can use the functioncallcount.stp SystemTap script to count specific kernel function calls. You can also use this script to target multiple kernel functions.
Prerequisites
- You have installed SystemTap as described in Installing Systemtap.
Procedure
Run the functioncallcount.stp script:
# stap --example functioncallcount.stp 'argument'This script takes the targeted kernel function as an argument. You can use the argument wildcards to target multiple kernel functions up to a certain extent.
The output of the script, in alphabetical order, contains the names of the functions called and how many times it was called during the sample time.
Consider the following example:
# stap -w -v --example functioncallcount.stp "*@mm*.c" -c /bin/true
where:
- -w : Suppresses warnings.
- -v : Makes the output of starting kernel visible.
-c command : Tells SystemTap to count function calls during the execution of a command, in this example being
/bin/true.The output should look similar to the following:
[...] __vma_link 97 __vma_link_file 66 __vma_link_list 97 __vma_link_rb 97 __xchg 103 add_page_to_active_list 102 add_page_to_inactive_list 19 add_to_page_cache 19 add_to_page_cache_lru 7 all_vm_events 6 alloc_pages_node 4630 alloc_slabmgmt 67 anon_vma_alloc 62 anon_vma_free 62 anon_vma_lock 66 anon_vma_prepare 98 anon_vma_unlink 97 anon_vma_unlock 66 arch_get_unmapped_area_topdown 94 arch_get_unmapped_exec_area 3 arch_unmap_area_topdown 97 atomic_add 2 atomic_add_negative 97 atomic_dec_and_test 5153 atomic_inc 470 atomic_inc_and_test 1 [...]
40.2. Tracing function calls with SystemTap
You can use the para-callgraph.stp SystemTap script to trace function calls and function returns.
Prerequisites
- You have installed SystemTap as described in Installing Systemtap.
Procedure
- Run the para-callgraph.stp script.
# stap --example para-callgraph.stp 'argument1' 'argument2'
The script para-callgraph.stp takes two command-line arguments:
- The name of the function(s) whose entry/exit you’d like to trace.
- An optional trigger function, which enables or disables tracing on a per-thread basis. Tracing in each thread will continue as long as the trigger function has not exited yet.
Consider the following example:
# stap -wv --example para-callgraph.stp 'kernel.function("*@fs/proc.c*")' 'kernel.function("vfs_read")' -c "cat /proc/sys/vm/* || true"where:
- -w : Suppresses warnings.
- -v : Makes the output of starting kernel visible.
-
-c command : Tells SystemTap to count function calls during the execution of a command, in this example being
/bin/true.
The output should look similar to the following:
[...]
267 gnome-terminal(2921): <-do_sync_read return=0xfffffffffffffff5
269 gnome-terminal(2921):<-vfs_read return=0xfffffffffffffff5
0 gnome-terminal(2921):->fput file=0xffff880111eebbc0
2 gnome-terminal(2921):<-fput
0 gnome-terminal(2921):->fget_light fd=0x3 fput_needed=0xffff88010544df54
3 gnome-terminal(2921):<-fget_light return=0xffff8801116ce980
0 gnome-terminal(2921):->vfs_read file=0xffff8801116ce980 buf=0xc86504 count=0x1000 pos=0xffff88010544df48
4 gnome-terminal(2921): ->rw_verify_area read_write=0x0 file=0xffff8801116ce980 ppos=0xffff88010544df48 count=0x1000
7 gnome-terminal(2921): <-rw_verify_area return=0x1000
12 gnome-terminal(2921): ->do_sync_read filp=0xffff8801116ce980 buf=0xc86504 len=0x1000 ppos=0xffff88010544df48
15 gnome-terminal(2921): <-do_sync_read return=0xfffffffffffffff5
18 gnome-terminal(2921):<-vfs_read return=0xfffffffffffffff5
0 gnome-terminal(2921):->fput file=0xffff8801116ce98040.3. Determining time spent in kernel and user space with SystemTap
You can use the thread-times.stp SystemTap script to determine the amount of time any given thread is spending in either the kernel or user-space.
Prerequisites
- You have installed SystemTap as described in Installing Systemtap.
Procedure
Run the thread-times.stp script:
# stap --example thread-times.stp
This script will display the top 20 processes taking up CPU time during a 5-second period, along with the total number of CPU ticks made during the sample. The output of this script also notes the percentage of CPU time each process used, as well as whether that time was spent in kernel space or user space.
tid %user %kernel (of 20002 ticks) 0 0.00% 87.88% 32169 5.24% 0.03% 9815 3.33% 0.36% 9859 0.95% 0.00% 3611 0.56% 0.12% 9861 0.62% 0.01% 11106 0.37% 0.02% 32167 0.08% 0.08% 3897 0.01% 0.08% 3800 0.03% 0.00% 2886 0.02% 0.00% 3243 0.00% 0.01% 3862 0.01% 0.00% 3782 0.00% 0.00% 21767 0.00% 0.00% 2522 0.00% 0.00% 3883 0.00% 0.00% 3775 0.00% 0.00% 3943 0.00% 0.00% 3873 0.00% 0.00%
40.4. Monitoring polling applications with SystemTap
You can use timeout.stp SystemTap script to identify and monitor which applications are polling. Doing so allows you to track unnecessary or excessive polling, which helps you pinpoint areas for improvement in terms of CPU usage and power savings.
Prerequisites
- You have installed SystemTap as described in Installing Systemtap.
Procedure
Run the timeout.stp script:
# stap --example timeout.stp
This script will track how many times each application uses the following system calls over time:
-
poll -
select -
epoll -
itimer -
futex -
nanosleep -
signal
In this example output you can see which process used which system call and how many times.
uid | poll select epoll itimer futex nanosle signal| process 28937 | 148793 0 0 4727 37288 0 0| firefox 22945 | 0 56949 0 1 0 0 0| scim-bridge 0 | 0 0 0 36414 0 0 0| swapper 4275 | 23140 0 0 1 0 0 0| mixer_applet2 4191 | 0 14405 0 0 0 0 0| scim-launcher 22941 | 7908 1 0 62 0 0 0| gnome-terminal 4261 | 0 0 0 2 0 7622 0| escd 3695 | 0 0 0 0 0 7622 0| gdm-binary 3483 | 0 7206 0 0 0 0 0| dhcdbd 4189 | 6916 0 0 2 0 0 0| scim-panel-gtk 1863 | 5767 0 0 0 0 0 0| iscsid
40.5. Tracking most frequently used system calls with SystemTap
You can use the topsys.stp SystemTap script to list the top 20 system calls used by the system per 5-second interval. It also lists how many times each system call was used during that period.
Prerequisites
- You have installed SystemTap as described in Installing Systemtap.
Procedure
Run the topsys.stp script:
# stap --example topsys.stp
Consider the following example:
# stap -v --example topsys.stp
where -v makes the output of starting kernel visible.
The output should look similar to the following:
--------------------------------------------------------------
SYSCALL COUNT
gettimeofday 1857
read 1821
ioctl 1568
poll 1033
close 638
open 503
select 455
write 391
writev 335
futex 303
recvmsg 251
socket 137
clock_gettime 124
rt_sigprocmask 121
sendto 120
setitimer 106
stat 90
time 81
sigreturn 72
fstat 66
--------------------------------------------------------------40.6. Tracking system call volume per process with SystemTap
You can use the syscalls_by_proc.stp SystemTap script to see which processes are performing the highest volume of system calls. It displays 20 processes performing the most of system calls.
Prerequisites
- You have installed SystemTap as described in Installing Systemtap.
Procedure
Run the syscalls_by_proc.stp script:
# stap --example syscalls_by_proc.stp
Output of the syscalls_by_proc.stp script looks similar to the following:
Collecting data... Type Ctrl-C to exit and display results #SysCalls Process Name 1577 multiload-apple 692 synergyc 408 pcscd 376 mixer_applet2 299 gnome-terminal 293 Xorg 206 scim-panel-gtk 95 gnome-power-man 90 artsd 85 dhcdbd 84 scim-bridge 78 gnome-screensav 66 scim-launcher [...]
Chapter 41. Monitoring disk and I/O activity with SystemTap
You can monitor disk and I/O activity with the following scripts.
41.1. Summarizing disk read/write traffic with SystemTap
You can use the disktop.stp SystemTap script to identify which processes are performing the heaviest disk reads and writes to the system.
Prerequisites
- You have installed SystemTap as described in Installing Systemtap.
Procedure
Run the disktop.stp script:
# stap --example disktop.stp
The script displays the top ten processes responsible for the heaviest reads or writes to a disk.
The output includes the following data per listed process:
- UID
-
User ID. A user ID of
0refers to the root user. - PID
- The ID of the listed process.
- PPID
- The process ID of the listed process’s parent process.
- CMD
- The name of the listed process.
- DEVICE
- Which storage device the listed process is reading from or writing to.
- T
-
The type of action performed by the listed process, where
Wrefers to write, andRrefers to read. - BYTES
- The amount of data read to or written from disk.
Output of the disktop.stp script looks similar to the following:
[...] Mon Sep 29 03:38:28 2008 , Average: 19Kb/sec, Read: 7Kb, Write: 89Kb UID PID PPID CMD DEVICE T BYTES 0 26319 26294 firefox sda5 W 90229 0 2758 2757 pam_timestamp_c sda5 R 8064 0 2885 1 cupsd sda5 W 1678 Mon Sep 29 03:38:38 2008 , Average: 1Kb/sec, Read: 7Kb, Write: 1Kb UID PID PPID CMD DEVICE T BYTES 0 2758 2757 pam_timestamp_c sda5 R 8064 0 2885 1 cupsd sda5 W 1678
41.2. Tracking I/O time for each file read or write with SystemTap
You can use the iotime.stp SystemTap script to monitor the amount of time it takes for each process to read from or write to any file. This helps you to determine what files are slow to load on a system.
Prerequisites
- You have installed SystemTap as described in Installing Systemtap.
Procedure
Run the iotime.stp script:
# stap --example iotime.stp
The script tracks each time a system call opens, closes, reads from, and writes to a file. For each file any system call accesses, It counts the number of microseconds it takes for any reads or writes to finish and tracks the amount of data , in bytes, read from or written to the file.
The output contains:
- A timestamp, in microseconds
- Process ID and process name
-
An
accessoriotimeflag The file accessed
If a process was able to read or write any data, a pair of access and
iotimelines should appear together. The access line refers to the time that a given process started accessing a file. The end of the access line will show the amount of data read or written. Theiotimeline will show the amount of time, in microseconds, that the process took in order to perform the read or write.
Output of the iotime.stp script looks similar to the following:
[...] 825946 3364 (NetworkManager) access /sys/class/net/eth0/carrier read: 8190 write: 0 825955 3364 (NetworkManager) iotime /sys/class/net/eth0/carrier time: 9 [...] 117061 2460 (pcscd) access /dev/bus/usb/003/001 read: 43 write: 0 117065 2460 (pcscd) iotime /dev/bus/usb/003/001 time: 7 [...] 3973737 2886 (sendmail) access /proc/loadavg read: 4096 write: 0 3973744 2886 (sendmail) iotime /proc/loadavg time: 11 [...]
41.3. Tracking cumulative I/O with SystemTap
You can use the traceio.stp SystemTap script to track the cumulative amount of I/O to the system.
Prerequisites
- You have installed SystemTap as described in Installing Systemtap.
Procedure
Run the traceio.stp script:
# stap --example traceio.stp
The script prints the top ten executables generating I/O traffic over time. It also tracks the cumulative amount of I/O reads and writes done by those executables. This information is tracked and printed out in 1-second intervals, and in descending order.
Output of the
traceio.stpscript looks similar to the following:
[...]
Xorg r: 583401 KiB w: 0 KiB
floaters r: 96 KiB w: 7130 KiB
multiload-apple r: 538 KiB w: 537 KiB
sshd r: 71 KiB w: 72 KiB
pam_timestamp_c r: 138 KiB w: 0 KiB
staprun r: 51 KiB w: 51 KiB
snmpd r: 46 KiB w: 0 KiB
pcscd r: 28 KiB w: 0 KiB
irqbalance r: 27 KiB w: 4 KiB
cupsd r: 4 KiB w: 18 KiB
Xorg r: 588140 KiB w: 0 KiB
floaters r: 97 KiB w: 7143 KiB
multiload-apple r: 543 KiB w: 542 KiB
sshd r: 72 KiB w: 72 KiB
pam_timestamp_c r: 138 KiB w: 0 KiB
staprun r: 51 KiB w: 51 KiB
snmpd r: 46 KiB w: 0 KiB
pcscd r: 28 KiB w: 0 KiB
irqbalance r: 27 KiB w: 4 KiB
cupsd r: 4 KiB w: 18 KiB41.4. Monitoring I/O activity on a specific device with SystemTap
You can use the traceio2.stp SystemTap script to monitor I/O activity on a specific device.
Prerequisites
- You have installed SystemTap as described in Installing Systemtap.
Procedure
- Run the traceio2.stp script.
# stap --example traceio2.stp 'argument'This script takes the whole device number as an argument. To find this number you can use:
# stat -c "0x%D" directoryWhere directory is located on the device you want to monitor.
The output contains following:
- The name and ID of any process performing a read or write
-
The function it is performing (
vfs_readorvfs_write) - The kernel device number
Consider following output of # stap traceio2.stp 0x805
[...] synergyc(3722) vfs_read 0x800005 synergyc(3722) vfs_read 0x800005 cupsd(2889) vfs_write 0x800005 cupsd(2889) vfs_write 0x800005 cupsd(2889) vfs_write 0x800005 [...]
41.5. Monitoring reads and writes to a file with SystemTap
You can use the inodewatch.stp SystemTap script to monitor reads from and writes to a file in real time.
Prerequisites
- You have installed SystemTap as described in Installing Systemtap.
Procedure
-
Run the
inodewatch.stpscript.
# stap --example inodewatch.stp 'argument1' 'argument2' 'argument3'
The script inodewatch.stp takes three command-line arguments:
- The file’s major device number.
- The file’s minor device number.
- The file’s inode number.
You can get these numbers using:
# stat -c '%D %i' filenameWhere filename is an absolute path.
Consider following example:
# stat -c '%D %i' /etc/crontab
The output should look like:
805 1078319
where:
-
805is the base-16 (hexadecimal) device number. The last two digits are the minor device number, and the remaining digits are the major number. -
1078319is the inode number.
To start monitoring /etc/crontab, run:
# stap inodewatch.stp 0x8 0x05 1078319
In the first two arguments you must use 0x prefixes for base-16 numbers.
The output contains following:
- The name and ID of any process performing a read or write
-
The function it is performing (
vfs_readorvfs_write) - The kernel device number
The output of this example should look like:
cat(16437) vfs_read 0x800005/1078319 cat(16437) vfs_read 0x800005/1078319
Chapter 42. Analyzing system performance with BPF Compiler Collection
As a system administrator, you can use the BPF Compiler Collection (BCC) library to create tools for analyzing the performance of your Linux operating system and gathering information, which could be difficult to obtain through other interfaces.
42.1. Installing the bcc-tools package
Install the bcc-tools package, which also installs the BPF Compiler Collection (BCC) library as a dependency.
Procedure
Install
bcc-tools.#yum install bcc-toolsThe BCC tools are installed in the
/usr/share/bcc/tools/directory.Optionally, inspect the tools:
#ll /usr/share/bcc/tools/... -rwxr-xr-x. 1 root root 4198 Dec 14 17:53 dcsnoop -rwxr-xr-x. 1 root root 3931 Dec 14 17:53 dcstat -rwxr-xr-x. 1 root root 20040 Dec 14 17:53 deadlock_detector -rw-r--r--. 1 root root 7105 Dec 14 17:53 deadlock_detector.c drwxr-xr-x. 3 root root 8192 Mar 11 10:28 doc -rwxr-xr-x. 1 root root 7588 Dec 14 17:53 execsnoop -rwxr-xr-x. 1 root root 6373 Dec 14 17:53 ext4dist -rwxr-xr-x. 1 root root 10401 Dec 14 17:53 ext4slower ...The
docdirectory in the listing above contains documentation for each tool.
42.2. Using selected bcc-tools for performance analyses
Use certain pre-created programs from the BPF Compiler Collection (BCC) library to efficiently and securely analyze the system performance on the per-event basis. The set of pre-created programs in the BCC library can serve as examples for creation of additional programs.
Prerequisites
- Installed bcc-tools package
- Root permissions
Using execsnoop to examine the system processes
Run the
execsnoopprogram in one terminal:# /usr/share/bcc/tools/execsnoopIn another terminal run, for example:
$ ls /usr/share/bcc/tools/doc/The above creates a short-lived process of the
lscommand.The terminal running
execsnoopshows the output similar to the following:PCOMM PID PPID RET ARGS ls 8382 8287 0 /usr/bin/ls --color=auto /usr/share/bcc/tools/doc/ ...
The
execsnoopprogram prints a line of output for each new process, which consumes system resources. It even detects processes of programs that run very shortly, such asls, and most monitoring tools would not register them.The
execsnoopoutput displays the following fields:- PCOMM
-
The parent process name. (
ls) - PID
-
The process ID. (
8382) - PPID
-
The parent process ID. (
8287) - RET
-
The return value of the
exec()system call (0), which loads program code into new processes. - ARGS
- The location of the started program with arguments.
To see more details, examples, and options for execsnoop, refer to the /usr/share/bcc/tools/doc/execsnoop_example.txt file.
For more information about exec(), see exec(3) manual pages.
Using opensnoop to track what files a command opens
Run the
opensnoopprogram in one terminal:# /usr/share/bcc/tools/opensnoop -n unameThe above prints output for files, which are opened only by the process of the
unamecommand.In another terminal, enter:
$ unameThe command above opens certain files, which are captured in the next step.
The terminal running
opensnoopshows the output similar to the following:PID COMM FD ERR PATH 8596 uname 3 0 /etc/ld.so.cache 8596 uname 3 0 /lib64/libc.so.6 8596 uname 3 0 /usr/lib/locale/locale-archive ...
The
opensnoopprogram watches theopen()system call across the whole system, and prints a line of output for each file thatunametried to open along the way.The
opensnoopoutput displays the following fields:- PID
-
The process ID. (
8596) - COMM
-
The process name. (
uname) - FD
-
The file descriptor - a value that
open()returns to refer to the open file. (3) - ERR
- Any errors.
- PATH
-
The location of files that
open()tried to open.
If a command tries to read a non-existent file, then the
FDcolumn returns-1and theERRcolumn prints a value corresponding to the relevant error. As a result,opensnoopcan help you identify an application that does not behave properly.
To see more details, examples, and options for opensnoop, refer to the /usr/share/bcc/tools/doc/opensnoop_example.txt file.
For more information about open(), see open(2) manual pages.
Using biotop to examine the I/O operations on the disk
Run the
biotopprogram in one terminal:# /usr/share/bcc/tools/biotop 30The command enables you to monitor the top processes, which perform I/O operations on the disk. The argument ensures that the command will produce a 30 second summary.
NoteWhen no argument provided, the output screen by default refreshes every 1 second.
In another terminal enter, for example :
# dd if=/dev/vda of=/dev/zeroThe command above reads the content from the local hard disk device and writes the output to the
/dev/zerofile. This step generates certain I/O traffic to illustratebiotop.The terminal running
biotopshows the output similar to the following:PID COMM D MAJ MIN DISK I/O Kbytes AVGms 9568 dd R 252 0 vda 16294 14440636.0 3.69 48 kswapd0 W 252 0 vda 1763 120696.0 1.65 7571 gnome-shell R 252 0 vda 834 83612.0 0.33 1891 gnome-shell R 252 0 vda 1379 19792.0 0.15 7515 Xorg R 252 0 vda 280 9940.0 0.28 7579 llvmpipe-1 R 252 0 vda 228 6928.0 0.19 9515 gnome-control-c R 252 0 vda 62 6444.0 0.43 8112 gnome-terminal- R 252 0 vda 67 2572.0 1.54 7807 gnome-software R 252 0 vda 31 2336.0 0.73 9578 awk R 252 0 vda 17 2228.0 0.66 7578 llvmpipe-0 R 252 0 vda 156 2204.0 0.07 9581 pgrep R 252 0 vda 58 1748.0 0.42 7531 InputThread R 252 0 vda 30 1200.0 0.48 7504 gdbus R 252 0 vda 3 1164.0 0.30 1983 llvmpipe-1 R 252 0 vda 39 724.0 0.08 1982 llvmpipe-0 R 252 0 vda 36 652.0 0.06 ...
The
biotopoutput displays the following fields:- PID
-
The process ID. (
9568) - COMM
-
The process name. (
dd) - DISK
-
The disk performing the read operations. (
vda) - I/O
- The number of read operations performed. (16294)
- Kbytes
- The amount of Kbytes reached by the read operations. (14,440,636)
- AVGms
- The average I/O time of read operations. (3.69)
To see more details, examples, and options for biotop, refer to the /usr/share/bcc/tools/doc/biotop_example.txt file.
For more information about dd, see dd(1) manual pages.
Using xfsslower to expose unexpectedly slow file system operations
Run the
xfsslowerprogram in one terminal:# /usr/share/bcc/tools/xfsslower 1The command above measures the time the XFS file system spends in performing read, write, open or sync (
fsync) operations. The1argument ensures that the program shows only the operations that are slower than 1 ms.NoteWhen no arguments provided,
xfsslowerby default displays operations slower than 10 ms.In another terminal enter, for example, the following:
$ vim textThe command above creates a text file in the
vimeditor to initiate certain interaction with the XFS file system.The terminal running
xfsslowershows something similar upon saving the file from the previous step:TIME COMM PID T BYTES OFF_KB LAT(ms) FILENAME 13:07:14 b'bash' 4754 R 256 0 7.11 b'vim' 13:07:14 b'vim' 4754 R 832 0 4.03 b'libgpm.so.2.1.0' 13:07:14 b'vim' 4754 R 32 20 1.04 b'libgpm.so.2.1.0' 13:07:14 b'vim' 4754 R 1982 0 2.30 b'vimrc' 13:07:14 b'vim' 4754 R 1393 0 2.52 b'getscriptPlugin.vim' 13:07:45 b'vim' 4754 S 0 0 6.71 b'text' 13:07:45 b'pool' 2588 R 16 0 5.58 b'text' ...
Each line above represents an operation in the file system, which took more time than a certain threshold.
xfssloweris good at exposing possible file system problems, which can take form of unexpectedly slow operations.The
xfssloweroutput displays the following fields:- COMM
-
The process name. (
b’bash') - T
The operation type. (
R)- Read
- Write
- Sync
- OFF_KB
- The file offset in KB. (0)
- FILENAME
- The file being read, written, or synced.
To see more details, examples, and options for xfsslower, refer to the /usr/share/bcc/tools/doc/xfsslower_example.txt file.
For more information about fsync, see fsync(2) manual pages.