
PrometheusDuplicateTimestamps generated by kube-state-metrics in RHOCP 4
Issue
-
Alert PrometheusDuplicateTimestamps for kube-state-metrics is firing continuously in
Observe > Alertingwindow of RHOCP web console: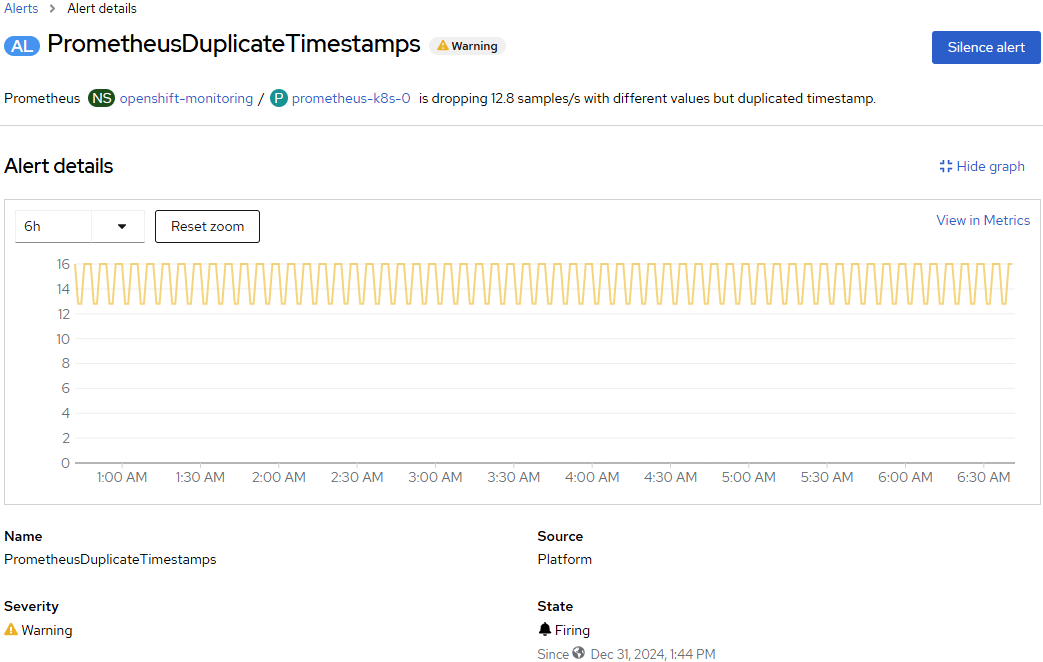
-
Prometheus-k8spods running inopenshift-monitoringproject streams below logs:$ oc logs -c prometheus prometheus-k8s-0 | grep "kube-state-metrics" 2025-01-21T07:29:54.440941285Z ts=2025-01-21T07:29:54.440Z caller=scrape.go:1744 level=warn component="scrape manager" scrape_pool=serviceMonitor/openshift-monitoring/kube-state-metrics/0 target=https://<pod-IP>:8443/metrics msg="Error on ingesting samples with different value but same timestamp" num_dropped=1
Environment
- Red Hat OpenShift Container Platform (RHOCP)
- 4
- Vertical Pod Autoscaler Operator
Subscriber exclusive content
A Red Hat subscription provides unlimited access to our knowledgebase, tools, and much more.