
Red Hat Training
A Red Hat training course is available for Red Hat JBoss Operations Network
2. Monitoring Resources: An Introduction
Metric data is the information JBoss ON collects from individual platforms, servers, and services. The data JBoss ON collects depend on what type of server or service is being monitored. For example, Linux platforms can be monitored for free memory, system load, used memory, and used swap space, among other metrics.
2.1. About Metrics
JBoss ON supports three different kinds of metrics:
- Numeric metrics. Numerical values such as milliseconds passed, kilobytes transferred or rows in a database table
- Traits. Descriptive information about a resource.
- Response times. The time it takes for a resource to respond to a request.
Note
Supported resources are defined in JBoss ON through agent plug-ins. This means that it is possible to write custom plug-ins to add resource types and to determine which metrics should be collected and how the agent should process the collected data.
When defining metrics in the plug-in descriptor values that form part of a larger data structure, such as an array of values, need to be deconstructed into individual values before they can be monitored.
Metrics are collected from the managed resources at regular intervals, with the interval defined in the resource type's plug-in descriptor. The intervals can be changed for all metrics of that type or for a single resource.
2.2. About Baseline Metrics
After metrics have been collected for a reliable amount of time, JBoss ON automatically calculates a baseline for the metric, which represents the norm for that metric on that resource. Once every hour, a job is run that compresses these metric values into one hour aggregates. These aggregates contain the minimum, maximum, and average value of the measured data.
When there is sufficient data in the system, baselines are computed for metrics that are not increasing or decreasing.
The expected mean and high and low range values can be charted as part of viewing the monitoring history for a resource.
Baseline metrics compare changes in actual data against a baseline value. Baselines allow effective trending analysis, SLAs management, and overall application health assessments as a form of fault management.
Alerts (Section 6, “Configuring and Managing Alerts: Procedures”) can be defined that refer to baselines or expected values.
Along with baselines, JBoss ON automatically tracks metric values collected that fall outside (out-of-bounds) of the high and low ranges and baselines. Out-of-bounds metrics are reported as problem metrics.
Note
If there are no baselines present, because they have not yet been computed or because the metric is a trends-up or trends-down metric, no out-of-bounds factors will be calculated.
Note
When an alert is triggered in response to a metric value, the alerting event is tracked as a problem metric.
A baseline has a bandwidth that is the difference between its minimum and maximum values. The out-of-bounds job checks for the aggregate if the low or high value lies outside the band and is computing the difference.
To be able to compare out-of-bound values, an out-of-bounds-factor is computed by dividing the difference by the bandwidth.
Note
Calculating baselines can sometimes output non-intuitive results, as a band of (1,2) and an outlier value of 3 seems to be less than a band of (100, 200 MB) and an outlier value of 250 MB. The former is actually 100% outside the expected band, while the latter is only 50% outside.
Figure 1, “Out-of-Bound Factors” shows a simplified baseline and out-of-bounds chart.
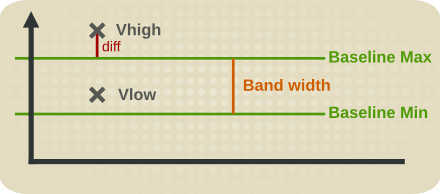
Figure 1. Out-of-Bound Factors
Out-of-bounds-factors are recalculated each hour during a calculation job. The job assesses the aggregate and determines if there is a more severe outlier than before. The chart always displays the most sever outlier.
When the baselines for a metric change, all recorded out-of-bounds values become invalid and are removed because the out-of-bounds measurement was computed against an old baseline.
Out-of-bound factors are also cleaned out for a metric if the chart page of a metric is edited when the baseline settings are changed. The out-of-bounds factors are recalculated on the next hourly run of the computation job.
2.3. Storing Metric Data
Metric data is stored in the JBoss ON backend database. Numerical data is compressed and purged at regular intervals.
Detailed data is compressed into tables for 1, 6 and 24 hour values. For each interval the minimum, maximum and average values are kept. Data are stored for up to one year by default, but alternative time frames can be defined.