
Red Hat Training
A Red Hat training course is available for Red Hat Fuse
Chapter 5. Viewing and managing Fuse applications from the Fuse Console
You can view and manage Fuse applications as described in the following sections:
- Section 5.1, “Viewing containers and applications (Fuse on OpenShift)”
- Section 5.2, “Connecting to remote Fuse integrations (standalone distributions)”
- Section 5.3, “Viewing and managing Apache Camel applications”
- Section 5.4, “Viewing and managing JMX domains and MBeans”
- Section 5.5, “Viewing and managing your OSGI environment (Karaf standalone)”
- Section 5.6, “Viewing and monitoring thread state”
- Section 5.7, “Viewing log entries”
5.1. Viewing containers and applications (Fuse on OpenShift)
When you login to the Fuse Console for OpenShift, the Fuse Console home page shows the available containers.
To manage (create, edit, or delete) containers, use the OpenShift console.
To view Fuse applications on the OpenShift cluster, click the Online tab.
5.2. Connecting to remote Fuse integrations (standalone distributions)
The Fuse Console uses Jolokia, an agent-based approach to Java Management Extensions (JMX) that requires extra software (an agent) installed on the client. By default, Red Hat Fuse includes a jolokia agent.
With standalone Fuse Console distributions, you can connect to remote integrations that already have a jolokia agent (https://jolokia.org/) running inside them. If the process that you want to connect to does not have a jolokia agent inside, refer to the jolokia documentation (http://jolokia.org/agent.html).
5.2.1. Unlocking the Fuse Console
By default, Jolokia for Fuse 7 standalone (on Apache Karaf and JBoss EAP) is locked and the Fuse Console is not accessible remotely.
To unlock the Fuse Console for a hostname or IP address other than locahost or 127.0.0.1, follow these steps:
Open the
jolokia-access.xmlfile in an editor.On Karaf, the XML file is located in the
$KARAF_HOME/etcfolder.On JBoss EAP, it is located in the
$EAP_HOME/standalone/configurationfolder.Register the hostnames or IP addresses for the Fuse integrations that you want to access with the Fuse console by adding them to the <cors> section.
For example, to access hostname 0.0.0.3 from the Fuse Console, add the
*<allow-origin>http://0.0.0.3:*</allow-origin>*
line as shown:
<!-- Cross-Origin Resource Sharing (CORS) restrictions By default, only CORS access within localhost is allowed for maximum security. You can add trusted hostnames in the <cors> section to unlock CORS access from them. --> <cors> <!-- Allow cross origin access only within localhost --> <allow-origin>http*://localhost:*</allow-origin> <allow-origin>http*://127.0.0.1:*</allow-origin> <allow-origin>http://0.0.0.3:*</allow-origin> <!-- Whitelist the hostname patterns as <allow-origin> --> <!-- <allow-origin>http*://*.example.com</allow-origin> <allow-origin>http*://*.example.com:*</allow-origin> --> <!-- Check for the proper origin on the server side to protect against CSRF --> <strict-checking /> </cors>- Save the file.
5.2.2. Restricting remote access
Optionally, you can restrict remote access to the Fuse Console for specific hosts and IP addresses.
You can grant overall access based on the IP address of an HTTP client. To specify these restrictions:
In the jolokia-access.xml file, add or edit a <remote> section that contains one or more <host> elements. For the <host> element, you can specify an IP address, a host name, or a netmask given in CIDR format (for example, 10.0.0.0/16 for all clients coming from the 10.0 network).
The following example allows access from localhost and all clients whose IP addresses start with 10.0. For all other IP addresses, access is denied.
<remote>
  <host>localhost</host>
  <host>10.0.0.0/16</host>
</remote>
For more details, see the Jolokia security documentation (https://jolokia.org/reference/html/security.html).
5.2.3. Allowing connections to remote Fuse instances
The Fuse Console’s proxy servlet uses whitelist host protection, with which by default the Fuse Console can only connect to localhost. If you want to connect the Fuse Console to other remote Fuse instances, you need to configure the whitelist as follows:
For Apache Karaf, make the following configuration changes in
etc/system.propertiesfile:hawtio.proxyWhitelist = localhost, 127.0.0.1, myhost1, myhost2, myhost3
For JBoss EAP, make the following configuration changes in the
standalone/configuration/standalone-*.xmlfile:<property name=hawtio.proxyWhitelist" value="localhost, 127.0.0.1, myhost1, myhost2, myhost3"/>
For Spring Boot, configure the hawtio.proxyWhitelist system property in the
main()method of your Spring Boot application:System.setProperty("hawtio.proxyWhitelist", "localhost, 127.0.0.1, myhost1, myhost2, myhost3");
5.2.4. Connecting to a remote Jolokia agent
Before you begin, you need to know the connection details (host name, port, and path) of the remote Jolokia agent.
Here are the default connection URLs for the Jolokia agent depending on your Fuse distribution:
-
Spring Boot:
http://<host>:8080/jolokia -
Red Hat JBoss EAP:
http://<host>:8080/hawtio/jolokia -
Fuse Karaf:
http://<host>:8181/hawtio/jolokia
As a system administrator, you can change these defaults.
Typically, the URL to remotely connect to a Jolokia agent is the URL to open the Fuse Console plus /jolokia. For example, if the URL to open the Fuse Console is http://<host>:1234/hawtio, then the URL to remotely connect to it would probably be http://<host>:1234/hawtio/jolokia.
To connect to a remote Jolokia instance so that you can examine its JVM:
- Click the Connect tab.
Click the Remote tab, and then Add connection.
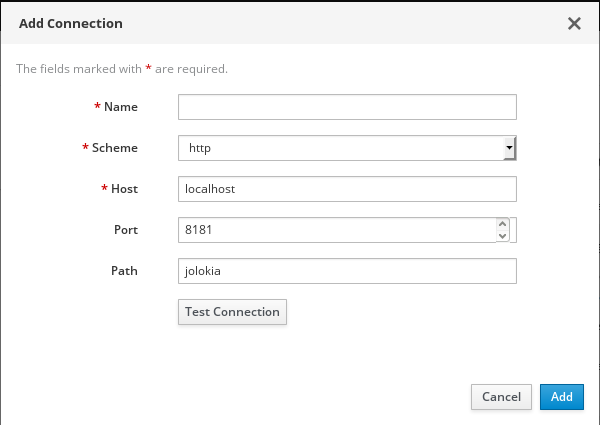
- Type the Name, Scheme (HTTP or HTTPS), and the hostname.
- Click Test Connection.
- Click Add.
The Fuse Console automatically probes the local network interfaces other than localhost and 127.0.0.1 and adds them to the whitelist. Hence, you do not need to manually register the local machine’s addresses to the whitelist.
5.2.5. Setting data moving preferences
You can change the following Jolokia preferences, for example, if you want to more frequently refresh data that displays in the Fuse Console. Note that increasing the frequency of data updates impacts networking traffic and increases the number of requests made to the server.
- Update rate - The period between polls to Jolokia to fetch JMX data (the default is 5 seconds).
- Maximum depth - The number of levels that Jolokia will marshal an object to JSON on the server side before returning (the default is 7).
- Maximum collection size - The maximum number of elements in an array that Jolokia marshals in a response (the default is 50,000).
To change the values of these settings:
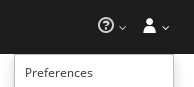
In the upper right of the Fuse Console, click the user icon and then click Preferences.
- Edit the options and then click Close.
5.2.6. Viewing JVM runtime information
To view JVM runtime information, such as system properties, metrics, and threads, click the Runtime tab.
5.3. Viewing and managing Apache Camel applications
In the Fuse Console’s Camel tab, you view and manage Apache Camel contexts, routes, and dependencies.
5.3.1. Overview
The Camel tab is only available when you connect to a container that uses one or more Camel routes.
You can view the following details:
- A list of all running Camel contexts
- Detailed information of each Camel context such as Camel version number and runtime statics
- Lists of all routes in each Camel application and their runtime statistics
- Graphical representation of the running routes along with real time metrics
You can also interact with a Camel application by:
- Starting and suspending contexts
- Managing the lifecycle of all Camel applications and their routes, so you can restart, stop, pause, resume, etc.
- Live tracing and debugging of running routes
- Browsing and sending messages to Camel endpoints
5.3.2. Interacting with a Camel application
To start, suspend, or delete a context:
- In the Camel tab’s tree view, click Camel Contexts.
- Check the box next to one or more contexts in the list.
- Click Start or Suspend.
- To delete a context, you must first stop it. Then click the ellipse icon and select Delete from the dropdown menu.
When you delete a context, you remove it from the deployed application.
To view Camel application details:
- In the Camel tab’s tree view, click a Camel application.
- To view a list of application attributes and values, click Attributes.
To view a graphical representation of the application attributes::
- Click Chart.
- Click Edit to select the attributes that you want to see in the chart.
- To view inflight and blocked exchanges, click Exchanges.
- To view application endpoints, click Endpoints. You can filter the list by URL, Route ID, and direction.
- Click Type Converters to view, enable, and disable statistics related to the Camel built-in type conversion mechanism, that is used to convert message bodies and message headers to different types.
- Click Operations to view and execute JMX operations, such as adding or updating routes from XML or finding all Camel components available in the classpath.
To interact with Camel routes:
In the Camel tab’s tree view, click the application’s routes folder to view a list of the routes:
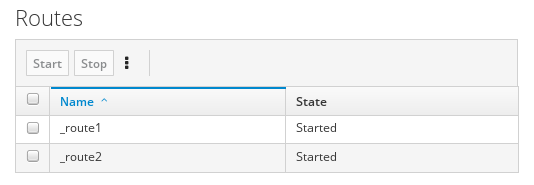
To start, stop, or delete one or more routes:
- Check the box next to one or more routes in the list.
- Click Start or Stop.
To delete a route, you must first stop it. Then click the ellipse icon and select Delete from the dropdown menu.
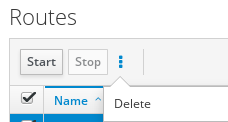 Note
Note- When you delete a route, you remove it from the deployed application.
- You can also select a specific route in the tree view and then click the upper-right menu to start, stop, or delete it.
- To view a graphical diagram of the routes, click Route Diagram.
- To view inflight and blocked exchanges, click Exchanges.
- To view endpoints, click Endpoints. You can filter the list by URL, Route ID, and direction.
- Click Type Converters to view, enable, and disable statistics related to the Camel built-in type conversion mechanism, which is used to convert message bodies and message headers to different types.
To interact with a specific route:
- In the Camel tab’s tree view, select a route.
- To view a list of route attributes and values, click Attributes.
- To view a graphical representation of the route attributes, click Chart. You can click Edit to select the attributes that you want to see in the chart.
- To view inflight and blocked exchanges, click Exchanges.
- Click Operations to view and execute JMX operations on the route, such as dumping the route as XML or getting the route’s Camel ID value.
To trace messages through a route:
- In the Camel tab’s tree view, select a route.
- Select Trace, and then click Start tracing.
To send messages to a route:
- In the Camel tab’s tree view, open the context’s endpoints folder and then select an endpoint.
- Click the Send subtab.
- Configure the message in JSON or XML format.
- Click Send.
- Return to the route’s Trace tab to view the flow of messages through the route.
To debug a route:
- In the Camel tab’s tree view, select a route.
- Select Debug, and then click Start debugging.
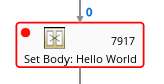
To add a breakpoint, select a node in the diagram and then click Add breakpoint. A red dot appears in the node:
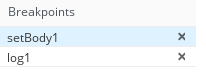
The node is added to the list of breakpoints:
- Click the down arrow to step to the next node or the Play button to resume running the route.
- Click the Pause button to suspend all threads for the route.
- Click Stop debugging when you are done. All breakpoints are cleared.
5.4. Viewing and managing JMX domains and MBeans
Java Management Extensions (JMX) is a Java technology that allows you to manage resources (services, devices, and applications) dynamically at runtime. The resources are represented by objects called MBeans (for Managed Bean). You can manage and monitor resources as soon as they are created, implemented, or installed.
With the JMX plugin on the Fuse Console, you can view and manage JMX domains and MBeans. You can view MBean attributes, run commands, and create charts that show statistics for the MBeans.
The JMX tab provides a tree view of the active JMX domains and MBeans organized in folders. You can view details and execute commands on the MBeans.
To view and edit MBean attributes:
- In the tree view, select an MBean.
- Click the Attributes tab.
- Click an attribute to see its details.
To perform operations:
- In the tree view, select an MBean.
- Click the Operations tab, expand one of the listed operations.
- Click Execute to run the operation.
To view charts:
- In the tree view, select an item.
- Click the Chart tab.
5.5. Viewing and managing your OSGI environment (Karaf standalone)
For Apache Karaf standalone distributions, you can view and manage the Red Hat Fuse OSGi environment. You can view and manage container bundles, features, and configurations, as well as Java packages and OSGi services.
The OSGi tab contains a series of subtabs with options for each container component:
- Bundles
- List of installed bundles. You can install and uninstall bundles, start and stop bundles, and edit bundle properties. You can also filter the list and toggle between list and grid view.
- Features
- List of available features. You can install and uninstall features or feature repositories, and drill down to view feature details.
- Packages
- List of installed Java packages. You can view package versions and associated bundles.
- Services
- List of running services. You can view service IDs, associated bundles and object classes.
- Declarative Services
- List of declarative OSGi services. You can view the service state and drill down to view service details. You can also activate and deactivate services.
- Server
- Detailed information about the local or remote host in read-only mode.
- Framework
- Configuration options for the container OSGi framework. You can set the framework start level and the initial bundle start level.
- Configuration
- List of configuration objects. You can view the state of each object and drill down to view or edit object details. You can also create a new configuration object.
5.6. Viewing and monitoring thread state
To view and monitor the state of threads:
- Click the Runtime tab and then the Threads subtab. The Threads page lists active threads and stack trace details for each thread. By default, the thread list shows all threads in descending ID order.
- To sort the list by increasing ID, click the ID column label.
- Optionally, filter the list by thread state (for example, Blocked) or by thread name.
- To drill down to detailed information for a specific thread, such as the lock class name and full stack trace for that thread, in the Actions column, click More.
5.7. Viewing log entries
You can view log entries for Red Hat Fuse in the Logs tab. The Logs tab is available (for Fuse standalone on Karaf and Fuse standalone on JBoss EAP) when the Java application has the Log MBean available .
You can filter the list of logs to show specific log types, and drill down to each log entry to view detailed information about the log entry.
The Logs tab contains the following sections:
- Action Bar
- Options to filter the log entries section according to a text string or the logging level.
- Log Entries
- List view of the log entries. By default, the list shows log entries in ascending order. You can change the default sorting in the User → Preferences → Server Logs page. Click the log entry link to drill down to details about the log entry, such as the bundle name, thread, and the full message text.
5.7.1. Setting Fuse Console log attributes
You can customize the following Fuse Console browser settings for storing log messages:
- The number of log statements to keep in the Fuse Console (the default is 100).
- The global log level: INFO (the default), OFF, ERROR, WARN, and DEBUG.
- The child-level Hawtio messages to include, such as hawtio-oauth and hawtio-core-utils.
To change the defaults:
In the upper right corner of the Fuse Console, click the user icon and then click Preferences from the drop-down menu:
- Edit the options and then click Close.
To reset the Console Logs settings to the default values, click Reset → Reset settings.