
Red Hat Training
A Red Hat training course is available for Red Hat Ceph Storage
Chapter 2. High Level Monitoring
High level monitoring of a cluster typically involves checking the status of Ceph OSD and monitor daemons to ensure that they are up and running. High level monitoring also involves checking your cluster capacity to ensure that the cluster doesn’t exceed its full ratio. The Calamari instance on your administration node is the most common way to conduct high-level monitoring. However, you may also use CLI, the admin socket or the Ceph API to monitor your cluster.
2.1. Interactive Mode
To run the ceph tool in interactive mode, type ceph at the command line with no arguments. For example:
ceph
ceph> health
ceph> status
ceph> quorum_status
ceph> mon_status
2.2. Checking Cluster Health
After you start your cluster, and before you start reading and/or writing data, check your cluster’s health first. You can check on the health of your Ceph cluster with the following:
ceph health
If you specified non-default locations for your configuration or keyring, you may specify their locations:
ceph -c /path/to/conf -k /path/to/keyring health
Upon starting the Ceph cluster, you will likely encounter a health warning such as HEALTH_WARN XXX num placement groups stale. Wait a few moments and check it again. When your cluster is ready, ceph health should return a message such as HEALTH_OK. At that point, it is okay to begin using the cluster.
2.3. Watching a Cluster
To watch the cluster’s ongoing events on the command line, open a new terminal. Then, enter:
ceph -w
Ceph will print each event. For example, a tiny Ceph cluster consisting of one monitor and two OSDs may print the following:
cluster b370a29d-9287-4ca3-ab57-3d824f65e339
 health HEALTH_OK
 monmap e1: 1 mons at {ceph1=10.0.0.8:6789/0}, election epoch 2, quorum 0 ceph1
 osdmap e63: 2 osds: 2 up, 2 in
  pgmap v41338: 952 pgs, 20 pools, 17130 MB data, 2199 objects
        115 GB used, 167 GB / 297 GB avail
             952 active+clean

2014-06-02 15:45:21.655871 osd.0 [INF] 17.71 deep-scrub ok
2014-06-02 15:45:47.880608 osd.1 [INF] 1.0 scrub ok
2014-06-02 15:45:48.865375 osd.1 [INF] 1.3 scrub ok
2014-06-02 15:45:50.866479 osd.1 [INF] 1.4 scrub ok
2014-06-02 15:45:01.345821 mon.0 [INF] pgmap v41339: 952 pgs: 952 active+clean; 17130 MB data, 115 GB used, 167 GB / 297 GB avail
2014-06-02 15:45:05.718640 mon.0 [INF] pgmap v41340: 952 pgs: 1 active+clean+scrubbing+deep, 951 active+clean; 17130 MB data, 115 GB used, 167 GB / 297 GB avail
2014-06-02 15:45:53.997726 osd.1 [INF] 1.5 scrub ok
2014-06-02 15:45:06.734270 mon.0 [INF] pgmap v41341: 952 pgs: 1 active+clean+scrubbing+deep, 951 active+clean; 17130 MB data, 115 GB used, 167 GB / 297 GB avail
2014-06-02 15:45:15.722456 mon.0 [INF] pgmap v41342: 952 pgs: 952 active+clean; 17130 MB data, 115 GB used, 167 GB / 297 GB avail
2014-06-02 15:46:06.836430 osd.0 [INF] 17.75 deep-scrub ok
2014-06-02 15:45:55.720929 mon.0 [INF] pgmap v41343: 952 pgs: 1 active+clean+scrubbing+deep, 951 active+clean; 17130 MB data, 115 GB used, 167 GB / 297 GB avail
The output provides:
- Cluster ID
- Cluster health status
- The monitor map epoch and the status of the monitor quorum
- The OSD map epoch and the status of OSDs
- The placement group map version
- The number of placement groups and pools
- The notional amount of data stored and the number of objects stored; and,
- The total amount of data stored.
How Ceph Calculates Data Usage
The used value reflects the actual amount of raw storage used. The xxx GB / xxx GB value means the amount available (the lesser number) of the overall storage capacity of the cluster. The notional number reflects the size of the stored data before it is replicated, cloned or snapshotted. Therefore, the amount of data actually stored typically exceeds the notional amount stored, because Ceph creates replicas of the data and may also use storage capacity for cloning and snapshotting.
2.4. Checking a Cluster’s Usage Stats
To check a cluster’s data usage and data distribution among pools, you can use the df option. It is similar to Linux df. Execute the following:
ceph df
The GLOBAL section of the output provides an overview of the amount of storage your cluster uses for your data.
- SIZE: The overall storage capacity of the cluster.
- AVAIL: The amount of free space available in the cluster.
- RAW USED: The amount of raw storage used.
-
% RAW USED: The percentage of raw storage used. Use this number in conjunction with the
full ratioandnear full ratioto ensure that you are not reaching your cluster’s capacity.
The POOLS section of the output provides a list of pools and the notional usage of each pool. The output from this section DOES NOT reflect replicas, clones or snapshots. For example, if you store an object with 1MB of data, the notional usage will be 1MB, but the actual usage may be 3MB or more depending on the number of replicas (e.g., size = 3, clones and snapshots.
- NAME: The name of the pool.
- ID: The pool ID.
- USED: The notional amount of data stored in kilobytes, unless the number appends M for megabytes or G for gigabytes.
- %USED: The notional percentage of storage used per pool.
- Objects: The notional number of objects stored per pool.
The numbers in the POOLS section are notional. They are not inclusive of the number of replicas, shapshots or clones. As a result, the sum of the USED and %USED amounts will not add up to the RAW USED and %RAW USED amounts in the GLOBAL section of the output. See How Ceph Calculates Data Usage for details.
2.5. Checking a Cluster’s Status
To check a cluster’s status, execute the following:
ceph status
Or:
ceph -s
In interactive mode, type status and press Enter. :
ceph> status
Ceph will print the cluster status. For example, a tiny Ceph cluster consisting of one monitor, and two OSDs may print the following:
cluster b370a29d-9287-4ca3-ab57-3d824f65e339
 health HEALTH_OK
 monmap e1: 1 mons at {ceph1=10.0.0.8:6789/0}, election epoch 2, quorum 0 ceph1
 osdmap e63: 2 osds: 2 up, 2 in
  pgmap v41332: 952 pgs, 20 pools, 17130 MB data, 2199 objects
        115 GB used, 167 GB / 297 GB avail
               1 active+clean+scrubbing+deep
             951 active+clean
2.6. Checking Monitor Status
If your cluster has multiple monitors (required for high availability production clusters), you should check the monitor quorum status after you start the cluster before reading and/or writing data. A quorum must be present when multiple monitors are running. You should also check monitor status periodically to ensure that they are running. If there is a problem with the monitor cluster that prevents agreement on the state of the cluster, the fault may prevent Ceph clients from reading and writing data.
To see display the monitor map, execute the following:
ceph mon stat
Or:
ceph mon dump
To check the quorum status for the monitor cluster, execute the following:
ceph quorum_status
Ceph will return the quorum status. For example, a Ceph cluster consisting of three monitors may return the following:
{ "election_epoch": 10,
  "quorum": [
        0,
        1,
        2],
  "monmap": { "epoch": 1,
      "fsid": "444b489c-4f16-4b75-83f0-cb8097468898",
      "modified": "2011-12-12 13:28:27.505520",
      "created": "2011-12-12 13:28:27.505520",
      "mons": [
            { "rank": 0,
              "name": "a",
              "addr": "127.0.0.1:6789\/0"},
            { "rank": 1,
              "name": "b",
              "addr": "127.0.0.1:6790\/0"},
            { "rank": 2,
              "name": "c",
              "addr": "127.0.0.1:6791\/0"}
           ]
    }
}
2.7. Using the Admin Socket
The Ceph admin socket allows you to query a daemon via a socket interface. By default, Ceph sockets reside under /var/run/ceph. To access a daemon via the admin socket, login to the host running the daemon and use the following command:
ceph --admin-daemon /var/run/ceph/{socket-name}To view the available admin socket commands, execute the following command:
ceph --admin-daemon /var/run/ceph/{socket-name} helpThe admin socket command enables you to show and set your configuration at runtime.
Additionally, you can set configuration values at runtime directly (i.e., the admin socket bypasses the monitor, unlike ceph tell {daemon-type}.{id} injectargs, which relies on the monitor but doesn’t require you to login directly to the host in question ).
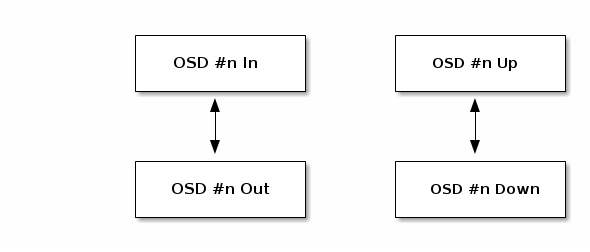
2.8. Checking OSD Status
An OSD’s status is either in the cluster (in) or out of the cluster (out); and, it is either up and running (up), or it is down and not running (down). If an OSD is up, it may be either in the cluster (you can read and write data) or it is out of the cluster. If it was in the cluster and recently moved out of the cluster, Ceph will migrate placement groups to other OSDs. If an OSD is out of the cluster, CRUSH will not assign placement groups to the OSD. If an OSD is down, it should also be out.
If an OSD is down and in, there is a problem and the cluster will not be in a healthy state.
If you execute a command such as ceph health, ceph -s or ceph -w, you may notice that the cluster does not always echo back HEALTH OK. Don’t panic. With respect to OSDs, you should expect that the cluster will NOT echo HEALTH OK in a few expected circumstances:
- You haven’t started the cluster yet (it won’t respond).
- You have just started or restarted the cluster and it’s not ready yet, because the placement groups are getting created and the OSDs are in the process of peering.
- You just added or removed an OSD.
- You just have modified your cluster map.
An important aspect of monitoring OSDs is to ensure that when the cluster is up and running that all OSDs that are in the cluster are up and running, too. To see if all OSDs are running, execute:
ceph osd stat
Or:
ceph osd dump
The result should tell you the map epoch (eNNNN), the total number of OSDs (x), how many are up (y) and how many are in (z).
eNNNN: x osds: y up, z in
If the number of OSDs that are in the cluster is more than the number of OSDs that are up, execute the following command to identify the ceph-osd daemons that aren’t running:
ceph osd tree
The output should look something like this:
# id    weight  type name   up/down reweight
-1  3   pool default
-3  3       rack mainrack
-2  3           host osd-host
0   1               osd.0   up  1
1   1               osd.1   up  1
2   1               osd.2   up  1
The ability to search through a well-designed CRUSH hierarchy may help you troubleshoot your cluster by identifying the physical locations faster.
If an OSD is down, connect to the node and start it. You can use Calamari to restart the node, or you can use the CLI. For example:
sudo /etc/init.d/ceph start osd.1