Red Hat Training
A Red Hat training course is available for Red Hat Process Automation Manager
Chapter 6. Execution error management
When an execution error occurs the process stops and rolls back to the most recent stable state (the closest safe point) and continues its execution. If an error of any kind is not handled by the process the entire transaction rolls back, leaving the process instance in the previous wait state. Any trace of this is only visible in the logs, and usually displayed to the caller who sent the request to the process engine.
Users with process administrator (process-admin) or administrator (admin) roles are able to access error messages in Business Central, which has the following features:
- Better traceability
- Visibility in case of critical processes
- Reporting and analytics based on error situations
- External system error handling and compensation
Configurable error handling is responsible for receiving any technical errors thrown throughout the process engine execution (including task service). The following technical exceptions apply:
-
Anything that extends
java.lang.Throwable. - Process level error handling and any other exceptions not previously handled.
There are several components that make up the error handling mechanism and allow a pluggable approach to extend its capabilities.
The process engine entry point for error handling is the ExecutionErrorManager. This is integrated with RuntimeManager, which is then responsible for providing it to underlying components - KieSession and TaskService. From the API point of view, ExecutionErrorManager gives access to:
-
ExecutionErrorHandler- the primary mechanism for error handling. -
ExecutionErrorStorage- pluggable storage for execution error information.
6.1. View process execution errors in Business Central
In Business Central, there are two pages where administrators are made aware of process errors: the Manage Process Instances page and the Manage Execution Errors page. These can be accessed using the following Business Central navigation:
- Menu → Manage → Process Instances.
- Menu → Manage → Execution Errors.
In the Manage Process Instances page, the Errors column displays the number of errors, if any, for the current process instance. Use the following process to view the error messages.
Prerequisite
An error has occurred while running a process in Business Central.
Procedure
- In the Process Instances page, hover over the number shown in the Errors column.
- Click on the number of errors shown in the Errors column to navigate to the Manage Execution Errors page.
The Manage Execution Errors page shows a list of errors for all process instances.
6.2. Manage execution errors
By definition, every error that is caught and stored is unacknowledged, meaning that it is to be handled by someone or something (in case of automatic error recovery). Errors are filtered on the basis of whether or not they have been acknowledged. Acknowledging an error saves the user information and time stamp for traceability.
You can access the Error Management view at any time.
- In Business Central, click Menu → Manage → Execution Errors.
- Select an error from the list to open the Details tab. This displays information about the error or errors.
- Click the Acknowledge button to acknowledge and clear the error. The error can still be viewed later by selecting Yes on the Acknowledged filter in the Manage Execution Errors page.
If the error was related to a task, a Go to Task button is displayed.
Click the Go to Task button to view the associated job information in the Manage Tasks page.
The Manage Tasks page allows you to restart, reschedule, or retry the corresponding task.
6.3. Error filtering
Access the Execution Errors List by clicking Menu → Manage → Execution Errors.
Figure 6.1. Filtering Errors - Default View
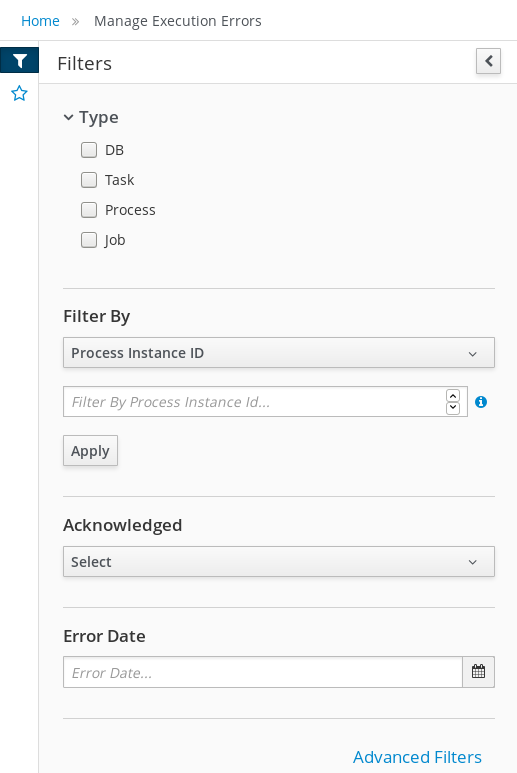
Execution errors can be filtered on the following attributes:
- Type
Filter by errors by type. You can select multiple type filters. Removing the status filter displays all processes, regardless of status.
The following filter states are available:
- DB
- Task
- Process
- Job
- Process Instance Id
Filter by process instance ID.
Input:
Numeric- Job Id
Filter by job ID. The job id is created automatically when the job is created.
Input:
Numeric- Id
Filter by process instance ID.
Input:
Numeric- Acknowledged
- Filter errors that have been or have not been acknowledged.
- Error Date
Filtering by the date or time that the error occurred.
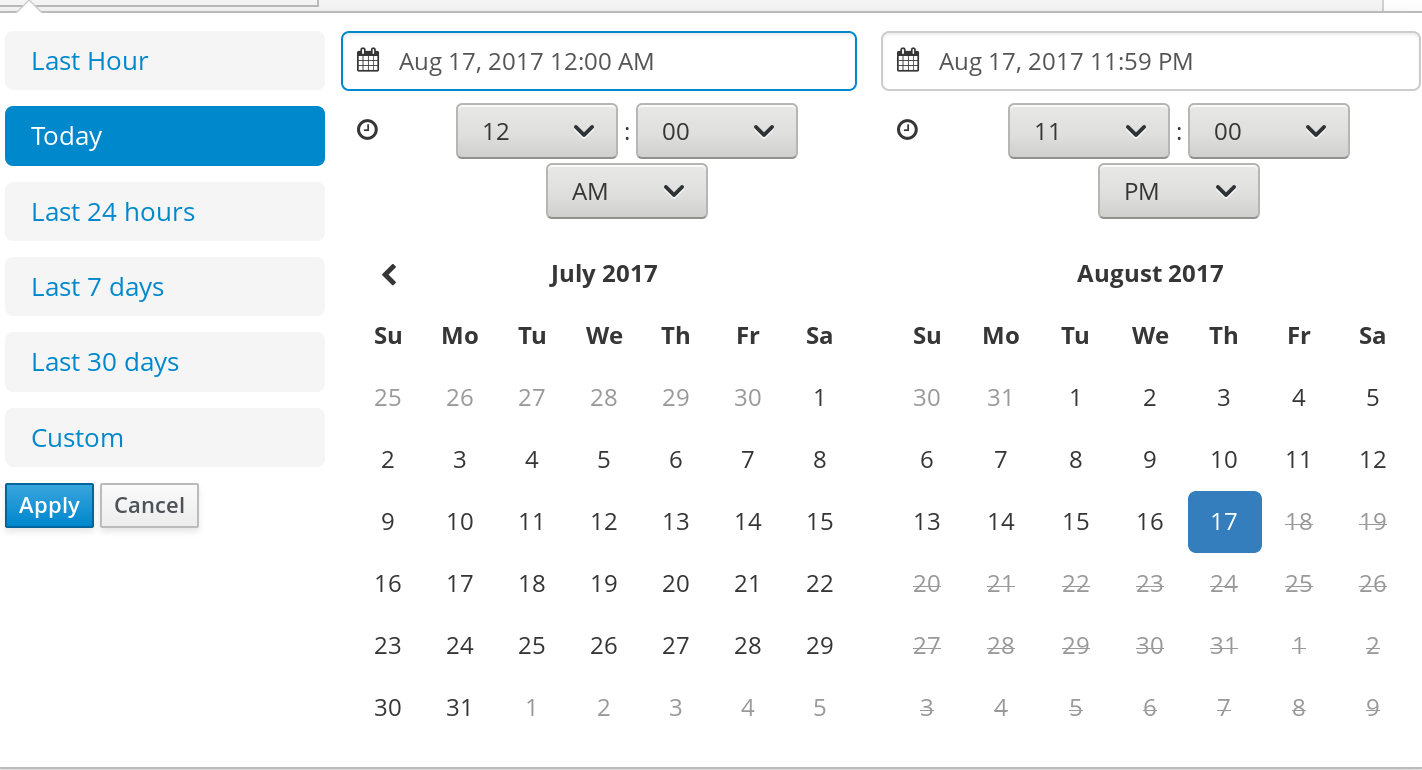
This filter has the following quick filter options:
- Last Hour
- Today
- Last 24 Hours
- Last 7 Days
- Last 30 Days
Custom
Selecting Custom date and time filtering opens a calendar tool for selecting a date and time range.
Figure 6.2. Search by Date