
Red Hat Training
A Red Hat training course is available for Red Hat JBoss Operations Network
4. Metrics and Measurements
Every operating system, application, and server has some mechanism for gaging its performance. A database has page hits and misses, servers have open connection counts, platforms have memory and CPU usage. These performance measurements can be monitored by JBoss Operations Network as metrics.
4.1. Direct Information about Resources
Metrics are a way of measuring a resource's performance or a way of measuring its load. The key word is measurement. A metric is some data point which software exposes, which is relevant to the operations or purpose of that software, that provides insight into the quantifiable behavior of that software.

Figure 10. Metric Graph
Every type of resource has its own set of metrics, relevant to the resource type. Metrics are defined in the plug-in descriptor for that resource type. The plug-in descriptor lists the types of measurements which are possible and allowed for that resource; that's not necessarily the same thing as the metrics which are actually collected for a resource. Metrics themselves must be enabled (per resource or per metric template) and are then collected on schedule.
4.1.1. Baselines and Out-of-Bounds Metrics
After metrics have been collected for a reliable amount of time, JBoss ON automatically calculates a baseline for the metric. A baseline is the normal operating range for that metric on that resource.
Baselines are calculated values, not raw data points. Once every hour, a job is run that compresses these metric values into one hour aggregates. These aggregates contain the minimum, maximum, and average value of the measured data. Aggregates are also made for 6-hour and 24-hour windows.
Baseline metrics compare changes in actual data against a baseline value. Baselines allow effective trending analysis, SLAs management, and overall application health assessments as a form of fault management.
Baselines allow JBoss ON to identify metric values collected that fall outside (out-of-bounds) of the high and low baselines. Out-of-bounds metrics are reported as problem metrics.
Note
When an alert is triggered in response to a metric value, the alerting event is tracked as a problem metric.
If there are no baselines present, because they have not yet been computed or because the metric is a trends-up or trends-down metric, no out-of-bounds factors will be calculated.
A baseline has a bandwidth that is the difference between its minimum and maximum values. The difference is the absolute amount that the problem metric is outside the baseline. To be able to compare out-of-bound values, an out-of-bounds-factor is computed by dividing the difference by the bandwidth. This creates a ratio to show comparatively how far out of the normal operation range the problem metric is.
Note
Calculating baselines can sometimes output non-intuitive results, as a band of (1,2) and an outlier value of 3 seems to be less than a band of (100, 200 MB) and an outlier value of 250 MB. The former is actually 100% outside the expected band, while the latter is only 50% outside.

Figure 11. Out-of-Bound Factors
Out-of-bounds-factors are recalculated each hour during a calculation job. The job assesses the aggregate and determines if there is a more severe outlier than before. The chart always displays the most severe outlier.
When the baselines for a metric change, all recorded out-of-bounds values become invalid and are removed because the out-of-bounds measurement was computed against an old baseline.
4.1.2. Collection Schedules
The metric collection schedule is defined individually for each metric in the resource type's plug-in descriptor.
There is no rule on how frequently metrics are collected. Default intervals range between 10 minutes and 40 minutes for most metrics. While some metrics are commonly important (like free memory or CPU usage on platforms), the importance of many metrics depends on the general IT and production environments and the resource itself. Set reasonable intervals to collect important metrics with a frequency that adequately reflects the resource's real life performance.
The shortest configurable interval is 30 seconds, although an interval that short should be used sparingly because the volume of metrics reported could impact database performance.
4.1.3. Metric Schedules and Resource Type Templates
Unlike other types of monitoring data which are unique to an resource (availability, events, traits), metrics can be universal for all resources of that type.
Metric collection schedules define whether an allowed metric for a resource is actually enabled and what its collection interval is. A schedule is set at the resource-level, but administrator-defined default settings can be applied to all resources of a type by using metrics collection templates.
Templates are a server configuration setting. They define what metrics are active and what the collection schedules are for all resources of a specific type. When templates are used, they supplant whatever default metrics settings are given in the plug-in descriptor. (A metric template only defines whether a metric is enabled and what its interval is — the plug-in descriptor alone defines what metrics are available for a resource type.)
These settings can be overridden at the resource-level, as necessary. Still, metrics collection templates provide a simple way to apply metrics settings consistently across resources and machines.
4.1.4. Raw Metrics, Displayed Metrics, and Storing Data
The live reading of metric information is raw data. This raw data is stored in the backend server, but it is not the information that is displayed in the web UI.
The information displayed in the web UI is aggregated data. The web UI has a limited display space, segmented into 60 x-axis segments. The JBoss ON server averages the raw data to create the data points for whatever the display time period is. For example, if the display range is 60 hours, each x-axis segment is 1-hour wide, and that data point is an average of all readings collected in that 1-hour segment. This aggregation is dynamic, depending on the monitoring window given in the chart views.
As Section 4.1.1, “Baselines and Out-of-Bounds Metrics” describes, the baseline calculations themselves are aggregates of the raw data, with 1-hour, 6-hour, and 24-hour windows to set minimum, maximum, and average baselines. Unlike the UI aggregates, these aggregated data are calculated and then stored as monitoring data in the server database.
Raw data are only stored for one week, by default, while aggregated values are stored for up to a year. The data storage times are configurable.
4.2. Viewing Metrics and Baseline Charts
The core of monitoring is the metric information that is collected for a resource. Each resource has different metrics (and these are listed in the Resource Reference: Monitoring, Operation, and Configuration Options). Three monitoring charts show the same information, but in different perspectives and different levels of detail:
- The resource-level Summary
- Graphs
- Tables
The Summary tab for resources, much like the Dashboard for the entire JBoss ON inventory, has portlets that show different resource information. Most resources have three portlets for measurements, events, and out-of-bound metrics. The Measurements portlet has small thumbnail charts that show the trend for the metric, along with the current reading.
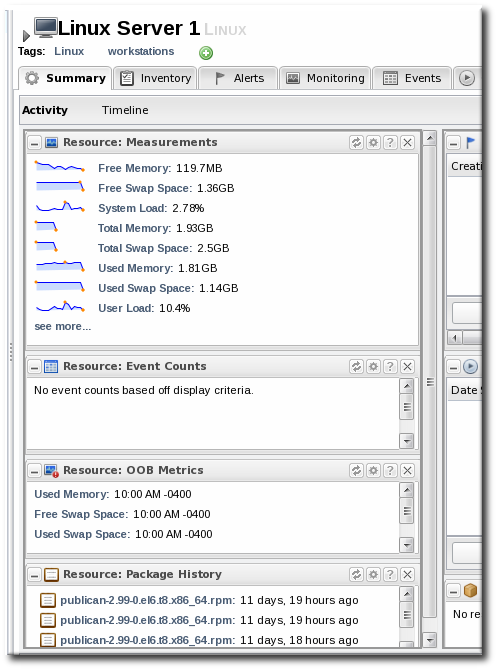
Clicking any of the metrics will open the baseline chart for that metric. As is described in Section 4.1.1, “Baselines and Out-of-Bounds Metrics”, baselines calculate an average reading for a given period of time, with the high and low measurements in that period creating upper and lower bounds. Baselines, by default, are calculated every three days using the data from the previous seven days for the calculation. Baseline measurements are essential for establishing operating norms so that administrators can effectively set alerts for resources.

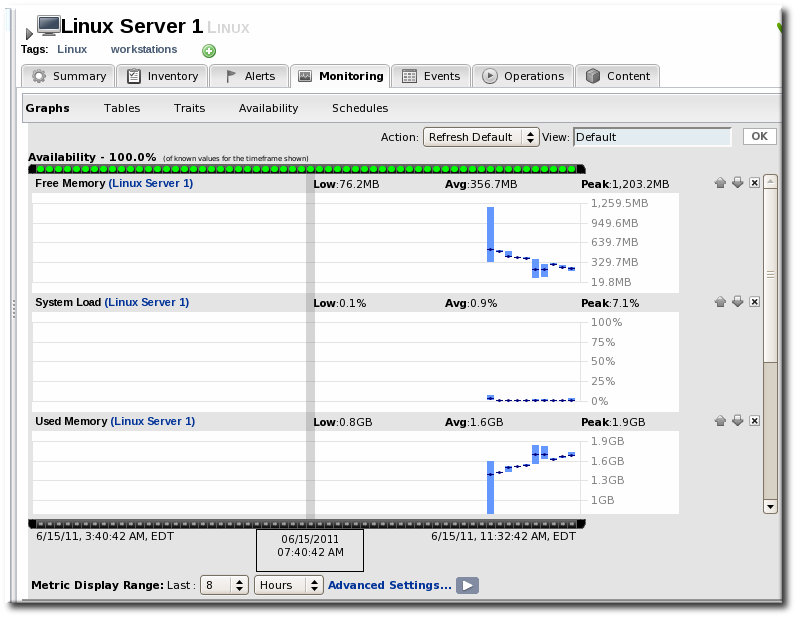
The Graphs area in the Monitoring tab shows all of the metrics on line graphs, giving the trend for the past eight hours, and the time span is dynamically configurable. This provides more granular detail than the summary or baselines charts, showing the readings for each collection period and the precise readings.
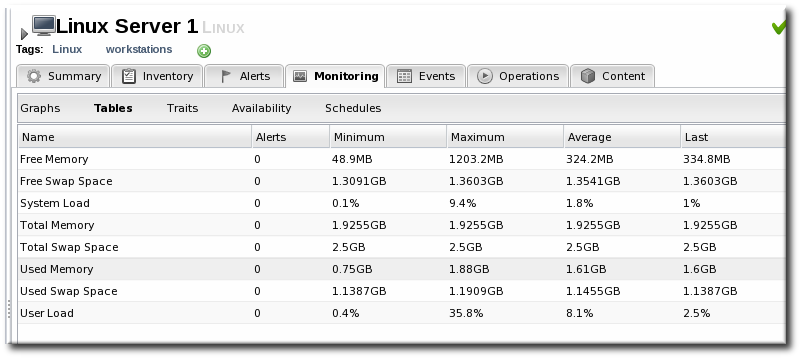
The Tables chart has the same information as the metrics graphs, only it is displayed in text, with columns for the high, low, and current readings. There is also a column which shows the number of active alerts for each metric.
4.3. Viewing Live Values
The live data value is the current, one-minute average for the metric based on the last two metrics readings.
- Click the Inventory tab in the top menu.
- Select the resource category in the Resources menu table on the left, and then browse or search for the resource.

- Click the resource name.
- Open the Monitoring tab, and select the Tables subtab.
- Select the metric (or metrics, using Ctrl) in the list.
- Click the Get Live Values button at the bottom of the table.
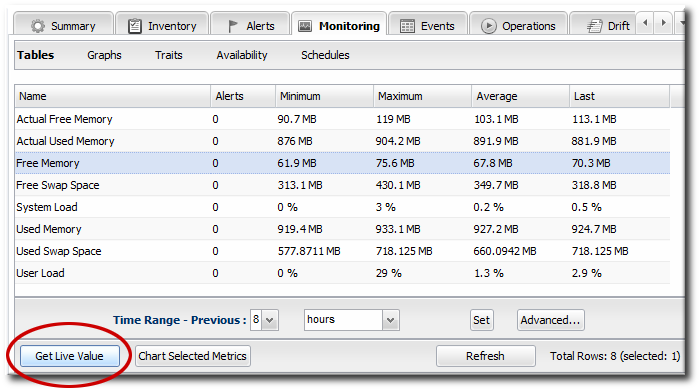
- The server displays the current (not aggregated) reading of the selected metrics.

4.4. Defining Baselines
4.4.1. Setting Baseline Calculation Properties
The monitoring baselines have two configuration properties that define how the automatic metric baselines are calculated. These properties don't set the value; they set the window of time used for the baseline averages.
- In the System Configuration menu, select the item.

- Scroll to the Automatic Baseline Configuration Properties section.
- Change the settings to define the window used for calculation.
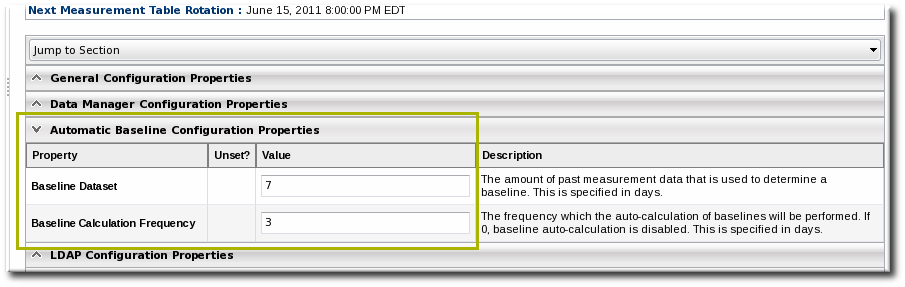
- Baseline Frequency sets the interval, in days, for how often baselines are recalculated. The default is three days.
- Baseline Dataset sets the time interval, in days, used to calculate the baseline. The default is seven days.
4.4.2. Recalculating Baseline Values
Baselines measure the average operating value of metrics. JBoss ON also collects the highest and lowest recorded readings to set a normal operating range. Comparing live metrics with pre-calculated baselines makes it possible to detect when resources are running outside of expected ranges. JBoss ON automatically calculates baselines; however, they can be recalculated for specific time periods or simply if the load has changed and new baselines are required.
- Click the Inventory tab in the top menu.
- Select the resource type in the Resources menu table on the left, and then browse or search for the resource.
- In the summary tab, click the name of the metric to recalculate.
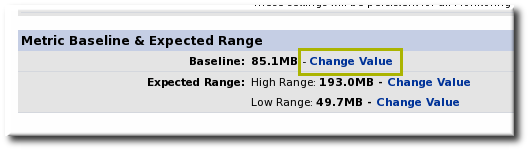
- Scroll to the bottom of the baseline chart, to the Metric Baseline & Expected Range area.
- Click the Change Value link next to the baseline figure.
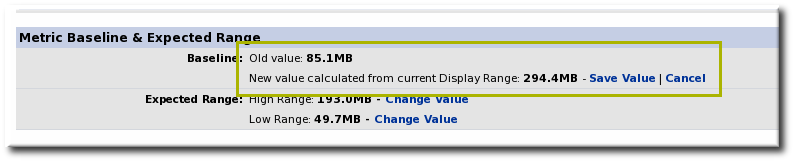
- A new baseline is calculated using the baseline dataset property from the configuration properties, starting from the current time. Accept the new baseline value by clicking Save Value.
4.5. Setting Collection Intervals for a Specific Resource
Metrics are collected at the intervals specified by the collection schedule. Because not all metrics are mission critical or even likely to change, JBoss ON has different collection schedules for different metrics, with critical metrics collected more frequently.
For most environments, setting a daily collection schedule (once every 24 hours) is sufficient.
To change the collection interval for a specific metric:
- Click the Inventory tab in the top menu.
- Select the resource category, such as servers or services, in the Resources menu table on the left. Then browse or search for the resource.
- Click the Monitoring tab on the resource entry.
- Click the Schedules subtab.
- Select the metric for which to change the monitoring frequency. Multiple metrics can be selected, if they will all be changed to the same frequency.

- Enter the desired collection period in the Collection Interval field, with the appropriate time unit (seconds, minutes, or hours).
- Click Set.
4.6. Enabling and Disabling Metrics for a Specific Resource
- Click the Inventory tab in the top menu.
- Select the resource type in the Resources menu table on the left, and then browse or search for the resource.
- Click the Monitoring tab on the resource entry.
- Click the Schedules sub tab.
- Select the metrics to enable or disable.
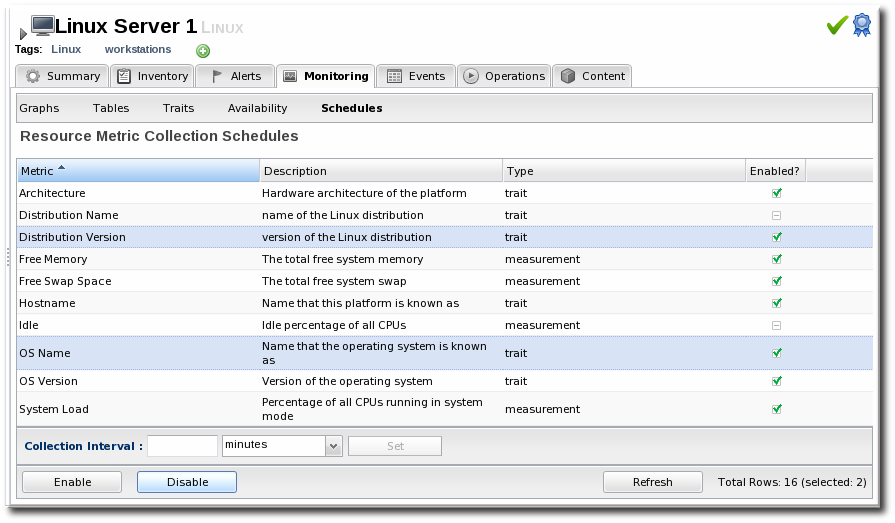
- Click the Enable or Disable button.
4.7. Changing Metrics Templates
The metrics which are collected for a resource type are defined in the monitoring template for the resource type. Each resource type has some metrics disabled by default, and these must be manually enabled. Likewise, metrics which are enabled by default can be disabled.
Note
Metric templates only apply to new resources of that resource type unless the checkbox is selected to apply them to existing resources as well as new resources.
- In the top navigation, open the Administration menu, and then the System Configuration menu.
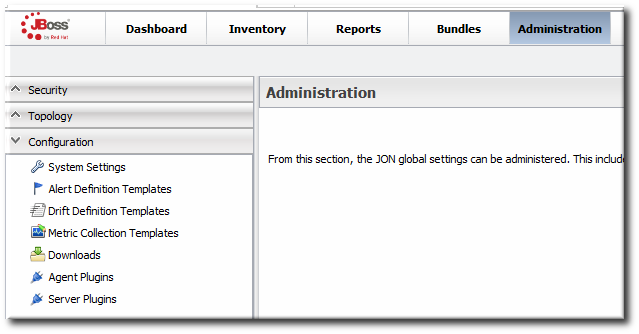
- Select the Metric Collection Templates menu item. This opens a long list of resource types, both for platforms and server types.
- Locate the type of resource for which to create the template definition.
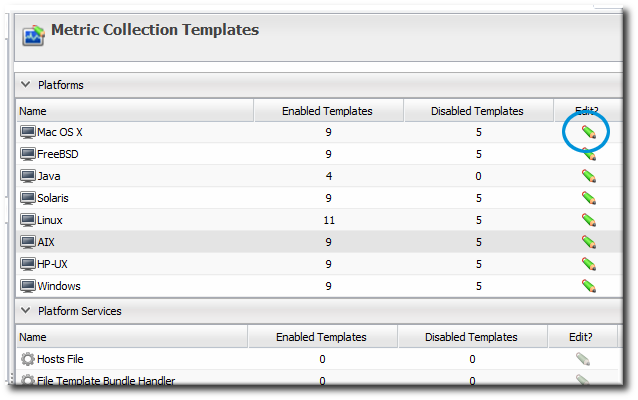
- Click the pencil icon to edit the metric collection schedule templates.
- Select the required metrics to enable or disable, and click the or button.
- To edit the frequency that a metric is collected, select the Update schedules for existing resources of marked type checkbox, and then enter the desired time frame into the Collection Interval for Selected: field.
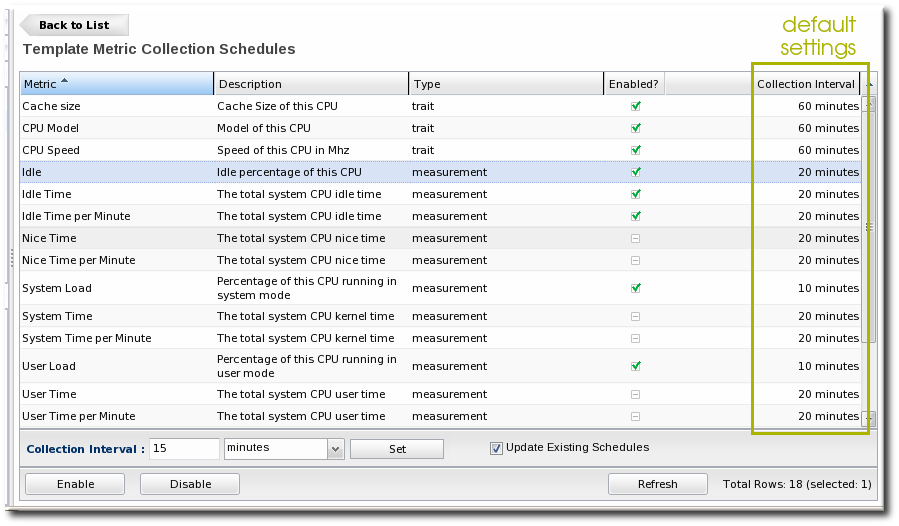
- Click the button.
4.8. Adding a PostgreSQL Query as a Metric
A SQL query can be added to a PostgreSQL database as a child resource. That entry becomes a custom metric for that PostgreSQL database.
A query metric must have two columns that allow the JBoss ON agent to collect data for the query:
- metricColumn
- count(id)
The query has to return a single row with those two columns. The first column signals that it is a collected metric, and the second gives the count for the metric.
For example, to track logged-in users:
SELECT 'metricColumn', count(id) FROM my_application_user WHERE is_logged_in = true
The
SELECT statement defines the metric for the JBoss ON agent. The rest of the query collects the data from the database. Simple as that.
To add a metric based on a query:
- Click the Inventory tab in the top menu.
- Search for the PostgreSQL resource.
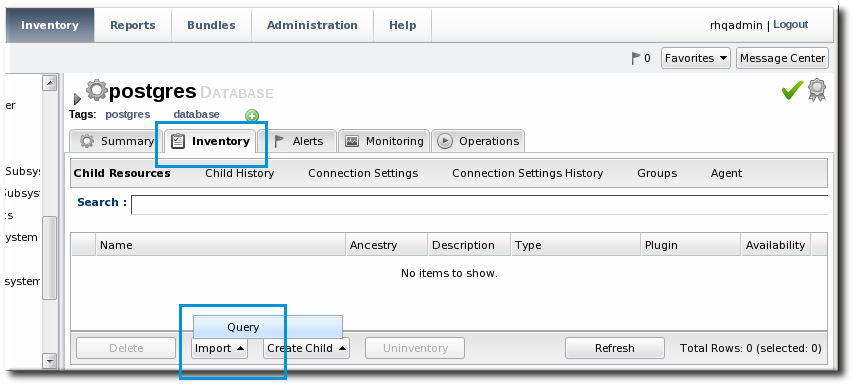
- Click the Inventory tab for the PostgreSQL database.
- Click the Import button in the bottom of the Inventory tab, and select Query.
- Fill in the properties for the query metric. Three fields are particularly important:
- The Table gives which table within the database contains the data; this is whatever is in the
FROMstatement in the query. - The Metric Query contains the full query to run. The
SELECTstatement must be'metricColumn',count(id)to format the query properly for the JBoss ON agent to interpret it as a metric.SELECT 'metricColumn', count(id) FROM my_application_user WHERE is_logged_in = true
- The Name field is not important in configuring the metric, but it is important identifying the metric later.

Once the query is created, then the agent begins collecting the counts for the data.

Figure 12. Query: Total Logged-in User Count