
Red Hat Training
A Red Hat training course is available for Red Hat Ceph Storage
Administration Guide
Administration of Red Hat Ceph Storage
Abstract
Chapter 1. Overview
The Red Hat Ceph Storage cluster is the foundation for all Ceph deployments. Based upon Reliable Autonomic Distributed Object Store (RADOS), Ceph Storage Clusters consist of two types of daemons:
- A Ceph Object Storage Device (OSD) stores data as objects within placement groups assigned to the OSD
- A Ceph Monitor maintains a master copy of the cluster map
A Red Hat Ceph Storage cluster can contain thousands of storage nodes. A minimal system will have at least one Ceph Monitor and three Ceph OSDs for peering and object durability. A production system will have three or more Monitors for high availability and typically a minimum of 50 OSDs for acceptable load balancing, re-balancing and recovery. See the Red Hat Ceph Storage Installation Guide for Red Hat Enterprise Linux or Ubuntu for details.
Chapter 2. Process Management
Each time you want to start, restart, and stop the Ceph daemons, you must specify the daemon type or the daemon instance.
2.1. Running Ceph as a systemd Service
In Red Hat Ceph Storage 2, all process management is done through the Systemd service.
2.1.1. Starting, Stopping, Restarting All Daemons
To start, stop, or restart all the Ceph daemons, execute the following commands from the local node running the Ceph daemons, and as root:
Start All Ceph Daemons
# systemctl start ceph.target
Stop All Ceph Daemons
# systemctl stop ceph.target
Restart All Ceph Daemons
# systemctl restart ceph.target
2.1.2. Starting, Stopping, Restarting All Daemons by Type
To start, stop, or restart all Ceph daemons of a particular type, execute the following commands from the local node running the Ceph daemons, and as root:
All Monitor Daemons
Starting:
# systemctl start ceph-mon.target
Stopping:
# systemctl stop ceph-mon.target
Restarting:
# systemctl restart ceph-mon.target
All OSD Daemons
Starting:
# systemctl start ceph-osd.target
Stopping:
# systemctl stop ceph-osd.target
Restarting:
# systemctl restart ceph-osd.target
All RADOS Gateway Daemons
Starting:
# systemctl start ceph-radosgw.target
Stopping:
# systemctl stop ceph-radosgw.target
Restarting:
# systemctl restart ceph-radosgw.target
2.1.3. Starting, Stopping, Restarting a Daemon by Instances
To start, stop, or restart a Ceph daemon of a particular type by instance, execute the following commands from the local node running the Ceph daemons, and as root:
Monitor Instance
Starting:
# systemctl start ceph-mon@<monitor_hostname>
Stopping:
# systemctl stop ceph-mon@<monitor_hostname>
Restarting:
# systemctl restart ceph-mon@<monitor_hostname>
OSD Instance
Starting:
# systemctl start ceph-osd@<OSD_number>
Stopping:
# systemctl stop ceph-osd@<OSD_number>
Restarting:
# systemctl restart ceph-osd@<OSD_number>
RADOS Gateway Instance
Starting:
# systemctl start ceph-radosgw@rgw.<gateway_hostname>
Stopping:
# systemctl stop ceph-radosgw@rgw.<gateway_hostname>
Restarting:
# systemctl restart ceph-radosgw@rgw.<gateway_hostname>
Chapter 3. Monitoring
Once you have a running cluster, you may begin monitoring the storage cluster to ensure that the Ceph Monitor and OSD daemons are running, at a high-level. Ceph storage cluster clients must connect to a Ceph monitor and receive the latest version of the Ceph cluster map before they can read and write data to the Ceph pools of the storage cluster. So the monitor cluster must have agreement on the state of the cluster before Ceph clients can read and write data.
Ceph OSDs must peer the placement groups on the primary OSD with the copies of the placement groups on secondary OSDs. If faults arise, peering will reflect something other than the active + clean state.
3.1. High-level Monitoring
High level monitoring of a storage cluster typically involves checking the status of Ceph OSD and Monitor daemons to ensure that they are up and running. High level monitoring also involves checking the storage cluster capacity to ensure that the cluster doesn’t exceed its full ratio. The Calamari instance on the Ansible Tower or Red Hat Storage Console node is the most common way to conduct high-level monitoring. However, you may also use the command line, the admin socket or the Ceph API to monitor the storage cluster.
3.1.1. Interactive Mode
To run the ceph utility in interactive mode, type ceph at the command line with no arguments, for example:
# ceph
ceph> health
ceph> status
ceph> quorum_status
ceph> mon_status
3.1.2. Checking Cluster Health
After you start the Ceph storage cluster, and before you start reading and/or writing data, check the storage cluster’s health first. You can check on the health of the Ceph storage cluster with the following:
# ceph health
If you specified non-default locations for the configuration or keyring, you may specify their locations:
# ceph -c /path/to/conf -k /path/to/keyring health
Upon starting the Ceph cluster, you will likely encounter a health warning such as HEALTH_WARN XXX num placement groups stale. Wait a few moments and check it again. When the storage cluster is ready, ceph health should return a message such as HEALTH_OK. At that point, it is okay to begin using the cluster.
3.1.3. Watching a Cluster
To watch the cluster’s ongoing events on the command line, open a new terminal. Then, enter:
# ceph -w
Ceph will print each event. For example, a tiny Ceph cluster consisting of one monitor and two OSDs may print the following:
cluster b370a29d-9287-4ca3-ab57-3d824f65e339
 health HEALTH_OK
 monmap e1: 1 mons at {ceph1=10.0.0.8:6789/0}, election epoch 2, quorum 0 ceph1
 osdmap e63: 2 osds: 2 up, 2 in
  pgmap v41338: 952 pgs, 20 pools, 17130 MB data, 2199 objects
        115 GB used, 167 GB / 297 GB avail
             952 active+clean

2014-06-02 15:45:21.655871 osd.0 [INF] 17.71 deep-scrub ok
2014-06-02 15:45:47.880608 osd.1 [INF] 1.0 scrub ok
2014-06-02 15:45:48.865375 osd.1 [INF] 1.3 scrub ok
2014-06-02 15:45:50.866479 osd.1 [INF] 1.4 scrub ok
2014-06-02 15:45:01.345821 mon.0 [INF] pgmap v41339: 952 pgs: 952 active+clean; 17130 MB data, 115 GB used, 167 GB / 297 GB avail
2014-06-02 15:45:05.718640 mon.0 [INF] pgmap v41340: 952 pgs: 1 active+clean+scrubbing+deep, 951 active+clean; 17130 MB data, 115 GB used, 167 GB / 297 GB avail
2014-06-02 15:45:53.997726 osd.1 [INF] 1.5 scrub ok
2014-06-02 15:45:06.734270 mon.0 [INF] pgmap v41341: 952 pgs: 1 active+clean+scrubbing+deep, 951 active+clean; 17130 MB data, 115 GB used, 167 GB / 297 GB avail
2014-06-02 15:45:15.722456 mon.0 [INF] pgmap v41342: 952 pgs: 952 active+clean; 17130 MB data, 115 GB used, 167 GB / 297 GB avail
2014-06-02 15:46:06.836430 osd.0 [INF] 17.75 deep-scrub ok
2014-06-02 15:45:55.720929 mon.0 [INF] pgmap v41343: 952 pgs: 1 active+clean+scrubbing+deep, 951 active+clean; 17130 MB data, 115 GB used, 167 GB / 297 GB avail
The output provides:
- Cluster ID
- Cluster health status
- The monitor map epoch and the status of the monitor quorum
- The OSD map epoch and the status of OSDs
- The placement group map version
- The number of placement groups and pools
- The notional amount of data stored and the number of objects stored
- The total amount of data stored
How Ceph Calculates Data Usage
The used value reflects the actual amount of raw storage used. The xxx GB / xxx GB value means the amount available, the lesser of the two numbers, of the overall storage capacity of the cluster. The notional number reflects the size of the stored data before it is replicated, cloned or snapshotted. Therefore, the amount of data actually stored typically exceeds the notional amount stored, because Ceph creates replicas of the data and may also use storage capacity for cloning and snapshotting.
3.1.4. Checking a Cluster’s Usage Statistics
To check a cluster’s data usage and data distribution among pools, you can use the df option. It is similar to Linux df. Execute the following:
# ceph df
The GLOBAL section of the output provides an overview of the amount of storage the storage cluster uses for data.
- SIZE: The overall storage capacity of the storage cluster.
- AVAIL: The amount of free space available in the storage cluster.
- RAW USED: The amount of raw storage used.
-
% RAW USED: The percentage of raw storage used. Use this number in conjunction with the
full ratioandnear full ratioto ensure that you are not reaching the storage cluster’s capacity.
The POOLS section of the output provides a list of pools and the notional usage of each pool. The output from this section DOES NOT reflect replicas, clones or snapshots. For example, if you store an object with 1MB of data, the notional usage will be 1MB, but the actual usage may be 3MB or more depending on the number of replicas (e.g., size = 3, clones and snapshots.
- NAME: The name of the pool.
- ID: The pool ID.
- USED: The notional amount of data stored in kilobytes, unless the number appends M for megabytes or G for gigabytes.
- %USED: The notional percentage of storage used per pool.
- Objects: The notional number of objects stored per pool.
The numbers in the POOLS section are notional. They are not inclusive of the number of replicas, shapshots or clones. As a result, the sum of the USED and %USED amounts will not add up to the RAW USED and %RAW USED amounts in the GLOBAL section of the output. See How Ceph Calculates Data Usage for details.
3.1.5. Checking a Cluster’s Status
To check a cluster’s status, execute the following:
# ceph status
Or:
# ceph -s
In interactive mode, type status and press Enter. :
ceph> status
Ceph will print the cluster status. For example, a tiny Ceph cluster consisting of one monitor, and two OSDs may print the following:
cluster b370a29d-9287-4ca3-ab57-3d824f65e339
 health HEALTH_OK
 monmap e1: 1 mons at {ceph1=10.0.0.8:6789/0}, election epoch 2, quorum 0 ceph1
 osdmap e63: 2 osds: 2 up, 2 in
  pgmap v41332: 952 pgs, 20 pools, 17130 MB data, 2199 objects
        115 GB used, 167 GB / 297 GB avail
               1 active+clean+scrubbing+deep
             951 active+clean
3.1.6. Checking Monitor Status
If the storage cluster has multiple monitors, which is required for high availability for production Ceph storage clusters. You should check the Ceph Monitor quorum status after you start the Ceph storage cluster before reading and/or writing data. A quorum must be present when multiple monitors are running. You should also check Ceph Monitor status periodically to ensure that they are running. If there is a problem with the Monitor, that prevents an agreement on the state of the storage cluster, the fault may prevent Ceph clients from reading and writing data.
To display the monitor map, execute the following:
# ceph mon stat
or
# ceph mon dump
To check the quorum status for the storage cluster, execute the following:
# ceph quorum_status --format json-pretty
Ceph will return the quorum status. For example, a Ceph storage cluster consisting of three monitors may return the following:
{ "election_epoch": 10,
  "quorum": [
        0,
        1,
        2],
  "monmap": { "epoch": 1,
      "fsid": "444b489c-4f16-4b75-83f0-cb8097468898",
      "modified": "2011-12-12 13:28:27.505520",
      "created": "2011-12-12 13:28:27.505520",
      "mons": [
            { "rank": 0,
              "name": "a",
              "addr": "127.0.0.1:6789\/0"},
            { "rank": 1,
              "name": "b",
              "addr": "127.0.0.1:6790\/0"},
            { "rank": 2,
              "name": "c",
              "addr": "127.0.0.1:6791\/0"}
           ]
    }
}
3.1.7. Using the Administration Socket
Use the administration socket to interact with a given daemon directly by using a UNIX socket file. For example, the socket enables you to:
- List the Ceph configuration at runtime
-
Set configuration values at runtime directly without relaying on Monitors. This is useful when Monitors are
down. - Dump historic operations
- Dump the operation priority queue state
- Dump operations without rebooting
- Dump performance counters
In addition, using the socket is helpful when troubleshooting problems related to Monitors or OSDs. For details, see the Troubleshooting Guide for Red Hat Ceph Storage 2.
To use the socket:
ceph daemon <type>.<id> <command>
Replace:
-
<type>with the type of the Ceph daemon (mon,osd,mds). -
<id>with the daemon ID -
<command>with the command to run. Usehelpto list the available commands for a given daemon.
For example, to view a Monitor status of a Monitor named mon.0:
# ceph daemon mon.0 mon_status
Alternatively, specify the daemon by using its socket file.
ceph daemon /var/run/ceph/<socket-file> <command>
For example, to view the status of an OSD named osd.2:
# ceph daemon /var/run/ceph/ceph-osd.2.asok status
To list all socket files for the Ceph processes:
$ ls /var/run/ceph
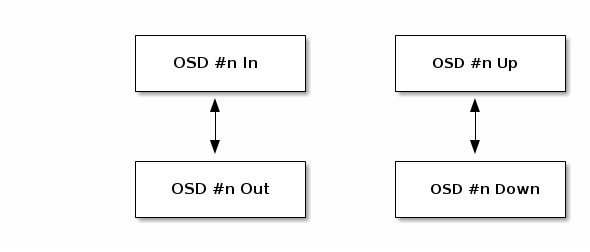
3.1.8. Checking OSD Status
An OSD’s status is either in the cluster, in, or out of the cluster, out; and, it is either up and running, up, or it is down and not running, or down. If an OSD is up, it may be either in the storage cluster, which data can be read and written, or it is out of the storage cluster. If it was in the cluster and recently moved out of the cluster, Ceph will migrate placement groups to other OSDs. If an OSD is out of the cluster, CRUSH will not assign placement groups to the OSD. If an OSD is down, it should also be out.
If an OSD is down and in, there is a problem and the cluster will not be in a healthy state.
If you execute a command such as ceph health, ceph -s or ceph -w, you may notice that the cluster does not always echo back HEALTH OK. Don’t panic. With respect to OSDs, you should expect that the cluster will NOT echo HEALTH OK in a few expected circumstances:
- You haven’t started the cluster yet, it won’t respond.
- You have just started or restarted the cluster and it’s not ready yet, because the placement groups are getting created and the OSDs are in the process of peering.
- You just added or removed an OSD.
- You just have modified the cluster map.
An important aspect of monitoring OSDs is to ensure that when the cluster is up and running that all OSDs that are in the cluster are up and running, too. To see if all OSDs are running, execute:
# ceph osd stat
or
# ceph osd dump
The result should tell you the map epoch, eNNNN, the total number of OSDs, x, how many, y, are up, and how many, z, are in:
eNNNN: x osds: y up, z in
If the number of OSDs that are in the cluster is more than the number of OSDs that are up, execute the following command to identify the ceph-osd daemons that aren’t running:
# ceph osd tree
Example output:
# id    weight  type name   up/down reweight
-1  3   pool default
-3  3       rack mainrack
-2  3           host osd-host
0   1               osd.0   up  1
1   1               osd.1   up  1
2   1               osd.2   up  1
The ability to search through a well-designed CRUSH hierarchy may help you troubleshoot the storage cluster by identifying the physical locations faster.
If an OSD is down, connect to the node and start it. You can use Red Hat Storage Console to restart the OSD node, or you can use the command line, for example:
# systemctl start ceph-osd@<osd_id>
3.2. Low-level Monitoring
Lower-level monitoring typically involves ensuring that OSDs are peering. When faults occur, placement groups operate in a degraded state. This can be due to many things such as failed hardware, hung or crashed daemon, network latency or outage among other things.
3.2.1. Placement Group Sets
When CRUSH assigns placement groups to OSDs, it looks at the number of replicas for the pool and assigns the placement group to OSDs such that each replica of the placement group gets assigned to a different OSD. For example, if the pool requires three replicas of a placement group, CRUSH may assign them to osd.1, osd.2 and osd.3 respectively. CRUSH actually seeks a pseudo-random placement that will take into account failure domains you set in the CRUSH map, so you will rarely see placement groups assigned to nearest neighbor OSDs in a large cluster. We refer to the set of OSDs that should contain the replicas of a particular placement group as the Acting Set. In some cases, an OSD in the Acting Set is down or otherwise not able to service requests for objects in the placement group. When these situations arise, don’t panic. Common examples include:
- You added or removed an OSD. Then, CRUSH reassigned the placement group to other OSDs—thereby changing the composition of the Acting Set and spawning the migration of data with a "backfill" process.
-
An OSD was
down, was restarted and is nowrecovering. -
An OSD in the Acting Set is
downor unable to service requests, and another OSD has temporarily assumed its duties.
Ceph processes a client request using the Up Set, which is the set of OSDs that will actually handle the requests. In most cases, the Up Set and the Acting Set are virtually identical. When they are not, it may indicate that Ceph is migrating data, an OSD is recovering, or that there is a problem, that is, Ceph usually echoes a HEALTH WARN state with a "stuck stale" message in such scenarios.
To retrieve a list of placement groups:
# ceph pg dump
To view which OSDs are in the Acting Set or in the Up Set for a given placement group:
# ceph pg map <pg-num>
The result should tell you the osdmap epoch,
eNNN, the placement group number,<pg-num>, the OSDs in the Up Setup[], and the OSDs in the acting set,acting[]:osdmap eNNN pg <pg-num> -> up [0,1,2] acting [0,1,2]
NoteIf the Up Set and Acting Set do not match, this may be an indicator that the cluster rebalancing itself or of a potential problem with the cluster.
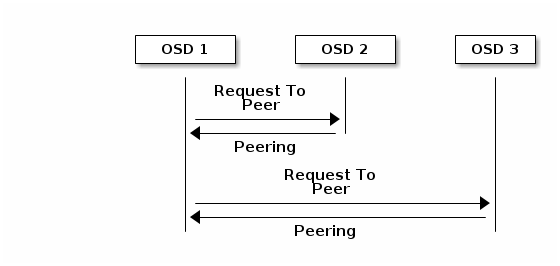
3.2.2. Peering
Before you can write data to a placement group, it must be in an active state, and it should be in a clean state. For Ceph to determine the current state of a placement group, the primary OSD of the placement group (i.e., the first OSD in the acting set), peers with the secondary and tertiary OSDs to establish agreement on the current state of the placement group (assuming a pool with 3 replicas of the PG).
3.2.3. Monitoring Placement Group States
If you execute a command such as ceph health, ceph -s or ceph -w, you may notice that the cluster does not always echo back HEALTH OK. After you check to see if the OSDs are running, you should also check placement group states. You should expect that the cluster will NOT echo HEALTH OK in a number of placement group peering-related circumstances:
- You have just created a pool and placement groups haven’t peered yet.
- The placement groups are recovering.
- You have just added an OSD to or removed an OSD from the cluster.
- You have just modified the CRUSH map and the placement groups are migrating.
- There is inconsistent data in different replicas of a placement group.
- Ceph is scrubbing a placement group’s replicas.
- Ceph doesn’t have enough storage capacity to complete backfilling operations.
If one of the foregoing circumstances causes Ceph to echo HEALTH WARN, don’t panic. In many cases, the cluster will recover on its own. In some cases, you may need to take action. An important aspect of monitoring placement groups is to ensure that when the cluster is up and running that all placement groups are active, and preferably in the clean state. To see the status of all placement groups, execute:
# ceph pg stat
The result should tell you the placement group map version, vNNNNNN, the total number of placement groups, x, and how many placement groups, y, are in a particular state such as active+clean:
vNNNNNN: x pgs: y active+clean; z bytes data, aa MB used, bb GB / cc GB avail
It is common for Ceph to report multiple states for placement groups.
Snapshot Trimming PG States
When snapshots exist, two additional PG states will be reported.
-
snaptrim: The PGs are currently being trimmed -
snaptrim_wait: The PGs are waiting to be trimmed
Example Output:
244 active+clean+snaptrim_wait
 32 active+clean+snaptrim
See the miscellaneous OSD settings in the Red Hat Ceph Storage 2 Configuration Guide for more details on the snapshot trimming settings.
In addition to the placement group states, Ceph will also echo back the amount of data used, aa, the amount of storage capacity remaining, bb, and the total storage capacity for the placement group. These numbers can be important in a few cases:
-
You are reaching the
near full ratioorfull ratio. - Your data isn’t getting distributed across the cluster due to an error in the CRUSH configuration.
Placement Group IDs
Placement group IDs consist of the pool number, and not the pool name, followed by a period (.) and the placement group ID—a hexadecimal number. You can view pool numbers and their names from the output of ceph osd lspools. The default pool names data, metadata and rbd correspond to pool numbers 0, 1 and 2 respectively. A fully qualified placement group ID has the following form:
<pool_num>.<pg_id>
Example output:
0.1f
To retrieve a list of placement groups:
# ceph pg dump
To format the output in JSON format and save it to a file:
# ceph pg dump -o <file_name> --format=json
To query a particular placement group:
# ceph pg <pool_num>.<pg_id> query
Example output in JSON format:
{
  "state": "active+clean",
  "up": [
    1,
    0
  ],
  "acting": [
    1,
    0
  ],
  "info": {
    "pgid": "1.e",
    "last_update": "4'1",
    "last_complete": "4'1",
    "log_tail": "0'0",
    "last_backfill": "MAX",
    "purged_snaps": "[]",
    "history": {
      "epoch_created": 1,
      "last_epoch_started": 537,
      "last_epoch_clean": 537,
      "last_epoch_split": 534,
      "same_up_since": 536,
      "same_interval_since": 536,
      "same_primary_since": 536,
      "last_scrub": "4'1",
      "last_scrub_stamp": "2013-01-25 10:12:23.828174"
    },
    "stats": {
      "version": "4'1",
      "reported": "536'782",
      "state": "active+clean",
      "last_fresh": "2013-01-25 10:12:23.828271",
      "last_change": "2013-01-25 10:12:23.828271",
      "last_active": "2013-01-25 10:12:23.828271",
      "last_clean": "2013-01-25 10:12:23.828271",
      "last_unstale": "2013-01-25 10:12:23.828271",
      "mapping_epoch": 535,
      "log_start": "0'0",
      "ondisk_log_start": "0'0",
      "created": 1,
      "last_epoch_clean": 1,
      "parent": "0.0",
      "parent_split_bits": 0,
      "last_scrub": "4'1",
      "last_scrub_stamp": "2013-01-25 10:12:23.828174",
      "log_size": 128,
      "ondisk_log_size": 128,
      "stat_sum": {
        "num_bytes": 205,
        "num_objects": 1,
        "num_object_clones": 0,
        "num_object_copies": 0,
        "num_objects_missing_on_primary": 0,
        "num_objects_degraded": 0,
        "num_objects_unfound": 0,
        "num_read": 1,
        "num_read_kb": 0,
        "num_write": 3,
        "num_write_kb": 1
      },
      "stat_cat_sum": {

      },
      "up": [
        1,
        0
      ],
      "acting": [
        1,
        0
      ]
    },
    "empty": 0,
    "dne": 0,
    "incomplete": 0
  },
  "recovery_state": [
    {
      "name": "Started\/Primary\/Active",
      "enter_time": "2013-01-23 09:35:37.594691",
      "might_have_unfound": [

      ],
      "scrub": {
        "scrub_epoch_start": "536",
        "scrub_active": 0,
        "scrub_block_writes": 0,
        "finalizing_scrub": 0,
        "scrub_waiting_on": 0,
        "scrub_waiting_on_whom": [

        ]
      }
    },
    {
      "name": "Started",
      "enter_time": "2013-01-23 09:35:31.581160"
    }
  ]
}
The following subsections describe common states in greater detail.
3.2.3.1. Creating
When you create a pool, it will create the number of placement groups you specified. Ceph will echo creating when it is creating one or more placement groups. Once they are created, the OSDs that are part of a placement group’s Acting Set will peer. Once peering is complete, the placement group status should be active+clean, which means a Ceph client can begin writing to the placement group.
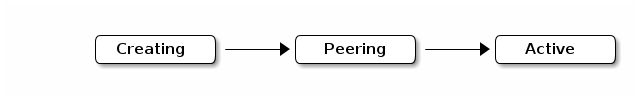
3.2.3.2. Peering
When Ceph is Peering a placement group, Ceph is bringing the OSDs that store the replicas of the placement group into agreement about the state of the objects and metadata in the placement group. When Ceph completes peering, this means that the OSDs that store the placement group agree about the current state of the placement group. However, completion of the peering process does NOT mean that each replica has the latest contents.
Authoritative History
Ceph will NOT acknowledge a write operation to a client, until all OSDs of the acting set persist the write operation. This practice ensures that at least one member of the acting set will have a record of every acknowledged write operation since the last successful peering operation.
With an accurate record of each acknowledged write operation, Ceph can construct and disseminate a new authoritative history of the placement group—a complete, and fully ordered set of operations that, if performed, would bring an OSD’s copy of a placement group up to date.
3.2.3.3. Active
Once Ceph completes the peering process, a placement group may become active. The active state means that the data in the placement group is generally available in the primary placement group and the replicas for read and write operations.
3.2.3.4. Clean
When a placement group is in the clean state, the primary OSD and the replica OSDs have successfully peered and there are no stray replicas for the placement group. Ceph replicated all objects in the placement group the correct number of times.
3.2.3.5. Degraded
When a client writes an object to the primary OSD, the primary OSD is responsible for writing the replicas to the replica OSDs. After the primary OSD writes the object to storage, the placement group will remain in a degraded state until the primary OSD has received an acknowledgement from the replica OSDs that Ceph created the replica objects successfully.
The reason a placement group can be active+degraded is that an OSD may be active even though it doesn’t hold all of the objects yet. If an OSD goes down, Ceph marks each placement group assigned to the OSD as degraded. The OSDs must peer again when the OSD comes back online. However, a client can still write a new object to a degraded placement group if it is active.
If an OSD is down and the degraded condition persists, Ceph may mark the down OSD as out of the cluster and remap the data from the down OSD to another OSD. The time between being marked down and being marked out is controlled by mon osd down out interval, which is set to 300 seconds by default.
A placement group can also be degraded, because Ceph cannot find one or more objects that Ceph thinks should be in the placement group. While you cannot read or write to unfound objects, you can still access all of the other objects in the degraded placement group.
Let’s say there are 9 OSDs with three copies of an object. If OSD number 9 goes down, the PGs assigned to OSD 9 go in a degraded state. If OSD 9 doesn’t recover, it goes out of the cluster and the cluster rebalances. In that scenario, the PGs are degraded and then recover to an active state.
3.2.3.6. Recovering
Ceph was designed for fault-tolerance at a scale where hardware and software problems are ongoing. When an OSD goes down, its contents may fall behind the current state of other replicas in the placement groups. When the OSD is back up, the contents of the placement groups must be updated to reflect the current state. During that time period, the OSD may reflect a recovering state.
Recovery isn’t always trivial, because a hardware failure might cause a cascading failure of multiple OSDs. For example, a network switch for a rack or cabinet may fail, which can cause the OSDs of a number of host machines to fall behind the current state of the cluster. Each one of the OSDs must recover once the fault is resolved.
Ceph provides a number of settings to balance the resource contention between new service requests and the need to recover data objects and restore the placement groups to the current state. The osd recovery delay start setting allows an OSD to restart, re-peer and even process some replay requests before starting the recovery process. The osd recovery threads setting limits the number of threads for the recovery process, by default one thread. The osd recovery thread timeout sets a thread timeout, because multiple OSDs may fail, restart and re-peer at staggered rates. The osd recovery max active setting limits the number of recovery requests an OSD will entertain simultaneously to prevent the OSD from failing to serve . The osd recovery max chunk setting limits the size of the recovered data chunks to prevent network congestion.
3.2.3.7. Backfilling
When a new OSD joins the cluster, CRUSH will reassign placement groups from OSDs in the cluster to the newly added OSD. Forcing the new OSD to accept the reassigned placement groups immediately can put excessive load on the new OSD. Backfilling the OSD with the placement groups allows this process to begin in the background. Once backfilling is complete, the new OSD will begin serving requests when it is ready.
During the backfill operations, you may see one of several states: backfill_wait indicates that a backfill operation is pending, but isn’t underway yet; backfill indicates that a backfill operation is underway; and, backfill_too_full indicates that a backfill operation was requested, but couldn’t be completed due to insufficient storage capacity. When a placement group cannot be backfilled, it may be considered incomplete.
Ceph provides a number of settings to manage the load spike associated with reassigning placement groups to an OSD, especially a new OSD. By default, osd_max_backfills sets the maximum number of concurrent backfills to or from an OSD to 10. The osd backfill full ratio enables an OSD to refuse a backfill request if the OSD is approaching its full ratio, by default 85%. If an OSD refuses a backfill request, the osd backfill retry interval enables an OSD to retry the request, by default after 10 seconds. OSDs can also set osd backfill scan min and osd backfill scan max to manage scan intervals, by default 64 and 512.
For some workloads, it is beneficial to avoid regular recovery entirely and use backfill instead. Since backfilling occurs in the background, this allows I/O to proceed on the objects in the OSD. To force backfill rather than recovery, set osd_min_pg_log_entries to 1, and set osd_max_pg_log_entries to 2. Contact your Red Hat Support account team for details on when this situation is appropriate for your workload.
3.2.3.8. Remapped
When the Acting Set that services a placement group changes, the data migrates from the old acting set to the new acting set. It may take some time for a new primary OSD to service requests. So it may ask the old primary to continue to service requests until the placement group migration is complete. Once data migration completes, the mapping uses the primary OSD of the new acting set.
3.2.3.9. Stale
While Ceph uses heartbeats to ensure that hosts and daemons are running, the ceph-osd daemons may also get into a stuck state where they aren’t reporting statistics in a timely manner, for example, a temporary network fault. By default, OSD daemons report their placement group, up thru, boot and failure statistics every half second, that is, 0.5, which is more frequent than the heartbeat thresholds. If the Primary OSD of a placement group’s acting set fails to report to the monitor or if other OSDs have reported the primary OSD down, the monitors will mark the placement group stale.
When you start the storage cluster, it is common to see the stale state until the peering process completes. After the storage cluster has been running for awhile, seeing placement groups in the stale state indicates that the primary OSD for those placement groups is down or not reporting placement group statistics to the monitor.
3.2.3.10. Misplaced
There are some temporary backfilling scenarios where a PG gets mapped temporarily to an OSD. When that temporary situation should no longer be the case, the PGs might still reside in the temporary location and not in the proper location. In which case, they are said to be misplaced. That’s because the correct number of extra copies actually exist, but one or more copies is in the wrong place.
Lets say there are 3 OSDs: 0,1,2 and all PGs map to some permutation of those three. If you add another OSD (OSD 3), some PGs will now map to OSD 3 instead of one of the others. However, until OSD 3 is backfilled, the PG will have a temporary mapping allowing it to continue to serve I/O from the old mapping. During that time, the PG is misplaced, because it has a temporary mapping, but not degraded, since there are 3 copies.
Example
pg 1.5: up=acting: [0,1,2]
<add osd 3>
pg 1.5: up: [0,3,1] acting: [0,1,2]
Here, [0,1,2] is a temporary mapping, so the up set is not equal to the acting set and the PG is misplaced but not degraded since [0,1,2] is still three copies.
Example
pg 1.5: up=acting: [0,3,1]
OSD 3 is now backfilled and the temporary mapping is removed, not degraded and not misplaced.
3.2.3.11. Incomplete
A PG goes into a incomplete state when there is incomplete content and peering fails, that is, when there are no complete OSDs which are current enough to perform recovery.
Lets say OSD 1, 2, and 3 are the acting OSD set and it switches to OSD 1, 4, and 3, then osd.1 will request a temporary acting set of OSD 1, 2, and 3 while backfilling 4. During this time, if OSD 1, 2, and 3 all go down, osd.4 will be the only one left which might not have fully backfilled all the data. At this time, the PG will go incomplete indicating that there are no complete OSDs which are current enough to perform recovery.
Alternately, if osd.4 is not involved and the acting set is simply OSD 1, 2, and 3 when OSD 1, 2, and 3 go down, the PG would likely go stale indicating that the mons have not heard anything on that PG since the acting set changed. The reason being there are no OSDs left to notify the new OSDs.
3.2.4. Identifying Troubled Placement Groups
As previously noted, a placement group isn’t necessarily problematic just because its state isn’t active+clean. Generally, Ceph’s ability to self repair may not be working when placement groups get stuck. The stuck states include:
- Unclean: Placement groups contain objects that are not replicated the desired number of times. They should be recovering.
-
Inactive: Placement groups cannot process reads or writes because they are waiting for an OSD with the most up-to-date data to come back
up. -
Stale: Placement groups are in an unknown state, because the OSDs that host them have not reported to the monitor cluster in a while, and can be configured with the
mon osd report timeoutsetting.
To identify stuck placement groups, execute the following:
# ceph pg dump_stuck [unclean|inactive|stale|undersized|degraded]
3.2.5. Finding an Object Location
To store object data in the Ceph Object Store, a Ceph client must:
- Set an object name
- Specify a pool
The Ceph client retrieves the latest cluster map and the CRUSH algorithm calculates how to map the object to a placement group, and then calculates how to assign the placement group to an OSD dynamically. To find the object location, all you need is the object name and the pool name. For example:
# ceph osd map <pool_name> <object_name>
3.3. Monitoring Ceph Clusters with the Red Hat Ceph Storage Dashboard
The Red Hat Ceph Storage Dashboard provides a monitoring dashboard to visualize the state of a Ceph cluster. This section provides information about the Red Hat Ceph Storage Dashboard, its installation, and features.
- To learn about the Dashboard, see Section 3.3.1, “About the Red Hat Ceph Storage Dashboard”.
- To install the Dashboard, see Section 3.3.2, “Installing the Red Hat Ceph Storage Dashboard”.
- To access the Dashboard, see Section 3.3.3, “Accessing the Red Hat Ceph Storage Dashboard”.
- To change the default password after installing the Dashboard, see Section 3.3.4, “Changing the Default Red Hat Ceph Storage Dashboard Password”.
- To learn about the Red Hat Ceph Storage Dashboard alerts and how to configure them, see Section 3.3.5, “The Red Hat Ceph Storage Dashboard Alerts”.
3.3.1. About the Red Hat Ceph Storage Dashboard
This section describes what is the Red Hat Ceph Storage Dashboard and what it provides.
The Red Hat Ceph Storage Dashboard provides a monitoring dashboard for Ceph clusters to visualize the cluster state. The dashboard is accessible from a web browser and provides a number of metrics and graphs about the state of the cluster, Monitors, OSDs, Pools, or network.
The Red Hat Ceph Storage Dashboard uses the following utilities:
- The Ansible automation application to deploy the utility
-
The
collectddaemon to gathers metrics from the cluster - The Graphite monitoring utility to store data and render graphs of this data
- The Grafana platform to provide user interface and alerting
Main Features
The Red Hat Ceph Storage Dashboard supports the following features:
- General Features
- Support for Red Hat Ceph Storage 2 and 3
- SELinux support
- Support for FileStore and BlueStore OSD back ends
- Support for encrypted and non-encrypted OSDs
- Support for Monitor, OSD, the Ceph Object Gateway, and iSCSI roles
- Initial support for the Metadata Servers (MDS)
- Drill down and dashboard links
- 10 second granularity
- Support for Hard Disk Drives (HDD), Solid-state Drives (SSD), Non-volatile Memory Express (NVMe) interface, and Intel® Cache Acceleration Software (Intel® CAS)
- Host Metrics support
- CPU and RAM usage
- Network load
- Configurable Alerts
- Out-of-Band (OOB) alerts and triggers
- Notification channel is automatically defined during the installation
The Ceph Health Summary dashboard created by default
See Section 3.3.5, “The Red Hat Ceph Storage Dashboard Alerts” for details.
- Cluster Summary
- OSD configuration summary
- OSD FileStore and BlueStore summary
- OSD encrypted and non-encrypted summary
- Cluster versions breakdown by role
- Disk size summary
- Host size by capacity and disk count
- Placement Groups (PGs) status breakdown
- The Ceph Block Device and pool counts
- Cluster Details
-
Cluster flags status (
noout,nodown, and others) -
OSD or Ceph Object Gateway hosts
upanddownstatus - Per pool capacity usage
- Raw capacity utilization
- Indicators for active scrub and recovery processes
- Growth tracking and forecast (raw capacity)
-
Information about OSDs that are
downornear full, including the OSD host and disk
-
Cluster flags status (
- OSD Performance
- Information about I/O operations per second (IOPS) and throughput by pool
- OSD performance indicators
- Disk statistics per OSD
- Cluster wide disk throughput
- Read/write ratio (client IOPS)
- Disk utilization heat map
- Network load by Ceph role
- The Ceph Object Gateway Details
- Aggregated load view
- Per host latency and throughput
- iSCSI Details
- Aggregated views
- Configuration
- Performance
- Per Gateway resource utilization
- Per client load and configuration
- Per Ceph Block Device image performance
3.3.2. Installing the Red Hat Ceph Storage Dashboard
The Red Hat Ceph Storage Dashboard provides a visual dashboard to monitor various metrics in a running Ceph Storage Cluster. This section describes how to install the Red Hat Ceph Storage Dashboard.
Prerequisites
- A running Ceph Storage Cluster deployed by using the Ansible automation application. The cluster nodes use Red Hat Enterprise Linux 7. For details, see the Red Hat Ceph Storage 2 Installation Guide for Red Hat Enterprise Linux.
- The same DNS domain for all cluster nodes.
- A separate node (the Red Hat Ceph Storage Dashboard node) for receiving data from the cluster nodes and providing the Red Hat Ceph Storage Dashboard. The size of the monitored cluster influences the Input/output operations per second (IOPS) demands for the Red Hat Ceph Storage Dashboard node. Therefore, Red Hat recommends to use SSD of flash disks.
-
Add the
mon_health_preluminous_compat=trueparameter to the[mon]section in the Ceph configuration file, by default located at/etc/ceph/ceph.conf. Prepare the Red Hat Ceph Storage Dashboard node:
- Register the system with the Red Hat Content Delivery Network (CDN), attach subscriptions, and enable Red Hat Enterprise Linux repositories. For details, see the Registering Red Hat Ceph Storage Nodes to CDN and Attaching Subscriptions section in the Red Hat Ceph Storage 2 Installation Guide for Red Hat Enterprise Linux.
- Enable the Tools repository. For details, see the Enabling the Red Hat Ceph Storage Repositories section in the Red Hat Ceph Storage 2 Installation Guide for Red Hat Enterprise Linux.
If you use a firewall, ensure that the following TCP ports are available:
80,2003,2004,3000,7002. For more details see the Using Firewalls chapter in the Security Guide for Red Hat Enterprise Linux 7.ImportantBy default, Graphite uses the same port (
8080) as the Ceph Object Gateway. Configure one of the services to use a different port if you colocating them on a same node.- If the Red Hat Ceph Storage Dashboard node has an HTTP Apache server configured and it serves content out, installing the Red Hat Ceph Storage Dashboard interferes with this configuration. To avoid this problem, set up a virtual host for the Red Hat Ceph Storage Dashboard. For details, see the Setting Up Virtual Hosts section in the System Administrator’s Guide for Red Hat Enterprise Linux 7.
Procedure
Use the following commands on the Ansible administration node and as the root user.
Install the
cephmetrics-ansiblepackage.[root@admin ~]# yum install cephmetrics-ansible
Add the Red Hat Ceph Storage Dashboard node to under the
[ceph-grafana]section of the Ansible inventory file, by default located at/etc/ansible/hosts.[ceph-grafana] <hostname>
Replace:
-
<hostname>with the name of the Red Hat Ceph Storage Dashboard node
For example:
[ceph-grafana]
node0
-
Change to the
/usr/share/cephmetrics-ansible/directory.[root@admin ~]# cd /usr/share/cephmetrics-ansible
Use the Ansible playbook.
[root@admin cephmetrics-ansible]# ansible-playbook -v playbook.yml
3.3.3. Accessing the Red Hat Ceph Storage Dashboard
This section describes how to access the Red Hat Ceph Storage Dashboard.
Prerequisites
Procedure
Enter the following URL to a web browser:
https://<hostname>:3000
Replace:
-
<hostname>with the name of the Red Hat Ceph Storage Dashboard host
For example:
https://cephmetrics:3000
-
-
Enter the password for the
adminuser. If you did not set the password during the installation, useadmin, which is the default password.
Additional Resources
3.3.4. Changing the Default Red Hat Ceph Storage Dashboard Password
The default user name and password for accessing the Red Hat Ceph Storage Dashboard is set to admin and admin. This section shows how to change the password after the installation.
Prerequisites
Procedure
- Click the Grafana icon in the upper-left corner.
-
Hover over the user name you want to modify the password for. In this case
admin. -
Click
Profile. -
Click
Change Password. -
Enter the new password twice and click
Change Password.
Additional Resources
- If you forgot the password, follow the Reset admin password procedure on the Grafana web pages.
3.3.5. The Red Hat Ceph Storage Dashboard Alerts
This section includes information about alerting in the Red Hat Ceph Storage Dashboard.
- To learn about the Red Hat Ceph Storage Dashboard alerts, see Section 3.3.5.2, “About Alerts”.
- To view the alerts, see Section 3.3.5.3, “Accessing the Alert Status Dashboard”.
- To configure the notification target, see Section 3.3.5.4, “Configuring the Notification Target”.
- To change the default alerts or add new ones, see Section 3.3.5.5, “Changing the Default Alerts and Adding New Ones”.
3.3.5.1. Prerequisites
3.3.5.2. About Alerts
The Red Hat Ceph Storage Dashboard supports alerting mechanism that is provided by the Grafana platform. You can configure the Dashboard to send you a notification when a metric that you are interested in reaches certain value. Such metrics are in the Alert Status dashboard.
By default, Alert Status already includes certain metrics, such as Overall Ceph Health, OSDs Down, or Pool Capacity. You can add metrics that you are interested in to this dashboard or change their trigger values.
3.3.5.3. Accessing the Alert Status Dashboard
Certain Red Hat Ceph Storage Dashboard alerts are configured by default in the Alert Status dashboard. This section shows two ways to access it.
Procedure
To access the dashboard:
- In the main At the Glance dashboard, click the Active Alerts panel in the upper-right corner.
- Click the dashboard menu from in the upper-left corner next to the Grafana icon. Select Alert Status.
3.3.5.4. Configuring the Notification Target
A notification channel called cephmetrics is automatically created during installation. All preconfigured alerts reference the cephmetrics channel but before you can receive the alerts, complete the notification channel definition by selecting the desired notification type. The Grafana platform supports a number of different notification types including email, Slack, and PagerDuty.
Procedure
- To configure the notification channel, follow the instructions in the Alert Notifications section on the Grafana web page.
3.3.5.5. Changing the Default Alerts and Adding New Ones
This section explains how to change the trigger value on already configured alerts and how to add new alerts to the Alert Status dashboard.
Procedure
To change the trigger value on alerts or to add new alerts, follow the Alerting Engine & Rules Guide on the Grafana web pages.
ImportantTo prevent overriding custom alerts, the Alert Status dashboard will not be updated when upgrading the Red Hat Ceph Storage Dashboard packages when you change the trigger values or add new alerts.
3.3.6. Additional Resources
- The Grafana web page
- The collectd web page
- The Graphite web page
Chapter 4. Overrides
By default, Ceph will reflect the current status of OSDs and perform normal operations such as rebalancing, recovering, and scrubbing. From time to time, it may be advantageous to override Ceph’s default behavior.
4.1. Setting and Unsetting Overrides
To override Ceph’s default behavior, use the ceph osd set command and the behavior you wish to override. For example:
# ceph osd set <flag>
Once you set the behavior, ceph health will reflect the override(s) that you have set for the cluster.
To cease overriding Ceph’s default behavior, use the ceph osd unset command and the override you wish to cease. For example:
# ceph osd unset <flag>
| Flag | Description |
|---|---|
|
|
Prevents OSDs from being treated as |
|
|
Prevents OSDs from being treated as |
|
|
Prevents OSDs from being treated as |
|
|
Prevents OSDs from being treated as |
|
|
Makes a cluster appear to have reached its |
|
|
Ceph will stop processing read and write operations, but will not affect OSD |
|
| Ceph will prevent new backfill operations. |
|
| Ceph will prevent new rebalancing operations. |
|
| Ceph will prevent new recovery operations. |
|
| Ceph will prevent new scrubbing operations. |
|
| Ceph will prevent new deep scrubbing operations. |
|
| Ceph will disable the process that is looking for cold/dirty objects to flush and evict. |
4.2. Use Cases
-
noin: Commonly used withnooutto address flapping OSDs. -
noout: If themon osd report timeoutis exceeded and an OSD has not reported to the monitor, the OSD will get markedout. If this happens erroneously, you can setnooutto prevent the OSD(s) from getting markedoutwhile you troubleshoot the issue. -
noup: Commonly used withnodownto address flapping OSDs. -
nodown: Networking issues may interrupt Ceph 'heartbeat' processes, and an OSD may beupbut still get marked down. You can setnodownto prevent OSDs from getting marked down while troubleshooting the issue. -
full: If a cluster is reaching itsfull_ratio, you can pre-emptively set the cluster tofulland expand capacity. NOTE: Setting the cluster tofullwill prevent write operations. -
pause: If you need to troubleshoot a running Ceph cluster without clients reading and writing data, you can set the cluster topauseto prevent client operations. -
nobackfill: If you need to take an OSD or nodedowntemporarily, (e.g., upgrading daemons), you can setnobackfillso that Ceph will not backfill while the OSD(s) isdown. -
norecover: If you need to replace an OSD disk and don’t want the PGs to recover to another OSD while you are hotswapping disks, you can setnorecoverto prevent the other OSDs from copying a new set of PGs to other OSDs. -
noscrubandnodeep-scrubb: If you want to prevent scrubbing (e.g., to reduce overhead during high loads, recovery, backfilling, rebalancing, etc.), you can setnoscruband/ornodeep-scrubto prevent the cluster from scrubbing OSDs. -
notieragent: If you want to stop the tier agent process from finding cold objects to flush to the backing storage tier, you may setnotieragent.
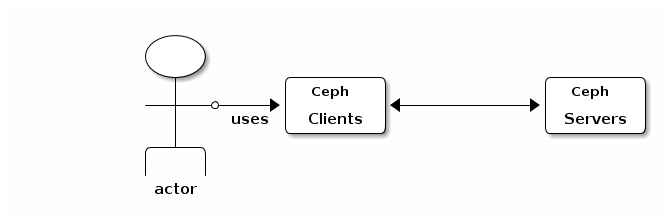
Chapter 5. User Management
This section describes Ceph client users, and their authentication and authorization with the Red Hat Ceph Storage cluster. Users are either individuals or system actors such as applications, which use Ceph clients to interact with the Red Hat Ceph Storage cluster daemons.
When Ceph runs with authentication and authorization enabled (enabled by default), you must specify a user name and a keyring containing the secret key of the specified user (usually by using the command line). If you do not specify a user name, Ceph will use the client.admin administrative user as the default user name. If you do not specify a keyring, Ceph will look for a keyring by using the keyring setting in the Ceph configuration. For example, if you execute the ceph health command without specifying a user or keyring:
# ceph health
Ceph interprets the command like this:
# ceph -n client.admin --keyring=/etc/ceph/ceph.client.admin.keyring health
Alternatively, you may use the CEPH_ARGS environment variable to avoid re-entry of the user name and secret.
For details on configuring the Red Hat Ceph Storage cluster to use authentication, see the Red Hat Ceph Storage 2 Configuration Guide.
5.1. Background
Irrespective of the type of Ceph client, for example, block device, object store, file system, native API, or the Ceph command line, Ceph stores all data as objects within pools. Ceph users must have access to pools in order to read and write data. Additionally, administrative Ceph users must have permissions to execute Ceph’s administrative commands. The following concepts will help you understand Ceph user management.
5.1.1. User
A user of the Red Hat Ceph Storage cluster is either an individual or a system actor such as an application. Creating users allows you to control who (or what) can access the storage cluster, its pools, and the data within pools.
Ceph has the notion of a type of user. For the purposes of user management, the type will always be client. Ceph identifies users in period (.) delimited form consisting of the user type and the user ID: for example, TYPE.ID, client.admin, or client.user1. The reason for user typing is that Ceph monitors, and OSDs also use the Cephx protocol, but they are not clients. Distinguishing the user type helps to distinguish between client users and other users—streamlining access control, user monitoring and traceability.
Sometimes Ceph’s user type may seem confusing, because the Ceph command line allows you to specify a user with or without the type, depending upon the command line usage. If you specify --user or --id, you can omit the type. So client.user1 can be entered simply as user1. If you specify --name or -n, you must specify the type and name, such as client.user1. We recommend using the type and name as a best practice wherever possible.
A Red Hat Ceph Storage cluster user is not the same as a Ceph Object Storage user. The object gateway uses a Red Hat Ceph Storage cluster user to communicate between the gateway daemon and the storage cluster, but the gateway has its own user management functionality for its end users.
5.1.2. Authorization (Capabilities)
Ceph uses the term "capabilities" (caps) to describe authorizing an authenticated user to exercise the functionality of the monitors and OSDs. Capabilities can also restrict access to data within a pool or a namespace within a pool. A Ceph administrative user sets a user’s capabilities when creating or updating a user.
Capability syntax follows the form:
<daemon_type> 'allow <capability>' [<daemon_type> 'allow <capability>']
Monitor Caps: Monitor capabilities include
r,w,xandallow profile <cap>. For example:mon 'allow rwx` mon 'allow profile osd'
OSD Caps: OSD capabilities include
r,w,x,class-read,class-writeandprofile osd. Additionally, OSD capabilities also allow for pool and namespace settings. :osd 'allow <capability>' [pool=<pool_name>] [namespace=<namespace_name>]
The Ceph Object Gateway daemon (radosgw) is a client of the Ceph Storage Cluster, so it isn’t represented as a Ceph Storage Cluster daemon type.
The following entries describe each capability.
allow
- Description
- Precedes access settings for a daemon.
r
- Description
- Gives the user read access. Required with monitors to retrieve the CRUSH map.
w
- Description
- Gives the user write access to objects.
x
- Description
-
Gives the user the capability to call class methods (i.e., both read and write) and to conduct
authoperations on monitors.
class-read
- Descriptions
-
Gives the user the capability to call class read methods. Subset of
x.
class-write
- Description
-
Gives the user the capability to call class write methods. Subset of
x.
*
- Description
- Gives the user read, write and execute permissions for a particular daemon/pool, and the ability to execute admin commands.
profile osd
- Description
- Gives a user permissions to connect as an OSD to other OSDs or monitors. Conferred on OSDs to enable OSDs to handle replication heartbeat traffic and status reporting.
profile bootstrap-osd
- Description
- Gives a user permissions to bootstrap an OSD, so that they have permissions to add keys when bootstrapping an OSD.
5.1.3. Pool
A pool defines a storage strategy for Ceph clients, and acts as a logical partition for that strategy.
In Ceph deployments, it is common to create a pool to support different types of use cases, for example, cloud volumes/images, object storage, hot storage, cold storage, and so on. When deploying Ceph as a back end for OpenStack, a typical deployment would have pools for volumes, images, backups and virtual machines, and users such as client.glance, client.cinder, and so on.
5.1.4. Namespace
Objects within a pool can be associated to a namespace—a logical group of objects within the pool. A user’s access to a pool can be associated with a namespace such that reads and writes by the user take place only within the namespace. Objects written to a namespace within the pool can only be accessed by users who have access to the namespace.
Currently, namespaces are only useful for applications written on top of librados. Ceph clients such as block device and object storage do not currently support this feature.
The rationale for namespaces is that pools can be a computationally expensive method of segregating data by use case, because each pool creates a set of placement groups that get mapped to OSDs. If multiple pools use the same CRUSH hierarchy and ruleset, OSD performance may degrade as load increases.
For example, a pool should have approximately 100 placement groups per OSD. So an exemplary cluster with 1000 OSDs would have 100,000 placement groups for one pool. Each pool mapped to the same CRUSH hierarchy and ruleset would create another 100,000 placement groups in the exemplary cluster. By contrast, writing an object to a namespace simply associates the namespace to the object name with out the computational overhead of a separate pool. Rather than creating a separate pool for a user or set of users, you may use a namespace.
Only available using librados at this time.
5.2. Managing Users
User management functionality provides system administrators with the ability to create, update and delete Red Hat Ceph Storage cluster users.
When you create or delete users in a Red Hat Ceph Storage cluster, you may need to distribute keys to clients so that they can be added to keyrings. See Keyring Management for details.
5.2.1. List Users
To list the users in the storage cluster, execute the following:
# ceph auth list
Ceph will list out all users in the storage cluster. For example, in a two-node exemplary storage cluster, ceph auth list will output something that looks like this:
installed auth entries:

osd.0
    key: AQCvCbtToC6MDhAATtuT70Sl+DymPCfDSsyV4w==
    caps: [mon] allow profile osd
    caps: [osd] allow *
osd.1
    key: AQC4CbtTCFJBChAAVq5spj0ff4eHZICxIOVZeA==
    caps: [mon] allow profile osd
    caps: [osd] allow *
client.admin
    key: AQBHCbtT6APDHhAA5W00cBchwkQjh3dkKsyPjw==
    caps: [mds] allow
    caps: [mon] allow *
    caps: [osd] allow *
client.bootstrap-mds
    key: AQBICbtTOK9uGBAAdbe5zcIGHZL3T/u2g6EBww==
    caps: [mon] allow profile bootstrap-mds
client.bootstrap-osd
    key: AQBHCbtT4GxqORAADE5u7RkpCN/oo4e5W0uBtw==
    caps: [mon] allow profile bootstrap-osd
Note that the TYPE.ID notation for users applies such that osd.0 is a user of type osd and its ID is 0, client.admin is a user of type client and its ID is admin, that is, the default client.admin user. Note also that each entry has a key: <value> entry, and one or more caps: entries.
You may use the -o <file_name> option with ceph auth list to save the output to a file.
5.2.2. Get a User
To retrieve a specific user, key and capabilities, execute the following:
Syntax
# ceph auth get <TYPE.ID>
Example
# ceph auth get client.admin
You may also use the -o <file_name> option with ceph auth get to save the output to a file. Developers may also execute the following:
Syntax
# ceph auth export <TYPE.ID>
Example
# ceph auth export client.admin
The auth export command is identical to auth get, but also prints out the internal auid, which isn’t relevant to end users.
5.2.3. Add a User
Adding a user creates a username, that is, TYPE.ID, a secret key and any capabilities included in the command you use to create the user.
A user’s key enables the user to authenticate with the Ceph Storage Cluster. The user’s capabilities authorize the user to read, write, or execute on Ceph monitors (mon), Ceph OSDs (osd) or Ceph Metadata Servers (mds).
There are a few ways to add a user:
-
ceph auth add: This command is the canonical way to add a user. It will create the user, generate a key and add any specified capabilities. -
ceph auth get-or-create: This command is often the most convenient way to create a user, because it returns a keyfile format with the user name (in brackets) and the key. If the user already exists, this command simply returns the user name and key in the keyfile format. You may use the-o <file_name>option to save the output to a file. -
ceph auth get-or-create-key: This command is a convenient way to create a user and return the user’s key only. This is useful for clients that need the key only, for example,libvirt. If the user already exists, this command simply returns the key. You may use the-o <file_name>option to save the output to a file.
When creating client users, you may create a user with no capabilities. A user with no capabilities is useless beyond mere authentication, because the client cannot retrieve the cluster map from the monitor. However, you can create a user with no capabilities if you wish to defer adding capabilities later using the ceph auth caps command.
A typical user has at least read capabilities on the Ceph monitor and read and write capability on Ceph OSDs. Additionally, a user’s OSD permissions are often restricted to accessing a particular pool. :
# ceph auth add client.john mon 'allow r' osd 'allow rw pool=liverpool'
# ceph auth get-or-create client.paul mon 'allow r' osd 'allow rw pool=liverpool'
# ceph auth get-or-create client.george mon 'allow r' osd 'allow rw pool=liverpool' -o george.keyring
# ceph auth get-or-create-key client.ringo mon 'allow r' osd 'allow rw pool=liverpool' -o ringo.key
If you provide a user with capabilities to OSDs, but you DO NOT restrict access to particular pools, the user will have access to ALL pools in the cluster!
5.2.4. Modify User Capabilities
The ceph auth caps command allows you to specify a user and change the user’s capabilties. To add capabilities, use the form:
Syntax
# ceph auth caps <USERTYPE.USERID> <daemon> 'allow [r|w|x|*|...] [pool=<pool_name>] [namespace=<namespace_name>]'
Example
# ceph auth caps client.john mon 'allow r' osd 'allow rw pool=liverpool'
# ceph auth caps client.paul mon 'allow rw' osd 'allow rwx pool=liverpool'
# ceph auth caps client.brian-manager mon 'allow *' osd 'allow *'
To remove a capability, you may reset the capability. If you want the user to have no access to a particular daemon that was previously set, specify an empty string. For example:
# ceph auth caps client.ringo mon ' ' osd ' '
See Section 5.1.2, “Authorization (Capabilities)” for additional details on capabilities.
5.2.5. Delete a User
To delete a user, use ceph auth del:
# ceph auth del {TYPE}.{ID}
Where {TYPE} is one of client, osd, mon, or mds, and {ID} is the user name or ID of the daemon.
5.2.6. Print a User’s Key
To print a user’s authentication key to standard output, execute the following:
# ceph auth print-key <TYPE>.<ID>
Where <TYPE> is one of client, osd, mon, or mds, and <ID> is the user name or ID of the daemon.
Printing a user’s key is useful when you need to populate client software with a user’s key, for example, libvirt.
# mount -t ceph <hostname>:/<mount_point> -o name=client.user,secret=`ceph auth print-key client.user`
5.2.7. Import a User
To import one or more users, use ceph auth import and specify a keyring:
Syntax
# ceph auth import -i </path/to/keyring>
Example
# ceph auth import -i /etc/ceph/ceph.keyring
The ceph storage cluster will add new users, their keys and their capabilities and will update existing users, their keys and their capabilities.
5.3. Keyring Management
When you access Ceph by using a Ceph client, the Ceph client will look for a local keyring. Ceph presets the keyring setting with the following four keyring names by default so you don’t have to set them in the Ceph configuration file unless you want to override the defaults, which is not recommended:
-
/etc/ceph/$cluster.$name.keyring -
/etc/ceph/$cluster.keyring -
/etc/ceph/keyring -
/etc/ceph/keyring.bin
The $cluster metavariable is the Ceph storage cluster name as defined by the name of the Ceph configuration file, that is, ceph.conf means the cluster name is ceph; thus, ceph.keyring. The $name metavariable is the user type and user ID, for example, client.admin; thus, ceph.client.admin.keyring.
When executing commands that read or write to /etc/ceph, you may need to use sudo to execute the command as root.
After you create a user, for example, client.ringo, you must get the key and add it to a keyring on a Ceph client so that the user can access the Ceph Storage Cluster.
See Chapter 5, User Management for details on how to list, get, add, modify and delete users directly in the Ceph Storage Cluster. However, Ceph also provides the ceph-authtool utility to allow you to manage keyrings from a Ceph client.
5.3.1. Create a Keyring
When you use the procedures in the Managing Users_ section to create users, you need to provide user keys to the Ceph client(s) so that the Ceph client can retrieve the key for the specified user and authenticate with the Ceph Storage Cluster. Ceph Clients access keyrings to lookup a user name and retrieve the user’s key.
The ceph-authtool utility allows you to create a keyring. To create an empty keyring, use --create-keyring or -C. For example:
# ceph-authtool --create-keyring /path/to/keyring
When creating a keyring with multiple users, we recommend using the cluster name, for example, $cluster.keyring for the keyring file name and saving it in the /etc/ceph/ directory so that the keyring configuration default setting will pick up the filename without requiring you to specify it in the local copy of the Ceph configuration file. For example, create ceph.keyring by executing the following:
# ceph-authtool -C /etc/ceph/ceph.keyring
When creating a keyring with a single user, we recommend using the cluster name, the user type and the user name and saving it in the /etc/ceph/ directory. For example, ceph.client.admin.keyring for the client.admin user.
To create a keyring in /etc/ceph/, you must do so as root. This means the file will have rw permissions for the root user only, which is appropriate when the keyring contains administrator keys. However, if you intend to use the keyring for a particular user or group of users, ensure that you execute chown or chmod to establish appropriate keyring ownership and access.
5.3.2. Add a User to a Keyring
When you add a user to the Ceph storage cluster, you can use the get procedure to retrieve a user, key and capabilities, then save the user to a keyring file.
When you only want to use one user per keyring, the Get a User_ procedure with the -o option will save the output in the keyring file format. For example, to create a keyring for the client.admin user, execute the following:
# ceph auth get client.admin -o /etc/ceph/ceph.client.admin.keyring
Notice that we use the recommended file format for an individual user.
When you want to import users to a keyring, you can use ceph-authtool to specify the destination keyring and the source keyring. For example:
# ceph-authtool /etc/ceph/ceph.keyring --import-keyring /etc/ceph/ceph.client.admin.keyring
5.3.3. Create a User
Ceph provides the Add a User_ function to create a user directly in the Ceph Storage Cluster. However, you can also create a user, keys and capabilities directly on a Ceph client keyring. Then, you can import the user to the Ceph Storage Cluster. For example:
# ceph-authtool -n client.ringo --cap osd 'allow rwx' --cap mon 'allow rwx' /etc/ceph/ceph.keyring
See Section 5.1.2, “Authorization (Capabilities)” for additional details on capabilities.
You can also create a keyring and add a new user to the keyring simultaneously. For example:
# ceph-authtool -C /etc/ceph/ceph.keyring -n client.ringo --cap osd 'allow rwx' --cap mon 'allow rwx' --gen-key
In the foregoing scenarios, the new user client.ringo is only in the keyring. To add the new user to the Ceph Storage Cluster, you must still add the new user to the Ceph Storage Cluster. :
# ceph auth add client.ringo -i /etc/ceph/ceph.keyring
5.3.4. Modify a User
To modify the capabilities of a user record in a keyring, specify the keyring, and the user followed by the capabilities, for example:
# ceph-authtool /etc/ceph/ceph.keyring -n client.ringo --cap osd 'allow rwx' --cap mon 'allow rwx'
To update the user to the Ceph storage cluster, you must update the user in the keyring to the user entry in the the Ceph storage cluster:
# ceph auth import -i /etc/ceph/ceph.keyring
See Section 5.2.7, “Import a User” for details on updating a Ceph Storage Cluster user from a keyring.
You may also modify user capabilities directly in the storage cluster, store the results to a keyring file; then, import the keyring into the main ceph.keyring file.
5.4. Command Line Usage
Ceph supports the following usage for user name and secret:
--id | --user
- Description
-
Ceph identifies users with a type and an ID (e.g.,
TYPE.IDorclient.admin,client.user1). Theid,nameand-noptions enable you to specify the ID portion of the user name (e.g.,admin,user1,foo, etc.). You can specify the user with the--idand omit the type. For example, to specify userclient.fooenter the following: +
# ceph --id foo --keyring /path/to/keyring health
# ceph --user foo --keyring /path/to/keyring health
--name | -n
- Description
-
Ceph identifies users with a type and an ID (e.g.,
TYPE.IDorclient.admin,client.user1). The--nameand-noptions enables you to specify the fully qualified user name. You must specify the user type (typicallyclient) with the user ID. For example: +
# ceph --name client.foo --keyring /path/to/keyring health
# ceph -n client.foo --keyring /path/to/keyring health
--keyring
- Description
-
The path to the keyring containing one or more user name and secret. The
--secretoption provides the same functionality, but it does not work with Ceph RADOS Gateway, which uses--secretfor another purpose. You may retrieve a keyring withceph auth get-or-createand store it locally. This is a preferred approach, because you can switch user names without switching the keyring path. For example: +
# rbd map foo --pool rbd myimage --id client.foo --keyring /path/to/keyring
5.5. Limitations
The cephx protocol authenticates Ceph clients and servers to each other. It is not intended to handle authentication of human users or application programs run on their behalf. If that effect is required to handle the access control needs, you must have another mechanism, which is likely to be specific to the front end used to access the Ceph object store. This other mechanism has the role of ensuring that only acceptable users and programs are able to run on the machine that Ceph will permit to access its object store.
The keys used to authenticate Ceph clients and servers are typically stored in a plain text file with appropriate permissions in a trusted host.
Storing keys in plaintext files has security shortcomings, but they are difficult to avoid, given the basic authentication methods Ceph uses in the background. Those setting up Ceph systems should be aware of these shortcomings.
In particular, arbitrary user machines, especially portable machines, should not be configured to interact directly with Ceph, since that mode of use would require the storage of a plaintext authentication key on an insecure machine. Anyone who stole that machine or obtained surreptitious access to it could obtain the key that will allow them to authenticate their own machines to Ceph.
Rather than permitting potentially insecure machines to access a Ceph object store directly, users should be required to sign in to a trusted machine in the environment using a method that provides sufficient security for the purposes. That trusted machine will store the plaintext Ceph keys for the human users. A future version of Ceph may address these particular authentication issues more fully.
At the moment, none of the Ceph authentication protocols provide secrecy for messages in transit. Thus, an eavesdropper on the wire can hear and understand all data sent between clients and servers in Ceph, even if he cannot create or alter them. Further, Ceph does not include options to encrypt user data in the object store. Users can hand-encrypt and store their own data in the Ceph object store, of course, but Ceph provides no features to perform object encryption itself. Those storing sensitive data in Ceph should consider encrypting their data before providing it to the Ceph system.
Chapter 6. Managing Cluster Size
Managing cluster size generally involves adding or removing Ceph Monitors or OSDs. If you are bootstrapping a cluster for the first time, see the Red Hat Ceph Storage 2 Installation Guide for Red Hat Enterprise Linux or Ubuntu.
6.1. Adding a Monitor
Ceph Monitors are light-weight processes that maintain a master copy of the cluster map. All Ceph clients contact a Ceph Monitor and retrieve the current copy of the cluster map, enabling clients to bind to a pool and read and write data.
Ceph Monitors use a variation of the Paxos protocol to establish consensus about maps and other critical information across the cluster. Due to the nature of Paxos, Ceph requires a majority of Monitors running to establish a quorum thus establishing consensus.
Red Hat requires at least three Monitors on separate hosts to receive support for a production cluster.
Red Hat recommends deploying an odd number of Monitors, but it is not mandatory. An odd number of Monitors has a higher resiliency to failures than an even number of Monitors. For example, to maintain a quorum on a two Monitor deployment, Ceph cannot tolerate any failures; with three Monitors, one failure; with four Monitors, one failure; with five Monitors, two failures. This is why an odd number is advisable. Summarizing, Ceph needs a majority of Monitors to be running and to be able to communicate with each other, two out of three, three out of four, and so on.
For an initial deployment of a multi-node Ceph cluster, Red Hat requires three Monitors, increasing the number two at a time if a valid need for more than three Monitors exists.
Since Monitors are light-weight, it is possible to run them on the same host as OpenStack nodes. However, Red Hat recommends running Monitors on separate hosts. Co-locating Monitors and OSDs on the same node can impair performance and is not supported.
A majority of Monitors in the storage cluster must be able to reach each other in order to establish a quorum.
6.1.1. Configuring a Host
When adding Ceph Monitors to a cluster, deploy them on separate nodes. Running Ceph Monitors on the same node does not provide any additional high availability assurance if a node fails. Ideally, the node hardware should be uniform for all Monitor nodes in the storage cluster.
For details on the minimum recommendations for Ceph Monitor hardware, see the Red Hat Ceph Storage Hardware Guide.
Before doing a new installation, review the requirements listed in the Prerequisites section in the Red Hat Ceph Storage Installation Guide for Red Hat Enterprise Linux or Ubuntu.
Add a new Monitor node to a rack in the cluster, connect it to the network and ensure that the Monitor has network connectivity.
You must install NTP and open port 6789.
6.1.2. Adding a Monitor with Ansible
Before You Start…
- Review the prerequisite procedures for using Red Hat Enterprise Linux or Ubuntu nodes.
Red Hat recommends adding two Monitors at a time to maintain an odd number of Monitors. For example, if you have a three Monitor cluster, Red Hat recommends expanding it to a five Monitor cluster.
To add a new Ceph Monitor to an existing Ansible cluster, simply open the /etc/ansible/hosts file and add another Monitor node under the [mons] section. Next, run the Ansible playbook again.
As
root, add the Ceph Monitor hosts to the/etc/ansible/hostsfile. Add Monitors under a[mons]section:[mons] <monitor-host-name> <monitor-host-name> <monitor-host-name> <new-monitor-host-name> <new-monitor-host-name>
Ensure that Ansible can reach the Ceph nodes:
# ansible all -m ping
Navigate to the Ansible configuration directory:
# cd /usr/share/ceph-ansible
Run the Ansible playbook:
$ ansible-playbook site.yml
If adding a monitor in Ceph deployed in a container:
$ ansible-playbook site-docker.yml
++ NOTE: If adding a node after upgrading
ceph-ansiblefrom a previous version, be sure to use the corresponding version of thesite-docker.ymlandsite.ymlfiles with respect toceph-ansible. Updatingceph-ansiblereplacessite-docker.yml sampleandsite.yml sample, but notsite-docker.ymlandsite.yml.
Ansible will add the new Monitors to the Ceph storage cluster.
6.1.3. Adding a Monitor with the Command Line Interface
This procedure creates a ceph-mon data directory, retrieves the Monitor map and Monitor keyring, and adds a ceph-mon daemon to the cluster. Add more Ceph Monitors by repeating this procedure until you have a sufficient number of ceph-mon daemons to achieve a quorum.
By convention, Ceph Monitors use the host name of the node where the ceph-mon daemon is running, and Red Hat recommends only running one Monitor daemon per node. The Ceph Monitor identifier in the Ceph configuration file can be defined as you see fit. For the purpose of this document, the Monitor identifier, <mon_id>, is the host name of the Monitor node.
Add the Red Hat Ceph Storage 2 Monitor repository.
As
root, install theceph-monpackage on the new Ceph Monitor node:Red Hat Enterprise Linux
# yum install ceph-mon
Ubuntu
$ sudo apt-get install ceph-mon
To ensure the cluster identifies the Monitor on start or restart, add the Monitor IP address to the Ceph configuration file.
To add the new Monitor in the
[mon]or[global]section of the Ceph configuration file on an existing Monitor node in the storage cluster. Themon_hostsetting, which is a list of DNS-resolvable host names or IP addresses, separated by "," or ";" or " ". Optionally, you can create a specific section in the Ceph configuration file for the new Monitor node:Syntax
[mon]
mon host = <mon_ip:port> <mon_ip:port> ... <new_mon_ip:port>

[mon.<mon_id>]
host = <mon_id>
mon addr = <mon_ip>
If you want to make the Monitor part of the initial quorum, you must also add the host name to the
mon_initial_membersparameter in the[global]section of the Ceph configuration file.ImportantIf you are adding a Monitor to a cluster that has only one Monitor, you MUST add the next two Monitors to
mon_initial_membersandmon_host. Production clusters REQUIRE at least three Monitors set inmon_initial_membersandmon_hostto ensure high availability. If a cluster with only one initial Monitor adds two more Monitors but does not add them tomon_initial_membersandmon_host, the failure of the initial Monitor will cause the cluster to lock up. If the Monitor you are adding is replacing a Monitor that is part ofmon_initial_membersandmon_host, the new Monitor must be added tomon_initial_membersandmon_hosttoo.Example
[global]
mon initial members = node1 node2 node3 node4
...
[mon]
mon host = 192.168.0.1:6789 192.168.0.2:6789 192.168.0.3:6789 192.168.0.4:6789
...
[mon.node4]
host = node4
mon addr = 192.168.0.4
Finally, send a new copy of the Ceph configuration file to the Ceph nodes and Ceph clients.
Syntax
# scp /etc/ceph/<cluster_name>.conf <target_host_name>:/etc/ceph
Example
# scp /etc/ceph/ceph.conf node4:/etc/ceph
Create the default Monitor directory on the new node:
Syntax
# mkdir /var/lib/ceph/mon/<cluster_name>-<mon_id>
Example
# mkdir /var/lib/ceph/mon/ceph-node4
Create a temporary directory
<temp_directory>to keep the files needed during this process. This directory should be different from the Monitor’s default directory created in the previous step, and can be removed after all the steps are executed:Syntax
# mkdir <temp_directory>
Exmaple
# mkdir /tmp/ceph
Copy the admin key from a running Monitor node to the new Monitor node so that you can run
cephcommands:Syntax
# scp /etc/ceph/<cluster_name>.client.admin.keyring <target_host_name>:/etc/ceph
Example
# scp /etc/ceph/ceph.client.admin.keyring node4:/etc/ceph
Retrieve the Monitor keyring, where
<temp_directory>is the path to the retrieved keyring, and<key_file_name>is the name of the file containing the retrieved Monitor keyring:Syntax
# ceph auth get mon. -o /<temp_directory>/<key_file_name>
Example
# ceph auth get mon. -o /tmp/ceph/ceph_keyring.out
Retrieve the Monitor map, where
<tmp>is the path to the retrieved Monitor map, and<mon_map_file_name>is the name of the file containing the retrieved Monitor map:Syntax
# ceph mon getmap -o /<temp_directory>/<mon_map_filename>
Example
# ceph mon getmap -o /tmp/ceph/ceph_mon_map.out
Prepare the Monitor’s data directory created in the fourth step. You must specify the path to the Monitor map so that you can retrieve the information about a quorum of Monitors and their
fsid. You must also specify a path to the Monitor keyring:Syntax
# ceph-mon -i <mon_id> --mkfs --monmap /<temp_directory>/<mon_map_filename> --keyring /<temp_directory>/<key_file_name>
Example
# ceph-mon -i node4 --mkfs --monmap /tmp/ceph/ceph_mon_map.out --keyring /tmp/ceph/ceph_keyring.out
For storage clusters with custom names, as
root, add the the following line to the appropriate file:Red Hat Enterprise Linux
# echo "CLUSTER=<custom_cluster_name>" >> /etc/sysconfig/ceph
Ubuntu
$ sudo echo "CLUSTER=<custom_cluster_name>" >> /etc/default/ceph
As
root, update the owner and group permissions:Syntax
# chown -R <owner>:<group> <path_to_directory>
Example
# chown -R ceph:ceph /var/lib/ceph/mon
# chown -R ceph:ceph /var/log/ceph
# chown -R ceph:ceph /var/run/ceph
# chown -R ceph:ceph /etc/ceph
As
root, enable and start theceph-monprocess on the new Monitor node:Syntax
# systemctl enable ceph-mon.target
# systemctl enable ceph-mon@<monitor_host_name>
# systemctl start ceph-mon@<monitor_host_name>
Example
# systemctl enable ceph-mon.target
# systemctl enable ceph-mon@node4
# systemctl start ceph-mon@node4
6.2. Removing a Monitor
When you remove monitors from a cluster, consider that Ceph monitors use PAXOS to establish consensus about the master cluster map. You must have a sufficient number of monitors to establish a quorum for consensus about the cluster map.
6.2.1. Removing a Monitor with the Command Line Interface
This procedure removes a ceph-mon daemon from the storage cluster. If this procedure results in only two monitor daemons, you may add or remove another monitor until you have a number of ceph-mon daemons that can achieve a quorum.
As
root, stop the monitor:Syntax
# systemctl stop ceph-mon@<monitor_hostname>
Example
# systemctl stop ceph-mon@node1
Remove the monitor from the cluster:
# ceph mon remove <mon_id>
- On the Ceph Monitor node, remove the Monitor entry from the Ceph configuration file.
Redistribute the Ceph configuration file:
# scp /etc/ceph/ceph.conf <user>@<target_hostname>:/etc/ceph/
Optionally, archive the monitor data:
# mv /var/lib/ceph/mon/<cluster>-<daemon_id> /var/lib/ceph/mon/removed-<cluster>-<daemon_id>
Remove the monitor data, only if the previous archive step is executed:
# rm -r /var/lib/ceph/mon/<cluster>-<daemon_id>
6.2.2. Removing Monitors from an Unhealthy Cluster
This procedure removes a ceph-mon daemon from an unhealhty cluster. For example, a cluster that has placement groups persistently not active + clean.
Identify a surviving monitor and log in to that host. :
# ceph mon dump
# ssh <monitor_hostname>
As
root, stop theceph-mondaemon and extract a copy of the monap file. :Syntax
# systemctl stop ceph-mon@<monitor_hostname>
# ceph-mon -i <monitor_id> --extract-monmap <map_path>
Example
# systemctl stop ceph-mon@node1
# ceph-mon -i a --extract-monmap /tmp/monmap
Remove the non-surviving monitors. For example, if you have three monitors,
mon.a,mon.b, andmon.c, where onlymon.awill survive, follow the example below:Syntax
# monmaptool <map_path> --rm <monitor_id>
Example
# monmaptool /tmp/monmap --rm b
# monmaptool /tmp/monmap --rm c
Inject the surviving map with the removed monitors into the surviving monitors. For example, to inject a map into monitor
mon.a, follow the example below:Syntax
# ceph-mon -i <monitor_id> --inject-monmap <map_path>
Example
# ceph-mon -i a --inject-monmap /tmp/monmap
6.3. Adding an OSD
When a cluster is up and running, you can add OSDs or remove OSDs from the cluster at runtime.
A Ceph OSD generally consists of one ceph-osd daemon for one storage drive and its associated journal within a host machine. If a host has multiple storage drives, map one ceph-osd daemon for each drive.
Red Hat recommends checking the capacity of a cluster regularly to see if it is reaching the upper end of its storage capacity. As a cluster reaches its near full ratio, add one or more OSDs to expand the cluster’s capacity.
Do not let a cluster reach the full ratio before adding an OSD. OSD failures that occur after the cluster reaches the near full ratio can cause the cluster to exceed the full ratio. Ceph blocks write access to protect the data until you resolve the storage capacity issues. Do not remove OSDs without considering the impact on the full ratio first.
6.3.1. Configuring a Host
OSDs and their supporting hardware should be similarly configured as a storage strategy for the pool(s) that will use the OSDs. Ceph prefers uniform hardware across pools for a consistent performance profile. For best performance, consider a CRUSH hierarchy with drives of the same type or size. View the Storage Strategies guide for details.
If you add drives of dissimilar size, adjust their weights. When you add the OSD to the CRUSH map, consider the weight for the new OSD. Hard drive capacity grows approximately 40% per year, so newer OSD hosts might have larger hard drives than older hosts in the cluster, that is, they might have greater weight.
Before doing a new OSD installation, review the requirements listed in the Prerequisites section in the Red Hat Ceph Storage Installation Guide for Red Hat Enterprise Linux or Ubuntu.
6.3.2. Adding an OSD with Ansible
Before You Start…
- Review the prerequisite procedures for using Red Hat Enterprise Linux or Ubuntu nodes.
Using the Same Disk Topology
To add a new Ceph OSD node(s) to an existing storage cluster, under Ansible’s control, open the /etc/ansible/hosts file and add the new OSD node under the [osds] section.
An OSD node(s) should have the same number of OSD data drives and the same drive paths as other OSD nodes in the storage cluster. Ansible will add the same number of OSDs as other OSD nodes using the same paths specified in the devices: section of the /usr/share/ceph-ansible/group_vars/osds file.
As
root, add the Ceph OSD host(s) to the/etc/ansible/hostsfile, under the[osds]section:[osds] ... <existing_osd-host-name> <new_osd-host-name>
Ensure that Ansible can reach the Ceph hosts:
$ ansible all -m ping
Navigate to the Ansible configuration directory:
$ cd /usr/share/ceph-ansible
Run the Ansible playbook:
$ ansible-playbook site.yml
If adding an OSD in Ceph deployed in a container:
$ ansible-playbook site-docker.yml
++ NOTE: If adding a node after upgrading
ceph-ansbilefrom a previous version, be sure to use the corresponding version of thesite-docker.ymlandsite.ymlfiles with respect toceph-ansible. Updatingceph-ansiblereplacessite-docker.yml sampleandsite.yml sample, but notsite-docker.ymlandsite.yml.
Ansible will add the new OSD node(s) to the Ceph storage cluster.
The new OSD node(s) will have the same configuration as the rest of the OSDs.
Using Different Disk Topologies
If the new Ceph OSD node(s) is(are) using a different disk topology, then there are two approaches for adding the new OSD node(s) to an existing storage cluster.
First Approach
As
root, add the new Ceph OSD node(s) to the/etc/ansible/hostsfile, under the[osds]section. Append the new OSD node name to the end of the OSD list. For example, adding the OSD nodenew_osdnode10:[osds] ... existing_osdnode09 new_osdnode10
As
root, create a new file for each new Ceph OSD node added to the storage cluster. Name the new file the same as the new Ceph OSD node name. Create this new file under the/etc/ansible/host_vars/directory, for example:# touch /etc/ansible/host_vars/new_osdnode10
As
root, edit the new file, and add thedevices:andraw_journal_devices:sections to the file. Under each of these sections add a-, space, then the full path to the block device names for this OSD node. For example:devices: - /dev/sdc - /dev/sdd - /dev/sde - /dev/sdf raw_journal_devices: - /dev/sda - /dev/sda - /dev/sdb - /dev/sdb
Ensure that Ansible can reach the Ceph hosts:
$ ansible all -m ping
Navigate to the Ansible configuration directory:
$ cd /usr/share/ceph-ansible
Run the Ansible playbook:
$ ansible-playbook site.yml
Ansible will add the new OSD node(s) to the Ceph storage cluster.
Second Approach
As
root, modify the existing/etc/ansible/hostsfile. Under the[osds]section, add the new OSD node name, and using thedevicesandraw_journal_devicessettings, specify the different disk topology. For example:[osds] ... osdnode10 devices="['/dev/sdc', '/dev/sdd', '/dev/sde', '/dev/sdf']" raw_journal_devices="['/dev/sda', '/dev/sda', '/dev/sdb', '/dev/sdb']"
Ensure that Ansible can reach the Ceph hosts:
$ ansible all -m ping
Navigate to the Ansible configuration directory:
$ cd /usr/share/ceph-ansible
Run the Ansible playbook:
$ ansible-playbook site.yml
Ansible will add the new OSD node(s) to the Ceph storage cluster.
See Also..
For more details on the different OSD settings, see the Configuring Ceph OSD Settings table in the Red Hat Ceph Storage 2 Installation Guide.
6.3.3. Adding an OSD with the Command Line Interface
To add a new OSD node manually:
-
Install the
ceph-osdpackage and create a new OSD instance. - Prepare and mount the OSD data and journal drives.
- Initialize the OSD data directory and register the OSD authentication key.
- Add the new OSD node to the CRUSH map.
- Update the owner and group permissions.
-
Enable and start the
ceph-osddaemon.
Enter the commands that start with the number sign (#) as root or with the sudo utility.
In addition, if you use a custom cluster name, use the --cluster <cluster-name> option with the ceph and ceph-osd commands.
Before you Start
Add the Red Hat Ceph Storage 2 OSD repository:
Create the
/etc/ceph/directory:# mkdir /etc/ceph
On the new OSD node, copy the Ceph administration keyring and configuration file from the initial Monitor node:
scp <user_name>@<monitor_host_name>:/etc/ceph/<cluster_name>.client.admin.keyring /etc/ceph
scp <user_name>@<monitor_host_name>:/etc/ceph/<cluster_name>.conf /etc/ceph
For example:
# scp root@node1:/etc/ceph/ceph.client.admin.keyring /etc/ceph/
# scp root@node1:/etc/ceph/ceph.conf /etc/ceph/
Installing ceph-osd and Creating a New OSD Instance
Install the
ceph-osdpackage on the new Ceph OSD node:For Red Hat Enterprise Linux nodes:
# yum install ceph-osd
For Ubuntu nodes:
$ sudo apt-get install ceph-osd
Generate the Universally Unique Identifier (UUID) for the new OSD:
$ uuidgen
ebd24968-0f3a-499c-a5b7-929c71ac8c1a
Create the OSD instance. Note the OSD number identifier because you will need it for subsequent procedures.
ceph osd create <uuid> [<osd_id>]
For example:
# ceph osd create ebd24968-0f3a-499c-a5b7-929c71ac8c1a
4
Preparing the OSD Data and Journal Drives
Create the default directory for the new OSD:
mkdir /var/lib/ceph/osd/<cluster_name>-<osd_id>
For example:
# mkdir /var/lib/ceph/osd/ceph-4
Create a new GUID partition table on the drive to be used as an OSD:
parted <path_to_disk> mklabel gpt
For example:
# parted /dev/sdd mklabel gpt
If you want to use a separate drive for the journal, create a new GUID partition table on it, too, for example:
# parted /dev/sde mklabel gpt
Create the data and journal partitions:
parted <path_to_disk> mkpart primary <start> <end>
For example:
# parted /dev/sdd mkpart primary 1 10000
# parted /dev/sdd mkpart primary 10001 16000
If you use a separate drive for the journal, create the journal partition on it, for example:
# parted /dev/sde mkpart primary 1 6000
NoteThe minimum size of a journal partition is 5 GB. Journal partitions bigger than 10 GB are not usually needed.
Create a file system on the data partition:
mkfs -t <fstype> <path_to_partition>
For example:
# mkfs -t xfs /dev/sdd1
Set the type code of the partitions using the proper GUID value:
# sgdisk --typecode=<partnum:{GUID}> -- <path to the device>The GUID for Ceph OSD is
4fbd7e29-9d25-41b8-afd0-062c0ceff05d, and the GUID for Ceph Journal is45B0969E-9B03-4F30-B4C6-B4B80CEFF106. For example:# sgdisk --typecode=1:4fbd7e29-9d25-41b8-afd0-062c0ceff05d -- /dev/sdd # sgdisk --typecode=2:45b0969e-9b03-4f30-b4c6-b4b80ceff106 -- /dev/sdd
Mount the data partition to the directory created in the first step:
mount -o noatime <path_to_partition> /var/lib/ceph/osd/<cluster_name>-<osd_id>
For example:
# mount -o noatime /dev/sdd1 /var/lib/ceph/osd/ceph-4
Mount the data partition permanently by editing the
/etc/fstabfile:echo "<path_to_partition> /var/lib/ceph/osd/<cluster_name>-<osd_id> xfs defaults,noatime 1 2" >> /etc/fstab
For example:
# echo "/dev/sdd1 /var/lib/ceph/osd/ceph-4 xfs defaults,noatime 1 2" >> /etc/fstab
Initializing the OSD Data and Journal Directory and Registering the OSD Authentication Key
Initialize the OSD data directory:
ceph-osd -i <osd_id> --mkfs --mkkey --osd-uuid <uuid>
For example:
# ceph-osd -i 4 --mkfs --mkkey --osd-uuid ebd24968-0f3a-499c-a5b7-929c71ac8c1a
... auth: error reading file: /var/lib/ceph/osd/ceph-4/keyring: can't open /var/lib/ceph/osd/ceph-4/keyring: (2) No such file or directory
... created new key in keyring /var/lib/ceph/osd/ceph-4/keyring
If you use a separate drive for the journal, use the
--osd-journaloption to specify the journal drive:ceph-osd -i <osd_id> --mkfs --mkkey --osd-uuid <uuid> --osd-journal <path_to_journal>
For example:
# ceph-osd -i 4 --mkfs --mkkey --osd-uuid ebd24968-0f3a-499c-a5b7-929c71ac8c1a --osd-journal /dev/sde1
ImportantThe directory must be empty before you run
ceph-osdwith the--mkkeyoption.If you use a separate drive for the journal, perform the following steps:
Determine the UUID of the journal drive:
$ ls -l /dev/disk/by-partuuid/*
Create a symbolic link between the journal drive and the journal file:
ln -s /dev/disk/by-partuuid/<uuid> /var/lib/ceph/osd/<cluster_name>-<osd_id>/journal
For example:
# ln -s /dev/disk/by-partuuid/62bc7076-0533-4440-9024-ddaeea4f7a7b
/var/lib/ceph/osd/ceph-4/journal
Create the journal on the journal disk:
ceph-osd -i <osd-id> --mkjournal
For example:
# ceph-osd -i 4 --mkjournal
Register the OSD authentication key. If your cluster name differs from
ceph, insert the custom cluster name instead:ceph auth add osd.<osd_id> osd 'allow *' mon 'allow profile osd' -i /var/lib/ceph/osd/<cluster_name>-<osd_id>/keyring
For example:
# ceph auth add osd.4 osd 'allow *' mon 'allow profile osd' -i /var/lib/ceph/osd/ceph-4/keyring
added key for osd.4
Adding the New OSD Node to the CRUSH map
Add the OSD to the CRUSH map so that the OSD can start receiving data:
ceph osd crush add <osd_id> <weight> [<bucket_type>=<bucket_name> ...]
For example:
# ceph osd crush add 4 1 host=node4
If you specify more than one bucket, the command places the OSD into the most specific bucket out of those you specified, and it moves the bucket underneath any other buckets you specified.
If you specify only the root bucket, the command attaches the OSD directly to the root, but CRUSH rules expect OSDs to be inside of the host bucket.
You can also edit the CRUSH map manually. See the Editing a CRUSH map section in the Storage Strategies Guide for Red Hat Ceph Storage 2.
Updating the Owner and Group Permissions
Update the owner and group permissions for the newly created directories:
chown -R <owner>:<group> <path_to_directory>
For example:
# chown -R ceph:ceph /var/lib/ceph/osd
# chown -R ceph:ceph /var/log/ceph
# chown -R ceph:ceph /var/run/ceph
# chown -R ceph:ceph /etc/ceph
Enabling and Starting the ceph-osd Daemon
If you use clusters with custom names, add the following line to the appropriate file:
For Red Hat Enterprise Linux nodes:
# echo "CLUSTER=<custom_cluster_name>" >> /etc/sysconfig/ceph
For Ubuntu nodes:
$ sudo echo "CLUSTER=<custom_cluster_name>" >> /etc/default/ceph
To ensure that the new OSD is
upand ready to receive data, enable and start the OSD process:systemctl enable ceph-osd@<osd_id> systemctl start ceph-osd@<osd_id>
For example:
# systemctl enable ceph-osd@4
# systemctl start ceph-osd@4
6.3.4. Observing Data Migration
When you add an OSD to the CRUSH map, Ceph begins rebalacing the server by migrating placement groups to the new OSD. To observe this process, use the ceph command line utility:
# ceph -w
The placement group states change from active+clean to active, some degraded objects, and finally active+clean when migration completes. To exit the utility, press Ctrl + C.
6.4. Removing an OSD
When you want to reduce the size of a cluster or replace hardware, you may remove an OSD at runtime. With Ceph, an OSD is generally one Ceph ceph-osd daemon for one storage drive within a host machine. If the node has multiple storage drives, you may need to remove one ceph-osd daemon for each drive. Generally, it’s a good idea to check the capacity of the storage cluster to see if you are reaching the upper end of its capacity. Ensure that when you remove an OSD that the storage cluster is not at its near full ratio.
Do not let the storage cluster reach its full ratio when removing an OSD. Removing OSDs could cause the cluster to reach or exceed its full ratio.
6.4.1. Removing an OSD with the Command Line Interface
This procedure takes out an OSD, removes an OSD from a cluster map, removes its authentication key, removes the OSD from the OSD map, and removes the OSD from the ceph.conf file. If the node has multiple drives, you may need to remove an OSD for each drive by repeating this procedure.
After you take an OSD out of the cluster, it may still be running. That is, the OSD may be
upandout. You must stop the OSD before you remove it from the configuration. Asroot, disable and stop the OSD process:Syntax
# systemctl disable ceph-osd@<osd_id>
# systemctl stop ceph-osd@<osd_id>
Example
# systemctl disable ceph-osd@4
# systemctl stop ceph-osd@4
Once the OSD is stopped, it is
down.Before removing the OSD, the OSD needs to be taken out of the storage cluster:
Syntax
# ceph osd out <osd_id>
Example
# ceph osd out 4
ImportantOnce the OSD is out, Ceph will start rebalancing and copying data to other OSDs in the storage cluster. Red Hat recommends waiting until the storage cluster becomes
active+cleanbefore proceeding to the next step. To observe the data migration, run the following command:# ceph -w
Remove the OSD from the CRUSH map so that it no longer receives data. You may also decompile the CRUSH map, remove the OSD from the device list, remove the device as an item in the host bucket or remove the host bucket, if it’s in the CRUSH map and you intend to remove the host, recompile the map and set it. See the Storage Strategies Guide for details.
Syntax
# ceph osd crush remove <osd_name>
Example
# ceph osd crush remove osd.4
Remove the OSD authentication key:
Syntax
# ceph auth del osd.<osd_id>
Example
# ceph auth del osd.4
Remove the OSD:
Syntax
# ceph osd rm <osd_id>
Example
# ceph osd rm 4
Navigate to the host where you keep the master copy of the storage cluster’s
ceph.conffile:# cd /etc/ceph # vim ceph.conf
Remove the OSD entry from the
ceph.conffile, if it exists:[osd.4] host = <hostname>
-
Remove the reference to the OSD in the
/etc/fstabfile, if the OSD was added manually. -
From the node where you keep the master copy of the storage cluster’s
ceph.conffile, copy the updatedceph.conffile to the/etc/ceph/directory of other nodes in the storage cluster.
Chapter 7. Changing an OSD Drive
Ceph is designed for fault tolerance, which means Ceph can operate in a degraded state without losing data. For example, Ceph can operate even if a data storage drive fails. In the context of a failed drive, the degraded state means that the extra copies of the data stored on other OSDs will backfill automatically to other OSDs in the cluster. However, if an OSD drive fails, you will have to replace the failed OSD drive and recreate the OSD manually.
When a drive fails, initially the OSD status will be down and in the cluster. Ceph health warnings will indicate that an OSD is down. Just because an OSD gets marked down doesn’t mean the drive has failed. For example, heart beating and other networking issues could get an OSD marked down even if is up.
Modern servers typically deploy with hot-swappable drives so you can pull a failed drive and replace it with a new one without bringing down the node. However, with Ceph Storage you will also have to address software-defined part of the OSD. The general procedure for replacing an OSD involves removing the OSD from your Ceph cluster, replacing the drive and then re-creating the OSD.
Check cluster health.
# ceph health
If an OSD is down, identify its location in the CRUSH hierarchy.
# ceph osd tree | grep -i down
If an OSD is
downandin, log in to the OSD node and try to restart it.# ssh {osd-node} # systemctl start ceph-osd@{osd-id}If the command indicates that the OSD is already running, it may be a heartbeat or networking issue. If you cannot restart the OSD, the drive may have failed.
NoteIf the OSD is
down, it will eventually get markedout. This is normal behavior for Ceph Storage. When the OSD gets markedout, other OSDs with copies of the failed OSD’s data will begin backfilling to ensure that the required number of copies exist within the cluster. While the cluster is backfilling, the cluster will be in adegradedstate.Check the failed OSD’s mount point.
If you cannot restart the OSD, you should check the mount point. If the mount point no longer appears, you can try to re-mount the OSD drive and restart the OSD. For example, if the server restarted, but lost the mount point in
fstab, remount the drive.# df -h
If you cannot restore the mount point, you may have a failed OSD drive. Use your drive utilities to determine if the drive is healthy. For example:
# yum install smartmontools
# smartctl -H /dev/{drive}
If the drive has failed, you will need to replace it.
Ensure the OSD is out of cluster.
# ceph osd out osd.<num>
Ensure the OSD process is stopped.
# systemctl stop ceph-osd@<osd-id>
Ensure the failed OSD is backfilling.
# ceph -w
Remove the OSD from the CRUSH Map.
# ceph osd crush remove osd.<num>
Remove the OSD’s authentication keys.
# ceph auth del osd.<num>
Remove the OSD from the Ceph Cluster.
# ceph osd rm osd.<num>
Unmount the failed drive path.
# umount /var/lib/ceph/{daemon}/{cluster}-{daemon-id}Replace the physical drive. Refer to the documentation for your hardware node. If the drive is hot swappable, simply replace the failed drive with a new drive. If the drive is NOT hot swappable and the node contains multiple OSDs, you MAY need to bring the node down to replace the physical drive. If you need to bring the node down temporarily, you may set the cluster to
nooutto prevent backfilling.ceph osd set noout
Once you replace the drive and you bring the node and its OSDs back online, remove the
nooutsetting.ceph osd unset noout
Allow the new drive to appear under
/devand make a note of the drive path before proceeding further.- Find the OSD drive and format the disk.
- Recreate the OSD. See Adding an OSD for details.
Check your CRUSH hierarchy to ensure it is accurate.
ceph osd tree
If you are not satisfied with the location of the OSD in your CRUSH hierarchy, you may move it with the
movecommand.ceph osd crush move <bucket-to-move> <bucket-type>=<parent-bucket>
- Ensure the OSD is online.
Chapter 8. Adding and Removing OSD Nodes
One of the outstanding features of Ceph is the ability to add or remove Ceph OSD nodes at run time. This means you can resize cluster capacity or replace hardware without taking down the storage cluster. The ability to serve Ceph clients while the cluster is in a degraded state also has operational benefits, for example, you can add or remove or replace hardware during regular business hours, rather than working overtime or weekends.
However, adding and removing Ceph OSD nodes can have a significant impact on performance, and you should consider the performance impact of adding, removing or replacing hardware on the storage cluster before you act.
From a capacity perspective, removing a node removes the OSDs contained within the node and effectively reduces the capacity of the storage cluster. Adding a node adds the OSDs contained within the node, and effectively expands the capacity of the storage cluster. Whether you are expanding or contracting cluster capacity, adding or removing Ceph OSD nodes will induce backfilling as the cluster rebalances. During that rebalancing time period, Ceph uses additional resources which can impact cluster performance.
The following diagram contains Ceph nodes where each node has four OSDs. In a storage cluster of four nodes, with 16 OSDs, removing a node removes 4 OSDs and cuts capacity by 25%. In a storage cluster of three nodes, with 12 OSDs, adding a node adds 4 OSDs and increases capacity by 33%.

In a production Ceph storage cluster, a Ceph OSD node has a particular hardware configuration that facilitates a particular type of storage strategy. See the Red Hat Ceph Storage Strategies Guide for more details.
Since a Ceph OSD node is part of a CRUSH hierarchy, the performance impact of adding or removing a node typically affects the performance of pools that use that CRUSH hierarchy, that is, the CRUSH ruleset.
8.1. Performance Factors
The following factors typically have an impact on cluster performance when adding or removing Ceph OSD nodes:
- Current Client Load on Affected Pools: Ceph clients place load on the I/O interface to the Ceph cluster; namely, a pool. A pool maps to a CRUSH ruleset. The underlying CRUSH hierarchy allows Ceph to place data across failure domains. If the underlying Ceph OSD node involves a pool under high client loads, the client load may have a significant impact on recovery time and impact performance. More specifically, since write operations require data replication for durability, write-intensive client loads will increase the time for the cluster to recover.
-
Capacity Added or Removed: Generally, the capacity you are adding or removing as a percentage of the overall cluster will have an impact on the cluster’s time to recover. Additionally, the storage density of the node you add or remove may have an impact on the time to recover for example, a node with 36 OSDs will typically take longer to recover compared to a node with 12 OSDs. When removing nodes, you MUST ensure that you have sufficient spare capacity so that you will not reach the
full ratioornear full ratio. If the storage cluster reaches thefull ratio, Ceph will suspend write operations to prevent data loss. - Pools and CRUSH Ruleset: A Ceph OSD node maps to at least one Ceph CRUSH hierarchy, and the hierarchy maps to at least one pool. Each pool that uses the CRUSH hierarchy (ruleset) where you add or remove a Ceph OSD node will experience a performance impact.
-
Pool Type and Durability: Replication pools tend to use more network bandwidth to replicate deep copies of the data, whereas erasure coded pools tend to use more CPU to calculate
k+mcoding chunks. The more copies of the data, for example, the size or the morek+mchunks, the longer it will take for the cluster to recover. - Total Throughput Characteristics: Drives, controllers and network interface cards all have throughput characteristics that may impact the recovery time. Generally, nodes with higher throughput characteristics, for example, 10 Gbps and SSDs will recover faster than nodes with lower throughput characteristics, for example, 1 Gbps and SATA drives.
8.2. Recommendations
The failure of a node may preclude removing one OSD at a time before changing the node. When circumstances allow you to reduce any negative performance impact when adding or removing Ceph OSD nodes, we recommend adding or removing one OSD at a time within a node and allowing the cluster to recover before proceeding to the next OSD. For details on removing an OSD, see Section 6.4.1, “Removing an OSD with the Command Line Interface”. When adding a Ceph node, we also recommend adding one OSD at a time. See Section 6.3, “Adding an OSD” for details.
When adding/removing Ceph OSD nodes, consider that other ongoing processes will have an impact on performance too. To reduce the impact on client I/O, we recommend the following:
-
Calculate capacity: Before removing a Ceph OSD node, ensure that the storage cluster can backfill the contents of all its OSDs WITHOUT reaching the
full ratio. Reaching thefull ratiowill cause the cluster to refuse write operations. Temporarily Disable Scrubbing: Scrubbing is essential to ensuring the durability of the storage cluster’s data; however, it is resource intensive. Before adding/ removing a Ceph OSD node, disable scrubbing and deep scrubbing and let the current scrubbing operations complete before proceeding, for example:
# ceph osd set noscrub
# ceph osd set nodeep-scrub
Once you have added or removed a Ceph OSD node and the storage cluster has returned to an
active+cleanstate, unset thenoscrubandnodeep-scrubsettings. See Chapter 4, Overrides for additional details.Limit Backfill and Recovery: If you have reasonable data durability, for example,
osd pool default size = 3andosd pool default min size = 2, there is nothing wrong with operating in adegradedstate. You can tune the Ceph storage cluster for the fastest possible recovery time, but this will impact Ceph client I/O performance significantly. To maintain the highest Ceph client I/O performance, limit the backfill and recovery operations and allow them to take longer, for example:osd_max_backfills = 1 osd_recovery_max_active = 1 osd_recovery_op_priority = 1
You can also set sleep and delay parameters such as
osd_recovery_sleep.
Finally, if you are expanding the size of the storage cluster, you may need to increase the number of placement groups. If you determine that you need to expand the number of placement groups, we recommend making incremental increases in the number of placement groups. Increasing the number of placement groups by a significant number will cause performance to degrade considerably.
8.3. Removing a Node
Before removing a Ceph OSD node, ensure that your cluster can back-fill the contents of all its OSDs WITHOUT reaching the full ratio. Reaching the full ratio will cause the cluster to refuse write operations.
Use the following commands to check cluster capacity:
# ceph df # rados df # ceph osd df
Temporarily disable scrubbing.
# ceph osd set noscrub # ceph osd set nodeep-scrub
Limit back-fill and recovery.
osd_max_backfills = 1
osd_recovery_max_active = 1
osd_recovery_op_priority = 1
See Setting a Specific Configuration Setting at Runtime for details.
Remove each Ceph OSD on the node from the Ceph Storage Cluster.
When removing an OSD node from a Ceph cluster Red Hat recommends removing one OSD at a time within the node and allowing the cluster to recover to an
active+cleanstate before proceeding to the next OSD.See Removing an OSD for details on removing an OSD.
After removing an OSD check to verify the cluster is not nearing the near-full ratio.
# ceph -s # ceph df
Follow this procedure until all OSDs on the node until you have removed all of them from the Ceph Storage cluster.
Once all OSDs are removed from the OSD node you can remove the OSD node bucket from the CRUSH map.
# ceph osd crush rm {bucket-name}Finally, remove the node from Calamari.
http://{calamari-fqdn}/api/v2/server/{problematic-host-fqdn}Click on the 'Delete' button to delete the node from Calamari.
8.4. Adding a Node
To add an OSD node to a Ceph cluster, first provision the node. See Configuring a Host for details. Ensure that other nodes in the cluster can reach the new host by its short host name.
Temporarily disable scrubbing.
# ceph osd set noscrub
# ceph osd set nodeep-scrub
Limit back-fill and recovery.
osd_max_backfills = 1
osd_recovery_max_active = 1
osd_recovery_op_priority = 1
See Setting a Specific Configuration Setting at Runtime for details.
Add the new node to the CRUSH Map.
# ceph osd crush add-bucket {bucket-name} {type}See Add a Bucket and Move a Bucket for details on placing the node at an appropriate location in the CRUSH hierarchy.
Add a Ceph OSD for each storage disk on the node to the Ceph Storage Cluster.
When adding an OSD node to a Ceph cluster Red Hat recommends adding one OSD at a time within the node and allowing the cluster to recover to an
active+cleanstate before proceeding to the next OSD.See Adding an OSD for details on adding an OSD.
Chapter 9. Benchmarking Performance
The purpose of this section is to give Ceph administrators a basic understanding of Ceph’s native benchmarking tools. These tools will provide some insight into how the Ceph storage cluster is performing. This is not the definitive guide to Ceph performance benchmarking, nor is it a guide on how to tune Ceph accordingly.
9.1. Performance Baseline
The OSD (including the journal) disks and the network throughput should each have a performance baseline to compare against. You can identify potential tuning opportunities by comparing the baseline performance data with the data from Ceph’s native tools. Red Hat Enterprise Linux has many built-in tools, along with a plethora of open source community tools, available to help accomplish these tasks. For more details about some of the available tools, see this Knowledgebase article.
9.2. Storage Cluster
Ceph includes the rados bench command to do performance benchmarking on a RADOS storage cluster. The command will execute a write test and two types of read tests. The --no-cleanup option is important to use when testing both read and write performance. By default the rados bench command will delete the objects it has written to the storage pool. Leaving behind these objects allows the two read tests to measure sequential and random read performance.
Before running these performance tests, drop all the file system caches by running the following:
# echo 3 | sudo tee /proc/sys/vm/drop_caches && sudo sync
Create a new storage pool:
# ceph osd pool create testbench 100 100
Execute a write test for 10 seconds to the newly created storage pool:
# rados bench -p testbench 10 write --no-cleanup
Example Output
Maintaining 16 concurrent writes of 4194304 bytes for up to 10 seconds or 0 objects
 Object prefix: benchmark_data_cephn1.home.network_10510
   sec Cur ops   started  finished  avg MB/s  cur MB/s  last lat   avg lat
     0       0         0         0         0         0         -         0
     1      16        16         0         0         0         -         0
     2      16        16         0         0         0         -         0
     3      16        16         0         0         0         -         0
     4      16        17         1  0.998879         1   3.19824   3.19824
     5      16        18         2   1.59849         4   4.56163   3.87993
     6      16        18         2   1.33222         0         -   3.87993
     7      16        19         3   1.71239         2   6.90712     4.889
     8      16        25         9   4.49551        24   7.75362   6.71216
     9      16        25         9   3.99636         0         -   6.71216
    10      16        27        11   4.39632         4   9.65085   7.18999
    11      16        27        11   3.99685         0         -   7.18999
    12      16        27        11   3.66397         0         -   7.18999
    13      16        28        12   3.68975   1.33333   12.8124   7.65853
    14      16        28        12   3.42617         0         -   7.65853
    15      16        28        12   3.19785         0         -   7.65853
    16      11        28        17   4.24726   6.66667   12.5302   9.27548
    17      11        28        17   3.99751         0         -   9.27548
    18      11        28        17   3.77546         0         -   9.27548
    19      11        28        17   3.57683         0         -   9.27548
 Total time run:         19.505620
Total writes made:      28
Write size:             4194304
Bandwidth (MB/sec):     5.742

Stddev Bandwidth:       5.4617
Max bandwidth (MB/sec): 24
Min bandwidth (MB/sec): 0
Average Latency:        10.4064
Stddev Latency:         3.80038
Max latency:            19.503
Min latency:            3.19824
Execute a sequential read test for 10 seconds to the storage pool:
# rados bench -p testbench 10 seq
Example Output
sec Cur ops   started  finished  avg MB/s  cur MB/s  last lat   avg lat
  0       0         0         0         0         0         -         0
Total time run:        0.804869
Total reads made:      28
Read size:             4194304
Bandwidth (MB/sec):    139.153

Average Latency:       0.420841
Max latency:           0.706133
Min latency:           0.0816332
Execute a random read test for 10 seconds to the storage pool:
# rados bench -p testbench 10 rand
Example Output
sec Cur ops   started  finished  avg MB/s  cur MB/s  last lat   avg lat
  0       0         0         0         0         0         -         0
  1      16        46        30   119.801       120  0.440184  0.388125
  2      16        81        65   129.408       140  0.577359  0.417461
  3      16       120       104   138.175       156  0.597435  0.409318
  4      15       157       142   141.485       152  0.683111  0.419964
  5      16       206       190   151.553       192  0.310578  0.408343
  6      16       253       237   157.608       188 0.0745175  0.387207
  7      16       287       271   154.412       136  0.792774   0.39043
  8      16       325       309   154.044       152  0.314254   0.39876
  9      16       362       346   153.245       148  0.355576  0.406032
 10      16       405       389   155.092       172   0.64734  0.398372
Total time run:        10.302229
Total reads made:      405
Read size:             4194304
Bandwidth (MB/sec):    157.248

Average Latency:       0.405976
Max latency:           1.00869
Min latency:           0.0378431
To increase the number of concurrent reads and writes, use the
-toption, which the default is 16 threads. Also, the-bparameter can adjust the size of the object being written. The default object size is 4MB. A safe maximum object size is 16MB. Red Hat recommends running multiple copies of these benchmark tests to different pools. Doing this shows the changes in performance from multiple clients.Add the
--run-name <label>option to control the names of the objects that get written during the benchmark test. Multiplerados benchcommands may be ran simultaneously by changing the--run-namelabel for each running command instance. This prevents potential I/O errors that can occur when multiple clients are trying to access the same object and allows for different clients to access different objects. The--run-nameoption is also useful when trying to simulate a real world workload. For example:# rados bench -p testbench 10 write -t 4 --run-name client1
Example Output
Maintaining 4 concurrent writes of 4194304 bytes for up to 10 seconds or 0 objects
 Object prefix: benchmark_data_node1_12631
   sec Cur ops   started  finished  avg MB/s  cur MB/s  last lat   avg lat
     0       0         0         0         0         0         -         0
     1       4         4         0         0         0         -         0
     2       4         6         2   3.99099         4   1.94755   1.93361
     3       4         8         4   5.32498         8     2.978   2.44034
     4       4         8         4   3.99504         0         -   2.44034
     5       4        10         6   4.79504         4   2.92419    2.4629
     6       3        10         7   4.64471         4   3.02498    2.5432
     7       4        12         8   4.55287         4   3.12204   2.61555
     8       4        14        10    4.9821         8   2.55901   2.68396
     9       4        16        12   5.31621         8   2.68769   2.68081
    10       4        17        13   5.18488         4   2.11937   2.63763
    11       4        17        13   4.71431         0         -   2.63763
    12       4        18        14   4.65486         2    2.4836   2.62662
    13       4        18        14   4.29757         0         -   2.62662
Total time run:         13.123548
Total writes made:      18
Write size:             4194304
Bandwidth (MB/sec):     5.486

Stddev Bandwidth:       3.0991
Max bandwidth (MB/sec): 8
Min bandwidth (MB/sec): 0
Average Latency:        2.91578
Stddev Latency:         0.956993
Max latency:            5.72685
Min latency:            1.91967
Remove the data created by the
rados benchcommand:# rados -p testbench cleanup
9.3. Block Device
Ceph includes the rbd bench-write command to test sequential writes to the block device measuring throughput and latency. The default byte size is 4096, the default number of I/O threads is 16, and the default total number of bytes to write is 1 GB. These defaults can be modified by the --io-size, --io-threads and --io-total options respectively. For more information on the rbd command, see the Red Hat Ceph Storage 2 Block Device Guide.
Creating a Ceph Block Device
As
root, load therbdkernel module, if not already loaded:# modprobe rbd
As
root, create a 1 GBrbdimage file in thetestbenchpool:# rbd create image01 --size 1024 --pool testbench
NoteWhen creating a block device image these features are enabled by default:
layering,object-map,deep-flatten,journaling,exclusive-lock, andfast-diff.On Red Hat Enterprise Linux 7.2 and Ubuntu 16.04, users utilizing the kernel RBD client will not be able to map the block device image. You must first disable all these features, except,
layering.Syntax
# rbd feature disable <image_name> <feature_name>
Example
# rbd feature disable image1 journaling deep-flatten exclusive-lock fast-diff object-map
Using the
--image-feature layeringoption on therbd createcommand will only enablelayeringon newly created block device images.This is a known issue, see the Red Hat Ceph Storage 2.0 Release Notes for more details.
All these features will work for users utilizing the user-space RBD client to access the block device images.
As
root, map the image file to a device file:# rbd map image01 --pool testbench --name client.admin
As
root, create anext4file system on the block device:# mkfs -t ext4 -m0 /dev/rbd/testbench/image01
As
root, create a new directory:# mkdir /mnt/ceph-block-device
As
root, mount the block device under/mnt/ceph-block-device/:# mount /dev/rbd/testbench/image01 /mnt/ceph-block-device
Execute the write performance test against the block device
# rbd bench-write image01 --pool=testbench
Example
bench-write  io_size 4096 io_threads 16 bytes 1073741824 pattern seq
  SEC       OPS   OPS/SEC   BYTES/SEC
    2     11127   5479.59  22444382.79
    3     11692   3901.91  15982220.33
    4     12372   2953.34  12096895.42
    5     12580   2300.05  9421008.60
    6     13141   2101.80  8608975.15
    7     13195    356.07  1458459.94
    8     13820    390.35  1598876.60
    9     14124    325.46  1333066.62
    ..
Chapter 10. Performance Counters
The Ceph performance counters are a collection of internal infrastructure metrics. The collection, aggregation, and graphing of this metric data can be done by an assortment of tools and can be useful for performance analytics.
10.1. Access
The performance counters are available through a socket interface for the Ceph Monitors and the OSDs. The socket file for each respective daemon is located under /var/run/ceph, by default. The performance counters are grouped together into collection names. These collections names represent a subsystem or an instance of a subsystem.
Here is the full list of the Monitor and the OSD collection name categories with a brief description for each :
Monitor Collection Name Categories
- Cluster Metrics - Displays information about the storage cluster: Monitors, OSDs, Pools, and PGs
-
Level Database Metrics - Displays information about the back-end
KeyValueStoredatabase - Monitor Metrics - Displays general monitor information
- Paxos Metrics - Displays information on cluster quorum management
- Throttle Metrics - Displays the statistics on how the monitor is throttling
OSD Collection Name Categories
- Write Back Throttle Metrics - Displays the statistics on how the write back throttle is tracking unflushed IO
- Filestore Metrics - Displays information on all related filestore statistics
-
Level Database Metrics - Displays information about the back-end
KeyValueStoredatabase - Objecter Metrics - Displays information on various object-based operations
- Read and Write Operations Metrics - Displays information on various read and write operations
- Recovery State Metrics - Displays - Displays latencies on various recovery states
- OSD Throttle Metrics - Display the statistics on how the OSD is throttling
RADOS Gateway Collection Name Categories
- Object Gateway Client Metrics - Displays statistics on GET and PUT requests
- Objecter Metrics - Displays information on various object-based operations
- Object Gateway Throttle Metrics - Display the statistics on how the OSD is throttling
10.2. Schema
The ceph daemon .. perf schema command outputs the available metrics. Each metric has an associated bit field value type.
To view the metric’s schema:
# ceph daemon <daemon_name> perf schema
You must run the ceph daemon command from the node running the daemon.
Executing ceph daemon .. perf schema command from the Monitor node:
# ceph daemon mon.`hostname -s` perf schema
Example
{
    "cluster": {
        "num_mon": {
            "type": 2
        },
        "num_mon_quorum": {
            "type": 2
        },
        "num_osd": {
            "type": 2
        },
        "num_osd_up": {
            "type": 2
        },
        "num_osd_in": {
            "type": 2
        },
...
Executing the ceph daemon .. perf schema command from the OSD node:
# ceph daemon osd.0 perf schema
Example
...
"filestore": {
        "journal_queue_max_ops": {
            "type": 2
        },
        "journal_queue_ops": {
            "type": 2
        },
        "journal_ops": {
            "type": 10
        },
        "journal_queue_max_bytes": {
            "type": 2
        },
        "journal_queue_bytes": {
            "type": 2
        },
        "journal_bytes": {
            "type": 10
        },
        "journal_latency": {
            "type": 5
        },
...
Table 10.1. The bit field value definitions
| Bit | Meaning |
|---|---|
| 1 | Floating point value |
| 2 | Unsigned 64-bit integer value |
| 4 | Average (Sum + Count) |
| 8 | Counter |
Each value will have bit 1 or 2 set to indicate the type, either a floating point or an integer value. When bit 4 is set, there will be two values to read, a sum and a count. See Section 10.3.1, “Average Count and Sum” for more details. When bit 8 is set, the average for the previous interval would be the sum delta, since the previous read, divided by the count delta. Alternatively, dividing the values outright would provide the lifetime average value. Typically these are used to measure latencies, the number of requests and a sum of request latencies. Some bit values are combined, for example 5, 6 and 10. A bit value of 5 is a combination of bit 1 and bit 4. This means the average will be a floating point value. A bit value of 6 is a combination of bit 2 and bit 4. This means the average value will be an integer. A bit value of 10 is a combination of bit 2 and bit 8. This means the counter value will be an integer value.
10.3. Dump
The ceph daemon .. perf dump command outputs the current values and groups the metrics under the collection name for each subsystem.
To view the current metric data:
# ceph daemon {daemon_name} perf dump
You must run the ceph daemon command from the node running the daemon.
Executing ceph daemon .. perf dump command from the Monitor node:
# ceph daemon mon.`hostname -s` perf dump
Example
{
    "cluster": {
        "num_mon": 1,
        "num_mon_quorum": 1,
        "num_osd": 2,
        "num_osd_up": 2,
        "num_osd_in": 2,
...
To view a short description of each Monitor metric available, please see the table below.
Executing the ceph daemon .. perf dump command from the OSD node:
# ceph daemon osd.0 perf dump
Example
...
"filestore": {
        "journal_queue_max_ops": 300,
        "journal_queue_ops": 0,
        "journal_ops": 992,
        "journal_queue_max_bytes": 33554432,
        "journal_queue_bytes": 0,
        "journal_bytes": 934537,
        "journal_latency": {
            "avgcount": 992,
            "sum": 254.975925772
        },
...
10.3.1. Average Count and Sum
All latency numbers have a bit field value of 5. This field contains floating point values for the average count and sum. The avgcount is the number of operations within this range and the sum is the total latency in seconds. When dividing the sum by the avgcount this will provide you with an idea of the latency per operation.
To view a short description of each OSD metric available, please see the OSD table below.
10.3.2. Monitor Metrics Description Tables
Table 10.2. Cluster Metrics Table
| Collection Name | Metric Name | Bit Field Value | Short Description |
|---|---|---|---|
|
|
| 2 | Number of monitors |
|
| 2 | Number of monitors in quorum | |
|
| 2 | Total number of OSD | |
|
| 2 | Number of OSDs that are up | |
|
| 2 | Number of OSDs that are in cluster | |
|
| 2 | Current epoch of OSD map | |
|
| 2 | Total capacity of cluster in bytes | |
|
| 2 | Number of used bytes on cluster | |
|
| 2 | Number of available bytes on cluster | |
|
| 2 | Number of pools | |
|
| 2 | Total number of placement groups | |
|
| 2 | Number of placement groups in active+clean state | |
|
| 2 | Number of placement groups in active state | |
|
| 2 | Number of placement groups in peering state | |
|
| 2 | Total number of objects on cluster | |
|
| 2 | Number of degraded (missing replicas) objects | |
|
| 2 | Number of misplaced (wrong location in the cluster) objects | |
|
| 2 | Number of unfound objects | |
|
| 2 | Total number of bytes of all objects | |
|
| 2 | Number of MDSs that are up | |
|
| 2 | Number of MDS that are in cluster | |
|
| 2 | Number of failed MDS | |
|
| 2 | Current epoch of MDS map |
Table 10.3. Level Database Metrics Table
| Collection Name | Metric Name | Bit Field Value | Short Description |
|---|---|---|---|
|
|
| 10 | Gets |
|
| 10 | Transactions | |
|
| 10 | Compactions | |
|
| 10 | Compactions by range | |
|
| 10 | Mergings of ranges in compaction queue | |
|
| 2 | Length of compaction queue |
Table 10.4. General Monitor Metrics Table
| Collection Name | Metric Name | Bit Field Value | Short Description |
|---|---|---|---|
|
|
| 2 | Current number of opened monitor sessions |
|
| 10 | Number of created monitor sessions | |
|
| 10 | Number of remove_session calls in monitor | |
|
| 10 | Number of trimed monitor sessions | |
|
| 10 | Number of elections monitor took part in | |
|
| 10 | Number of elections started by monitor | |
|
| 10 | Number of elections won by monitor | |
|
| 10 | Number of elections lost by monitor |
Table 10.5. Paxos Metrics Table
| Collection Name | Metric Name | Bit Field Value | Short Description |
|---|---|---|---|
|
|
| 10 | Starts in leader role |
|
| 10 | Starts in peon role | |
|
| 10 | Restarts | |
|
| 10 | Refreshes | |
|
| 5 | Refresh latency | |
|
| 10 | Started and handled begins | |
|
| 6 | Keys in transaction on begin | |
|
| 6 | Data in transaction on begin | |
|
| 5 | Latency of begin operation | |
|
| 10 | Commits | |
|
| 6 | Keys in transaction on commit | |
|
| 6 | Data in transaction on commit | |
|
| 5 | Commit latency | |
|
| 10 | Peon collects | |
|
| 6 | Keys in transaction on peon collect | |
|
| 6 | Data in transaction on peon collect | |
|
| 5 | Peon collect latency | |
|
| 10 | Uncommitted values in started and handled collects | |
|
| 10 | Collect timeouts | |
|
| 10 | Accept timeouts | |
|
| 10 | Lease acknowledgement timeouts | |
|
| 10 | Lease timeouts | |
|
| 10 | Store a shared state on disk | |
|
| 6 | Keys in transaction in stored state | |
|
| 6 | Data in transaction in stored state | |
|
| 5 | Storing state latency | |
|
| 10 | Sharings of state | |
|
| 6 | Keys in shared state | |
|
| 6 | Data in shared state | |
|
| 10 | New proposal number queries | |
|
| 5 | New proposal number getting latency |
Table 10.6. Throttle Metrics Table
| Collection Name | Metric Name | Bit Field Value | Short Description |
|---|---|---|---|
|
|
| 10 | Currently available throttle |
|
| 10 | Max value for throttle | |
|
| 10 | Gets | |
|
| 10 | Got data | |
|
| 10 | Get blocked during get_or_fail | |
|
| 10 | Successful get during get_or_fail | |
|
| 10 | Takes | |
|
| 10 | Taken data | |
|
| 10 | Puts | |
|
| 10 | Put data | |
|
| 5 | Waiting latency |
10.3.3. OSD Metrics Description Tables
Table 10.7. Write Back Throttle Metrics Table
| Collection Name | Metric Name | Bit Field Value | Short Description |
|---|---|---|---|
|
|
| 2 | Dirty data |
|
| 2 | Written data | |
|
| 2 | Dirty operations | |
|
| 2 | Written operations | |
|
| 2 | Entries waiting for write | |
|
| 2 | Written entries |
Table 10.8. Filestore Metrics Table
| Collection Name | Metric Name | Bit Field Value | Short Description |
|---|---|---|---|
|
|
| 2 | Max operations in journal queue |
|
| 2 | Operations in journal queue | |
|
| 10 | Total journal entries written | |
|
| 2 | Max data in journal queue | |
|
| 2 | Size of journal queue | |
|
| 10 | Total operations size in journal | |
|
| 5 | Average journal queue completing latency | |
|
| 10 | Journal write IOs | |
|
| 6 | Journal data written | |
|
| 10 | Journal writes while full | |
|
| 2 | Is currently committing | |
|
| 10 | Commit cycles | |
|
| 5 | Average interval between commits | |
|
| 5 | Average latency of commit | |
|
| 2 | Max operations count in queue | |
|
| 2 | Operations count in queue | |
|
| 10 | Operations | |
|
| 2 | Max size of queue | |
|
| 2 | Size of queue | |
|
| 10 | Data written to store | |
|
| 5 | Apply latency | |
|
| 5 | Store operation queue latency |
Table 10.9. Level Database Metrics Table
| Collection Name | Metric Name | Bit Field Value | Short Description |
|---|---|---|---|
|
|
| 10 | Gets |
|
| 10 | Transactions | |
|
| 10 | Compactions | |
|
| 10 | Compactions by range | |
|
| 10 | Mergings of ranges in compaction queue | |
|
| 2 | Length of compaction queue |
Table 10.10. Objecter Metrics Table
| Collection Name | Metric Name | Bit Field Value | Short Description |
|---|---|---|---|
|
|
| 2 | Active operations |
|
| 2 | Laggy operations | |
|
| 10 | Sent operations | |
|
| 10 | Sent data | |
|
| 10 | Resent operations | |
|
| 10 | Commit callbacks | |
|
| 10 | Operation commits | |
|
| 10 | Operation | |
|
| 10 | Read operations | |
|
| 10 | Write operations | |
|
| 10 | Read-modify-write operations | |
|
| 10 | PG operation | |
|
| 10 | Stat operations | |
|
| 10 | Create object operations | |
|
| 10 | Read operations | |
|
| 10 | Write operations | |
|
| 10 | Write full object operations | |
|
| 10 | Append operation | |
|
| 10 | Set object to zero operations | |
|
| 10 | Truncate object operations | |
|
| 10 | Delete object operations | |
|
| 10 | Map extent operations | |
|
| 10 | Sparse read operations | |
|
| 10 | Clone range operations | |
|
| 10 | Get xattr operations | |
|
| 10 | Set xattr operations | |
|
| 10 | Xattr comparison operations | |
|
| 10 | Remove xattr operations | |
|
| 10 | Reset xattr operations | |
|
| 10 | TMAP update operations | |
|
| 10 | TMAP put operations | |
|
| 10 | TMAP get operations | |
|
| 10 | Call (execute) operations | |
|
| 10 | Watch by object operations | |
|
| 10 | Notify about object operations | |
|
| 10 | Extended attribute comparison in multi operations | |
|
| 10 | Other operations | |
|
| 2 | Active lingering operations | |
|
| 10 | Sent lingering operations | |
|
| 10 | Resent lingering operations | |
|
| 10 | Sent pings to lingering operations | |
|
| 2 | Active pool operations | |
|
| 10 | Sent pool operations | |
|
| 10 | Resent pool operations | |
|
| 2 | Active get pool stat operations | |
|
| 10 | Pool stat operations sent | |
|
| 10 | Resent pool stats | |
|
| 2 | Statfs operations | |
|
| 10 | Sent FS stats | |
|
| 10 | Resent FS stats | |
|
| 2 | Active commands | |
|
| 10 | Sent commands | |
|
| 10 | Resent commands | |
|
| 2 | OSD map epoch | |
|
| 10 | Full OSD maps received | |
|
| 10 | Incremental OSD maps received | |
|
| 2 | Open sessions | |
|
| 10 | Sessions opened | |
|
| 10 | Sessions closed | |
|
| 2 | Laggy OSD sessions |
Table 10.11. Read and Write Operations Metrics Table
| Collection Name | Metric Name | Bit Field Value | Short Description |
|---|---|---|---|
|
|
| 2 | Replication operations currently being processed (primary) |
|
| 10 | Client operations total write size | |
|
| 10 | Client operations total read size | |
|
| 5 | Latency of client operations (including queue time) | |
|
| 5 | Latency of client operations (excluding queue time) | |
|
| 10 | Client read operations | |
|
| 10 | Client data read | |
|
| 5 | Latency of read operation (including queue time) | |
|
| 5 | Latency of read operation (excluding queue time) | |
|
| 10 | Client write operations | |
|
| 10 | Client data written | |
|
| 5 | Client write operation readable/applied latency | |
|
| 5 | Latency of write operation (including queue time) | |
|
| 5 | Latency of write operation (excluding queue time) | |
|
| 10 | Client read-modify-write operations | |
|
| 10 | Client read-modify-write operations write in | |
|
| 10 | Client read-modify-write operations read out | |
|
| 5 | Client read-modify-write operation readable/applied latency | |
|
| 5 | Latency of read-modify-write operation (including queue time) | |
|
| 5 | Latency of read-modify-write operation (excluding queue time) | |
|
| 10 | Suboperations | |
|
| 10 | Suboperations total size | |
|
| 5 | Suboperations latency | |
|
| 10 | Replicated writes | |
|
| 10 | Replicated written data size | |
|
| 5 | Replicated writes latency | |
|
| 10 | Suboperations pull requests | |
|
| 5 | Suboperations pull latency | |
|
| 10 | Suboperations push messages | |
|
| 10 | Suboperations pushed size | |
|
| 5 | Suboperations push latency | |
|
| 10 | Pull requests sent | |
|
| 10 | Push messages sent | |
|
| 10 | Pushed size | |
|
| 10 | Inbound push messages | |
|
| 10 | Inbound pushed size | |
|
| 10 | Started recovery operations | |
|
| 2 | CPU load | |
|
| 2 | Total allocated buffer size | |
|
| 2 | Placement groups | |
|
| 2 | Placement groups for which this osd is primary | |
|
| 2 | Placement groups for which this osd is replica | |
|
| 2 | Placement groups ready to be deleted from this osd | |
|
| 2 | Heartbeat (ping) peers we send to | |
|
| 2 | Heartbeat (ping) peers we recv from | |
|
| 10 | OSD map messages | |
|
| 10 | OSD map epochs | |
|
| 10 | OSD map duplicates | |
|
| 2 | OSD size | |
|
| 2 | Used space | |
|
| 2 | Available space | |
|
| 10 | Rados 'copy-from' operations | |
|
| 10 | Tier promotions | |
|
| 10 | Tier flushes | |
|
| 10 | Failed tier flushes | |
|
| 10 | Tier flush attempts | |
|
| 10 | Failed tier flush attempts | |
|
| 10 | Tier evictions | |
|
| 10 | Tier whiteouts | |
|
| 10 | Dirty tier flag set | |
|
| 10 | Dirty tier flag cleaned | |
|
| 10 | Tier delays (agent waiting) | |
|
| 10 | Tier proxy reads | |
|
| 10 | Tiering agent wake up | |
|
| 10 | Objects skipped by agent | |
|
| 10 | Tiering agent flushes | |
|
| 10 | Tiering agent evictions | |
|
| 10 | Object context cache hits | |
|
| 10 | Object context cache lookups |
Table 10.12. Recovery State Metrics Table
| Collection Name | Metric Name | Bit Field Value | Short Description |
|---|---|---|---|
|
|
| 5 | Initial recovery state latency |
|
| 5 | Started recovery state latency | |
|
| 5 | Reset recovery state latency | |
|
| 5 | Start recovery state latency | |
|
| 5 | Primary recovery state latency | |
|
| 5 | Peering recovery state latency | |
|
| 5 | Backfilling recovery state latency | |
|
| 5 | Wait remote backfill reserved recovery state latency | |
|
| 5 | Wait local backfill reserved recovery state latency | |
|
| 5 | Notbackfilling recovery state latency | |
|
| 5 | Repnotrecovering recovery state latency | |
|
| 5 | Rep wait recovery reserved recovery state latency | |
|
| 5 | Rep wait backfill reserved recovery state latency | |
|
| 5 | RepRecovering recovery state latency | |
|
| 5 | Activating recovery state latency | |
|
| 5 | Wait local recovery reserved recovery state latency | |
|
| 5 | Wait remote recovery reserved recovery state latency | |
|
| 5 | Recovering recovery state latency | |
|
| 5 | Recovered recovery state latency | |
|
| 5 | Clean recovery state latency | |
|
| 5 | Active recovery state latency | |
|
| 5 | Replicaactive recovery state latency | |
|
| 5 | Stray recovery state latency | |
|
| 5 | Getinfo recovery state latency | |
|
| 5 | Getlog recovery state latency | |
|
| 5 | Waitactingchange recovery state latency | |
|
| 5 | Incomplete recovery state latency | |
|
| 5 | Getmissing recovery state latency | |
|
| 5 | Waitupthru recovery state latency |
Table 10.13. OSD Throttle Metrics Table
| Collection Name | Metric Name | Bit Field Value | Short Description |
|---|---|---|---|
|
|
| 10 | Currently available throttle |
|
| 10 | Max value for throttle | |
|
| 10 | Gets | |
|
| 10 | Got data | |
|
| 10 | Get blocked during get_or_fail | |
|
| 10 | Successful get during get_or_fail | |
|
| 10 | Takes | |
|
| 10 | Taken data | |
|
| 10 | Puts | |
|
| 10 | Put data | |
|
| 5 | Waiting latency |
10.3.4. The Ceph Object Gateway Metrics Tables
Table 10.14. RADOS Client Metrics Table
| Collection Name | Metric Name | Bit Field Value | Short Description |
|---|---|---|---|
|
|
| 10 | Requests |
|
| 10 | Aborted requests | |
|
| 10 | Gets | |
|
| 10 | Size of gets | |
|
| 5 | Get latency | |
|
| 10 | Puts | |
|
| 10 | Size of puts | |
|
| 5 | Put latency | |
|
| 2 | Queue length | |
|
| 2 | Active requests queue | |
|
| 10 | Cache hits | |
|
| 10 | Cache miss | |
|
| 10 | Keystone token cache hits | |
|
| 10 | Keystone token cache miss |
Table 10.15. Objecter Metrics Table
| Collection Name | Metric Name | Bit Field Value | Short Description |
|---|---|---|---|
|
|
| 2 | Active operations |
|
| 2 | Laggy operations | |
|
| 10 | Sent operations | |
|
| 10 | Sent data | |
|
| 10 | Resent operations | |
|
| 10 | Commit callbacks | |
|
| 10 | Operation commits | |
|
| 10 | Operation | |
|
| 10 | Read operations | |
|
| 10 | Write operations | |
|
| 10 | Read-modify-write operations | |
|
| 10 | PG operation | |
|
| 10 | Stat operations | |
|
| 10 | Create object operations | |
|
| 10 | Read operations | |
|
| 10 | Write operations | |
|
| 10 | Write full object operations | |
|
| 10 | Append operation | |
|
| 10 | Set object to zero operations | |
|
| 10 | Truncate object operations | |
|
| 10 | Delete object operations | |
|
| 10 | Map extent operations | |
|
| 10 | Sparse read operations | |
|
| 10 | Clone range operations | |
|
| 10 | Get xattr operations | |
|
| 10 | Set xattr operations | |
|
| 10 | Xattr comparison operations | |
|
| 10 | Remove xattr operations | |
|
| 10 | Reset xattr operations | |
|
| 10 | TMAP update operations | |
|
| 10 | TMAP put operations | |
|
| 10 | TMAP get operations | |
|
| 10 | Call (execute) operations | |
|
| 10 | Watch by object operations | |
|
| 10 | Notify about object operations | |
|
| 10 | Extended attribute comparison in multi operations | |
|
| 10 | Other operations | |
|
| 2 | Active lingering operations | |
|
| 10 | Sent lingering operations | |
|
| 10 | Resent lingering operations | |
|
| 10 | Sent pings to lingering operations | |
|
| 2 | Active pool operations | |
|
| 10 | Sent pool operations | |
|
| 10 | Resent pool operations | |
|
| 2 | Active get pool stat operations | |
|
| 10 | Pool stat operations sent | |
|
| 10 | Resent pool stats | |
|
| 2 | Statfs operations | |
|
| 10 | Sent FS stats | |
|
| 10 | Resent FS stats | |
|
| 2 | Active commands | |
|
| 10 | Sent commands | |
|
| 10 | Resent commands | |
|
| 2 | OSD map epoch | |
|
| 10 | Full OSD maps received | |
|
| 10 | Incremental OSD maps received | |
|
| 2 | Open sessions | |
|
| 10 | Sessions opened | |
|
| 10 | Sessions closed | |
|
| 2 | Laggy OSD sessions |
Table 10.16. RADOS Gateway Throttle Metrics Table
| Collection Name | Metric Name | Bit Field Value | Short Description |
|---|---|---|---|
|
|
| 10 | Currently available throttle |
|
| 10 | Max value for throttle | |
|
| 10 | Gets | |
|
| 10 | Got data | |
|
| 10 | Get blocked during get_or_fail | |
|
| 10 | Successful get during get_or_fail | |
|
| 10 | Takes | |
|
| 10 | Taken data | |
|
| 10 | Puts | |
|
| 10 | Put data | |
|
| 5 | Waiting latency |
Chapter 11. OSD BlueStore (Technology Preview)
OSD BlueStore is a new back end for the OSD daemons. Compared to the currently used FileStore back end, BlueStore allows for storing objects directly on the Ceph block devices without any file system interface.
BlueStore is provided as a Technology Preview only in Red Hat Ceph Storage 2. Technology Preview features are not supported with Red Hat production service level agreements (SLAs), might not be functionally complete, and Red Hat does not recommend to use them for production. These features provide early access to upcoming product features, enabling customers to test functionality and provide feedback during the development process.
See the support scope for Red Hat Technology Preview features for more details.
Also, note that it will not be possible to preserve data when updating BlueStore OSD nodes to future versions of Red Hat Ceph Storage, because the on-disk data format is undergoing rapid development. In this release, BlueStore is provided mainly to benchmark BlueStore OSDs and Red Hat does not recommend storing any important data on OSD nodes with the BlueStore back end.
BlueStore is generally available and ready for production with Red Hat Ceph Storage 3.2. In addition, BlueStore is the default back end for any newly installed clusters using the Red Hat Ceph Storage 3.2 and further versions. For details, see the BlueStore chapter in the Red Hat Ceph Storage 3 Administration Guide.
BlueStore stores the OSD metadata in the RocksDB key-value database that contains:
- object metadata
- write-ahead log (WAL)
-
Ceph
omapdata - allocator metadata
BlueStore includes the following features and enhancements:
- No large double-writes
- BlueStore first writes any new data to unallocated space on a block device, and then commits a RocksDB transaction that updates the object metadata to reference the new region of the disk. Only when the write operation is below a configurable size threshold, it falls back to a write-ahead journaling scheme, similar to what is used now.
- Multi-device support
BlueStore can use multiple block devices for storing different data, for example: Hard Disk Drive (HDD) for the data Solid-state Drive (SSD) for metadata Non-volatile Memory (NVM) or Non-volatile random-access memory (NVRAM) or persistent memory for the RocksDB write-ahead log (WAL).
NoteThe
ceph-diskutility does not yet provision multiple devices. To use multiple devices, OSDs must be set up manually.- Efficient block device usage
- Because BlueStore does not use any file system, it minimizes the need to clear the storage device cache.
- Flexible allocator
- The block allocation policy is pluggable, allowing BlueStore to implement different policies for different types of storage devices. There is a different behavior for hard disks and SSDs.
Adding a new Ceph OSD node with the BlueStore back end
To install a new Ceph OSD node with the BlueStore back end by using the Ansible automation application:
Add a new OSD node to the
/etc/ansible/hostsfile under the[osds]section, for example:[osds] <osd_host_name>
For details, see Before You Start….
Append the following settings the
group_vars/allfile:osd_objectstore: bluestore ceph_conf_overrides: global: enable experimental unrecoverable data corrupting features: 'bluestore rocksdb'Add the following setting to the
group_vars/osdsfile:bluestore: true
Run the
ansible-playbook:ansible playbook site.yml
Verify the status of the Ceph cluster. The output will include the following warning message:
ceph -s

2016-03-25 13:03:31.846668 7f313ad2b700 -1 WARNING: the following dangerous and experimental features are enabled: bluestore,rocksdb
2016-03-25 13:03:31.855052 7f313ad2b700 -1 WARNING: the following dangerous and experimental features are enabled: bluestore,rocksdb
   cluster 179c40e3-8b3e-4ed0-9153-fefd638349a2
    health HEALTH_OK
    monmap e1: 1 mons at {rbd-mirroring-b4dae55c-34e3-4eb6-a84d-1b621af31c75=192.168.0.44:6789/0}
           election epoch 3, quorum 0 rbd-mirroring-b4dae55c-34e3-4eb6-a84d-1b621af31c75
    osdmap e9: 2 osds: 2 up, 2 in
           flags sortbitwise
    pgmap v13: 64 pgs, 1 pools, 0 bytes data, 0 objects
           2052 MB used, 38705 MB / 40757 MB avail
                 64 active+clean