
Red Hat Training
A Red Hat training course is available for Red Hat Gluster Storage
14.3. gstatus Command
14.3.1. gstatus Command
Important
The gstatus feature is under technology preview. Technology Preview features are not fully supported under Red Hat subscription level agreements (SLAs), may not be functionally complete, and are not intended for production use. However, these features provide early access to upcoming product innovations, enabling customers to test functionality and provide feedback during the development process.
A Red Hat Storage trusted storage pool consists of nodes, volumes and bricks. A new command called
gstatus provides an overview of the health of a Red Hat Storage trusted storage pool for distributed, replicated and distributed-replicated volumes.
The
gstatus command provides an easy-to-use, high-level view of the health of a trusted storage pool with a single command. It gathers information by executing the GlusterFS commands, to gather information about the statuses of the Red Hat Storage nodes, volumes, and bricks. The checks are performed across the trusted storage pool and the status is displayed. This data can be analyzed to add further checks and incorporate deployment best-practices and free-space triggers.
A Red Hat Storage volume is made from individual file systems (GlusterFS bricks) across multiple nodes. Although the complexity is abstracted, the status of the individual bricks affects the data availability of the volume. For example, even without replication, the loss of a single brick in the volume will not cause the volume itself to be unavailable, instead this would manifest as inaccessible files in the file system.
Package dependencies
- Gstatus works with Red Hat Storage version 3.0.3 and above
- GlusterFS CLI
- Python 2.6 or above
14.3.2. Installing gstatus during an ISO Installation
- While installing Red Hat Storage using an ISO, in the Customizing the Software Selection screen, select Red Hat Storage Tools Group and click Optional Packages.
- From the list of packages, select
gstatusand click Close.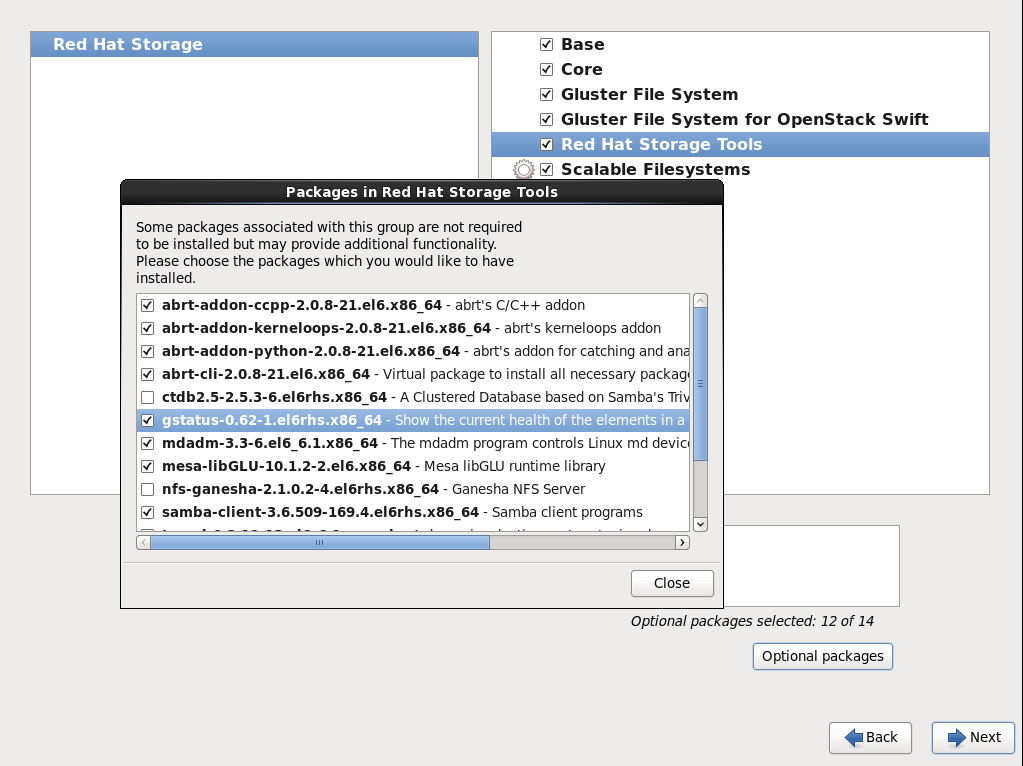
Figure 14.1. Installing gstatus
- Proceed with the remaining installation steps for installing Red Hat Storage. For more information on how to install Red Hat Storage using an ISO, see Installing from an ISO Image section of the Red Hat Storage 3 Installation Guide.
Installing using yum or the Red Hat Satellite Server or Red Hat Network
The gstatus package can be installed using the following command:
# yum install gstatus
Note
If you are installing using the Red Hat Network or Satellite, ensure that your system is subscribed to the required channels.
# yum list gstatus

Installed Packages
gstatus.x86_64			0.62-1.el6rhs				@rhs-3-for-rhel-6-server-rpms
14.3.3. Executing the gstatus command
The
gstatus command can be invoked in several different ways. The table below shows the optional switches that can be used with gstatus.
# gstatus -h
Usage: gstatus [options]
Table 14.1. gstatus Command Options
| Option | Description |
|---|---|
| --version | Displays the program's version number and exits. |
| -h, --help | Displays the help message and exits. |
| -s, --state | Displays the high level health of the Red Hat Storage Trusted Storage Pool. |
| -v, --volume | Displays volume information (default is ALL, or supply a volume name). |
| -b, --backlog | Probes the self heal state. |
| -a, --all | Displays capacity units in decimal or binary format(GB vs GiB) |
| -l, --layout | Displays the brick layout when used in combination with -v, or -a |
| -o OUTPUT_MODE, --output-mode=OUTPUT_MODE | Produces outputs in various formats such as - json, keyvalue, or console(default) |
| -D, --debug | Enables the debug mode. |
| -w, --without-progress | Disables progress updates during data gathering. |
Table 14.2. Commonly used gstatus Commands
| Description | Command |
|---|---|
| An overview of the trusted storage pool | gstatus -s |
| View component information | gstatus -a |
| View the volume details, including the brick layout | gstatus -vl VOLNAME |
| View the summary output for Nagios and Logstash | gstatus -o <keyvalue> |
Interpreting the output with Examples
Each invocation of
gstatus provides a header section, which provides a high level view of the state of the Red Hat Storage trusted storage pool. The Status field within the header offers two states; Healthy and Unhealthy. When problems are detected, the status field changes to Unhealthy(n), where n denotes the total number of issues that have been detected.
The following examples illustrate
gstatus command output for both healthy and unhealthy Red Hat Storage environments.
Example 14.1. Example 1: Trusted Storage Pool is in a healthy state; all nodes, volumes and bricks are online
# gstatus -a

     Product: RHSS v3.0 u 2      Capacity:  36.00 GiB(raw bricks)
      Status: HEALTHY                        7.00 GiB(raw used)
   Glusterfs: 3.6.0.29                      18.00 GiB(usable from volumes)
  OverCommit: No                Snapshots:   0

   Nodes    :  4/ 4		Volumes:  1 Up
   Self Heal:  4/ 4		          0 Up(Degraded)
   Bricks   :  4/ 4		          0 Up(Partial)
   Clients  :     1                       0 Down

Volume Information
	splunk           UP - 4/4 bricks up - Distributed-Replicate
	                 Capacity: (18% used) 3.00 GiB/18.00 GiB (used/total)
	                 Snapshots: 0
	                 Self Heal:  4/ 4
	                 Tasks Active: None
	                 Protocols: glusterfs:on  NFS:on  SMB:off
	                 Gluster Clients : 1


Status Messages
- Cluster is HEALTHY, all checks successful
Example 14.2. Example 2: A node is down within the trusted pool
# gstatus -al

     Product: RHSS v3.0 u 2      Capacity:  27.00 GiB(raw bricks)
      Status: UNHEALTHY(4)                   5.00 GiB(raw used)
   Glusterfs: 3.6.0.29                      18.00 GiB(usable from volumes)
  OverCommit: No                Snapshots:   0

   Nodes    :  3/ 4		Volumes:  0 Up
   Self Heal:  3/ 4		          1 Up(Degraded)
   Bricks   :  3/ 4		          0 Up(Partial)
   Clients  :     1                       0 Down

Volume Information
	splunk           UP(DEGRADED) - 3/4 bricks up - Distributed-Replicate
	                 Capacity: (18% used) 3.00 GiB/18.00 GiB (used/total)
	                 Snapshots: 0
	                 Self Heal:  3/ 4
	                 Tasks Active: None
	                 Protocols: glusterfs:on  NFS:on  SMB:off
	                 Gluster Clients : 1

	splunk---------- +
	                 |
                Distribute (dht)
                         |
                         +-- Repl Set 0 (afr)
                         |     |
                         |     +--splunk-rhs1:/rhs/brick1/splunk(UP) 2.00 GiB/9.00 GiB
                         |     |
                         |     +--splunk-rhs2:/rhs/brick1/splunk(UP) 2.00 GiB/9.00 GiB
                         |
                         +-- Repl Set 1 (afr)
                               |
                               +--splunk-rhs3:/rhs/brick1/splunk(DOWN) 0.00 KiB/0.00 KiB
                               |
                               +--splunk-rhs4:/rhs/brick1/splunk(UP) 2.00 GiB/9.00 GiB
 Status Messages
  - Cluster is UNHEALTHY
  - Cluster node 'splunk-rhs3' is down
  - Self heal daemon is down on splunk-rhs3
  - Brick splunk-rhs3:/rhs/brick1/splunk in volume 'splunk' is down/unavailable
  - INFO -> Not all bricks are online, so capacity provided is NOT accurate
Example 2, displays the output of the command when the
-l switch is used. The brick layout mode shows the brick and node relationships. This provides a simple means of checking replication relationships for bricks across nodes is as intended.
Table 14.3. Field Descriptions of the gstatus command output
| Field | Description |
|---|---|
| Capacity Information | This information is derived from the brick information taken from the vol status detail command. The accuracy of this number hence depends on the nodes and bricks all being online - elements missing from the configuration are not considered in the calculation. |
| Over-commit Status | The physical file system used by a brick could be re-used by multiple volumes, this field indicates whether a brick is used by multiple volumes. Although technically valid, this exposes the system to capacity conflicts across different volumes when the quota feature is not in use. |
| Clients | Displays a count of the unique clients connected against the trusted pool and each of the volumes. Multiple mounts from the same client are hence ignored in this calculation. |
| Nodes / Self Heal / Bricks X/Y | This indicates that X components of Y total/expected components within the trusted pool are online. In Example 2, note that 3/4 is displayed against all of these fields – indicating that the node, brick and the self heal daemon are unavailable. |
| Tasks Active | Active background tasks such as rebalance are displayed here against individual volumes. |
| Protocols | Displays which protocols have been enabled for the volume. In the case of SMB, this does not denote that Samba is configured and is active. |
| Snapshots | Displays a count of the number of snapshots taken for the volume. The snapshot count for each volume is rolled up to the trusted storage pool to provide a high level view of the number of snapshots in the environment. |
| Status Messages | After the information is gathered, any errors detected are reported in the Status Messages section. These descriptions provide a view of the problem and the potential impact of the condition. |