
2.5.2. top
While
free displays only memory-related information, the top command does a little bit of everything. CPU utilization, process statistics, memory utilization -- top monitors it all. In addition, unlike the free command, top's default behavior is to run continuously; there is no need to use the watch command. Here is a sample display:
14:06:32 up 4 days, 21:20, 4 users, load average: 0.00, 0.00, 0.00 77 processes: 76 sleeping, 1 running, 0 zombie, 0 stopped CPU states: cpu user nice system irq softirq iowait idle total 19.6% 0.0% 0.0% 0.0% 0.0% 0.0% 180.2% cpu00 0.0% 0.0% 0.0% 0.0% 0.0% 0.0% 100.0% cpu01 19.6% 0.0% 0.0% 0.0% 0.0% 0.0% 80.3% Mem: 1028548k av, 716604k used, 311944k free, 0k shrd, 131056k buff 324996k actv, 108692k in_d, 13988k in_c Swap: 1020116k av, 5276k used, 1014840k free 382228k cached PID USER PRI NI SIZE RSS SHARE STAT %CPU %MEM TIME CPU COMMAND 17578 root 15 0 13456 13M 9020 S 18.5 1.3 26:35 1 rhn-applet-gu 19154 root 20 0 1176 1176 892 R 0.9 0.1 0:00 1 top 1 root 15 0 168 160 108 S 0.0 0.0 0:09 0 init 2 root RT 0 0 0 0 SW 0.0 0.0 0:00 0 migration/0 3 root RT 0 0 0 0 SW 0.0 0.0 0:00 1 migration/1 4 root 15 0 0 0 0 SW 0.0 0.0 0:00 0 keventd 5 root 34 19 0 0 0 SWN 0.0 0.0 0:00 0 ksoftirqd/0 6 root 35 19 0 0 0 SWN 0.0 0.0 0:00 1 ksoftirqd/1 9 root 15 0 0 0 0 SW 0.0 0.0 0:07 1 bdflush 7 root 15 0 0 0 0 SW 0.0 0.0 1:19 0 kswapd 8 root 15 0 0 0 0 SW 0.0 0.0 0:14 1 kscand 10 root 15 0 0 0 0 SW 0.0 0.0 0:03 1 kupdated 11 root 25 0 0 0 0 SW 0.0 0.0 0:00 0 mdrecoveryd
The display is divided into two sections. The top section contains information related to overall system status -- uptime, load average, process counts, CPU status, and utilization statistics for both memory and swap space. The lower section displays process-level statistics. It is possible to change what is displayed while
top is running. For example, top by default displays both idle and non-idle processes. To display only non-idle processes, press i; a second press returns to the default display mode.
Warning
Although
top appears like a simple display-only program, this is not the case. That is because top uses single character commands to perform various operations. For example, if you are logged in as root, it is possible to change the priority and even kill any process on your system. Therefore, until you have reviewed top's help screen (type ? to display it), it is safest to only type q (which exits top).
2.5.2.1. The GNOME System Monitor -- A Graphical top
If you are more comfortable with graphical user interfaces, the GNOME System Monitor may be more to your liking. Like
top, the GNOME System Monitor displays information related to overall system status, process counts, memory and swap utilization, and process-level statistics.
However, the GNOME System Monitor goes a step further by also including graphical representations of CPU, memory, and swap utilization, along with a tabular disk space utilization listing. An example of the GNOME System Monitor's Process Listing display appears in Figure 2.1, “The GNOME System Monitor Process Listing Display”.
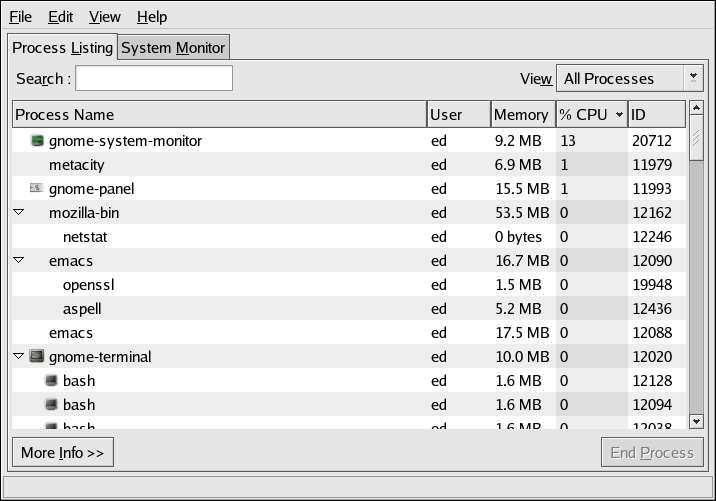
Figure 2.1. The GNOME System Monitor Process Listing Display
Additional information can be displayed for a specific process by first clicking on the desired process and then clicking on the button.
To display the CPU, memory, and disk usage statistics, click on the System Monitor tab.