
13.2. Configuring Prometheus metrics monitoring for Decision Server on Red Hat OpenShift Container Platform
You can configure your Decision Server deployment on Red Hat OpenShift Container Platform to use Prometheus to collect and store metrics related to your business asset activity in Red Hat Decision Manager. For the list of available metrics that Decision Server exposes with Prometheus, download the Red Hat Decision Manager 7.5.1 Source Distribution from the Red Hat Customer Portal and navigate to ~/rhdm-7.5.1-sources/src/droolsjbpm-integration-$VERSION/kie-server-parent/kie-server-services/kie-server-services-prometheus/src/main/java/org/kie/server/services/prometheus.
Prerequisites
- Decision Server is installed and deployed on Red Hat OpenShift Container Platform. For more information about Decision Server on OpenShift, see the relevant OpenShift deployment option in the Product documentation for Red Hat Decision Manager 7.5.
-
You have
kie-serveruser role access to Decision Server. - Prometheus Operator is installed. For information about downloading and using Prometheus Operator, see the Prometheus Operator project on GitHub.
Procedure
In the
DeploymentConfigobject of your Decision Server deployment on OpenShift, set thePROMETHEUS_SERVER_EXT_DISABLEDenvironment variable tofalseto enable the Prometheus extension. You can set this variable in the OpenShift web console or use theoccommand in a command terminal:oc set env dc/<dc_name> PROMETHEUS_SERVER_EXT_DISABLED=false -n <namespace>
If you have not yet deployed your Decision Server on OpenShift, then in the OpenShift template that you plan to use for your OpenShift deployment (for example,
rhdm75-prod-immutable-kieserver.yaml), you can set thePROMETHEUS_SERVER_EXT_DISABLEDtemplate parameter tofalseto enable the Prometheus extension.If you are using the OpenShift Operator to deploy Decision Server on OpenShift, then in your Decision Server configuration, set the
PROMETHEUS_SERVER_EXT_DISABLEDenvironment variable tofalseto enable the Prometheus extension:apiVersion: app.kiegroup.org/v1 kind: KieApp metadata: name: enable-prometheus spec: environment: rhpam-trial objects: servers: - env: - name: PROMETHEUS_SERVER_EXT_DISABLED value: "false"Create a
service-metrics.yamlfile to add a service that exposes the metrics from Decision Server to Prometheus:apiVersion: v1 kind: Service metadata: annotations: description: RHDM Prometheus metrics exposed labels: app: myapp-kieserver application: myapp-kieserver template: myapp-kieserver metrics: rhdm name: rhdm-app-metrics spec: ports: - name: web port: 8080 protocol: TCP targetPort: 8080 selector: deploymentConfig: myapp-kieserver sessionAffinity: None type: ClusterIPIn a command terminal, use the
occommand to apply theservice-metrics.yamlfile to your OpenShift deployment:oc apply -f service-metrics.yaml
-
Create an OpenShift secret, such as
metrics-secret, to access the Prometheus metrics on Decision Server. The secret must contain the "username" and "password" elements with Decision Server user credentials. For information about OpenShift secrets, see the Secrets chapter in the OpenShift Developer Guide. Create a
service-monitor.yamlfile that defines theServiceMonitorobject. A service monitor enables Prometheus to connect to the Decision Server metrics service.apiVersion: monitoring.coreos.com/v1 kind: ServiceMonitor metadata: name: rhdm-service-monitor labels: team: frontend spec: selector: matchLabels: metrics: rhdm endpoints: - port: web path: /services/rest/metrics basicAuth: password: name: metrics-secret key: password username: name: metrics-secret key: usernameIn a command terminal, use the
occommand to apply theservice-monitor.yamlfile to your OpenShift deployment:oc apply -f service-monitor.yaml
After you complete these configurations, Prometheus begins collecting metrics and Decision Server publishes the metrics to the REST API endpoint
http://HOST:PORT/kie-server/services/rest/metrics.You can interact with your collected metrics in the Prometheus expression browser at
http://HOST:PORT/graph, or integrate your Prometheus data source with a data-graphing tool such as Grafana.The host and port for the Prometheus expression browser location
http://HOST:PORT/graphwas defined in the route where you exposed the Prometheus web console when you installed the Prometheus Operator. For information about OpenShift routes, see the Routes chapter in the OpenShift Architecture documentation.図13.5 Prometheus expression browser with Decision Server metrics
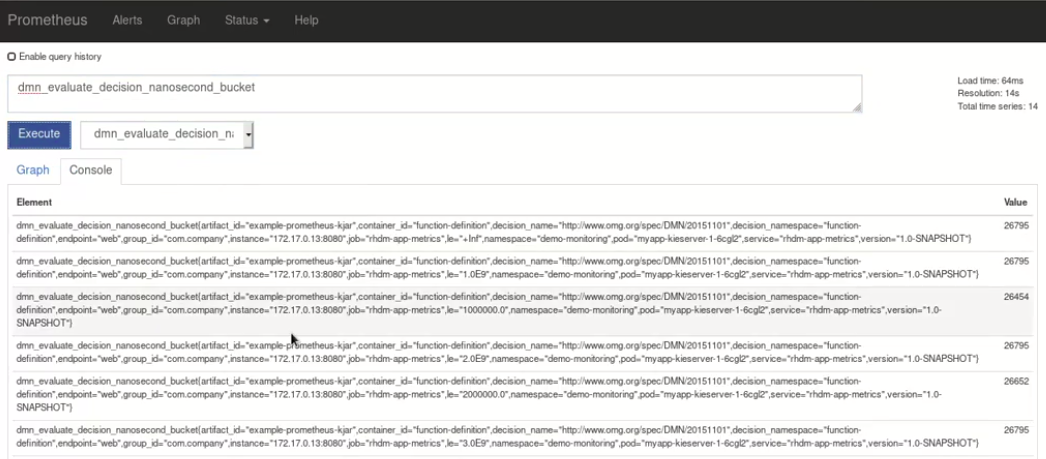
図13.6 Prometheus expression browser with Decision Server target
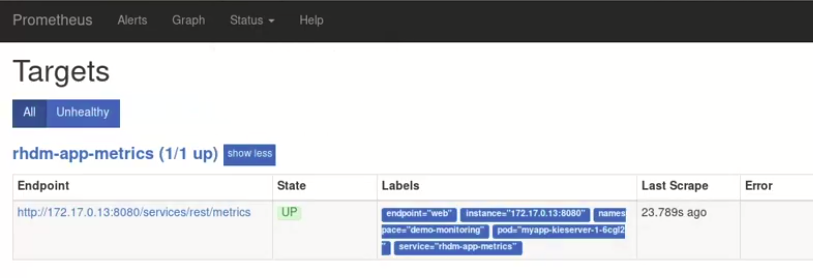
図13.7 Grafana dashboard with Decision Server metrics for DMN models
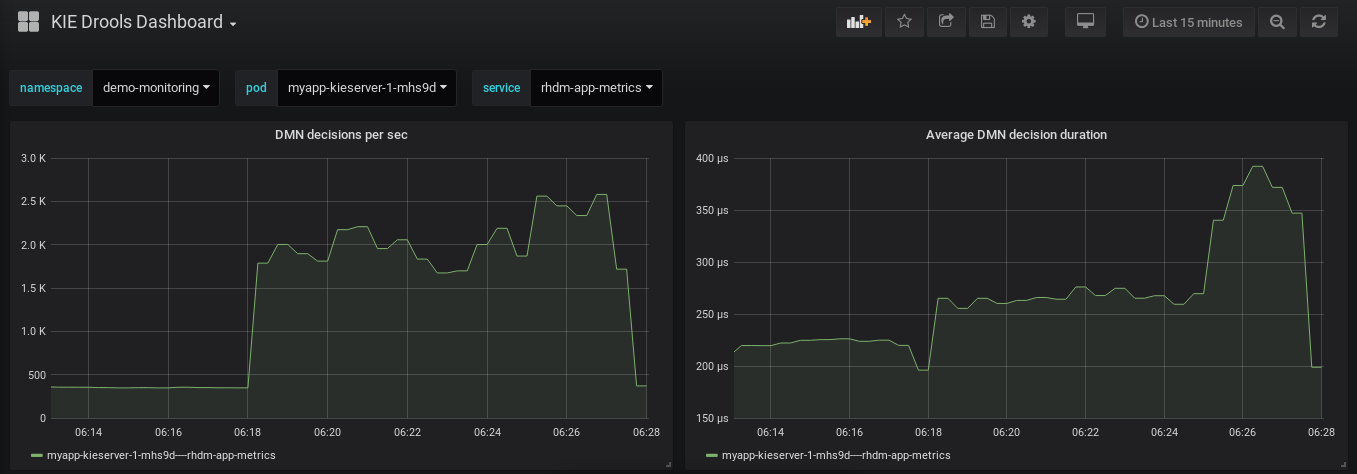
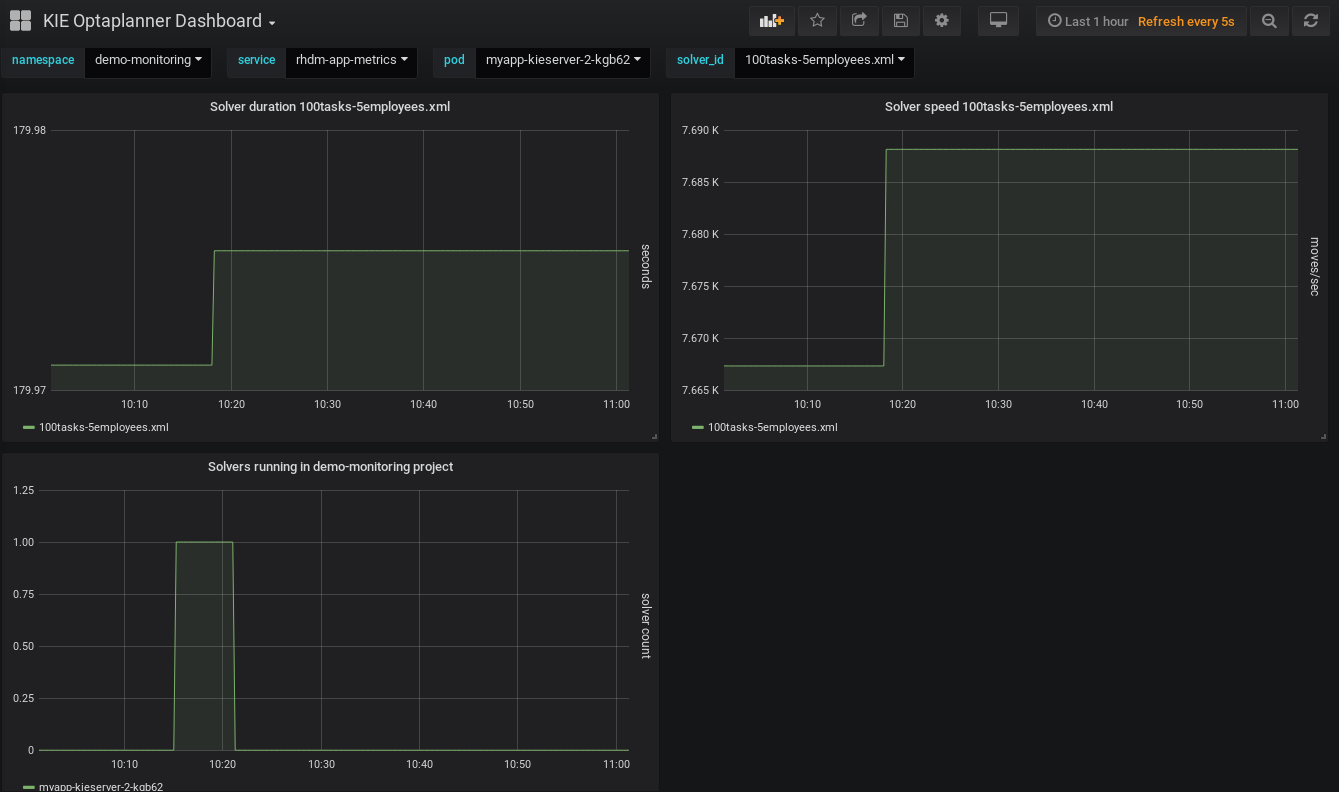
図13.8 Grafana dashboard with Decision Server metrics for solvers
Additional resources