
Chapter 6. Introducing Metrics to Kafka
This section describes setup options for monitoring your AMQ Streams deployment.
Depending on your requirements, you can:
When you have Prometheus and Grafana enabled, Kafka Exporter provides additional monitoring related to consumer lag.
Additionally, you can configure your deployment to track messages end-to-end by setting up distributed tracing.
Additional resources
- For more information about Prometheus, see the Prometheus documentation.
- For more information about Grafana, see the Grafana documentation.
- Apache Kafka Monitoring describes JMX metrics exposed by Apache Kafka.
- ZooKeeper JMX describes JMX metrics exposed by Apache ZooKeeper.
6.1. Add Prometheus and Grafana
This section describes how to monitor AMQ Streams Kafka, ZooKeeper, Kafka Connect, and Kafka MirrorMaker and MirrorMaker 2.0 clusters using Prometheus to provide monitoring data for example Grafana dashboards.
Prometheus and Grafana can be also used to monitor the operators. The example Grafana dashboard for operators provides:
- Information about the operator such as the number of reconciliations or number of Custom Resources they are processing
- JVM metrics from the operators
In order to run the example Grafana dashboards, you must:
The resources referenced in this section are intended as a starting point for setting up monitoring, but they are provided as examples only. If you require further support on configuring and running Prometheus or Grafana in production, try reaching out to their respective communities.
6.1.1. Example Metrics files
You can find the example metrics configuration files in the examples/metrics directory.
metrics
├── grafana-install
│   ├── grafana.yaml 1
├── grafana-dashboards 2
│   ├── strimzi-kafka-connect.json
│   ├── strimzi-kafka.json
│   ├── strimzi-zookeeper.json
│   ├── strimzi-kafka-mirror-maker-2.json
│   ├── strimzi-operators.json
│   └── strimzi-kafka-exporter.json 3
├── kafka-connect-metrics.yaml 4
├── kafka-metrics.yaml 5
├── prometheus-additional-properties
│   └── prometheus-additional.yaml 6
├── prometheus-alertmanager-config
│   └── alert-manager-config.yaml 7
└── prometheus-install
    ├── alert-manager.yaml 8
    ├── prometheus-rules.yaml 9
    ├── prometheus.yaml 10
    ├── strimzi-pod-monitor.yaml 11
    └── strimzi-service-monitor.yaml 12
- 1
- Installation file for the Grafana image
- 2
- Grafana dashboards
- 3
- Grafana dashboard specific to Kafka Exporter
- 4
- Metrics configuration that defines Prometheus JMX Exporter relabeling rules for Kafka Connect
- 5
- Metrics configuration that defines Prometheus JMX Exporter relabeling rules for Kafka and ZooKeeper
- 6
- Configuration to add roles for service monitoring
- 7
- Hook definitions for sending notifications through Alertmanager
- 8
- Resources for deploying and configuring Alertmanager
- 9
- Alerting rules examples for use with Prometheus Alertmanager (deployed with Prometheus)
- 10
- Installation file for the Prometheus image
- 11
- Prometheus job definitions to scrape metrics data from pods
- 12
- Prometheus job definitions to scrape metrics data from services
6.1.2. Exposing Prometheus metrics
AMQ Streams uses the Prometheus JMX Exporter to expose JMX metrics from Kafka and ZooKeeper using an HTTP endpoint, which is then scraped by the Prometheus server.
6.1.2.1. Prometheus metrics configuration
AMQ Streams provides example configuration files for Grafana.
Grafana dashboards are dependent on Prometheus JMX Exporter relabeling rules, which are defined for:
-
Kafka and ZooKeeper as a
Kafkaresource configuration in the examplekafka-metrics.yamlfile -
Kafka Connect as
KafkaConnectandKafkaConnectS2Iresources in the examplekafka-connect-metrics.yamlfile
A label is a name-value pair. Relabeling is the process of writing a label dynamically. For example, the value of a label may be derived from the name of a Kafka server and client ID.
We show metrics configuration using kafka-metrics.yaml in this section, but the process is the same when configuring Kafka Connect using the kafka-connect-metrics.yaml file.
Additional resources
For more information on the use of relabeling, see Configuration in the Prometheus documentation.
6.1.2.2. Prometheus metrics deployment options
To apply the example metrics configuration of relabeling rules to your Kafka cluster, do one of the following:
6.1.2.3. Copying Prometheus metrics configuration to a Kafka resource
To use Grafana dashboards for monitoring, you can copy the example metrics configuration to a Kafka resource.
Procedure
Execute the following steps for each Kafka resource in your deployment.
Update the
Kafkaresource in an editor.oc edit kafka my-cluster-
Copy the example configuration in
kafka-metrics.yamlto your ownKafkaresource definition. - Save the file, exit the editor and wait for the updated resource to be reconciled.
6.1.2.4. Deploying a Kafka cluster with Prometheus metrics configuration
To use Grafana dashboards for monitoring, you can deploy an example Kafka cluster with metrics configuration.
Procedure
Deploy the Kafka cluster with the metrics configuration:
oc apply -f kafka-metrics.yaml
6.1.3. Setting up Prometheus
Prometheus provides an open source set of components for systems monitoring and alert notification.
We describe here how you can use the CoreOS Prometheus Operator to run and manage a Prometheus server that is suitable for use in production environments, but with the correct configuration you can run any Prometheus server.
The Prometheus server configuration uses service discovery to discover the pods in the cluster from which it gets metrics. For this feature to work correctly, the service account used for running the Prometheus service pod must have access to the API server so it can retrieve the pod list.
For more information, see Discovering services.
6.1.3.1. Prometheus configuration
AMQ Streams provides example configuration files for the Prometheus server.
A Prometheus image is provided for deployment:
-
prometheus.yaml
Additional Prometheus-related configuration is also provided in the following files:
-
prometheus-additional.yaml -
prometheus-rules.yaml -
strimzi-pod-monitor.yaml -
strimzi-service-monitor.yaml
For Prometheus to obtain monitoring data:
Then use the configuration files to:
Alerting rules
The prometheus-rules.yaml file provides example alerting rule examples for use with Alertmanager.
6.1.3.2. Prometheus resources
When you apply the Prometheus configuration, the following resources are created in your OpenShift cluster and managed by the Prometheus Operator:
-
A
ClusterRolethat grants permissions to Prometheus to read the health endpoints exposed by the Kafka and ZooKeeper pods, cAdvisor and the kubelet for container metrics. -
A
ServiceAccountfor the Prometheus pods to run under. -
A
ClusterRoleBindingwhich binds theClusterRoleto theServiceAccount. -
A
Deploymentto manage the Prometheus Operator pod. -
A
ServiceMonitorto manage the configuration of the Prometheus pod. -
A
Prometheusto manage the configuration of the Prometheus pod. -
A
PrometheusRuleto manage alerting rules for the Prometheus pod. -
A
Secretto manage additional Prometheus settings. -
A
Serviceto allow applications running in the cluster to connect to Prometheus (for example, Grafana using Prometheus as datasource).
6.1.3.3. Deploying the CoreOS Prometheus Operator
To deploy the Prometheus Operator to your Kafka cluster, apply the YAML bundle resources file from the Prometheus CoreOS repository.
Procedure
Download the
bundle.yamlresources file from the repository.On Linux, use:
curl -s https://raw.githubusercontent.com/coreos/prometheus-operator/master/bundle.yaml | sed -e 's/namespace: .*/namespace: my-namespace/' > prometheus-operator-deployment.yamlOn MacOS, use:
curl -s https://raw.githubusercontent.com/coreos/prometheus-operator/master/bundle.yaml | sed -e '' 's/namespace: .*/namespace: my-namespace/' > prometheus-operator-deployment.yamlReplace the example
namespacewith your own.NoteIf using OpenShift, specify a release of the OpenShift fork of the Prometheus Operator repository.
-
(Optional) If it is not required, you can manually remove the
spec.template.spec.securityContextproperty from theprometheus-operator-deployment.yamlfile. Deploy the Prometheus Operator:
oc apply -f prometheus-operator-deployment.yaml
6.1.3.4. Deploying Prometheus
To deploy Prometheus to your Kafka cluster to obtain monitoring data, apply the example resource file for the Prometheus docker image and the YAML files for Prometheus-related resources.
The deployment process creates a ClusterRoleBinding and discovers an Alertmanager instance in the namespace specified for the deployment.
By default, the Prometheus Operator only supports jobs that include an endpoints role for service discovery. Targets are discovered and scraped for each endpoint port address. For endpoint discovery, the port address may be derived from service (role: service) or pod (role: pod) discovery.
Prerequisites
- Check the example alerting rules provided
Procedure
Modify the Prometheus installation file (
prometheus.yaml) according to the namespace Prometheus is going to be installed into:On Linux, use:
sed -i 's/namespace: .*/namespace: my-namespace/' prometheus.yamlOn MacOS, use:
sed -i '' 's/namespace: .*/namespace: my-namespace/' prometheus.yaml-
Edit the
ServiceMonitorresource instrimzi-service-monitor.yamlto define Prometheus jobs that will scrape the metrics data from services.ServiceMonitoris used to scrape metrics through services and is used for Apache Kafka, ZooKeeper. -
Edit the
PodMonitorresource instrimzi-pod-monitor.yamlto define Prometheus jobs that will scrape the metrics data from pods.PodMonitoris used to scrape data directly from pods and is used for Operators. To use another role:
Create a
Secretresource:oc create secret generic additional-scrape-configs --from-file=prometheus-additional.yaml
-
Edit the
additionalScrapeConfigsproperty in theprometheus.yamlfile to include the name of theSecretand the YAML file (prometheus-additional.yaml) that contains the additional configuration.
Deploy the Prometheus resources:
oc apply -f strimzi-service-monitor.yaml
oc apply -f strimzi-pod-monitor.yaml
oc apply -f prometheus-rules.yaml
oc apply -f prometheus.yaml
6.1.4. Setting up Prometheus Alertmanager
Prometheus Alertmanager is a plugin for handling alerts and routing them to a notification service. Alertmanager supports an essential aspect of monitoring, which is to be notified of conditions that indicate potential issues based on alerting rules.
6.1.4.1. Alertmanager configuration
AMQ Streams provides example configuration files for Prometheus Alertmanager.
A configuration file defines the resources for deploying Alertmanager:
-
alert-manager.yaml
An additional configuration file provides the hook definitions for sending notifications from your Kafka cluster.
-
alert-manager-config.yaml
For Alertmanger to handle Prometheus alerts, use the configuration files to:
6.1.4.2. Alerting rules
Alerting rules provide notifications about specific conditions observed in the metrics. Rules are declared on the Prometheus server, but Prometheus Alertmanager is responsible for alert notifications.
Prometheus alerting rules describe conditions using PromQL expressions that are continuously evaluated.
When an alert expression becomes true, the condition is met and the Prometheus server sends alert data to the Alertmanager. Alertmanager then sends out a notification using the communication method configured for its deployment.
Alertmanager can be configured to use email, chat messages or other notification methods.
Additional resources
For more information about setting up alerting rules, see Configuration in the Prometheus documentation.
6.1.4.3. Alerting rule examples
Example alerting rules for Kafka and ZooKeeper metrics are provided with AMQ Streams for use in a Prometheus deployment.
General points about the alerting rule definitions:
-
A
forproperty is used with the rules to determine the period of time a condition must persist before an alert is triggered. -
A tick is a basic ZooKeeper time unit, which is measured in milliseconds and configured using the
tickTimeparameter ofKafka.spec.zookeeper.config. For example, if ZooKeepertickTime=3000, 3 ticks (3 x 3000) equals 9000 milliseconds. -
The availability of the
ZookeeperRunningOutOfSpacemetric and alert is dependent on the OpenShift configuration and storage implementation used. Storage implementations for certain platforms may not be able to supply the information on available space required for the metric to provide an alert.
Kafka alerting rules
UnderReplicatedPartitions-
Gives the number of partitions for which the current broker is the lead replica but which have fewer replicas than the
min.insync.replicasconfigured for their topic. This metric provides insights about brokers that host the follower replicas. Those followers are not keeping up with the leader. Reasons for this could include being (or having been) offline, and over-throttled interbroker replication. An alert is raised when this value is greater than zero, providing information on the under-replicated partitions for each broker. AbnormalControllerState- Indicates whether the current broker is the controller for the cluster. The metric can be 0 or 1. During the life of a cluster, only one broker should be the controller and the cluster always needs to have an active controller. Having two or more brokers saying that they are controllers indicates a problem. If the condition persists, an alert is raised when the sum of all the values for this metric on all brokers is not equal to 1, meaning that there is no active controller (the sum is 0) or more than one controller (the sum is greater than 1).
UnderMinIsrPartitionCount-
Indicates that the minimum number of in-sync replicas (ISRs) for a lead Kafka broker, specified using
min.insync.replicas, that must acknowledge a write operation has not been reached. The metric defines the number of partitions that the broker leads for which the in-sync replicas count is less than the minimum in-sync. An alert is raised when this value is greater than zero, providing information on the partition count for each broker that did not achieve the minimum number of acknowledgments. OfflineLogDirectoryCount- Indicates the number of log directories which are offline (for example, due to a hardware failure) so that the broker cannot store incoming messages anymore. An alert is raised when this value is greater than zero, providing information on the number of offline log directories for each broker.
KafkaRunningOutOfSpace-
Indicates the remaining amount of disk space that can be used for writing data. An alert is raised when this value is lower than 5GiB, providing information on the disk that is running out of space for each persistent volume claim. The threshold value may be changed in
prometheus-rules.yaml.
ZooKeeper alerting rules
AvgRequestLatency- Indicates the amount of time it takes for the server to respond to a client request. An alert is raised when this value is greater than 10 (ticks), providing the actual value of the average request latency for each server.
OutstandingRequests- Indicates the number of queued requests in the server. This value goes up when the server receives more requests than it can process. An alert is raised when this value is greater than 10, providing the actual number of outstanding requests for each server.
ZookeeperRunningOutOfSpace- Indicates the remaining amount of disk space that can be used for writing data to ZooKeeper. An alert is raised when this value is lower than 5GiB., providing information on the disk that is running out of space for each persistent volume claim.
6.1.4.4. Deploying Alertmanager
To deploy Alertmanager, apply the example configuration files.
The sample configuration provided with AMQ Streams configures the Alertmanager to send notifications to a Slack channel.
The following resources are defined on deployment:
-
An
Alertmanagerto manage the Alertmanager pod. -
A
Secretto manage the configuration of the Alertmanager. -
A
Serviceto provide an easy to reference hostname for other services to connect to Alertmanager (such as Prometheus).
Procedure
Create a
Secretresource from the Alertmanager configuration file (alert-manager-config.yaml):oc create secret generic alertmanager-alertmanager --from-file=alertmanager.yaml=alert-manager-config.yaml
Update the
alert-manager-config.yamlfile to replace the:-
slack_api_urlproperty with the actual value of the Slack API URL related to the application for the Slack workspace -
channelproperty with the actual Slack channel on which to send notifications
-
Deploy Alertmanager:
oc apply -f alert-manager.yaml
6.1.5. Setting up Grafana
Grafana provides visualizations of Prometheus metrics.
You can deploy and enable the example Grafana dashboards provided with AMQ Streams.
6.1.5.1. Grafana configuration
AMQ Streams provides example dashboard configuration files for Grafana.
A Grafana docker image is provided for deployment:
-
grafana.yaml
Example dashboards are also provided as JSON files:
-
strimzi-kafka.json -
strimzi-kafka-connect.json -
strimzi-zookeeper.json -
strimzi-kafka-mirror-maker-2.json -
strimzi-kafka-exporter.json -
strimzi-operators.json
The example dashboards are a good starting point for monitoring key metrics, but they do not represent all available metrics. You may need to modify the example dashboards or add other metrics, depending on your infrastructure.
For Grafana to present the dashboards, use the configuration files to:
6.1.5.2. Deploying Grafana
To deploy Grafana to provide visualizations of Prometheus metrics, apply the example configuration file.
Prerequisites
Procedure
Deploy Grafana:
oc apply -f grafana.yaml
- Enable the Grafana dashboards.
6.1.5.3. Enabling the example Grafana dashboards
Set up a Prometheus data source and example dashboards to enable Grafana for monitoring.
No alert notification rules are defined.
When accessing a dashboard, you can use the port-forward command to forward traffic from the Grafana pod to the host.
For example, you can access the Grafana user interface by:
-
Running
oc port-forward svc/grafana 3000:3000 -
Pointing a browser to
http://localhost:3000
The name of the Grafana pod is different for each user.
Procedure
Access the Grafana user interface using
admin/admincredentials.On the initial view choose to reset the password.

Click the Add data source button.
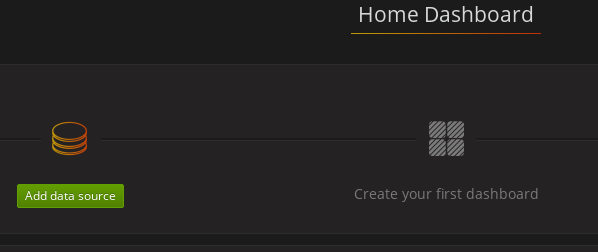
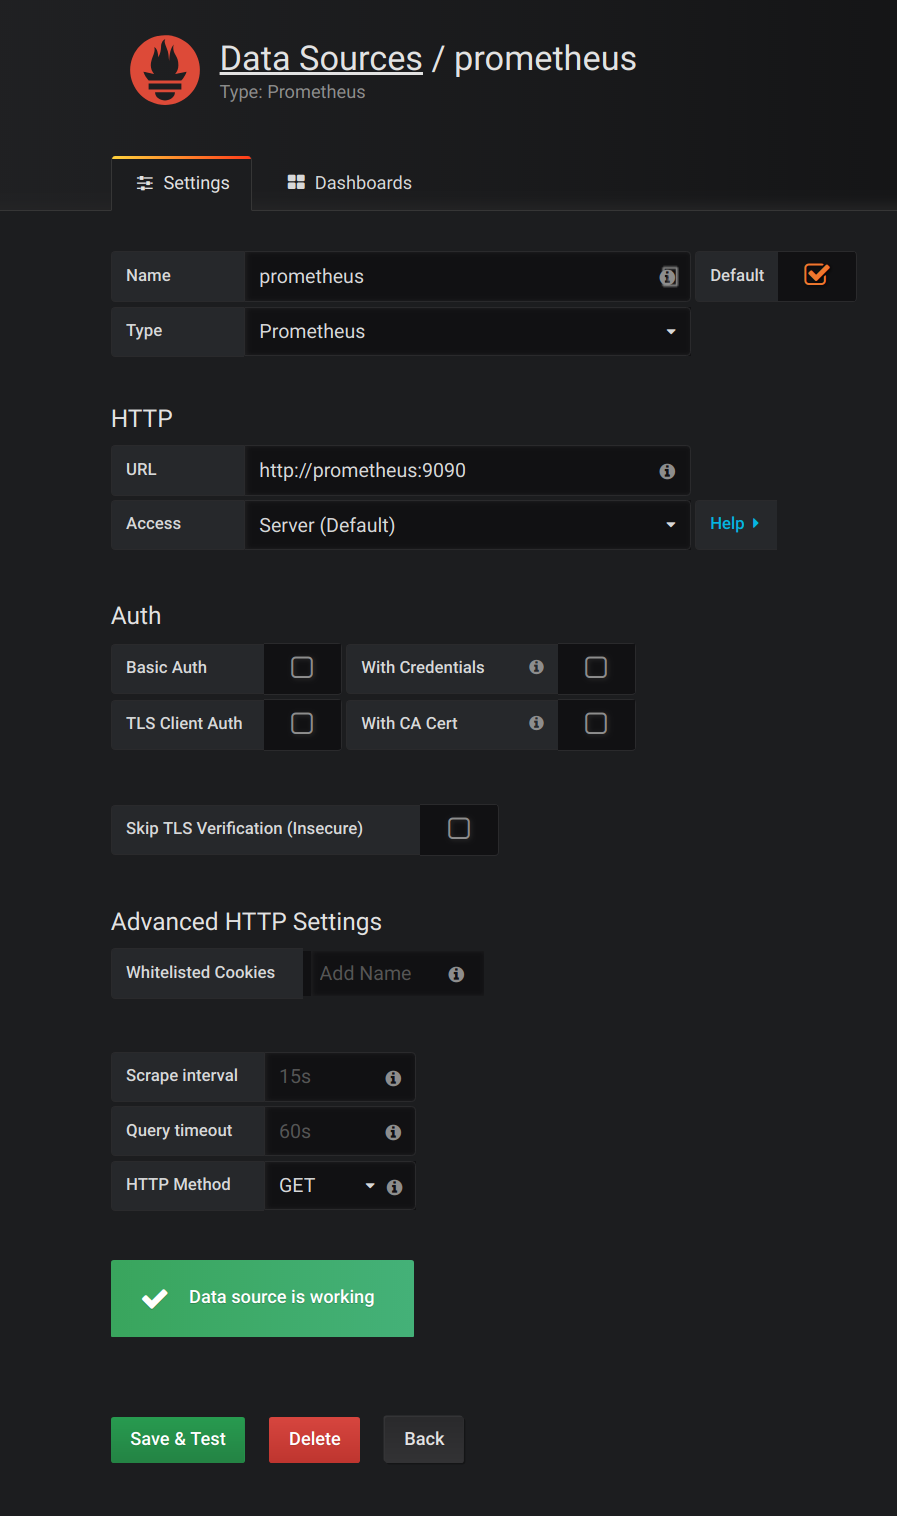
Add Prometheus as a data source.
- Specify a name
- Add Prometheus as the type
- Specify the connection string to the Prometheus server (http://prometheus-operated:9090) in the URL field
Click Add to test the connection to the data source.
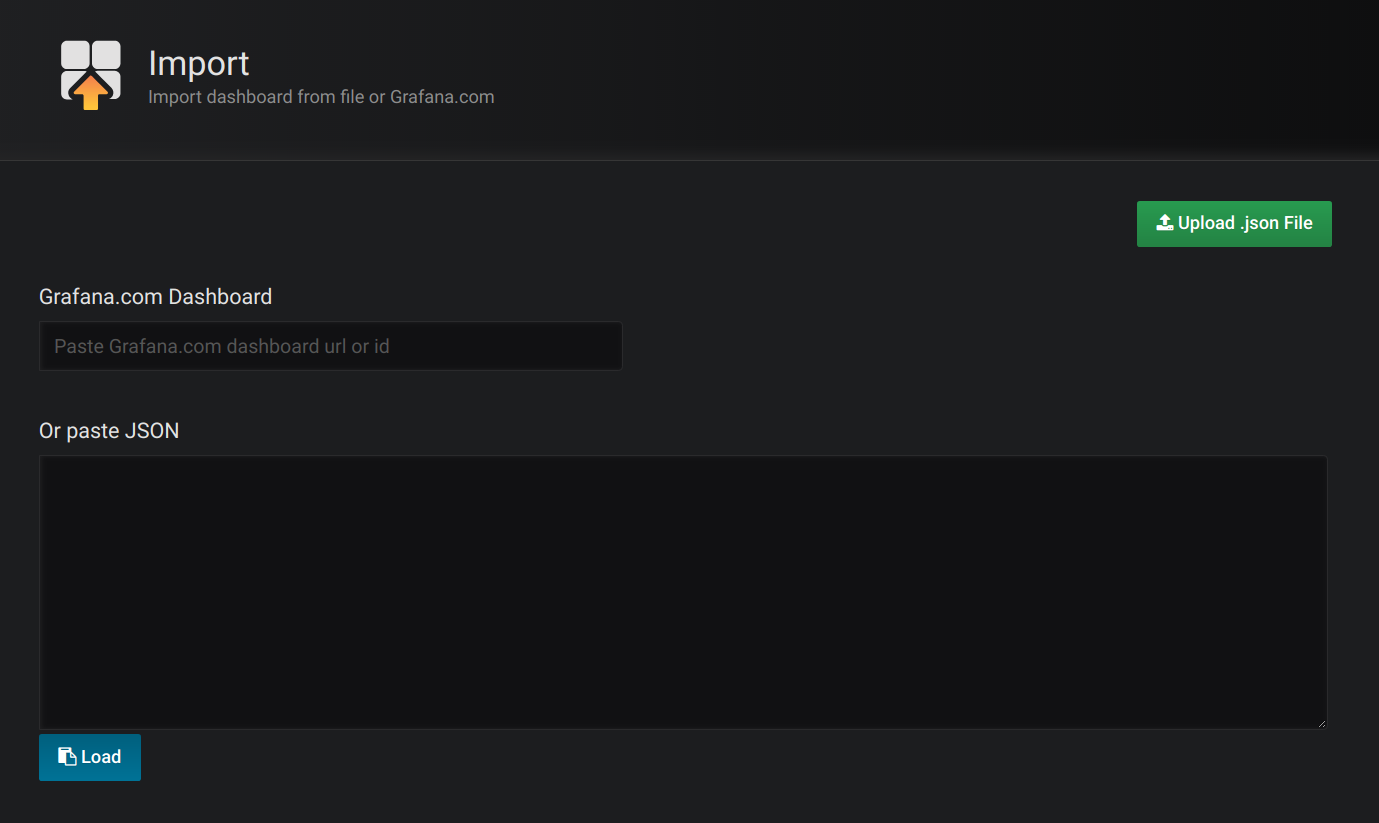
Click Dashboards, then Import to open the Import Dashboard window and import the example dashboards (or paste the JSON).
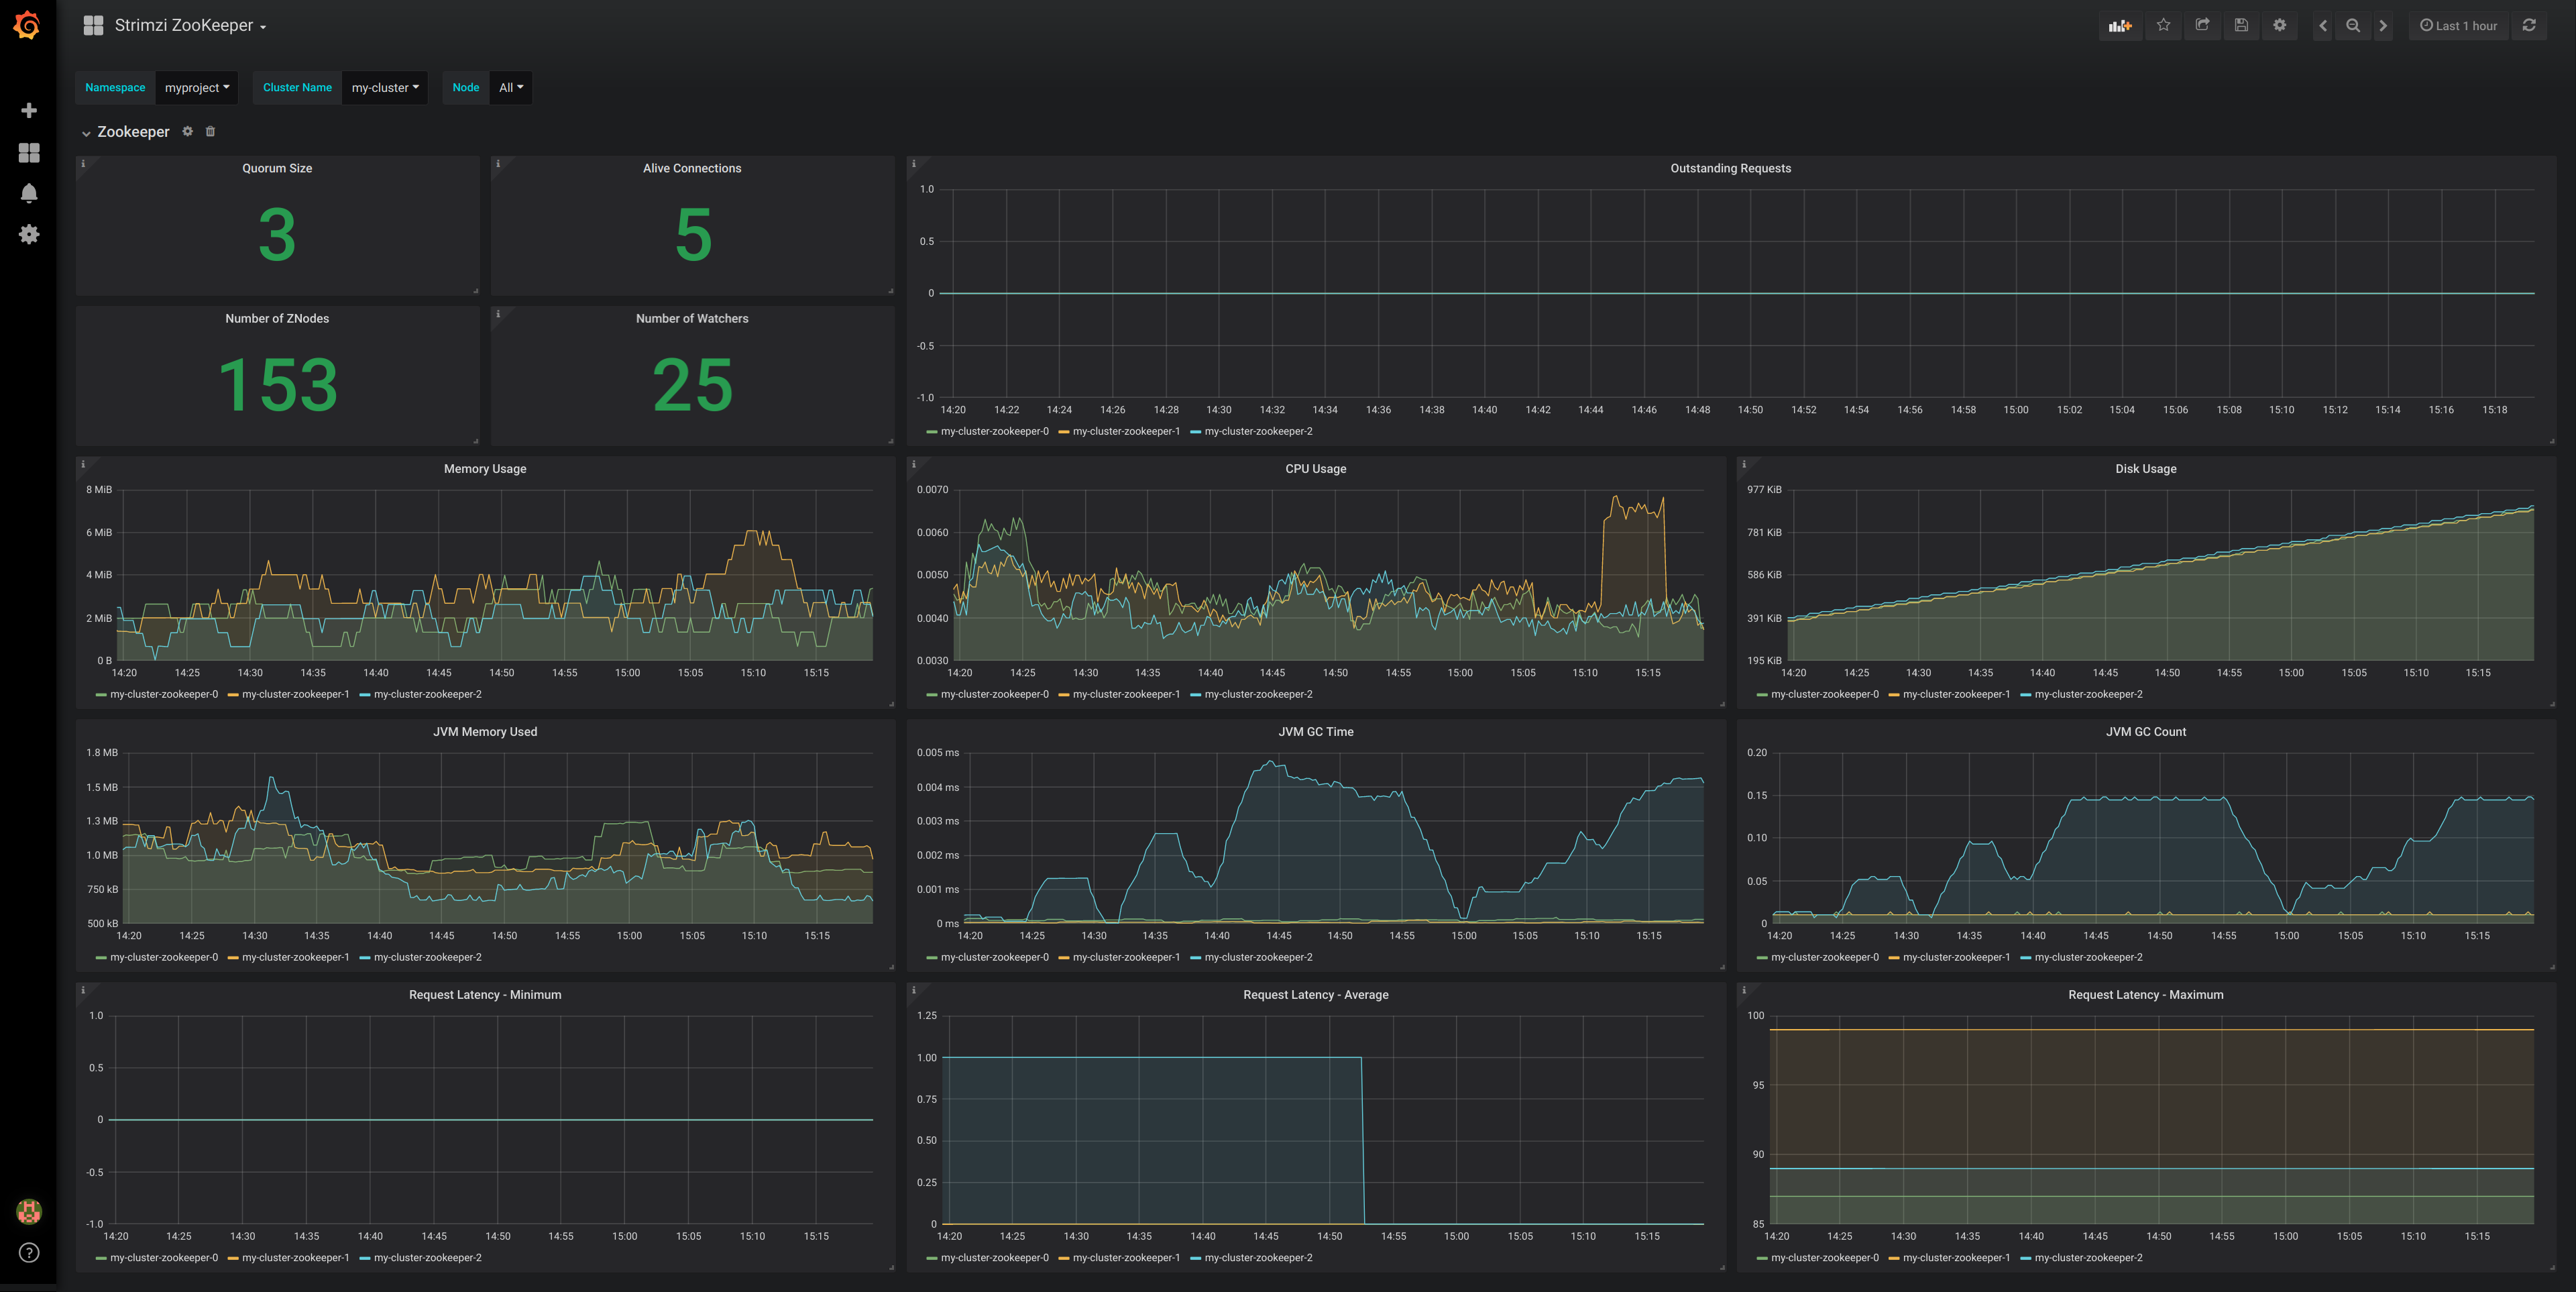
After importing the dashboards, the Grafana dashboard homepage presents Kafka and ZooKeeper dashboards.
When the Prometheus server has been collecting metrics for a AMQ Streams cluster for some time, the dashboards are populated.
Figure 6.1. Kafka dashboard
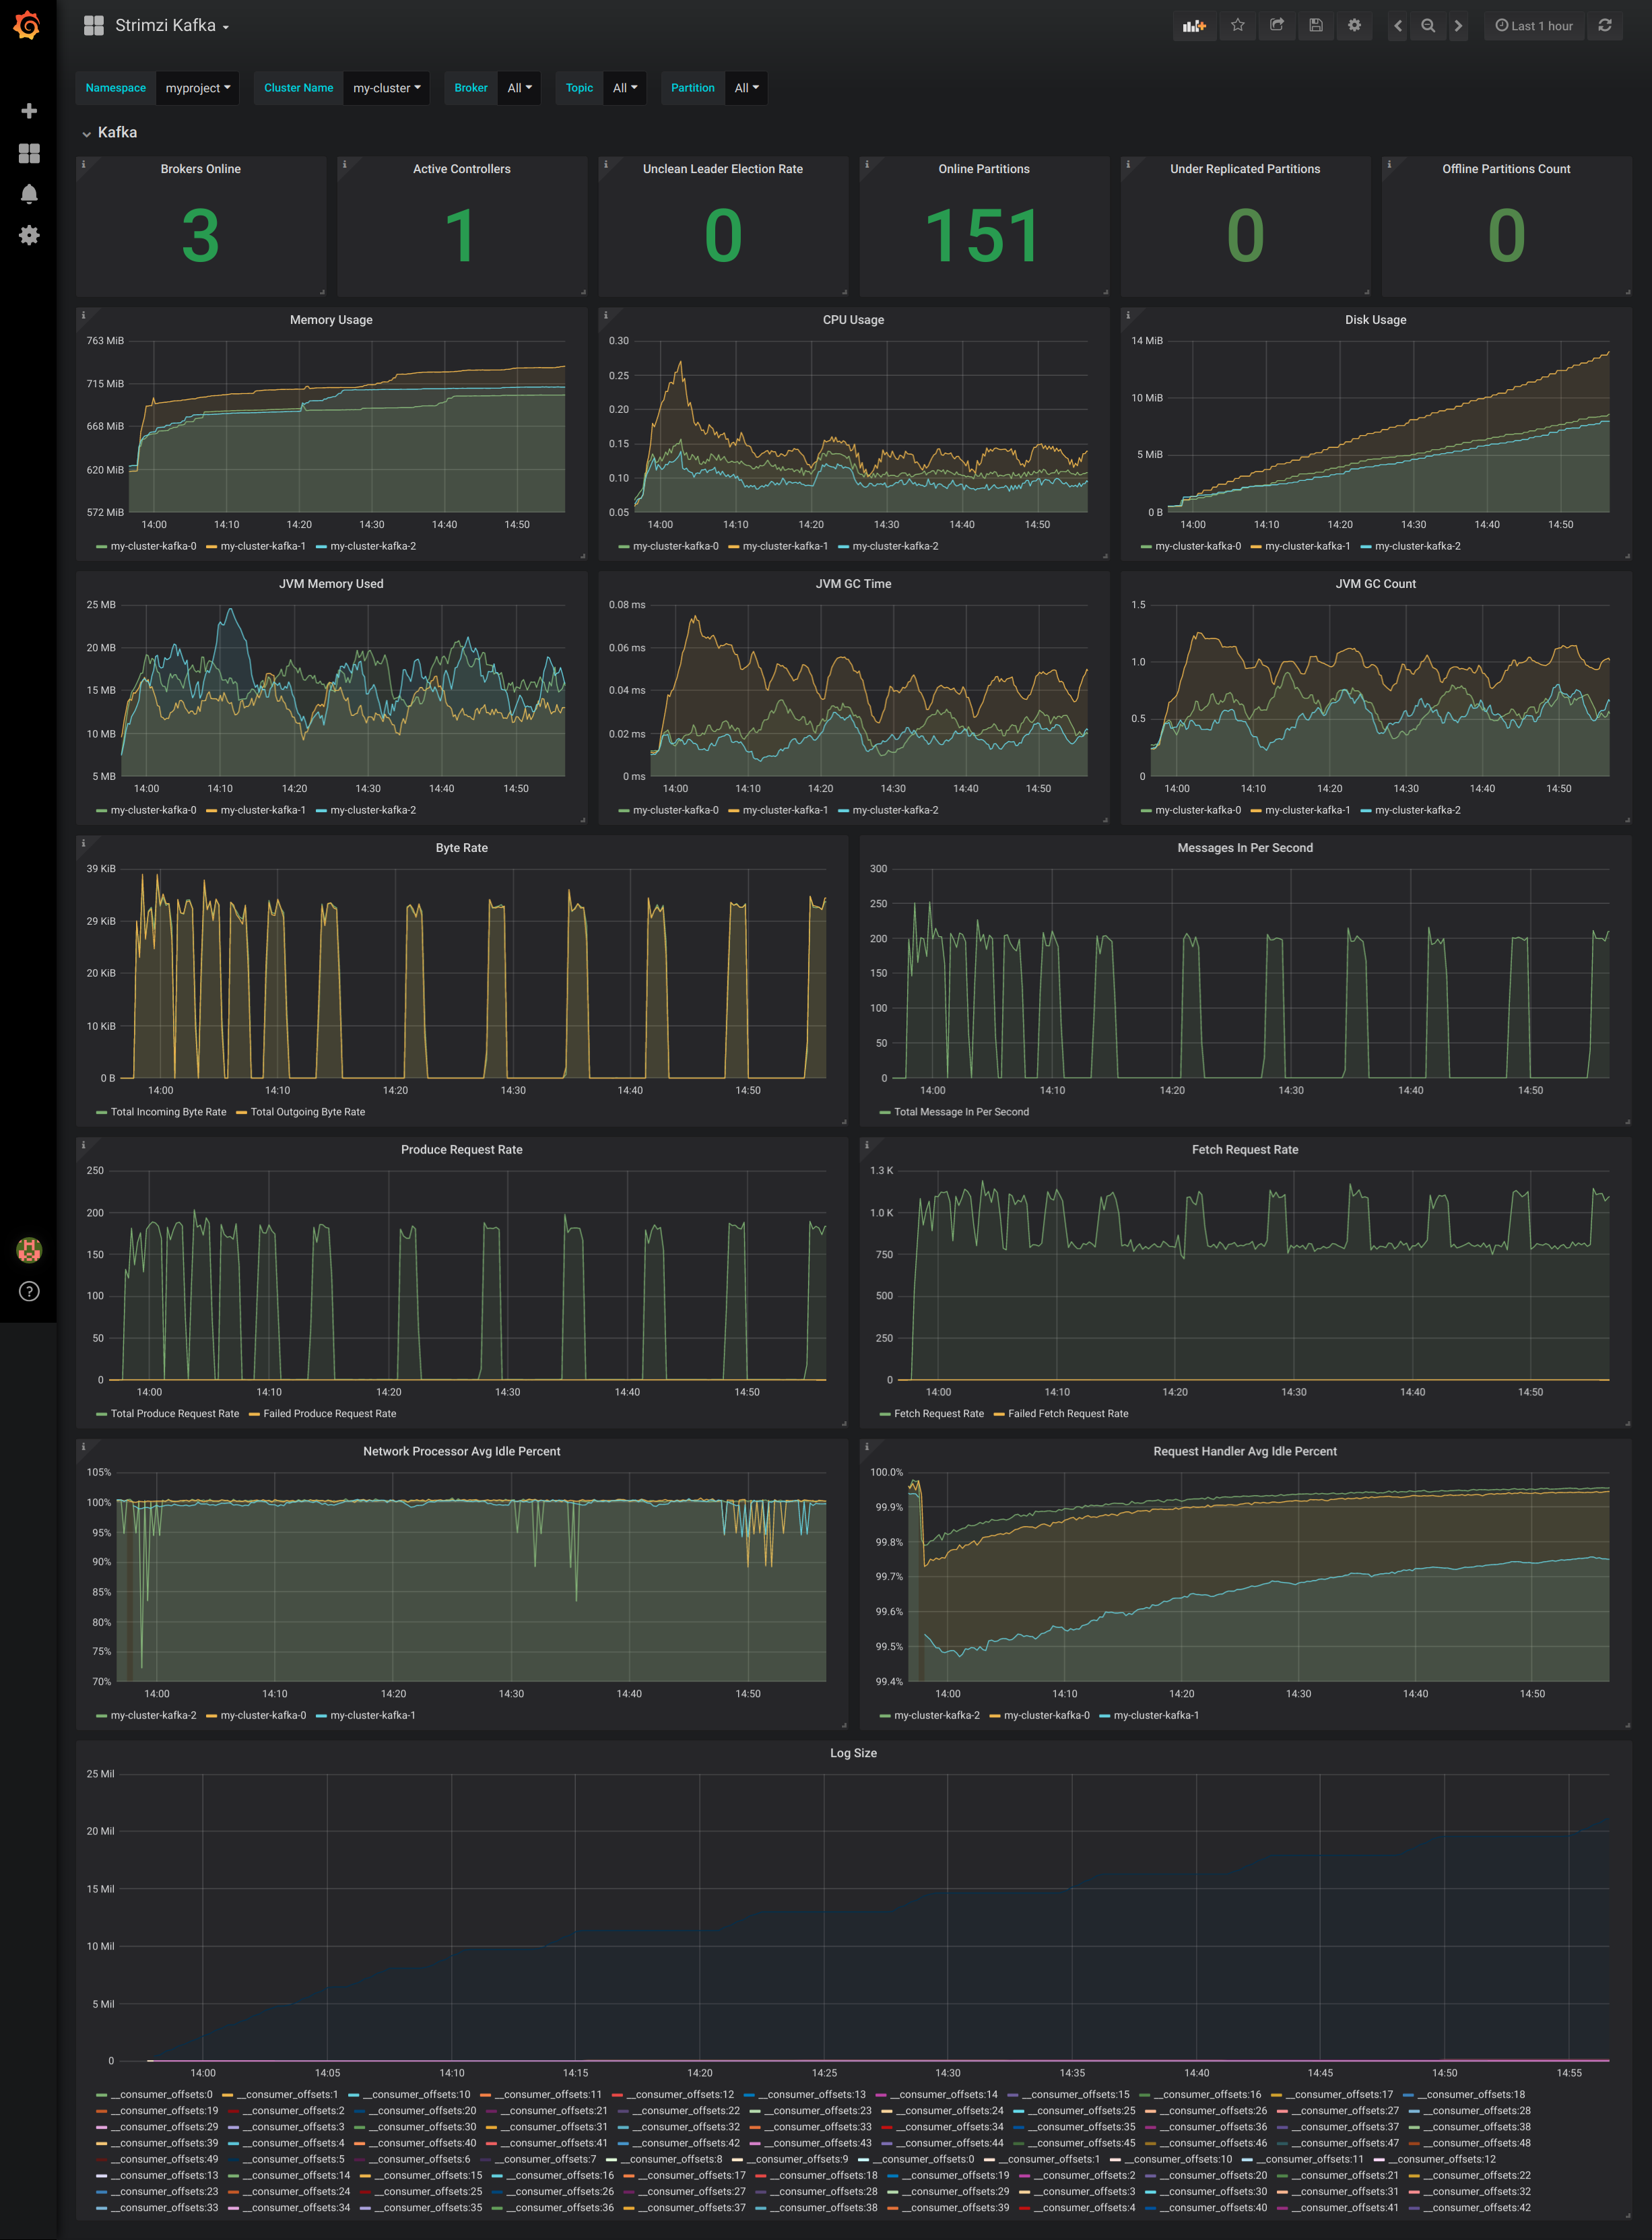
Figure 6.2. ZooKeeper dashboard
6.2. Add Kafka Exporter
Kafka Exporter is an open source project to enhance monitoring of Apache Kafka brokers and clients. Kafka Exporter is provided with AMQ Streams for deployment with a Kafka cluster to extract additional metrics data from Kafka brokers related to offsets, consumer groups, consumer lag, and topics.
The metrics data is used, for example, to help identify slow consumers.
Lag data is exposed as Prometheus metrics, which can then be presented in Grafana for analysis.
If you are already using Prometheus and Grafana for monitoring of built-in Kafka metrics, you can configure Prometheus to also scrape the Kafka Exporter Prometheus endpoint.
6.2.1. Monitoring Consumer lag
Consumer lag indicates the difference in the rate of production and consumption of messages. Specifically, consumer lag for a given consumer group indicates the delay between the last message in the partition and the message being currently picked up by that consumer.
The lag reflects the position of the consumer offset in relation to the end of the partition log.
Consumer lag between the producer and consumer offset
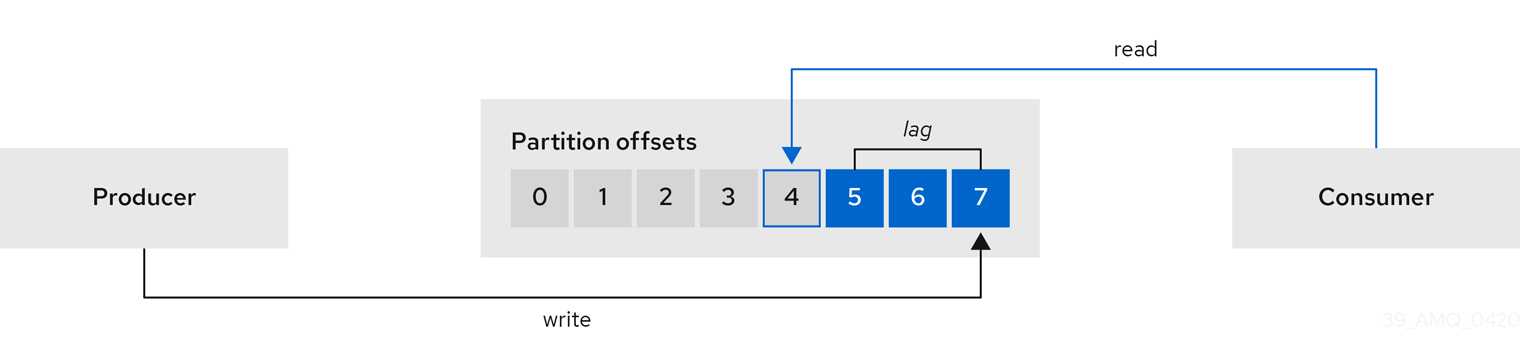
This difference is sometimes referred to as the delta between the producer offset and consumer offset: the read and write positions in the Kafka broker topic partitions.
Suppose a topic streams 100 messages a second. A lag of 1000 messages between the producer offset (the topic partition head) and the last offset the consumer has read means a 10-second delay.
The importance of monitoring consumer lag
For applications that rely on the processing of (near) real-time data, it is critical to monitor consumer lag to check that it does not become too big. The greater the lag becomes, the further the process moves from the real-time processing objective.
Consumer lag, for example, might be a result of consuming too much old data that has not been purged, or through unplanned shutdowns.
Reducing consumer lag
Typical actions to reduce lag include:
- Scaling-up consumer groups by adding new consumers
- Increasing the retention time for a message to remain in a topic
- Adding more disk capacity to increase the message buffer
Actions to reduce consumer lag depend on the underlying infrastructure and the use cases AMQ Streams is supporting. For instance, a lagging consumer is less likely to benefit from the broker being able to service a fetch request from its disk cache. And in certain cases, it might be acceptable to automatically drop messages until a consumer has caught up.
6.2.2. Example Kafka Exporter alerting rules
If you performed the steps to introduce metrics to your deployment, you will already have your Kafka cluster configured to use the alert notification rules that support Kafka Exporter.
The rules for Kafka Exporter are defined in prometheus-rules.yaml, and are deployed with Prometheus. For more information, see Prometheus.
The sample alert notification rules specific to Kafka Exporter are as follows:
UnderReplicatedPartition- An alert to warn that a topic is under-replicated and the broker is not replicating to enough partitions. The default configuration is for an alert if there are one or more under-replicated partitions for a topic. The alert might signify that a Kafka instance is down or the Kafka cluster is overloaded. A planned restart of the Kafka broker may be required to restart the replication process.
TooLargeConsumerGroupLag- An alert to warn that the lag on a consumer group is too large for a specific topic partition. The default configuration is 1000 records. A large lag might indicate that consumers are too slow and are falling behind the producers.
NoMessageForTooLong- An alert to warn that a topic has not received messages for a period of time. The default configuration for the time period is 10 minutes. The delay might be a result of a configuration issue preventing a producer from publishing messages to the topic.
Adapt the default configuration of these rules according to your specific needs.
6.2.3. Exposing Kafka Exporter metrics
Lag information is exposed by Kafka Exporter as Prometheus metrics for presentation in Grafana.
Kafka Exporter exposes metrics data for brokers, topics and consumer groups.
The data extracted is described here.
Table 6.1. Broker metrics output
| Name | Information |
|---|---|
|
| Number of brokers in the Kafka cluster |
Table 6.2. Topic metrics output
| Name | Information |
|---|---|
|
| Number of partitions for a topic |
|
| Current topic partition offset for a broker |
|
| Oldest topic partition offset for a broker |
|
| Number of in-sync replicas for a topic partition |
|
| Leader broker ID of a topic partition |
|
|
Shows |
|
| Number of replicas for this topic partition |
|
|
Shows |
Table 6.3. Consumer group metrics output
| Name | Information |
|---|---|
|
| Current topic partition offset for a consumer group |
|
| Current approximate lag for a consumer group at a topic partition |
6.2.4. Configuring Kafka Exporter
This procedure shows how to configure Kafka Exporter in the Kafka resource through KafkaExporter properties.
For more information about configuring the Kafka resource, see the sample Kafka YAML configuration.
The properties relevant to the Kafka Exporter configuration are shown in this procedure.
You can configure these properties as part of a deployment or redeployment of the Kafka cluster.
Prerequisites
- An OpenShift cluster
- A running Cluster Operator
Procedure
Edit the
KafkaExporterproperties for theKafkaresource.The properties you can configure are shown in this example configuration:
apiVersion: kafka.strimzi.io/v1beta1 kind: Kafka metadata: name: my-cluster spec: # ... kafkaExporter: image: my-org/my-image:latest 1 groupRegex: ".*" 2 topicRegex: ".*" 3 resources: 4 requests: cpu: 200m memory: 64Mi limits: cpu: 500m memory: 128Mi logging: debug 5 enableSaramaLogging: true 6 template: 7 pod: metadata: labels: label1: value1 imagePullSecrets: - name: my-docker-credentials securityContext: runAsUser: 1000001 fsGroup: 0 terminationGracePeriodSeconds: 120 readinessProbe: 8 initialDelaySeconds: 15 timeoutSeconds: 5 livenessProbe: 9 initialDelaySeconds: 15 timeoutSeconds: 5 # ...- 1
- ADVANCED OPTION: Container image configuration, which is recommended only in special situations.
- 2
- A regular expression to specify the consumer groups to include in the metrics.
- 3
- A regular expression to specify the topics to include in the metrics.
- 4
- 5
- Logging configuration, to log messages with a given severity (debug, info, warn, error, fatal) or above.
- 6
- Boolean to enable Sarama logging, a Go client library used by Kafka Exporter.
- 7
- 8
- 9
Create or update the resource:
oc apply -f kafka.yaml
What to do next
After configuring and deploying Kafka Exporter, you can enable Grafana to present the Kafka Exporter dashboards.
Additional resources
6.2.5. Enabling the Kafka Exporter Grafana dashboard
If you deployed Kafka Exporter with your Kafka cluster, you can enable Grafana to present the metrics data it exposes.
A Kafka Exporter dashboard is provided in the examples/metrics directory as a JSON file:
-
strimzi-kafka-exporter.json
Prerequisites
This procedure assumes you already have access to the Grafana user interface and Prometheus has been added as a data source. If you are accessing the user interface for the first time, see Grafana.
Procedure
- Access the Grafana user interface.
Click Dashboards, then Import to open the Import Dashboard window and import the example Kafka Exporter dashboard (or paste the JSON).
When metrics data has been collected for some time, the Kafka Exporter charts are populated.
Kafka Exporter Grafana charts
From the metrics, you can create charts to display:
- Message in per second (from topics)
- Message in per minute (from topics)
- Lag by consumer group
- Messages consumed per minute (by consumer groups)
Use the Grafana charts to analyze lag and to check if actions to reduce lag are having an impact on an affected consumer group. If, for example, Kafka brokers are adjusted to reduce lag, the dashboard will show the Lag by consumer group chart going down and the Messages consumed per minute chart going up.