
Chapter 3. Diagnosing performance issues
3.1. Enabling garbage collection logging
Examining garbage collection logs can be useful when attempting to troubleshoot Java performance issues, especially those related to memory usage.
Other than some additional disk I/O activity for writing the log files, enabling garbage collection logging does not significantly affect server performance.
Garbage collection logging is already enabled by default for a standalone JBoss EAP server running on OpenJDK or Oracle JDK. For a JBoss EAP managed domain, garbage collection logging can be enabled for the host controller, process controller, or individual JBoss EAP servers.
Get the correct JVM options for enabling garbage collection logging for your JDK. Replace the path in the options below to where you want the log to be created.
NoteThe Red Hat Customer Portal has a JVM Options Configuration Tool that can help you generate optimal JVM settings.
For OpenJDK 11 or Oracle JDK 11:
-verbose:gc -Xloggc:<path_to_directory>/gc.log -XX:+PrintGCDetails -XX:+PrintGCDateStamps -XX:+UseGCLogFileRotation -XX:NumberOfGCLogFiles=5 -XX:GCLogFileSize=3M -XX:-TraceClassUnloadingFor versions 9 or later of OpenJDK, Oracle JDK, or any JDK that supports JEP 271:
-Xlog:gc*:file=<path_to_directory>/gc.log:time,uptimemillis:filecount=5,filesize=3M
Additional resources
- For more information about JEP 271, see JEP 271: Unified GC Logging on the OpenJDK web page.
3.2. Java heap dumps
A Java heap dump is a snapshot of a JVM heap created at a certain point in time. Creating and analyzing heap dumps can be useful for diagnosing and troubleshooting issues with Java applications.
Depending on which JDK you are using, there are different ways of creating and analyzing a Java heap dump for a JBoss EAP process. This section covers common methods for Oracle JDK and OpenJDK.
3.2.1. Creating a heap dump using OpenJDK and Oracle JDK
3.2.1.1. Create an on-demand heap dump
You can use the jcmd command to create an on-demand heap dump for JBoss EAP running on OpenJDK or Oracle JDK.
Procedure
- Determine the process ID of the JVM that you want to create a heap dump from.
Create the heap dump with the following command:
$ jcmd JAVA_PID GC.heap_dump -all=true FILENAME.hprof
This creates a heap dump file in the HPROF format, usually located in
EAP_HOMEorEAP_HOME/bin. Alternatively, you can specify a file path to another directory.
3.2.1.2. Create a heap dump automatically on OutOfMemoryError
You can use the -XX:+HeapDumpOnOutOfMemoryError JVM option to automatically create a heap dump when an OutOfMemoryError exception is thrown.
This creates a heap dump file in the HPROF format, usually located in EAP_HOME or EAP_HOME/bin. Alternatively, you can set a custom path for the heap dump using -XX:HeapDumpPath=/path/. If you specify a file name using -XX:HeapDumpPath, for example, -XX:HeapDumpPath=/path/filename.hprof, the heap dumps will overwrite each other.
3.2.2. Analyzing a heap dump
3.2.2.1. Heap dump analysis tools
There are many tools that can analyze heap dump files and help identify issues. Red Hat Support recommends using the Eclipse Memory Analyzer tool (MAT), which can analyze heap dumps formatted in either HPROF or PHD formats.
Additional resources
For information on using Eclipse MAT, see the Eclipse MAT documentation.
3.2.2.2. Heap dump analysis tips
Sometimes the cause of the heap performance issues are obvious, but other times you may need an understanding of your application’s code and the specific circumstances that cause issues like an OutOfMemoryError. This can help to identify whether an issue is a memory leak, or if the heap is just not large enough.
Some suggestions for identifying memory usage issues include:
- If a single object is not found to be consuming too much memory, try grouping by class to see if many small objects are consuming a lot of memory.
-
Check if the biggest usage of memory is a thread. A good indicator of this is if the
OutOfMemoryError-triggered heap dump is much smaller than the specifiedXmxmaximum heap size. -
A technique to make memory leaks more detectable is to temporarily double the normal maximum heap size. When an
OutOfMemoryErroroccurs, the size of the objects related to the memory leak will be about half the size of the heap.
When the source of a memory issue is identified, you can view the paths from garbage collection roots to see what is keeping the objects alive.
3.3. Java Flight Recorder
3.3.1. About Java Flight Recorder
The Oracle JDK Mission Control user guide describes Java Flight Recorder (JFR) as a "profiling and event collection framework". Developers can use JFR with JDK Mission Control (JMC) to collect data about Java Virtual Machines (JVMs) and other Java applications. Developers can use this data to identify and fix performance issues.
JFR has been carefully designed so that it requires a low level of overhead (consumption of resources). This means that JFR profiling can run continuously in certain production environments with minimal impact. Developers can use JFR and JMC to quickly analyze runtime information after an incident.
JFR is available from Java OpenJDK 8u262 or later as part of the Java Diagnostic Command Tool.
Additional resources
- For more information about JFR, see section Flight Recorder in the Oracle JDK Mission Control user guide.
3.3.2. Java Flight Recorder profiling configurations
Developers can modify the profiling configurations to customize their instance of Java Flight Recorder (JFR). Two different profiling configurations are available with JFR:
-
default: provides a sparse sampling of information; low profiling detail -
profile: provides a more comprehensive sampling of information; medium profiling detail
Developers can modify either configuration files to enable additional event metrics sampling.
3.3.3. Enable Java Flight Recorder profile capture
Developers can use Java Flight Recorder (JFR) to profile a JBoss EAP installation on bare metal or using Red Hat OpenShift Container Platform.
To learn about using JFR with OpenShift, see Introduction to Cryostat: JDK Flight Recorder for containers.
3.3.3.1. Enable Java Flight Recorder profiling on bare metal
Developers can start a Java Flight Recorder (JFR) profile using the command line or the Java Management Extensions (JMX) with the Java Mission Control (JMC) desktop application.
3.3.3.2. Configure Java Flight Recorder profiling for JBoss EAP using Java Virtual Machine configuration flags
You can use configuration flags to configure Java Flight Recorder (JFR) profiling with JBoss EAP on Java Virtual Machines (JVMs).
Example JVM configuration
-XX:StartFlightRecording=delay=15s,duration=60s,name=jboss-eap-profile, filename=C:\TEMP\jboss-eap-profile.jfr,settings=default
The StartFlightRecording=delay configuration flag allows you to set the amount of time JFR waits after the JVM boots before starting a profiling session. In the preceding example, StartFlightRecording=delay is set to 15 seconds, which means profiling will start after a 15 second delay.
The duration configuration flag allows you to set the length of time for each profiling session. In the preceding example, duration is set to 60 seconds.
The name configuration flag allows you to set the in memory profile name. In this example, the in memory profile name is set to jboss-eap-profile.
The filename configuration flag allows you to set the filename and path where you would like the file to be saved. In this example, filename is set to C:\TEMP\jboss-eap-profile.jfr.
The settings configuration flag allows you to select a profiling configuration. In this example, settings is set to default. Note that the file extension for the profiling configuration is excluded.
After the profiling session is complete, a file will be created at the file path defined by the filename option.
3.3.3.3. Profiling using Java command tool for a running JBoss EAP Java Virtual Machine
You can use the Java Flight Recorder (JFR) JFR.start command to configure a running JBoss EAP Java Virtual Machine (JVM) for profiling using the Java command tool, jcmd.
Procedure
Use one of the following commands:
For a Linux operating system:
$ jcmd <PID> JFR.start duration=TIME filename=path/to/YOUR_PROFILE_NAME.jfr
For example:
JFR.startcommand for Linux example$ jcmd <PID> JFR.start duration=60s filename=/tmp/jboss-eap-profile.jfr
Once a JFR profiling session starts, you will receive the following confirmation message:
$ jcmd <PID> JFR.start duration=60s filename=/tmp/jboss-eap-profile.jfr
<PID>:
Started recording 1. The result will be written to:

/tmp/jboss-eap-profile.jfr
For a Windows operating system:
> jcmd.exe <PID> JFR.start duration=TIME filename=path/to/YOUR_PROFILE_NAME.jfr
For example:
JFR.startcommand for Windows example> jcmd.exe <PID> JFR.start duration=60s filename=C:\TEMP\jboss-eap-profile.jfr
Once a JFR profiling session starts, you will receive the following confirmation message:
> jcmd.exe <PID> JFR.start duration=60s filename=C:\TEMP\jboss-eap-profile.jfr
<PID>:
Started recording 1. The result will be written to:

C:\TEMP\jboss-eap-profile.jfr
The duration option allows you to set the length of time for each profiling session. In the preceding example commands, duration is set to 60 seconds.
The filename option allows you to set the filename and path where you would like the file to be saved. In the preceding example commands, filename is set to /tmp/jboss-eap-profile.jfr in the Linux example, and C:\TEMP\jboss-eap-profile.jfr in the Windows example.
3.3.3.4. Connect a local Java Virtual Machine using Java Mission Control
You can use Java Mission Control (JMC) to connect a local Java Virtual Machine (JVM) running on the same server as your instance of JMC.
Prerequisites
- Java Mission Control with JBoss EAP libraries is configured. See How to connect Java Mission Control with EAP remotely? for instructions.
-
JBoss EAP is configured for remote monitoring connections, and a user is created in the
ApplicationRealmfor monitoring.
Procedure
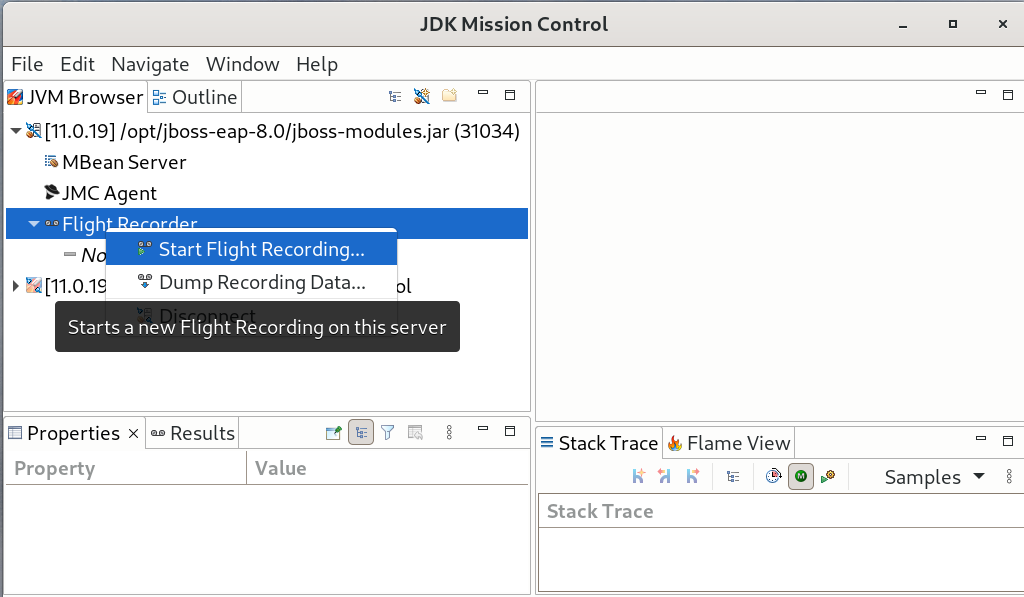
- Open Java Mission Control.
- In the JVM Browser pane, select the JVM to profile.
Expand the dropdown menu for the JVM to reveal the Flight Recorder item.
Right click Flight Recorder to open the sub-menu, select Start Flight Recording….
Figure 3.1. JVM Browser in JMC
In the Start Flight Recording window configure options for profiling.
Figure 3.2. JVM profiling settings
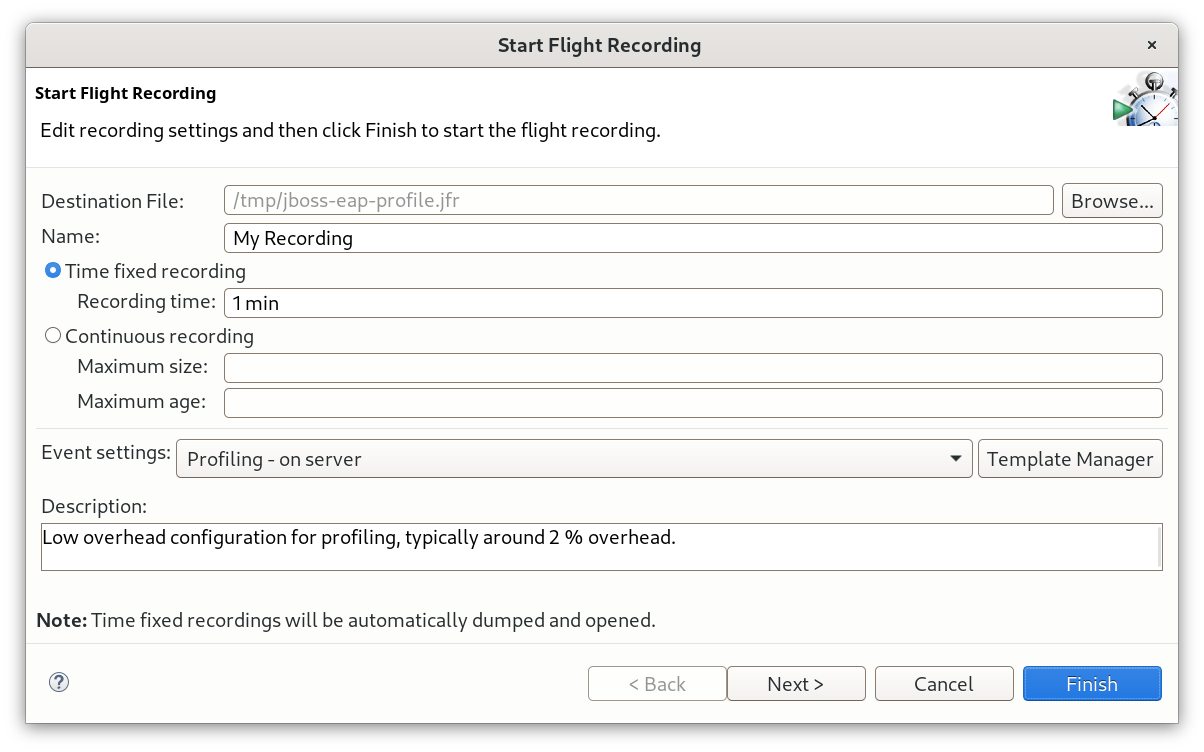
Click Next for detailed low level settings.
Figure 3.3. JVM profiling advanced settings
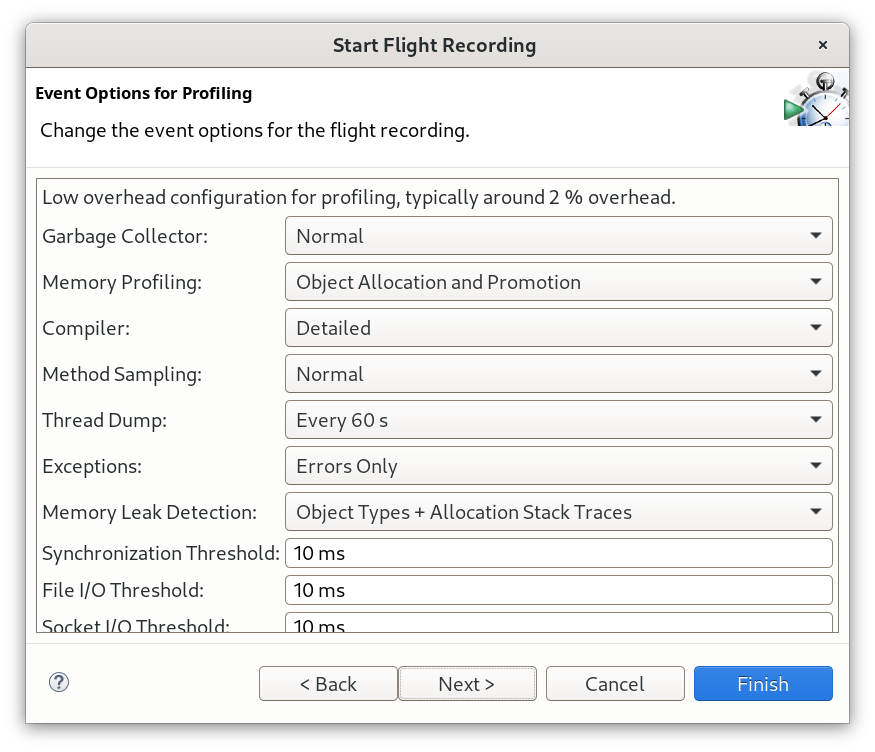
- Click Finish to start profiling.
3.3.3.5. Connect a remote Java Virtual Machine using Java Mission Control
You can use Java Mission Control (JMC) to connect to a remote Java Virtual Machine (JVM) profile.
Prerequisites
- Configure Java Mission Control with JBoss EAP libraries. See How to connect Java Mission Control with EAP remotely? for instructions.
-
Configure JBoss EAP for remote monitoring connections, with a user created in the
ApplicationRealmfor monitoring.
Procedure
- Open Java Mission Control.
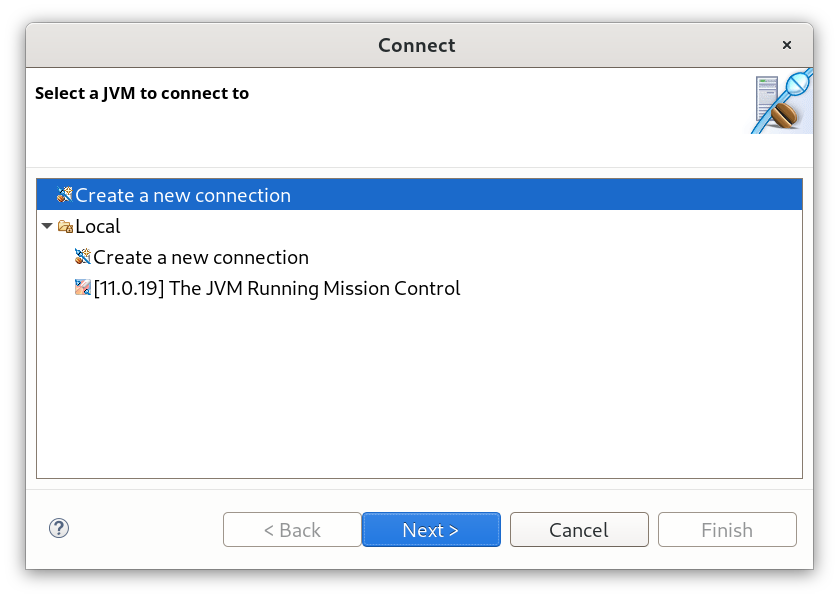
- In the File menu, select Connect.
In the Connect window, select Create a new connection, then click Next.
Figure 3.4. Connect window in JMC
In the JVM Connection window, complete the details for your remote JBoss EAP JVM to be profiled.
Figure 3.5. JVM connection details in JMC
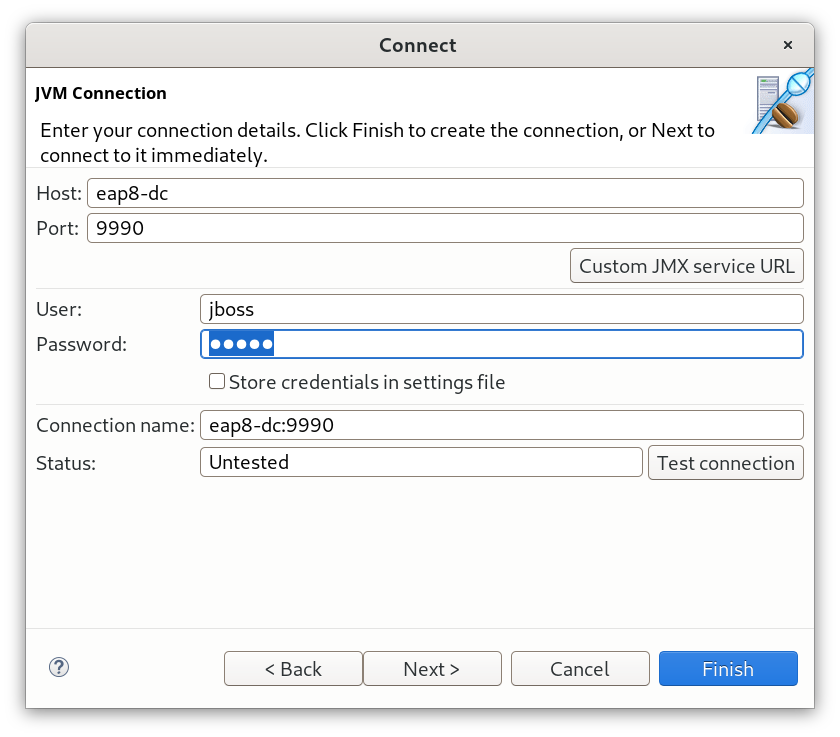
- In the Host field, add your hostname or an IP address.
- In the Port field, add your port number.
-
In the User field, add the user that you created in the
ApplicationRealm. -
In the Password field, add your password created in the
ApplicationRealm. - Optional To store credentials in a settings file, click the checkbox next to Store credentials in settings file.
Click Custom JMX Service URL to override the default setting.
Figure 3.6. JMX Service URL for JVM connection
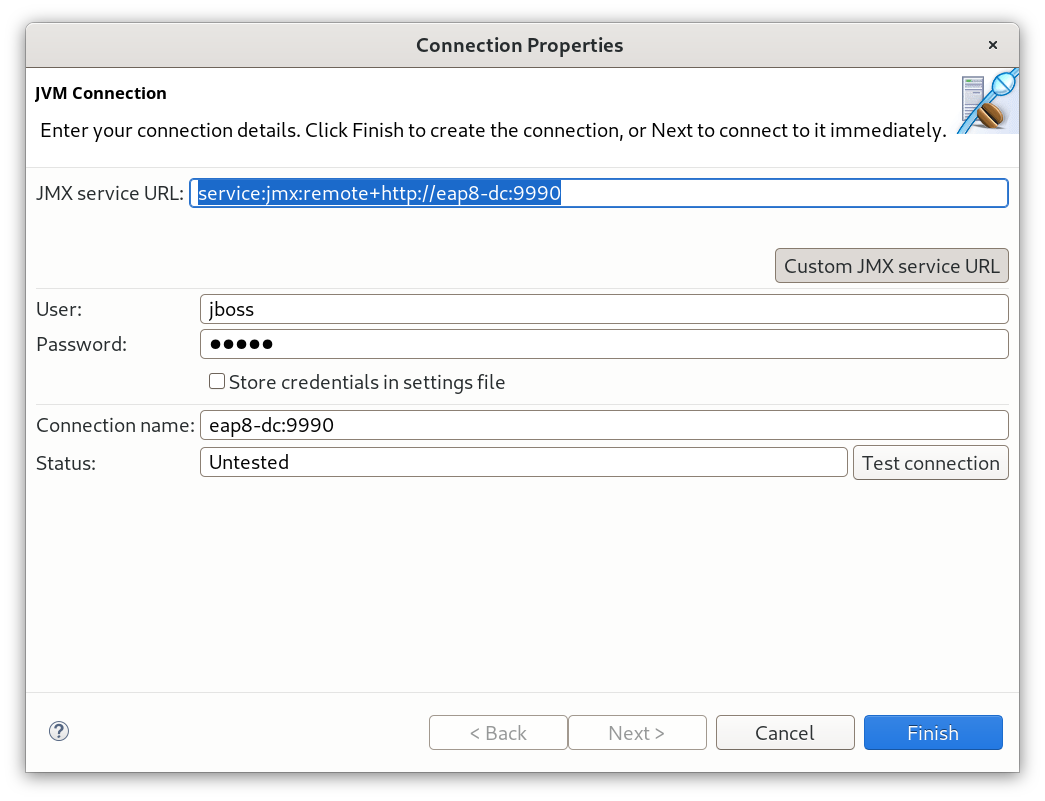
Change the JMX service URL to define the JBoss remoting protocol.
service:jmx:remote+http://<host>:9990
- Click Test connection to verify your settings.
- Click Finish to save your settings.
A JMXRMI Preferences not set warning message will appear.
Figure 3.7. JMXRMI preferences warning message
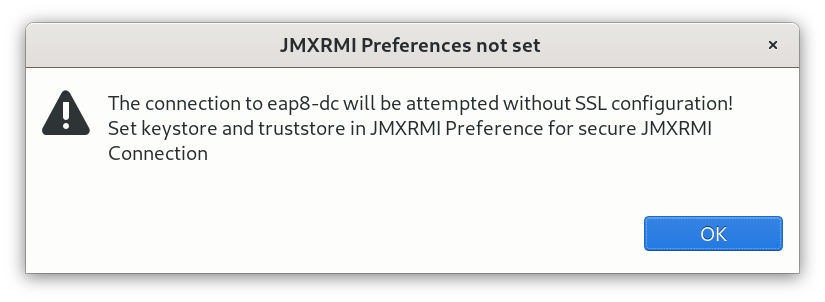
- Click OK to accept the connection attempt.
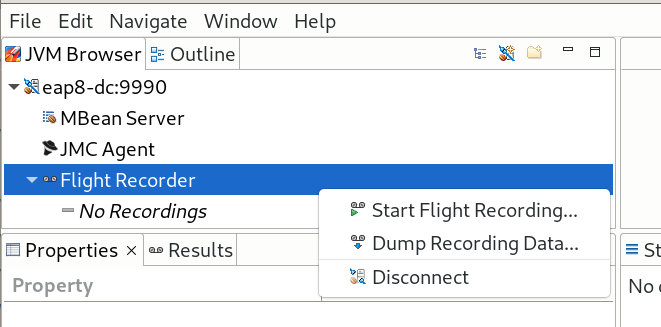
In the JVM Browser pane, select the JVM to profile.
- Expand the dropdown menu for the JVM to reveal the Flight Recorder item.
Right click Flight Recorder to open the sub-menu, then select Start Flight Recording….
Figure 3.8. Connect a remote JVM using JMC profile menu
In the Start Flight Recording window configure options for profiling.
Figure 3.9. JVM profiling settings
Click Next for detailed low level settings.
Figure 3.10. JVM profiling advanced settings
- Click Finish to start profiling.
3.4. Identifying high CPU utilization by Java threads
For customers using JBoss EAP on Red Hat Enterprise Linux or Solaris, the JVMPeg lab tool on the Red Hat Customer Portal helps collect and analyze Java thread information to identify high CPU utilization. Follow the instructions for using the JVMPeg lab tool instead of using the following procedure.
For OpenJDK and Oracle JDK environments, Java thread diagnostic information is available using the jstack utility.
Identify the process ID of the Java process that is utilizing a high percentage of the CPU.
It can also be useful to obtain per-thread CPU data on high-usage processes. This can be done using the
top -Hcommand on Red Hat Enterprise Linux systems.Using the
jstackutility, create a stack dump of the Java process. For example, on Linux and Solaris:jstack -l JAVA_PROCESS_ID > high-cpu-tdump.outYou might need to create multiple dumps at intervals to see any changes or trends over a period of time.
- Analyze the stack dumps. You can use a tool such as the Thread Dump Analyzer (TDA).
3.5. Runtime statistics for managed executor services and managed scheduled executor services
You can monitor the performance of managed executor services and managed scheduled executor services by viewing the runtime statistics generated with the management CLI attributes. You can view the runtime statistics for a standalone server or for an individual server mapped to a host.
The domain.xml configuration does not include a resource for the runtime statistic management CLI attributes, so you cannot use the management CLI attributes to view the runtime statistics for a managed domain.
Table 3.1. Displays management CLI attributes for monitoring the performance of managed executor services and of managed scheduled executor services.
| Attribute | Description |
|---|---|
| active-thread-count | The approximate number of threads that are actively executing tasks. |
| completed-task-count | The approximate total number of tasks that have completed execution. |
| hung-thread-count | The number of executor threads that are hung. |
| max-thread-count | The largest number of executor threads. |
| current-queue-size | The current size of the executor’s task queue. |
| task-count | The approximate total number of tasks that have been submitted for execution. |
| thread-count | The current number of executor threads. |
Example of viewing the runtime statistics for a managed executor service running on a standalone server.
[standalone@localhost:9990 /] /subsystem=ee/managed-executor-service=default:read-resource(include-runtime=true,recursive=true)
Example of the runtime statistics for a managed scheduled executor service running on a standalone server.
[standalone@localhost:9990 /] /subsystem=ee/managed-scheduled-executor-service=default:read-resource(include-runtime=true,recursive=true)
Example of viewing the runtime statistics for a managed executor service running on a server mapped to a host.
[domain@localhost:9990 /] /host=<host_name>/server=<server_name>/subsystem=ee/managed-executor-service=default:read-resource(include-runtime=true,recursive=true)
Example of the runtime statistics for a managed scheduled executor service running on a server mapped to a host.
[domain@localhost:9990 /] /host=<host_name>/server=<server_name>/subsystem=ee/managed-scheduled-executor-service=default:read-resource(include-runtime=true,recursive=true)