
Chapter 16. Red Hat JBoss Dashboard Builder
Red Hat JBoss Dashboard Builder is a web-based dashboard application that provides Business Activity Monitoring (BAM) support, that is, visualization tools for monitored metrics (Key Performance Indicators, or KPIs) in real time. It comes integrated in the Business Central environment under the Dashboards menu.
It comes with a dashboard that requests information from the Red Hat JBoss BPM Suite Execution Engine and provides real-time information on its runtime data; however, you can also create custom dashboards over other data sources, which leaves the application relatively standalone.
What is Business Activity Monitoring?
Business Activity Monitoring (BAM) software helps to monitor business activities that take place on a computer system in real time. The software monitors particular metrics, such as the status of running processes, the number of invoices to be processed, processing times and other. It provides tools for visualization of the collected data (for example in graphs or tables).
16.1. Basic Concepts
Dashboard Builder can establish connections to external data sources such as databases. These connections are then used for creating data providers that obtain data from the data sources. Dashboard Builder is connected to the local JBoss BPM Suite engine by default and acquires the data for its JBoss BPM Suite Dashboard indicators (widgets with visualizations of the data available on the pages of the JBoss BPM Suite Dashboard workspace).
The data providers keep all the data. If operating over a database, the data provider uses an SQL query to obtain the data. Operating over a CSV file enables the data provider automatically obtain all the data from the file.
Data from the data providers can then be visualized as graphs or tables in indicators: special panels, that can be arranged on Dashboard Builder managed pages. Pages are contained within a workspace and can define permission access rights. The number of pages within a workspace is arbitrary. A set of pages that presents related information on similar KPIs is referred to as a dashboard.
16.2. Accessing Dashboard Builder
Dashboard Builder is accessible through Business Central and as a standalone application.
Within Business Central, Dashboard Builder can be accessed directly from the Dashboards menu at the top. The Dashboards menu contains two items:
- Process & Task Dashboard displays a pre-defined dashboard based on runtime data from the Execution Server. To learn more about Process & Task Dashboard, see Section 16.3, “Process & Task Dashboard”.
- Business Dashboards displays an environment in which you can create your own dashboards. This chapter contains procedures that provide instructions on how to create a custom dashboard.
Dashboard Builder can be accessed as a standalone application as well.
- Start the server.
-
After the server has successfully started, navigate to
https://HOST_NAME:PORT/dashbuilderin a web browser. For example https://localhost:8080/dashbuilder. - Log in with the user credentials created during installation.
After you log in, you are redirected to the Showcase workspace with the welcome page displayed.
At the top of the page, you can change the workspace, the page, as well as find general configuration buttons. This interface area is common for all workspaces.
Dashboard area with variable content, a lateral menu on the left and the main dashboard area on the right, is located below the common interface area.
16.3. Process & Task Dashboard
The Process & Task Dashboard contains several performance indicators monitoring the jBPM Execution Engine. The data used by the dashboard comes from two tables of the database belonging to the engine: processinstancelog and bamtasksummary.
Figure 16.1. The Process & Task Dashboard Main Screen
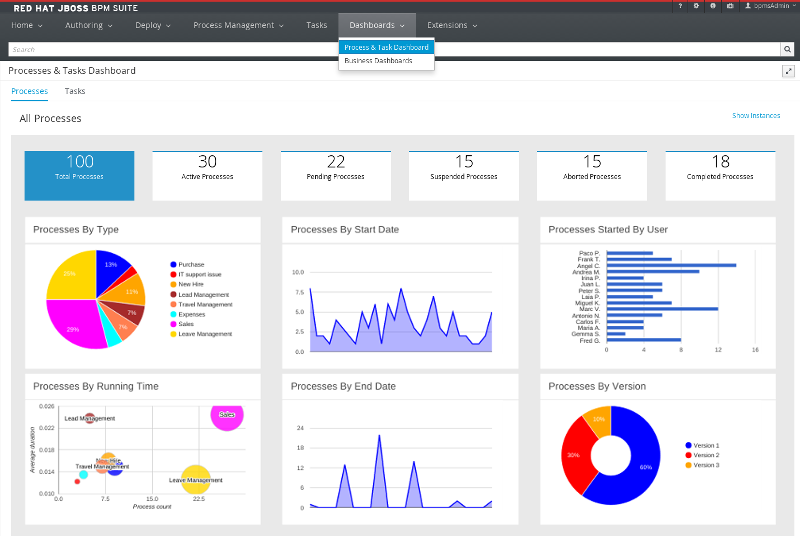
Every time the information stored into the database is updated, the data becomes automatically available to the dashboard indicators.
All the metrics are generic and do not belong to any specific business process. However, it is possible to modify or extend the generic dashboard for your own use: the jBPM Process Dashboard can serve as a template for building a custom dashboard, which works with both data of the jBPM Engine and data coming from your own business domain.
At the top of the Process & Task Dashboard main screen, you can choose whether you want to view indicators related to Processes or Tasks.
You can filter the data by clicking the charts, for example if you want to select a particular process or status. Every time a filter is applied, all the indicators are automatically updated and synchronized to show the selected criteria. The following picture shows an example dashboard with the Sales process and the Active status selected.
Figure 16.2. Active Sales Processes
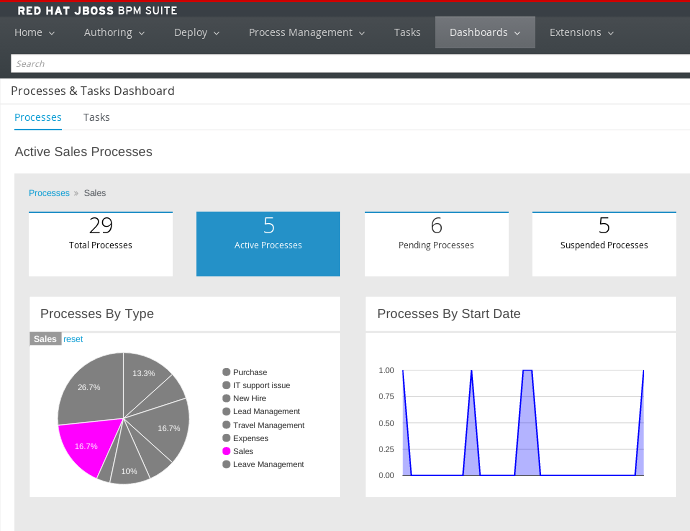
It is also possible to display a list of instances at any time by clicking the Show Instances link in the upper right hand corner of the screen. You can then switch to the original screen by clicking the Show Dashboard link.
Figure 16.3. Process Instances List
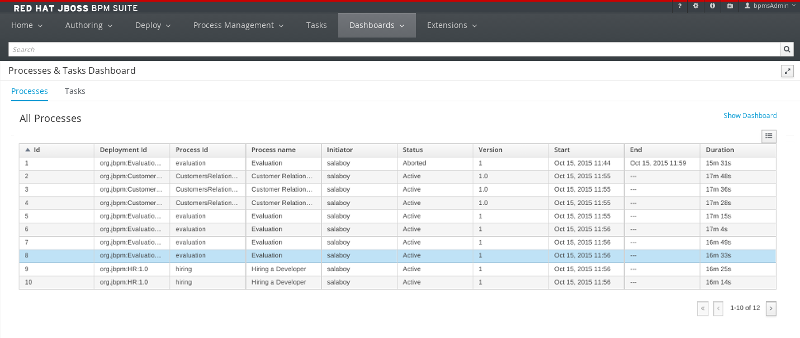
You can sort the instances by clicking any column header. Details about a particular instance are shown on the right side of the page after selecting a row. Note that the displayed details are not editable. If you want to manage a process instance, go to Process Management → Process Instances in Business Central.
Figure 16.4. Process Instance Details Panel

Tasks Dashboard
To view the Tasks dashboard, click the Tasks tab at the top of the screen. This dashboard provides the same features as introduced above, but related to the tasks only.
16.4. Data Sources
Red Hat JBoss Dashboard Builder can be connected to an external database, either using the container’s JNDI data source or connecting directly using the JDBC driver to access the database. Connections to databases can be configured in workspace Showcase on page External Connections. After you have established the connection to the database, you need to create a data provider that will collect the data from the database and allow you to visualize it as an indicator in the dashboard area of a page.
When connecting to CSV files to acquire data, the connection is established directly through the data provider.
Note that Red Hat JBoss Dashboard Builder makes use of its own local internal database to store its local data. This database is read-only for Dashboard Builder, but is accessible from outside.
16.4.1. Connecting to Data Sources
You can connect either to a JNDI data source, that is, a data source set up and accessible from the application container, or directly to the data source as a custom data source, if the application container has the correct JDBC driver deployed.
To connect to an external data source, do the following:
- Make sure the data source is up and running and that the application server has access to the data source. (Check the driver, the login credentials, etc. In Red Hat JBoss EAP 6, you can do so in the Management Console under Subsystems → Connector → Datasources)
- In Dashboard Builder, on the Tree Menu (by default located on the of the Showcase perspective), go to Administration → External connections.
-
On the displayed External Connection panel, click the New DataSource
 button.
- Select the data source type (JNDI or Custom DataSource) and provide the respective data source parameters below.
If you wish the jBPM Dashboard to use the new data source, modify also the respective data providers (jBPM Count Processes, jBPM Process Summary, jBPM Task Summary). Note that the data source needs to have access to jBPM history.
16.4.2. Security Considerations
When creating an external datasource using JBoss Dashboard Builder, it needs to use the local connection so that the user can be passed through. Otherwise, with a connection that uses <host>:<port>, every user would have the same virtual database (VDB) permissions.
16.4.3. Building a Dashboard for Large Volumes of Data
You can connect Red Hat JBoss Dashboard Builder to external databases and load data for generating reports and charts. Generally, if the volume of data is small (up to 2MB), Red Hat JBoss Dashboard Builder preloads the data into (local) memory and uses this data for report and chart generation. However, in case of large volumes of data, it is not possible to load the entire data set into the Dashboard Builder’s local memory.
Based on the volume of data you are dealing with, you can choose to query the database to build a dashboard report in any one of the following strategies:
The in-memory strategy
The in-memory strategy is to create a data provider that loads all the required data from the database by executing a single SQL query on the relevant tables, into the Dashboard Builder’s memory. In this case, every indicator on the Dashboard Builder shares the same data set. When you use filters from the Dashboard Builder user interface to access specific data from this data set, the Dashboard Builder fetches the data from the internal memory and does not execute another SQL query again on the database. This strategy has a simple data retrieval logic as it deals with creating a single data provider. As all the data set properties are available to you at once, it allows you to configure KPIs faster. However, this approach is not suitable for large data sets as it would lead to poor performance.
The native strategy
The native approach is to create a data provider for every indicator in the Dashboard Builder and does not require loading all the data into the internal memory at once. So each time you use a filter from the Dashboard Builder user interface, the corresponding SQL queries get executed and fetches the required data from the database. So there is no data in the Dashboard Builder’s internal memory. This strategy works best in case of large volumes of data, however it needs proper indexing on the database tables. Also, setting up data providers for multiple KPIs is complicated as compared to creating a single data provider in case of in-memory strategy.
Example
Let us consider a case when you want to create a stock exchange dashboard comprising the following charts and reports:
- Bar chart for Average price per company
- Area chart for Sales price evolution
- Pie chart for Companies per country
- Table report for Stock prices at closing date
For these charts and reports, let us assume that the Dashboard Builder accesses data from the following tables:
- Company: Comprising columns ID, NAME, and COUNTRY.
- Stock: Comprising columns ID, ID_COMPANY, PRICE_PER_SHARE, and CLOSING_DATE.
For the in-memory strategy of building a dashboard, the following SQL query fetches all the required data from these two tables:
SELECT C.NAME, C.COUNTRY, S.PRICE_PER_SHARE, S.CLOSING_DATE
  FROM COMPANY C JOIN STOCK S ON (C.ID=S.ID_COMPANY)
The output of this query is saved in the Dashboard Builder’s local memory. The Dashboard accesses this data every time a filter is run.
On the other hand, if you are using the native strategy for huge volumes of data, an SQL query is executed on every filter request made by the Dashboard Builder and corresponding data is fetched from the database. In this case here is how each filter accesses the database:
For the bar chart on Average price per company, the following SQL query is executed:
SELECT C.NAME, AVG(S.PRICE_PER_SHARE)
  FROM COMPANY C JOIN STOCK S ON (C.ID=S.ID_COMPANY)
  WHERE {sql_condition, optional, c.country, country}
  AND {sql_condition, optional, c.name, name}
  GROUP BY C.NAME
For the area chart on Sales price evolution, the following SQL query is executed:
SELECT S.CLOSING_DATE, AVG(S.PRICE_PER_SHARE)
  FROM COMPANY C JOIN STOCK S ON (C.ID=S.ID_COMPANY)
  WHERE {sql_condition, optional, c.country, country}
  AND {sql_condition, optional, c.name, name}
  GROUP BY CLOSING_DATE
For the pie chart on Companies per country, the following SQL query is executed:
SELECT COUNTRY, COUNT(ID)
  FROM COMPANY
  WHERE {sql_condition, optional, country, country}
  AND {sql_condition, optional, name, name}
  GROUP BY COUNTRY
For the table report on Stock prices at closing date, the following SQL query is executed:
SELECT C.NAME, C.COUNTRY, S.PRICE_PER_SHARE, S.CLOSING_DATE
  FROM COMPANY C JOIN STOCK S ON (C.ID=S.ID_COMPANY)
  WHERE {sql_condition, optional, c.country, country}
  AND {sql_condition, optional, c.name, name}
For each of these queries, you need to create a separate SQL data provider.
In the examples above, each KPI delegates the filter and group by operations to the database through the {sql_condition} clauses. The signature of the {sql_condition} clause is the following:
{sql_condition, [optional | required], [db column], [filter property]}Here,
- optional: This indicates that if there is no filter for the given property, then the condition is ignored.
- required: This indicates that if there is no filter for the given property, then the SQL returns no data.
- db column: This indicates the database column where the current filter is applied.
- filter property: This indicates the selected UI filter property.
When a filter occurs in the UI, the Dashboard Builder parses and injects all the SQL data providers referenced by the KPIs into these SQL statements. Every time a filter occurs in the UI, the Dashboard Builder gets all the SQL data providers referenced by the KPIs and injects the current filter selections made by the user into these SQLs.
16.4.4. Data Providers
Data providers are entities that are configured to connect to a data source (a CSV file or database), collect the required data, and assign them the data type. You can think about them as database queries.
The collected data can be then visualized in indicators on pages, exported as XLS or CSV, etc.
16.4.4.1. Creating Data Providers
To create a new data provider, do the following:
- In the Tree Menu (the panel in the lateral menu of the Showcase workspace), click Administration → Data providers.
-
In the Data Providers panel, click the Create new data provider
 button.
- In the updated Data Providers panel, select in the Type dropdown menu the type of the data provider depending on the source you want the data provider to operate on.
Define the data provider parameters:
- Data provider over a CSV file
- Name: user-friendly name and its locale.
-
CSV file URL: the URL of the file (for example,
file:///home/me/example.csv). - Data separator: the symbol used as separator in the CSV file (the default value is semicolon; if using comma as the separator sign, make sure to adapt the number format if applicable).
- Quoting symbol: the symbol used for quotes (the default value is the double-quotes symbol; note that the symbol may vary depending on the locale).
- Escaping symbol: the symbol used for escaping the following symbol in order to keep its literal value.
- Date format: the date and time format.
-
Number format: the number format pattern as used in
java.text.DecimalFormat.
- Data provider over a database (SQL query)
- Name: user-friendly name and its locale
-
Data source: the data source to query (the default value is
local, which allows you to query the Dashboard Builder database) - Query: query that returns the required data
-
Click Attempt data load
 to verify the parameters are correct.
- Click Save.
- In the table with the detected data, define the data type and if necessary provide a user-friendly name for the data. Click Save.
The data provider can now be visualized in an indicator on a page of your choice.
16.4.5. Workspace
A workspace is a container for pages with panels or indicators.
By default, the Showcase and Red Hat JBoss BPM Suite Dashboard workspaces are available.
To switch between workspaces, select the required workspace in the Workspace drop-down box in the top panel on the left. To create a new workspace, click the Create workspace icon (
 ) in the top menu on the left. You can also edit the current workspace properties, delete the current workspace, and duplicate the current workspace using icons in the top panel.
Every workspace uses a particular skin and envelope, which define the workspace’s graphical properties.
16.4.5.1. Creating Workspace
To create a new workspace, do the following:
Click the Create workspace button on the top menu.
The management console with the Workspace node expanded and workspace management area with workspace details on the right is displayed.
In the Create workspace table on the right, set the workspace parameters:
- Name: workspace name and its locale
- Title: workspace title and its locale
- Skin: skin to be applied on the workspace resources
- Envelope: envelope to be applied on the workspace resources
- Click Create workspace.
Optionally, click the workspace name in the tree menu on the left and in the area with workspace properties on the right define additional workspace parameters:
- URL: the workspace URL
User home search: the home page setting
If set to
Role assigned page, the home page as in the page permissions is applied; that is, every role can have a different page displayed as its home page. If set toCurrent page, all users will use the current home page as their home page.
16.4.5.2. Configuring a default workspace
You can configure a default workspace in Red Hat JBoss BPM Suite Dashboard. For details, see How to configure default workspace in BPM Suite dashbuilder.
16.4.5.3. Pages
Pages are units that live in a workspace and provide space (dashboard) for panels. By default, you can display a page by selecting it in the Page dropdown menu in the top panel.
Every page is divided in two main parts: the lateral menu and the central part of the page. The parts are divided further (the exact division is visible when placing a new panel on a page). Note that the lateral menu allows you to insert panels only below each other, while in the central part of the page you can insert panels below each other as well as tab them.
A page also has a customizable header part and logo area.
16.4.5.3.1. Creating Pages
To create a new page, do the following:
- Make sure you are in the correct workspace.
-
Next to the Page dropdown box
 in the top menu, click the Create new page
  button.
- The management console with the Pages node expanded and page management area with page details on the right is displayed.
In the Create new page table on the right, set the page parameters:
- Name: page name and its locale
- Parent page: parent page of the new page
- Skin: skin to be applied on the page
- Envelope: envelope to be applied on the page
- Page layout: layout of the page
- Click Create new page.
Optionally, click the page name in the tree menu on the left and in the area with workspace properties on the right define additional page parameters:
- URL: the page URL
- Visible page: visibility of the page
- Spacing between regions and panels
16.4.5.3.2. Defining Page Permissions
Although users are usually authorized using the authorization method setup for the underlying application container (on Red Hat JBoss EAP, the other security domain by default), the Red Hat JBoss Dashboard Builder has its own role-based access control (RBAC) management tool to facilitate permission management on an individual page or multiple pages.
To define permissions on a page or all workspace pages for a role, do the following:
-
On the top menu, click the General configuration
 button: the management console is displayed.
- Under the Workspace node on the left, locate the page or the Pages node.
- Under the page/pages node, click the Page permissions node.
In the Page permissions area on the right, delete previously defined permission definition if applicable and define the rights for the required role:
- In the Permission assignation table, locate the Select role dropdown menu and pick the respective role.
- In the Actions column of the table, enable or disable individual permissions.
- Click Save.
16.4.5.4. Panels
A panel is a GUI widget, which can be placed on a page. There are three main types of panels:
- Dashboard panels
are the primary BAM panels and include the following:
- Data provider manager: a panel with a list of available data providers and data provider management options
- Filter and Drill-down: a panel that displays all KPIs and their values to facilitate filtering in indicators on the given page defined over a data provider
- HTML Editor panel: a panel with static content
- Key Performance Indicator (indicator): a panel that visualizes the data of a data provider
- Navigation panels
are panels that provide navigation functions and include the following:
- Breadcrumb: a panel with the full page hierarchy pointing to the current page
- Language menu: a panel with available locales (by default in the top center)
- Logout panel: a panel with the name of the currently logged-in user and the logout button
- Page menu custom: a panel with vertically arranged links to all pages in the workspace (the list of pages can be adjusted) and general controls for the HTML source of the page
- Page menu vertical: a panel with vertically arranged links to all pages in the workspace (the list of pages can be adjusted)
- Page menu horizontal: a panel with horizontally arranged links to all pages in the workspace (the list of pages can be adjusted)
- Tree menu: a panel with the links to essential features such as Administration, Home (on the Home page of the Showcase workspace displayed on the left, in the lateral menu)
- Workspace menu custom: a panel with links to available workspaces (the list of workspaces can be adjusted) and general controls for the HTML source of the workspace
- Workspace menu horizontal: a horizontal panel with links to available workspaces (the list of workspaces can be adjusted)
- Workspace menu vertical: a vertical panel with links to available workspaces (the list of workspaces can be adjusted)
- System panels
are panels that provide access to system setting and administration facilities and include the following:
- Data source manager: a panel for management of external data sources
- Export dashboards: a panel export of dashboards
- Export/Import workspaces: a panel for exporting and importing of workspaces
16.4.5.4.1. Adding Panels
To add an existing panel to a page or to create a new panel, do the following:
- Make sure the respective page is open (in the Page dropdown menu of the top menu select the page).
-
In the top menu, click the Create a new panel in current page
 button.
- In the displayed dialog box, expand the panel type you want to add (Dashboard, Navigation, or System) and click the panel you wish to add.
From the Components menu on the left, drag and drop the name of an existing panel instance or the Create panel item into the required location on the page.
If inserting a new indicator, the Panel view with the graph settings will appear.Define the graph details and close the dialog.
If adding an instance of an already existing indicator, you might not be able to use it, if it is linked to the KPIs on the particular original page. In such a case, create a new panel.
- If applicable, edit the content of the newly added panel.
16.5. Import and Export
Dashboard Builder provides the ability to export and import workspaces, KPIs, and data sources between two Dashboard Builder installations.
In general, it is possible to export the mentioned assets only using the Dashboard Builder web user interface. However, you can import the assets either in the web user interface, or by using the deployment scanner.
The deployment scanner is a subsystem of Red Hat JBoss Enterprise Application Platform that allows you to place the exported assets into the given folder inside the web application. Once the application has started, it scans the deployment folder and imports all the available assets. Note that the assets can be imported only during the deployment and not during the runtime.
16.5.1. Importing and Exporting Workspaces
By importing or exporting workspaces, you can move a set of pages between two Dashboard Builder installations. The procedure moves an envelope being currently used by the workspace, all the sections that compose the workspace and all the panels used in the workspace sections.
Procedure: Exporting Workspaces
- In Business Central, go to Dashboards → Business Dashboards.
- In the menu on the left, click Administration → Import and export.
- Choose the Export Workspaces tab.
In the list of all existing workspaces that opens, select the ones you want to export and click Export.

- Click Download to download a single XML file containing the workspace definitions.
Procedure: Importing Workspaces Using Web UI
- In Business Central, go to Dashboards → Business Dashboards.
- In the menu on the left, click Administration → Import and export.
Choose the Import Workspace tab.
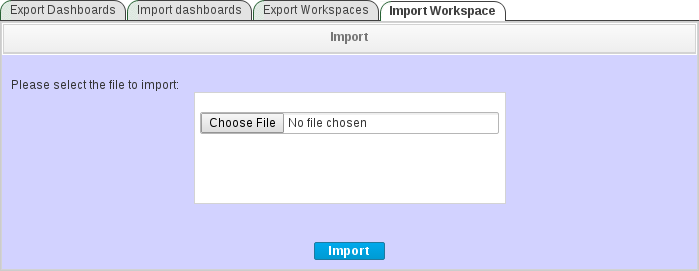
- Upload an XML file that contains one or more workspace definitions. Uploading a ZIP archive is supported as well for backward compatibility.
- Click Import.
Procedure: Importing Workspaces Using Deployment Scanner
-
Make sure that the XML workspace definition file has the extension
.workspace. Move the file into the
/jboss-eap-6.4/standalone/deployments/dashbuilder.war/WEB-INF/deploymentsdirectory.If the workspace already exists (there is a workspace with the same logic identifier), the file will be overwritten. Note that these two files do not have to have the same name in order to be replaced.
The workspaces are imported once during the application deployment.
16.5.2. Importing and Exporting KPIs
By importing and exporting KPIs, you can move key performance indicator definitions (the KPI type, its columns and display configuration) and their data providers between two Dashboard Builder installations.
Procedure: Exporting KPIs
- In Business Central, go to Dashboards → Business Dashboards.
- In the menu on the left, click Administration → Import and export.
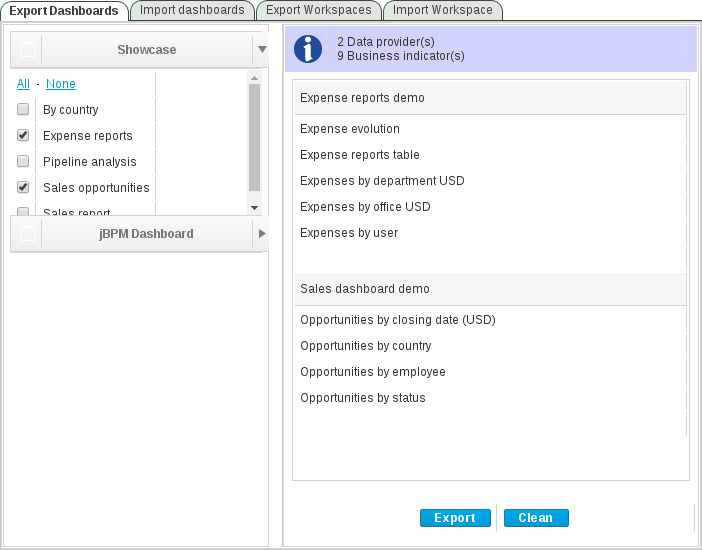
Choose the Export Dashboards tab.
A list of all KPI definitions in your application opens. You can export one or more of them into a single XML file.

Select the KPIs you want to export and click Export .
Procedure: Importing KPIs Using Web UI
- In Business Central, go to Dashboards → Business Dashboards.
- In the menu on the left, click Administration → Import and export.
Choose the Import dashboards tab.
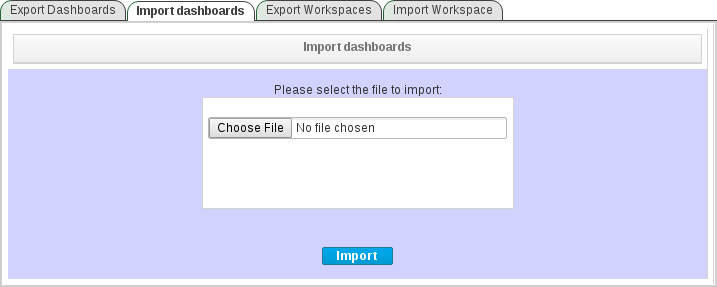
- Upload an XML file that contains one or more KPI definitions and click Import.
Procedure: Importing KPIs Using Deployment Scanner
-
Make sure that the XML KPI definition file has the extension
.kpis. Move the file into the
/jboss-eap-6.4/standalone/deployments/dashbuilder.war/WEB-INF/deploymentsdirectory.If the KPI or the data provider already exists (there is a file that contains a KPI or a data provider with the same logic identifier), the file will be overwritten. Note that these two files do not have to have the same name in order to be replaced.
The KPIs are imported once during the application deployment.
16.5.3. Importing Data Sources
At present, it is not possible to export data sources.
By importing and exporting data sources, you can move one or more external data source connection configurations between two Dashboard Builder installations.
Since the data sources definitions consist of a very small number of attributes, it is possible to create them in your target environment manually by using the External connections panel.
Procedure: Creating Data Sources Manually Using Web UI
- In Business Central, go to Dashboards → Business Dashboards.
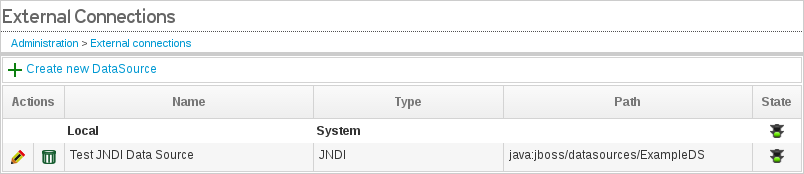
- In the menu on the left, click Administration → External connections.
Select the type of a new data source (either the JNDI or a Custom DataSource) and fill in the data source details.
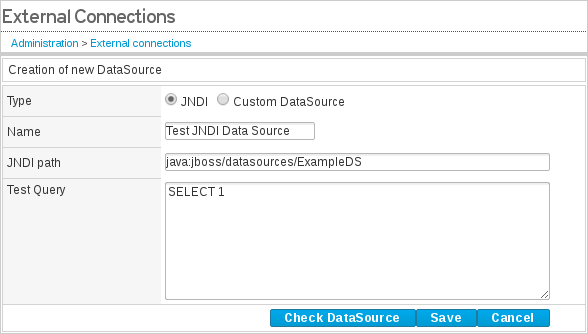
Click Check DataSource to validate the details.
If the validation ends up successfully, the following message appears:
The DataSource is well configured.
- Click Save.
Procedure: Importing Data Sources Using Deployment Scanner
Create the data sources definition files with the following supported properties:
common properties:
-
type: the type of the data source (JNDIorJDBC), -
name: the data source name, -
testQuery: a definition of a query used for testing the data source during the instantiation.
-
JNDI data source properties:
jndiPath: the data source bean path.Example 16.1. JNDI Data Source Descriptor
type = JNDI
name = myCompanyDataSource
testQuery = SELECT count(*) FROM CUSTOMER
jndiPath = java:comp/env/jdbc/mycompany
JDBC data source properties:
-
jdbcUrl: the JDBC URL for the connection, -
driverClass: a fully qualified class name of the used driver, -
user: the connection user name, password: the connection password.Example 16.2. JBDC Data Source Descriptor
type = JDBC
name = myCompanyDataSource
testQuery = SELECT count(*) FROM CUSTOMER
jdbcUrl = jdbc:postgresql://mydomain.com:5432/mycompany
driverClass = org.postgresorg.postgresql.Driver
user = system
password = dba
-
-
Make sure that the data source definition file has the extension
.datasource. Move the file into the
/jboss-eap-6.4/standalone/deployments/dashbuilder.war/WEB-INF/deploymentsdirectory.If the data source already exists (there is a file that contains a data source with the same logic identifier), the file will be overwritten. Note that these two files do not have to have the same name in order to be replaced.
The data sources are imported once during the application deployment.
16.6. Dashboard Builder Data Model
The following image illustrates the Dashboard Builder data model:
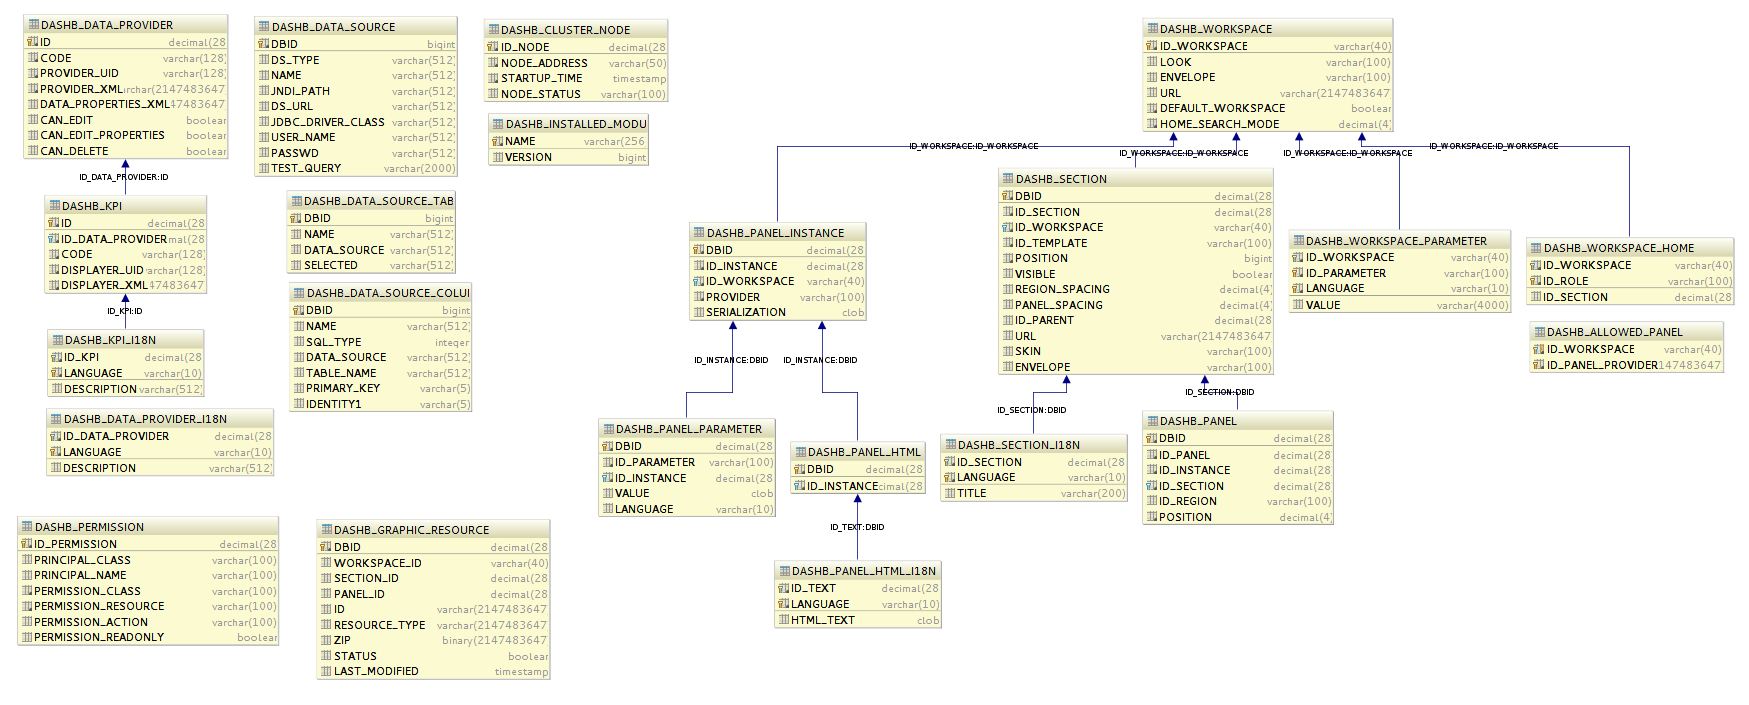
Dashboard Builder data model stores only metadata, not actual runtime data.
Table 16.1. Dashboard Builder Data Model
| Table | Attributes | Description |
|---|---|---|
|
|
| Stores data source instances, either JNDI or JDBC. |
|
|
| Currently not used. Stores a set of tables available for a given data source. |
|
|
| Currently not used. Stores a set of columns within a table. |
|
|
| Stores permissions for different user interface resources (workspaces, pages, panels, and graphic resources). |
|
|
| Stores graphic resource definitions (envelopes, layouts, and skins). |
|
|
| Stores workspace instances. |
|
|
| Stores a home page for each role. |
|
|
| Stores workspace-related parameters. |
|
|
| Stores a set of panel types a workspace can use. |
|
|
|
Refers to the |
|
|
| Stores information for internationalization and localization. |
|
|
| Stores reusable panel instances. It is not tied to any specific page. |
|
|
|
Stores page panels. Refers to the |
|
|
| Stores page panels and is tied to a particular page and layout region. |
|
|
| Stores an HTML panel definition. |
|
|
| Stores information for internationalization and localization. |
|
|
| Stores data provider definitions (SQL and CSV). |
|
|
| Stores information for internationalization and localization. |
|
|
| Stores all types of KPI definitions (pie, bar, line, and table). |
|
|
| Stores information for internationalization and localization. |
|
|
| Stores installed or imported modules used for automatic importing of assets. |
|
|
| Stores running nodes and is needed for cluster setups. |