
Red Hat Ansible Inside Reporting Guide
Understand reporting in Red Hat Inside
Abstract
Use reporting to develop insights into how Red Hat Ansible Inside is used.Making open source more inclusive
Red Hat is committed to replacing problematic language in our code, documentation, and web properties. We are beginning with these four terms: master, slave, blacklist, and whitelist. Because of the enormity of this endeavor, these changes will be implemented gradually over several upcoming releases. For more details, see our CTO Chris Wright’s message.
Chapter 1. Reporting in Red Hat Ansible Inside
To comply with your Red Hat Ansible Inside subscription requirements, you must send metrics files about your automation usage to Red Hat. This guide describes the data that is collected, how to implement its collection, and how the data is returned to Red Hat.
1.1. About reporting metrics
Ansible Inside saves high-level usage data about your automation jobs. Red Hat uses this data to identify where to focus effort in product improvements and new features.
After an automation job is completed, metrics are gathered to save the following information about the job:
- The type, duration, and time of the automation job.
- The names of the collections and roles used in the job, and the number of times they are used.
- The number of nodes that were installed, updated, failed, and skipped.
- The events that occurred during the job.
Red Hat does not gather Personal Identifiable Information (PII), such as IP addresses, location, user details, or operating system specification.
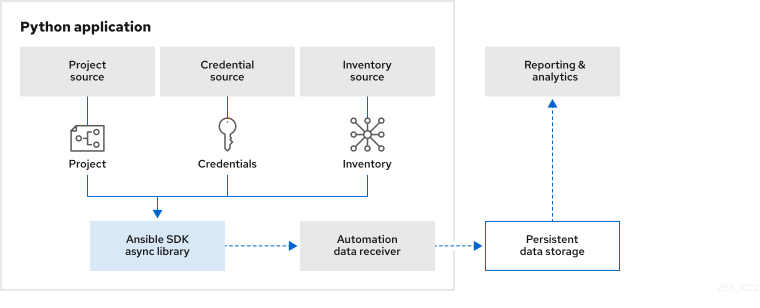
The following architecture diagram illustrates how the data is saved to the persistent data storage outside the Python application so that it can be sent to Red Hat.
1.2. About the metrics files
The metrics data is bundled into a tarball file. A separate file is generated for each job. You can view the contents of the files: they are not encrypted.
Each tarball file contains the following unencrypted CSV files:
-
jobs.csvrecords the duration and status of the automation job, the number of tasks executed, and the number of hosts that were affected by the job. -
modules.csvrecords the module name, the task count and the duration. -
collections.csv: records the collection name, the task count and the duration. -
roles.csvrecords the role name, the task count and the duration. -
playbook_on_stats.csvrecords the event ID and data.
Chapter 2. Metrics file locations
Reporting metrics to Red Hat is a requirement. Logging metrics for your automation jobs is automatically enabled when you install Ansible SDK. You cannot disable it.
Every time an automation job runs, a new tarball is created. You are responsible for scraping the data from the storage location and for monitoring the size of the directory.
You can customize the metrics storage location for each Python file that runs a playbook, or you can use the default location.
2.1. Default location for metrics files
When you install Ansible SDK, the default metrics storage location is set to the ~/.ansible/metrics directory.
After an automation job is complete, the metrics are written to a tarball in the directory. Ansible SDK creates the directory if it does not already exist.
2.2. Customizing the metrics storage location
You can specify the path to the directory to store your metrics files in the Python file that runs your playbook.
You can set a different directory path for every Python automation job file, or you can store the tarballs for multiple jobs in one directory. If you do not set the path in a Python file, the tarballs for the jobs that it runs will be saved in the default directory (~/.ansible/metrics).
Procedure
- Decide on a location on your file system to store the metrics data. Ensure that the location is readable and writable. Ansible SDK creates the directory if it does not already exist.
In the
job_optionsin themain()function of your Python file, set themetrics_output_pathparameter to the directory where the tarballs are to be stored.In the following example, the metrics files are stored in the
/tmp/metricsdirectory after thepb.ymlplaybook has been executed:async def main(): executor = AnsibleSubprocessJobExecutor() executor_options = AnsibleSubprocessJobOptions() job_options = { 'playbook': 'pb.yml', # Change the default job-related data path 'metrics_output_path': '/tmp/metrics', }
2.3. Viewing metrics files
After an automation job has completed, navigate to the directory that you specified for storing the data and list the files.
The data for the newly-completed job is contained in a tarball file whose name begins with the date and time that the automation job was run. For example, the following file records data for an automation job executed on 8 March 2023 at 2.30AM.
$ ls

2023_03_08_02_30_24__aaaaaaaa-aaaa-aaaa-aaaa-aaaaaaaaaaaa_job_data.tar.gz
To view the files in the tarball, run tar xvf.
$ tar xvf 2023_03_08_02_30_24__aaaaaaaa-aaaa-aaaa-aaaa-aaaaaaaaaaaa_job_data.tar.gz

x jobs.csv
x modules.csv
x collections.csv
x roles.csv
x playbook_on_stats.csv
The folowing example shows the jobs.csv file.
$ cat jobs.csv

job_id,job_type,started,finished,job_state,hosts_ok,hosts_changed,hosts_skipped,hosts_failed,hosts_unreachable,task_count,task_duration
84896567-a586-4215-a914-7503010ef281,local,2023-03-08 02:30:22.440045,2023-03-08 02:30:24.316458,,5,0,0,0,0,2,0:00:01.876413
When a parameter value is not available, the corresponding entry in the CSV file is empty. In the jobs.csv file above, the job_state value is not available.
Chapter 3. Reporting data to Red Hat
Your subscription contract requires you to send your .tar files to Red Hat for accounting purposes. Your Red Hat partner representative will instruct you on how to send the files to Red Hat.