
Power monitoring
Configuring and using power monitoring for Red Hat OpenShift
Abstract
Chapter 1. Power monitoring for Red Hat OpenShift release notes
Power monitoring is a Technology Preview feature only. Technology Preview features are not supported with Red Hat production service level agreements (SLAs) and might not be functionally complete. Red Hat does not recommend using them in production. These features provide early access to upcoming product features, enabling customers to test functionality and provide feedback during the development process.
For more information about the support scope of Red Hat Technology Preview features, see Technology Preview Features Support Scope.
Power monitoring for Red Hat OpenShift enables you to monitor the power usage of workloads and identify the most power-consuming namespaces running in an OpenShift Container Platform cluster with key power consumption metrics, such as CPU or DRAM, measured at container level.
These release notes track the development of power monitoring for Red Hat OpenShift in the OpenShift Container Platform.
For an overview of the Power monitoring Operator, see About power monitoring.
1.1. Power monitoring 0.1 (Technology Preview)
This release introduces a Technology Preview version of power monitoring for Red Hat OpenShift. The following advisory is available for power monitoring 0.1:
1.1.1. Features
- Deployment and deletion of Kepler
- Power usage metrics from Intel-based bare-metal deployments
- Dashboards for plotting power usage
Chapter 2. Power monitoring overview
Power monitoring is a Technology Preview feature only. Technology Preview features are not supported with Red Hat production service level agreements (SLAs) and might not be functionally complete. Red Hat does not recommend using them in production. These features provide early access to upcoming product features, enabling customers to test functionality and provide feedback during the development process.
For more information about the support scope of Red Hat Technology Preview features, see Technology Preview Features Support Scope.
2.1. About power monitoring
You can use power monitoring for Red Hat OpenShift to monitor the power usage and identify power-consuming containers running in an OpenShift Container Platform cluster. Power monitoring collects and exports energy-related system statistics from various components, such as CPU and DRAM. It provides granular power consumption data for Kubernetes pods, namespaces, and nodes.
Power monitoring Technology Preview works only in bare-metal deployments. Most public cloud vendors do not expose Kernel Power Management Subsystems to virtual machines.
2.2. Power monitoring architecture
Power monitoring is made up of the following major components:
- The Power monitoring Operator
- For administrators, the Power monitoring Operator streamlines the monitoring of power usage for workloads by simplifying the deployment and management of Kepler in an OpenShift Container Platform cluster. The setup and configuration for the Power monitoring Operator are simplified by adding a Kepler custom resource definition (CRD). The Operator also manages operations, such as upgrading, removing, configuring, and redeploying Kepler.
- Kepler
- Kepler is a key component of power monitoring. It is responsible for monitoring the power usage of containers running in OpenShift Container Platform. It generates metrics related to the power usage of both nodes and containers.
2.3. Kepler hardware and virtualization support
Kepler is the key component of power monitoring that collects real-time power consumption data from a node through one of the following methods:
- Kernel Power Management Subsystem (preferred)
-
rapl-sysfs: This requires access to the/sys/class/powercap/intel-raplhost file. -
rapl-msr: This requires access to the/dev/cpu/*/msrhost file.
-
- The
estimatorpower source Without access to the kernel’s power cap subsystem, Kepler uses a machine learning model to estimate the power usage of the CPU on the node.
WarningThe
estimatorfeature is experimental, not supported, and should not be relied upon.
You can identify the power estimation method for a node by using the Power Monitoring / Overview dashboard.
2.4. Additional resources
Chapter 3. Installing power monitoring for Red Hat OpenShift
Power monitoring is a Technology Preview feature only. Technology Preview features are not supported with Red Hat production service level agreements (SLAs) and might not be functionally complete. Red Hat does not recommend using them in production. These features provide early access to upcoming product features, enabling customers to test functionality and provide feedback during the development process.
For more information about the support scope of Red Hat Technology Preview features, see Technology Preview Features Support Scope.
You can install power monitoring for Red Hat OpenShift by deploying the Power monitoring Operator in the OpenShift Container Platform web console.
3.1. Installing the Power monitoring Operator
As a cluster administrator, you can install the Power monitoring Operator from OperatorHub by using the OpenShift Container Platform web console.
You must remove any previously installed versions of the Power monitoring Operator before installation.
Prerequisites
- You have access to the OpenShift Container Platform web console.
-
You are logged in as a user with the
cluster-adminrole.
Procedure
- In the Administrator perspective of the web console, go to Operators → OperatorHub.
-
Search for
power monitoring, click the Power monitoring for Red Hat OpenShift tile, and then click Install. Click Install again to install the Power monitoring Operator.
Power monitoring for Red Hat OpenShift is now available in all namespaces of the OpenShift Container Platform cluster.
Verification
- Verify that the Power monitoring Operator is listed in Operators → Installed Operators. The Status should resolve to Succeeded.
3.2. Deploying Kepler
You can deploy Kepler by creating an instance of the Kepler custom resource definition (CRD) by using the Power monitoring Operator.
Prerequisites
- You have access to the OpenShift Container Platform web console.
-
You are logged in as a user with the
cluster-adminrole. - You have installed the Power monitoring Operator.
Procedure
- In the Administrator perspective of the web console, go to Operators → Installed Operators.
- Click Power monitoring for Red Hat OpenShift from the Installed Operators list and go to the Kepler tab.
- Click Create Kepler.
On the Create Kepler page, ensure the Name is set to
kepler.ImportantThe name of your Kepler instance must be set to
kepler. All other instances are ignored by the Power monitoring Operator.- Click Create to deploy Kepler and power monitoring dashboards.
Chapter 4. Configuring power monitoring
Power monitoring is a Technology Preview feature only. Technology Preview features are not supported with Red Hat production service level agreements (SLAs) and might not be functionally complete. Red Hat does not recommend using them in production. These features provide early access to upcoming product features, enabling customers to test functionality and provide feedback during the development process.
For more information about the support scope of Red Hat Technology Preview features, see Technology Preview Features Support Scope.
The Kepler resource is a Kubernetes custom resource definition (CRD) that enables you to configure the deployment and monitor the status of the Kepler resource.
4.1. The Kepler configuration
You can configure Kepler with the spec field of the Kepler resource.
Ensure that the name of your Kepler instance is kepler. All other instances are ignored by the Power monitoring Operator.
The following is the list of configuration options:
Table 4.1. Kepler configuration options
| Name | Spec | Description | Default |
|---|---|---|---|
|
|
| The port on the node where the Prometheus metrics are exposed. |
|
|
|
| The nodes on which Kepler exporter pods are scheduled. |
|
|
|
| The tolerations for Kepler exporter that allow the pods to be scheduled on nodes with specific characteristics. |
|
Example Kepler resource with default configuration
apiVersion: kepler.system.sustainable.computing.io/v1alpha1
kind: Kepler
metadata:
  name: kepler
spec:
  exporter:
    deployment:
      port: 9103 1
      nodeSelector:
        kubernetes.io/os: linux 2
      Tolerations: 3
      - key: ""
        operator: "Exists"
        value: ""
        effect: ""
4.2. Monitoring the Kepler status
You can monitor the state of the Kepler exporter with the status field of the Kepler resource.
The status.exporter field includes information, such as the following:
- The number of nodes currently running the Kepler pods
- The number of nodes that should be running the Kepler pods
- Conditions representing the health of the Kepler resource
This provides you with valuable insights into the changes made through the spec field.
Example state of the Kepler resource
apiVersion: kepler.system.sustainable.computing.io/v1alpha1
kind: Kepler
metadata:
  name: kepler
status:
 exporter:
   conditions: 1
     - lastTransitionTime: '2024-01-11T11:07:39Z'
       message: Reconcile succeeded
       observedGeneration: 1
       reason: ReconcileSuccess
       status: 'True'
       type: Reconciled
     - lastTransitionTime: '2024-01-11T11:07:39Z'
       message: >-
         Kepler daemonset "kepler-operator/kepler" is deployed to all nodes and
         available; ready 2/2
       observedGeneration: 1
       reason: DaemonSetReady
       status: 'True'
       type: Available
   currentNumberScheduled: 2 2
   desiredNumberScheduled: 2 3
Chapter 5. Visualizing power monitoring metrics
Power monitoring is a Technology Preview feature only. Technology Preview features are not supported with Red Hat production service level agreements (SLAs) and might not be functionally complete. Red Hat does not recommend using them in production. These features provide early access to upcoming product features, enabling customers to test functionality and provide feedback during the development process.
For more information about the support scope of Red Hat Technology Preview features, see Technology Preview Features Support Scope.
You can visualize power monitoring metrics in the OpenShift Container Platform web console by accessing power monitoring dashboards or by exploring Metrics under the Observe tab.
5.1. Power monitoring dashboards overview
There are two types of power monitoring dashboards. Both provide different levels of details around power consumption metrics for a single cluster:
Power Monitoring / Overview dashboard
With this dashboard, you can observe the following information:
-
An aggregated view of CPU architecture and its power source (
rapl-sysfs,rapl-msr, orestimator) along with total nodes with this configuration - Total energy consumption by a cluster in the last 24 hours (measured in kilowatt-hour)
- The amount of power consumed by the top 10 namespaces in a cluster in the last 24 hours
- Detailed node information, such as its CPU architecture and component power source
These features allow you to effectively monitor the energy consumption of the cluster without needing to investigate each namespace separately.
Ensure that the Components Source column does not display estimator as the power source.
Figure 5.1. The Detailed Node Information table with rapl-sysfs as the component power source
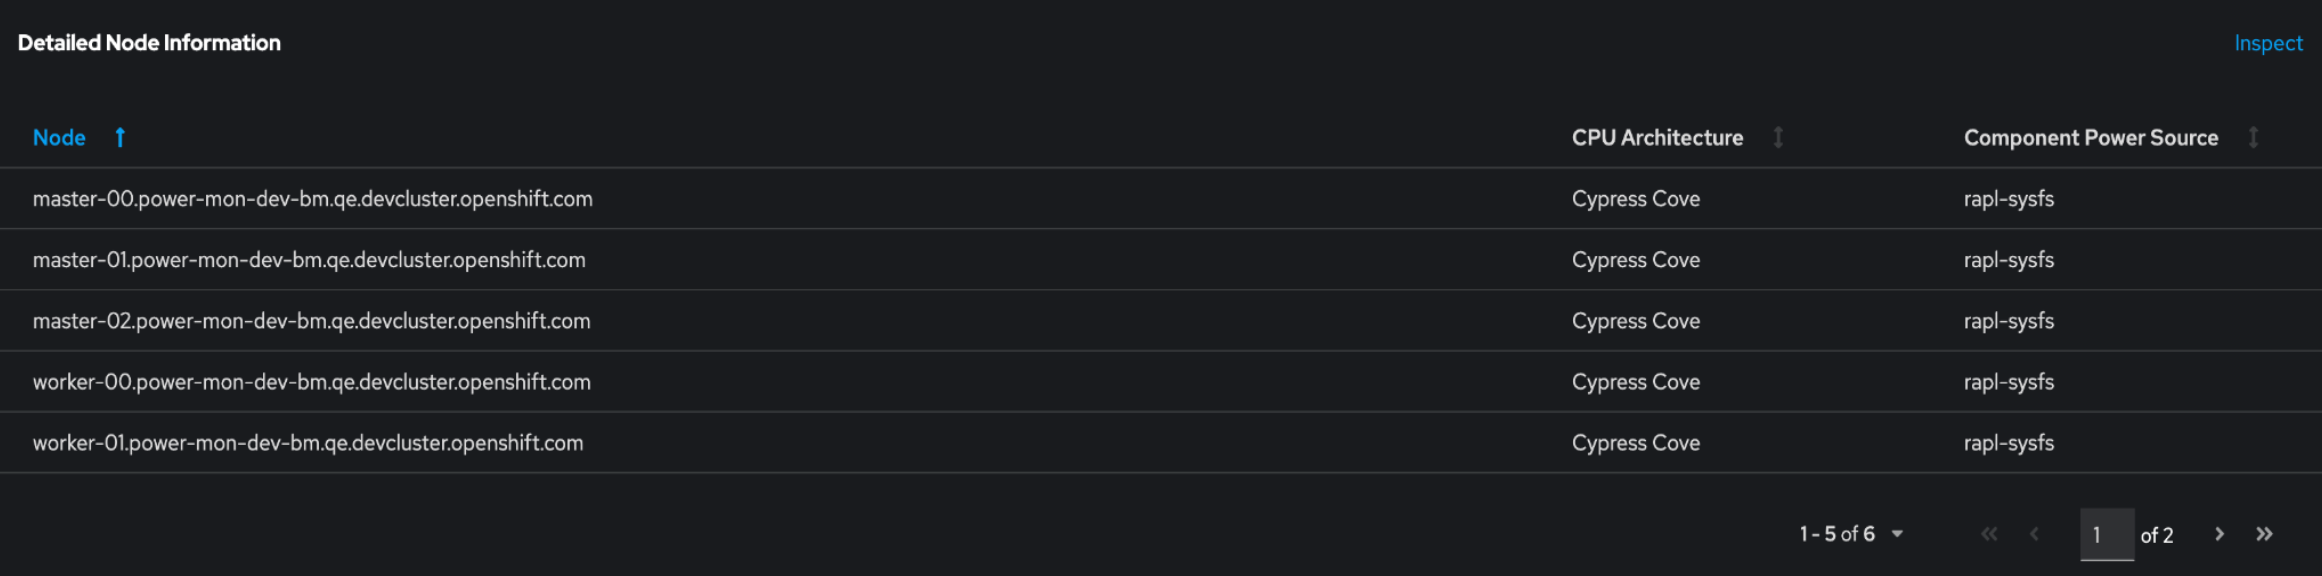
If Kepler is unable to obtain hardware power consumption metrics, the Components Source column displays estimator as the power source, which is not supported in Technology Preview. If that happens, then the values from the nodes are not accurate.
Power Monitoring / Namespace dashboard
This dashboard allows you to view metrics by namespace and pod. You can observe the following information:
- The power consumption metrics, such as consumption in DRAM and PKG
- The energy consumption metrics in the last hour, such as consumption in DRAM and PKG for core and uncore components
This feature allows you to investigate key peaks and easily identify the primary root causes of high consumption.
5.2. Accessing power monitoring dashboards
You can access power monitoring dashboards from the Administrator perspective of the OpenShift Container Platform web console.
Prerequisites
- You have access to the OpenShift Container Platform web console.
-
You are logged in as a user with the
cluster-adminrole. - You have installed the Power monitoring Operator.
- You have deployed Kepler in your cluster.
- You have enabled monitoring for user-defined projects.
Procedure
- In the Administrator perspective of the web console, go to Observe → Dashboards.
From the Dashboard drop-down list, select the power monitoring dashboard you want to see:
- Power Monitoring / Overview
- Power Monitoring / Namespace
5.3. Power monitoring metrics overview
The Power monitoring Operator exposes the following metrics, which you can view by using the OpenShift Container Platform web console under the Observe → Metrics tab.
This list of exposed metrics is not definitive. Metrics might be added or removed in future releases.
Table 5.1. Power monitoring Operator metrics
| Metric name | Description |
|---|---|
|
| The aggregated package or socket energy consumption of CPU, DRAM, and other host components by a container. |
|
|
The total energy consumption across CPU cores used by a container. If the system has access to |
|
| The total energy consumption of DRAM by a container. |
|
| The cumulative energy consumption by uncore components used by a container. The number of components might vary depending on the system. The uncore metric is processor model-specific and might not be available on some server CPUs. |
|
| The cumulative energy consumed by the CPU socket used by a container. It includes all core and uncore components. |
|
| The cumulative energy consumption of host components, excluding CPU and DRAM, used by a container. Generally, this metric is the energy consumption of ACPI hosts. |
|
| The total CPU time used by the container that utilizes the BPF tracing. |
|
| The total CPU cycles used by the container that utilizes hardware counters. CPU cycles is a metric directly related to CPU frequency. On systems where processors run at a fixed frequency, CPU cycles and total CPU time are roughly equivalent. On systems where processors run at varying frequencies, CPU cycles and total CPU time have different values. |
|
| The total CPU instructions used by the container that utilizes hardware counters. CPU instructions is a metric that accounts how the CPU is used. |
|
| The total cache miss that occurs for a container that uses hardware counters. |
|
| The total CPU time used by a container reading from control group statistics. |
|
| The total memory in bytes used by a container reading from control group statistics. |
|
| The total CPU time in kernel space used by the container reading from control group statistics. |
|
| The total CPU time in user space used by a container reading from control group statistics. |
|
| The total number of packets transmitted to network cards of a container that uses the BPF tracing. |
|
| The total number of packets received from network cards of a container that uses the BPF tracing. |
|
| The total number of block I/O calls of a container that uses the BPF tracing. |
|
| The node metadata, such as the node CPU architecture. |
|
| The total energy consumption across CPU cores used by all containers running on a node and operating system. |
|
| The cumulative energy consumption by uncore components used by all containers running on the node and operating system. The number of components might vary depending on the system. |
|
| The total energy consumption of DRAM by all containers running on the node and operating system. |
|
| The cumulative energy consumed by the CPU socket used by all containers running on the node and operating system. It includes all core and uncore components. |
|
| The cumulative energy consumption of host components, excluding CPU and DRAM, used by all containers running on the node and operating system. Generally, this metric is the energy consumption of ACPI hosts. |
|
| The total energy consumption of the host. Generally, this metric is the host energy consumption from Redfish BMC or ACPI. |
|
| Multiple metrics from nodes labeled with container resource utilization control group metrics that are used in the model server. |
|
| The utilization of the accelerator Intel QAT on a certain node. If the system contains Intel QATs, Kepler can calculate the utilization of the node’s QATs through telemetry. |
5.4. Additional resources
Chapter 6. Uninstalling power monitoring
Power monitoring is a Technology Preview feature only. Technology Preview features are not supported with Red Hat production service level agreements (SLAs) and might not be functionally complete. Red Hat does not recommend using them in production. These features provide early access to upcoming product features, enabling customers to test functionality and provide feedback during the development process.
For more information about the support scope of Red Hat Technology Preview features, see Technology Preview Features Support Scope.
You can uninstall power monitoring by deleting the Kepler instance and then the Power monitoring Operator in the OpenShift Container Platform web console.
6.1. Deleting Kepler
You can delete Kepler by removing the Kepler instance of the Kepler custom resource definition (CRD) from the OpenShift Container Platform web console.
Prerequisites
- You have access to the OpenShift Container Platform web console.
-
You are logged in as a user with the
cluster-adminrole.
Procedure
- In the Administrator perspective of the web console, go to Operators → Installed Operators.
- Click Power monitoring for Red Hat OpenShift from the Installed Operators list and go to the Kepler tab.
- Locate the Kepler instance entry in the list.
-
Click
 for this entry and select Delete Kepler.
- In the Delete Kepler? dialog, click Delete to delete the Kepler instance.
6.2. Uninstalling the Power monitoring Operator
If you installed the Power monitoring Operator by using OperatorHub, you can uninstall it from the OpenShift Container Platform web console.
Prerequisites
- You have access to the OpenShift Container Platform web console.
-
You are logged in as a user with the
cluster-adminrole.
Procedure
Delete the Kepler instance.
WarningEnsure that you have deleted the Kepler instance before uninstalling the Power monitoring Operator.
- Go to Operators → Installed Operators.
- Locate the Power monitoring for Red Hat OpenShift entry in the list.
-
Click
for this entry and select Uninstall Operator.
- In the Uninstall Operator? dialog, click Uninstall to uninstall the Power monitoring Operator.