
Monitoring server and database activity
Monitor Red Hat Directory Server activity, replication topology, and database activity
Abstract
Providing feedback on Red Hat documentation
We appreciate your input on our documentation. Please let us know how we could make it better. To do so:
For submitting feedback through Jira (account required):
- Log in to the Jira website.
- Click Create in the top navigation bar
- Enter a descriptive title in the Summary field.
- Enter your suggestion for improvement in the Description field. Include links to the relevant parts of the documentation.
- Click Create at the bottom of the dialogue.
For submitting feedback through Bugzilla (account required):
- Go to the Bugzilla website.
- As the Component, use Documentation.
- Fill in the Description field with your suggestion for improvement. Include a link to the relevant part(s) of documentation.
- Click Submit Bug.
Chapter 1. Monitoring Directory Server activity
The Red Hat Directory Server tracks and records performance data using performance counters and directory server logs.
Performance counters provide a measurement of the Directory Server performance. Performance counters focus on the operations and information of the Directory Server, configured databases, and database links (chaining databases).
The directory server logs provide diagnosis to problem areas with server and LDAP operations and configuration. Following are the three types of log used for performance monitoring:
- Access logs
- Lists the connection attempts made by the client.
- Error logs
- Monitors errors, warnings, and records all error details.
- Audit logs
- Records the changes made to the Directory Server configurations.
The access and error logs run by default. The error log is a mandatory requirement for the server to run. Audit logs require manual enabling and can involve some minimal overhead resources.
The information on the current Directory Server activities is available through the web console or by using the command line. You can also monitor the cache activity of all databases.
The access log is buffered and it enables full access logging even with highly loaded servers. However, there is a discrepancy between when the event occurs on the server and the time the event is recorded in the log.
1.1. Monitoring Directory Server using the command line
With the dsconf command, you can monitor the disk usage, query server statistics that are stored in the directory, and other metrics to track the performance.
Prerequisite
-
Ensure the server is running to use the
dconfutility.
Procedure
To monitor the server performance using the command-line, run:
# dsconf -D "cn=Directory Manager" ldap://server.example.com monitor serverwhere:
-
Dis thebindDNargument to connect to the LDAP directory. -
cn=Directory Manageris thebindDNvalue for LDAP authentication. -
ldapcollects the server statistics using the specified Lightweight Directory Access Protocol (LDAP) URL.
-
1.2. Server monitoring attributes
The dsconf command returns the following attributes when monitoring Directory Server.
Table 1.1. Server monitoring attributes
| Attribute | Description |
|---|---|
|
| Identifies the current directory version number. |
|
| The current number of active threads handling requests. The internal server tasks, such as replication or chaining, can create additional threads when required. |
|
| Provides the following summary information for each open connection when you bind to the directory as the Directory Manager:
By default, this information is available to the Directory Manager. However, you can edit the Access Control Instruction (ACI) attribute in directory entries and configure additional users on access privileges to the information. |
|
| Identifies the number of connections currently in service by the directory. |
|
| Identifies the number of connections the server handles after it starts. |
|
|
Displays the connections currently in a |
|
|
Displays the number of times a connection hits the |
|
|
Shows the number of file descriptors available for the directory. Each connection requires one file descriptor for every open index, log file management, and for |
|
| Identifies the number of threads waiting to read data from a client. |
|
| Identifies the number of operations the server initiates after it starts. |
|
| Identifies the number of operations the server completes. |
|
| Identifies the number of entries sent to clients after the server starts. |
|
| Identifies the number of bytes sent to clients after the server starts. |
|
| Identifies the server snapshot time. The time display is Greenwich Mean Time (GMT) in UTC format. |
|
| Identifies the time when the server starts. The time display is Greenwich Mean Time (GMT) in UTC format. |
|
| Identifies the number of back ends (databases) the server services. |
1.3. Monitoring Directory Server using the web console
The web console is a browser-based graphical user interface (GUI) that enables users to perform administrative tasks. The Directory Server packages automatically install the Directory Server user interface for the web console.
Procedure
To open Directory Server in the web console, connect to the web console running on port 9090 on the Directory Server host.
https://server.example.com:9090
-
Log in as the
rootuser or withsudoprivileges. Under the
Monitoringtab, select → .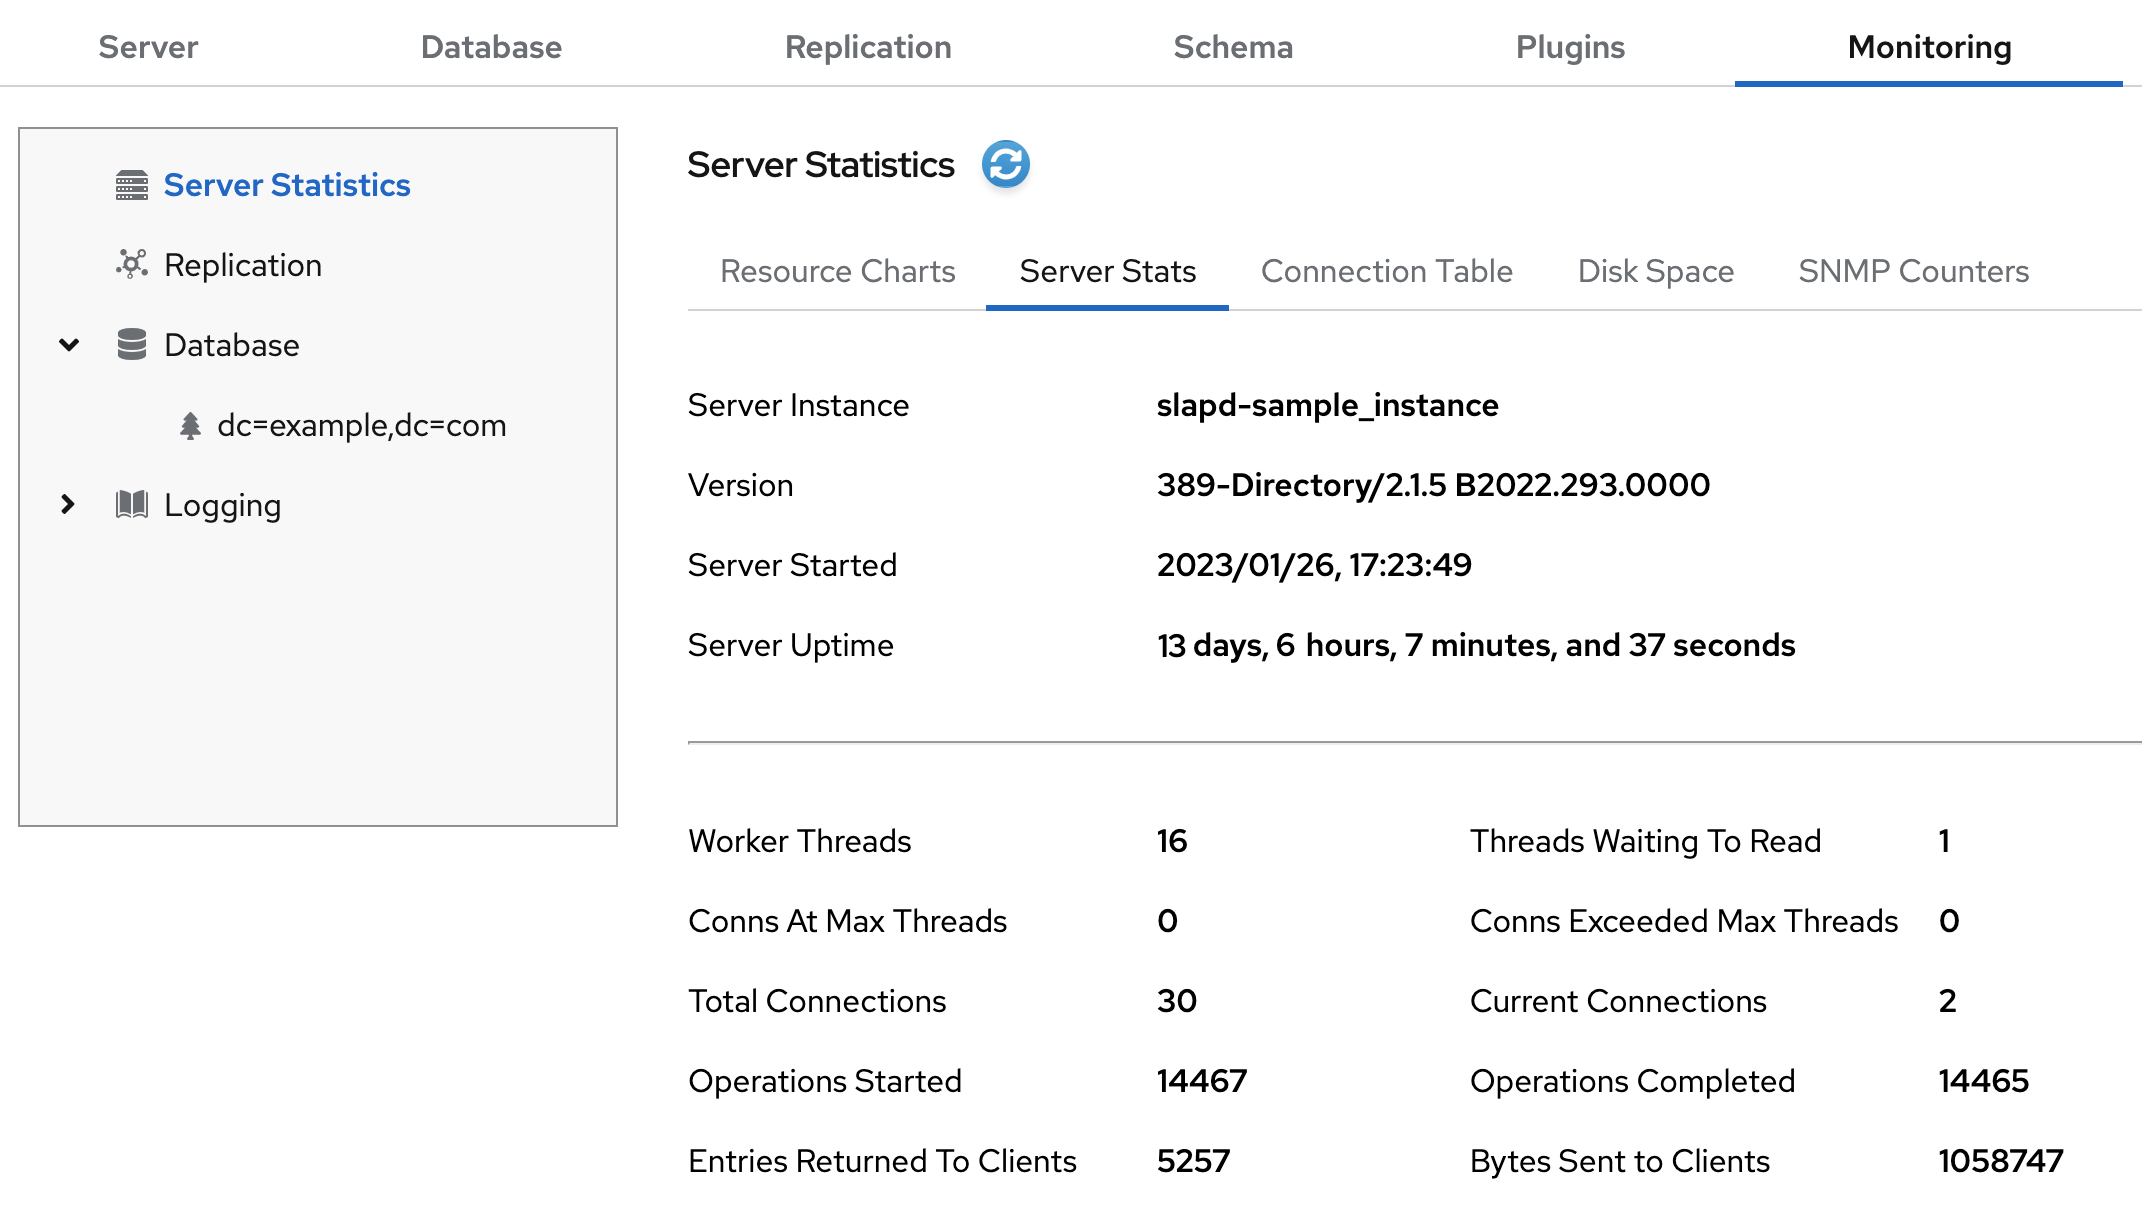
Additional resources
1.4. Server information
The Directory Server displays the following fields under the Server Information menu.
Table 1.2. Server information
| Field | Description |
|---|---|
|
| Displays the name of the Directory Server instance. |
|
| Identifies the current server version. |
|
| The date and time the server is up and running. |
|
| The measure of time the instance is up and running. |
|
| The current number of active threads that handle requests. The internal server tasks, such as replication or chaining, can create additional threads when required. |
|
| The total number of threads waiting to be read from the client. Threads may not be immediately read if the server receives new request from the client and halts the request transmission. Generally, waiting threads indicate a slow network or a slow client. |
|
|
Displays all connections that are currently in a |
|
|
Displays the number of times a connection hits |
|
| The total number of connections established to a Directory Server instance. |
|
| The total number of open connections. Each connection can start multiple operations and therefore multiple threads. |
|
| The number of operations initiated by a connection. |
|
| The number of operations completed by the server for all connections. |
|
| The number of entries sent to clients after the server starts. |
Chapter 2. Using the health check to identify problems
Perform a health check to analyze the Directory Server instance for potential issues and to get recommended solutions.
2.1. Running the Directory Server health check
Use the dsctl healthcheck command to run a health check.
Procedure
To run a health check, enter:
#
dsctl instance_name healthcheckBeginning lint report, this could take a while ... Checking Backends ... Checking Config ... Checking Encryption ... Checking FSChecks ... Checking ReferentialIntegrityPlugin ... Checking MonitorDiskSpace ... Checking Replica ... Checking Changelog ... Checking NssSsl ... Healthcheck complete. 1 Issue found! Generating report ...To display the output in JSON format, pass the
--jsonparameter to the command:#
dsctl --json instance_name healthcheckExample 2.1. Possible report of the health check
[1] DS Lint Error: DSELE0001
--------------------------------------------------------------------------------
Severity: MEDIUM
Affects:
 -- cn=encryption,cn=config

Details:
-----------
This Directory Server may not be using strong TLS protocol versions. TLS1.0 is known to
have a number of issues with the protocol. Please see:

https://tools.ietf.org/html/rfc7457

It is advised you set this value to the maximum possible.

Resolution:
-----------
There are two options for setting the TLS minimum version allowed.  You,
can set "sslVersionMin" in "cn=encryption,cn=config" to a version greater than "TLS1.0"
You can also use 'dsconf' to set this value.  Here is an example:

    # dsconf slapd-instance_name security set --tls-protocol-min=TLS1.2

You must restart the Directory Server for this change to take effect.

Or, you can set the system wide crypto policy to FUTURE which will use a higher TLS
minimum version, but doing this affects the entire system:

    # update-crypto-policies --set FUTURE


===== End Of Report (1 Issue found) =====
Example 2.2. Possible report of the health check in JSON format
[
    {
        "dsle": "DSELE0001",
        "severity": "MEDIUM",
        "items": [
            "cn=encryption,cn=config"
        ],
        "detail": "This Directory Server may not be using strong TLS protocol versions. TLS1.0 is known to\nhave a number of issues with the protocol. Please see:\n\nhttps://tools.ietf.org/html/rfc7457\n\nIt is advised you set this value to the maximum possible.",
        "fix": "There are two options for setting the TLS minimum version allowed.  You,\ncan set \"sslVersionMin\" in \"cn=encryption,cn=config\" to a version greater than \"TLS1.0\"\nYou can also use 'dsconf' to set this value.  Here is an example:\n\n    # dsconf slapd-instance_name security set --tls-protocol-min=TLS1.2\n\nYou must restart the Directory Server for this change to take effect.\n\nOr, you can set the system wide crypto policy to FUTURE which will use a higher TLS\nminimum version, but doing this affects the entire system:\n\n    # update-crypto-policies --set FUTURE"
    }
]
Additional resources
2.2. Overview of health checks
Overview of health checks performed by the dsctl healthcheck command.
Table 2.1. Health checks overview
| Component | Severity | Result code | Description |
|---|---|---|---|
| Back end | Low | DSBLE0003 | The database was not initialized. The database was created, but it is empty. |
| Back end | Medium | DSBLE0001 | The mapping tree entry for a back end is missing in the configuration. |
| Config | Low | DSCLE0001 | High-resolution time stamps are disabled. |
| Config | High | DSVIRTLE0001 | A virtual attribute is incorrectly indexed. Indexed attributes used by roles or Class of Service (CoS) definitions can corrupt search results. |
| Operating System | Medium | DSPERMLE0001 |
The permissions set on the |
| Operating System | High | DSDSLE0001 | Low disk space. |
| Operating System | High | DSPERMLE0002 |
The permissions set on the |
| Plug-ins | Low | DSRILE0001 | An update delay is set for the Referential Integrity plug-in. This can cause replication issues. |
| Plug-ins | High | DSRILE0002 | The Referential Integrity plug-in misses indexes. The plug-in queries certain attributes for every delete operation if they are not indexed. This can cause hard-to-detect unindexed searches and high CPU usage. |
| Replication | Low | DSREPLLE0002 | Conflict entries exist in the database. |
| Replication | Low | DSSKEWLE0001 | The replication time skew is larger than 6 hours and lower than 12 hours. |
| Replication | Medium | DSCLLE0001 | Changelog trimming is disabled. In this case, the changelog grows without limits. |
| Replication | Medium | DSREPLLE0004 | The health check failed to retrieve the replication status. |
| Replication | Medium | DSREPLLE0003 | The topology is out of synchronization, but the replication is working. |
| Replication | Medium | DSREPLLE0005 | A remote replica is not reachable. |
| Replication | Medium | DSSKEWLE0002 | The replication time skew is larger than 12 hours and lower than 24 hours. |
| Replication | High | DSREPLLE0001 | The topology is out of synchronization, and the replication is not working. |
| Replication | High | DSSKEWLE0003 | The replication time skew is larger than 24 hours. Replication sessions could break. |
| Security | Medium | DSELE0001 | The minimum TLS version is set to a value lower than TLS 1.2. |
| Security | High | DSCLE0002 | A password storage scheme is weak. |
| Server | High | DSBLE0002 | The health check failed to query the back end. |
| TLS certificates | Medium | DSCERTLE0001 | The server certificate expires within the next 30 days. |
| TLS certificates | High | DSCERTLE0002 | The server certificate has expired. |
Chapter 3. Configuring log files
You can configure Directory Server to record events to log files that you can then use to troubleshoot, monitor, and analyze the directory activity. Configuring Directory Server to record events to log files is essential for solving existing problems and for predicting potential problems that might result in failure or poor performance.
3.1. Directory Server log files overview
Directory Server stores four kinds of log files in the /var/log/dirsrv/slapd-instance_name/ directory:
- Access log (access)
- Contains information on client connections and connection attempts to the Directory Server instance. This log type is enabled by default.
- Error log (error)
- Contains detailed messages of errors and events the directory experiences during usual operations. This log type is enabled by default.
If Directory Server fails to write messages to the error log file, the server sends an error message to the syslog service and exits.
- Audit log (audit)
-
Records changes made to each database and to the server configuration. This log type is not enabled by default. If you enable audit logging, Directory Server records only successful operations to the
auditlog file. However, you can record failing operations to a separate file if you enable audit fail logging. - Audit fail log (audit-failure)
- Records failed change operations. This log type is not enabled by default.
- Security log (security)
- Records authentication events, authorization issues, DoS/TCP attacks, and other security events.
3.2. Displaying log files
You can display Directory Server log files using the command line and the web console.
3.2.1. Displaying log files using the command line
To display the log files using the command line, use the utilities included in Red Hat Enterprise Linux, such as less, more, and cat.
Procedure
To display, for example, the
accesslog file, use the command:# less /var/log/dirsrv/slapd-instance_name/access
To display the locations of log files, use the command:
# dsconf -D "cn=Directory Manager" ldap://server.example.com config get nsslapd-accesslog nsslapd-errorlog nsslapd-auditlog nsslapd-auditfaillog nsslapd-securitylog

nsslapd-accesslog: /var/log/dirsrv/slapd-instance_name/access
nsslapd-errorlog: /var/log/dirsrv/slapd-instance_name/errors
nsslapd-auditlog: /var/log/dirsrv/slapd-instance_name/audit
nsslapd-auditfaillog: /var/log/dirsrv/slapd-instance_name/audit-failure
nsslapd-securitylog: /var/log/dirsrv/slapd-instance_name/security
If you have not enabled logging for a specified log type, the corresponding log file does not exist.
3.2.2. Displaying log files using the web console
You can view Directory Server log files using the web console.
Prerequisites
- You are logged in to the web console.
Procedure
- Select the instance.
- Navigate to → .
Select the log file you want to display, for example,
Access Log.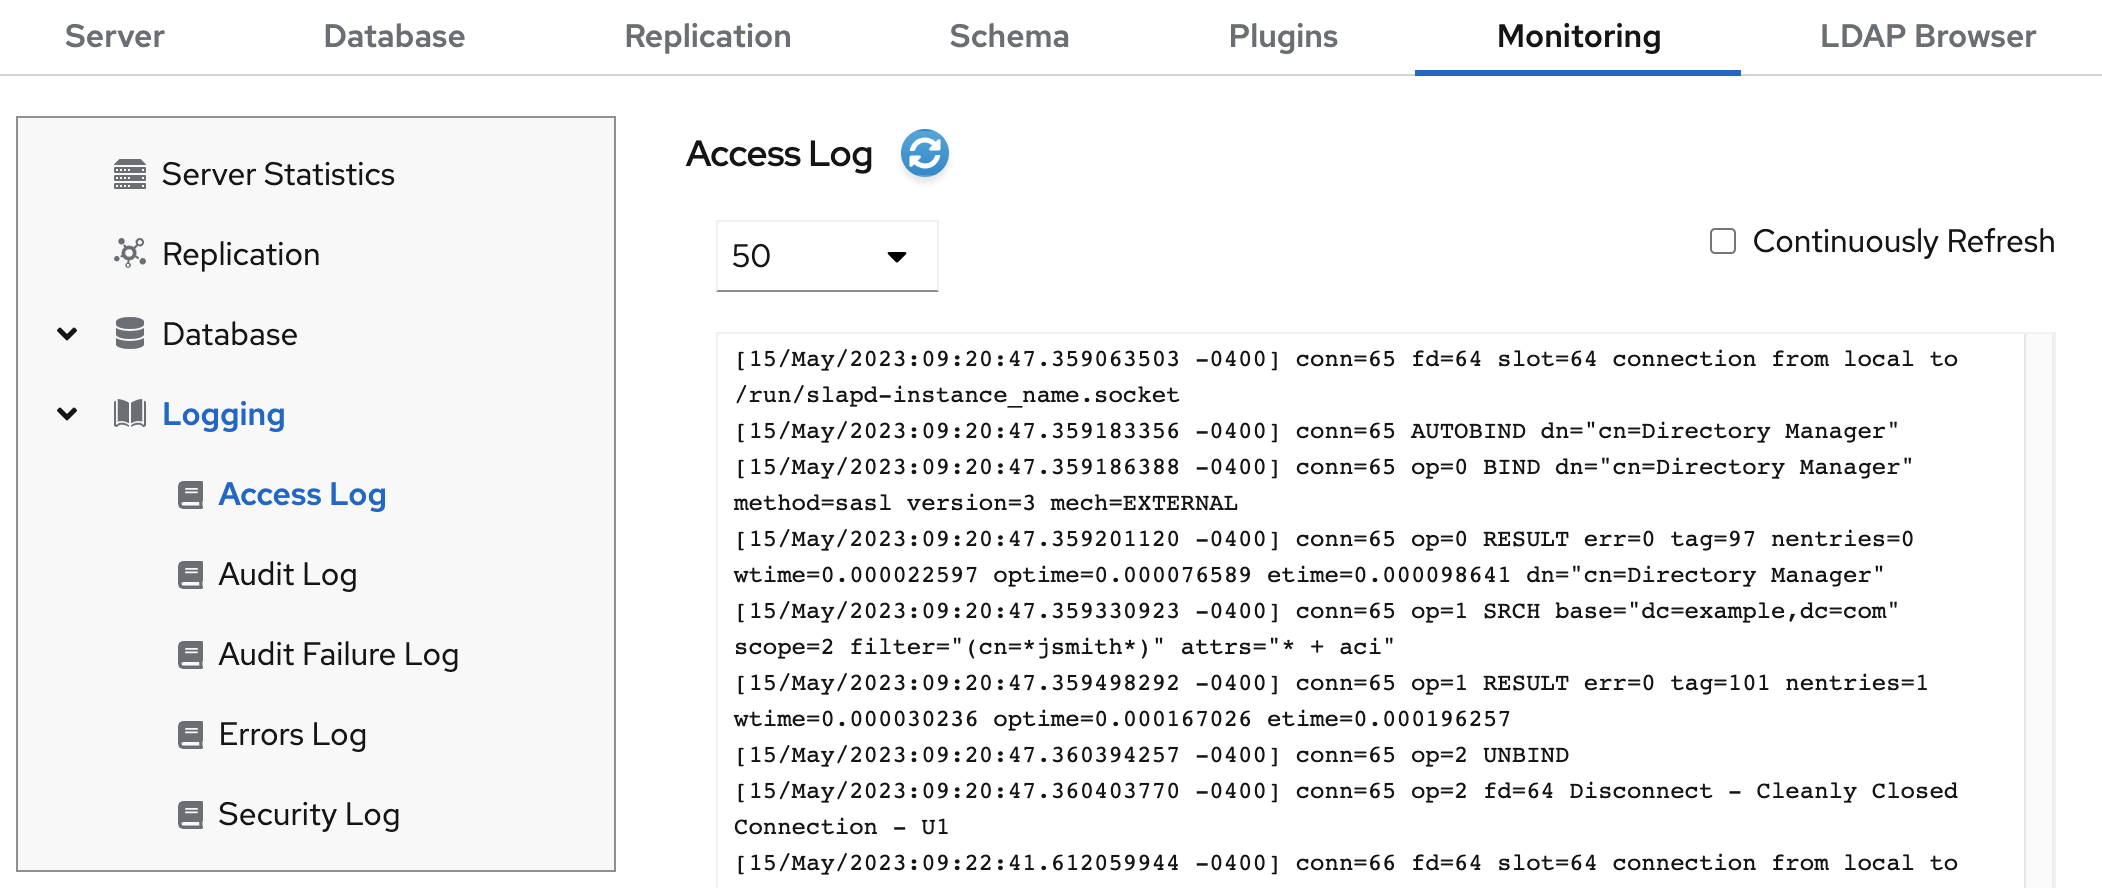
Optionally, you can apply the following settings to the log file viewer:
- Set the number of records to display.
- Enable automatically displaying of new log entries by selecting Continuously Refresh.
- Click the button to apply the changes.
3.3. Enabling or disabling logging
By default, Directory Server enables access and error logging, and disables audit and audit fail logging.
Disabling the access logging can be useful in certain scenarios, because every 2000 accesses to the directory increases the log file by approximately 1 MB. However, before turning off access logging, consider that this information can help to troubleshoot problems.
3.3.1. Enabling or disabling logging using the command line
Use the dsconf config replace command to modify the following attributes in the cn=config DN entry that manage the Directory Server logging feature:
-
nsslapd-accesslog-logging-enabled(access log) -
nsslapd-errorlog-logging-enabled(error log) -
nsslapd-auditlog-logging-enabled(audit log) -
nsslapd-auditfaillog-logging-enabled(audit fail log) -
nsslapd-securitylog-logging-enabled(security log)
Procedure
For example, to enable the access logging, set the
nsslapd-accesslog-logging-enabledattribute value toonwith the following command:# dsconf -D "cn=Directory Manager" ldap://server.example.com config replace nsslapd-accesslog-logging-enabled=onNoteMake sure that the
nsslapd-accesslogattribute contains valid path and filename of the log file. Otherwise, you can not enable the access logging.-
For example, to disable the error logging, set the
nsslapd-errorlog-logging-enabledattribute value tooffwith the following command:
# dsconf -D "cn=Directory Manager" ldap://server.example.com config replace nsslapd-errorlog-logging-enabled=offAdditional resources
- For more details on the log enabling attributes, see corresponding sections in Core server configuration attributes description.
3.3.2. Enabling or disabling logging using the web console
You can use the Directory Server web console to enable or disable logging for an instance.
Prerequisites
- You are logged in to the web console.
Procedure
- Select the instance.
- Navigate to → .
-
Select the log type you want to configure, for example,
Access Log. - Enable or disable the logging for the selected log type.
Optionally, configure additional settings, such as the log level, the log rotation policy, and the log buffering.
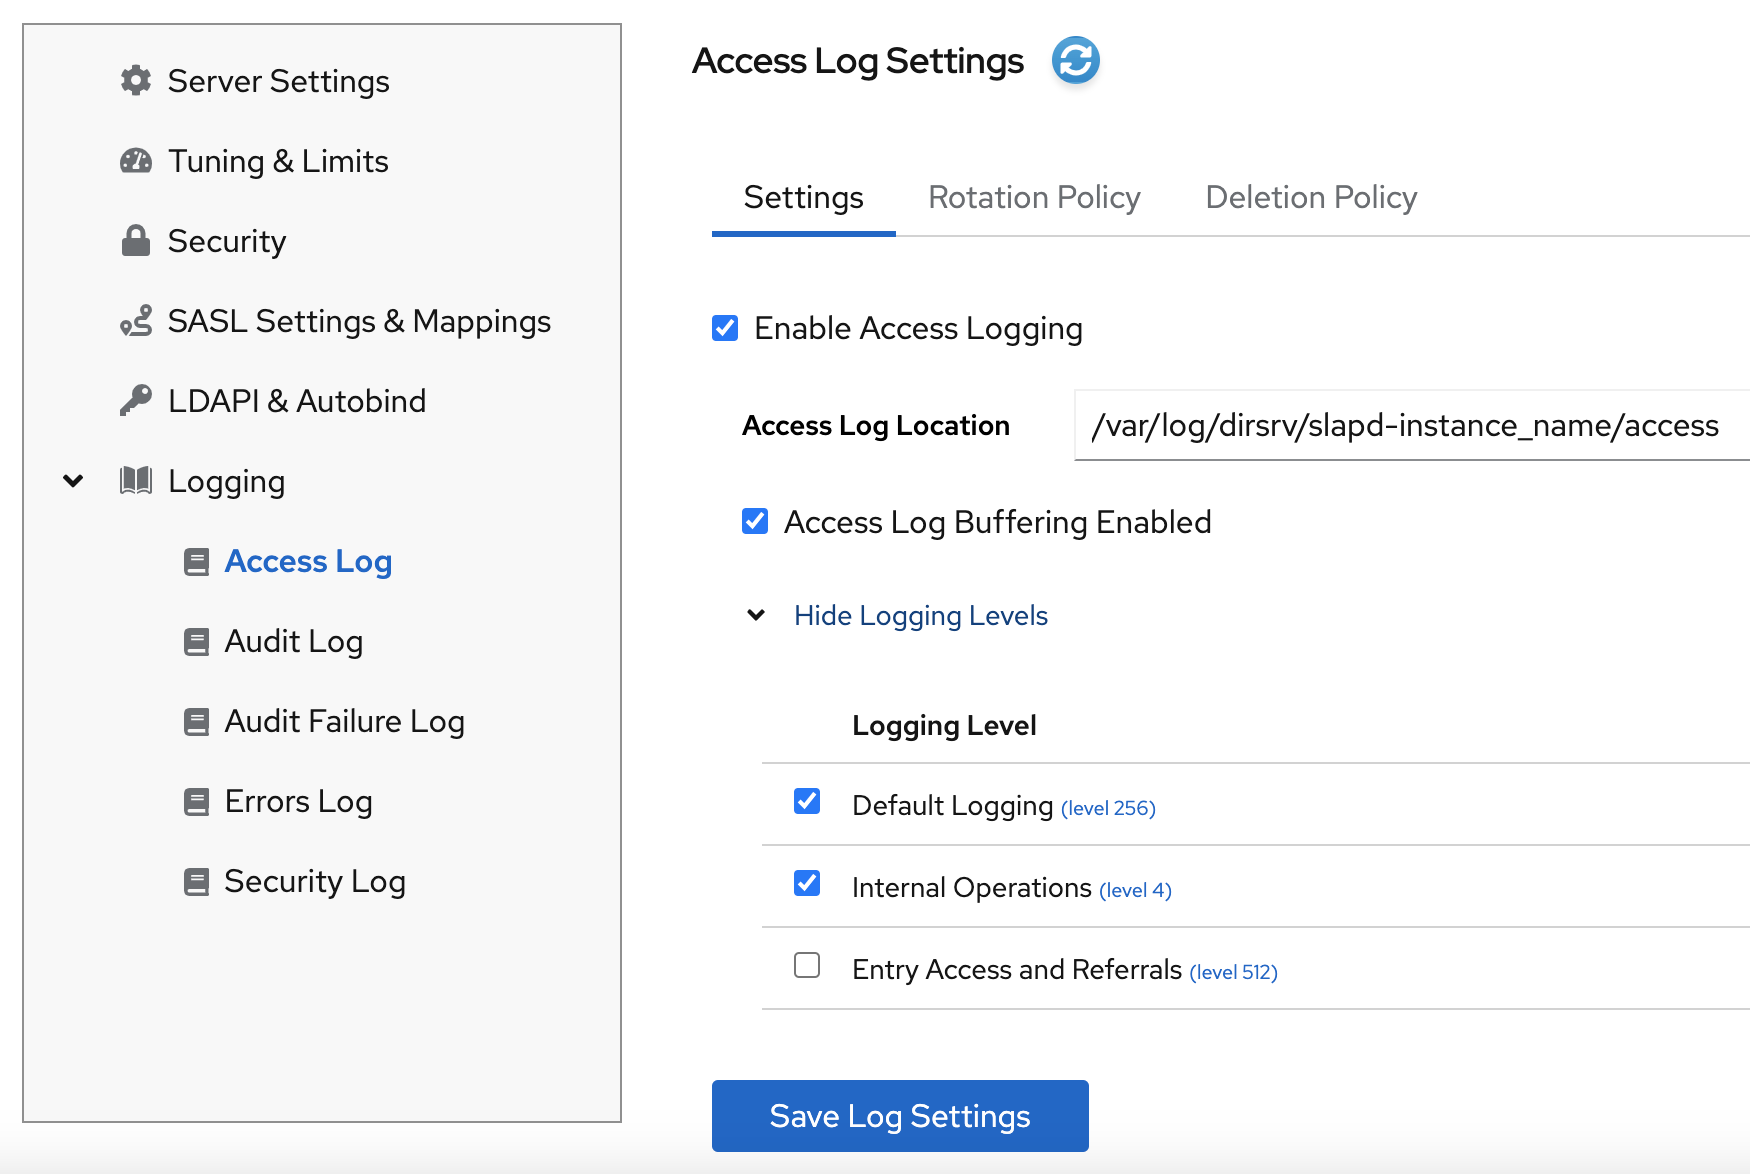
- Click the button to apply the changes.
Verification
- Navigate to → and see if Directory Server now logs the events.
3.4. Defining a log rotation policy
Directory Server periodically rotates the current log file and create a new one. However, you can configure a rotation policy using the command line or the web console. You can manage the following rotation settings:
- Maximum number of logs
-
Sets the maximum number of log files to keep. When the number of files is reached, Directory Server deletes the oldest log file before creating the new one. By default, it is
10for the access log, and1for other logs. - Maximum log size (in MB)
-
Sets the maximum size of a log file in megabytes before it is rotated. By default, it is
100megabyte for all logs. - Create new log every
- Sets the maximum age of a log file. By default, Directory Server rotates all logs every week.
- Time of day
- Set the time when the log file is rotated. This setting is not enabled by default for all logs.
- Access mode
-
The access mode sets the file permissions on newly created log files. By default, it is
600for all logs.
3.4.1. Configuring a log rotation policy using the command line
You can use the dsconf config replace command to modify the following attributes that manage rotation policies:
| access log | error log | audit log | audit fail log | security log | |
|---|---|---|---|---|---|
| Maximum number of logs | nsslapd-accesslog-maxlogsperdir | nsslapd-errorlog-maxlogsperdir | nsslapd-auditlog-maxlogsperdir | nsslapd-auditfaillog-maxlogsperdir | nsslapd-securitylog-maxlogsperdir |
| Maximum log size (in MB) | nsslapd-accesslog-maxlogsize | nsslapd-errorlog-maxlogsize | nsslapd-auditlog-maxlogsize | nsslapd-auditfaillog-maxlogsize | nsslapd-securitylog-maxlogsize |
| Create new log every | nsslapd-accesslog-logrotationtime, nsslapd-accesslog-logrotationtimeunit | nsslapd-errorlog-logrotationtime, nsslapd-errorlog-logrotationtimeunit | nsslapd-auditlog-logrotationtime, nsslapd-auditlog-logrotationtimeunit | nsslapd-auditfaillog-logrotationtime, nsslapd-auditfaillog-logrotationtimeunit | nsslapd-securitylog-logrotationtime, nsslapd-securitylog-logrotationtimeunit |
| Time of day | nsslapd-accesslog-logrotationsynchour, nsslapd-accesslog-logrotationsyncmin | nsslapd-errorlog-logrotationsynchour, nsslapd-errorlog-logrotationsyncmin | nsslapd-auditlog-logrotationsynchour, nsslapd-auditlog-logrotationsyncmin | nsslapd-auditfaillog-logrotationsynchour, nsslapd-auditfaillog-logrotationsyncmin | nsslapd-securitylog-logrotationsynchour, nsslapd-securitylog-logrotationsyncmin |
| Access mode | nsslapd-accesslog-mode | nsslapd-errorlog-mode | nsslapd-auditlog-mode | nsslapd-auditfaillog-mode | nsslapd-securitylog-mode |
Procedure
For example, to configure the error log to use access mode 600, to keep maximum 2 logs, and to rotate log files with a 100 MB size or every 5 days, enter:
# dsconf -D "cn=Directory Manager" ldap://server.example.com config replace nsslapd-errorlog-mode=600 nsslapd-errorlog-maxlogsperdir=2 nsslapd-errorlog-maxlogsize=100 nsslapd-errorlog-logrotationtime=5 nsslapd-errorlog-logrotationtimeunit=day
Additional resources
- For more details on rotation policy attributes, see the corresponding sections in the Configuration and schema reference guide.
3.4.2. Configuring a log rotation policy using the web console
You can manage a log rotation policy using the web console.
Prerequisites
- You are logged in to the web console.
Procedure
- Select the instance.
Navigate to → and select the log type, for example,
Error Log.The Error Log Settings page opens.
- Click the Rotation Policy tab.
Configure rotation policy parameters. For example, set maximum 3 log files, the log size maximum 110 MB, and creation of a new log file every 3 days.
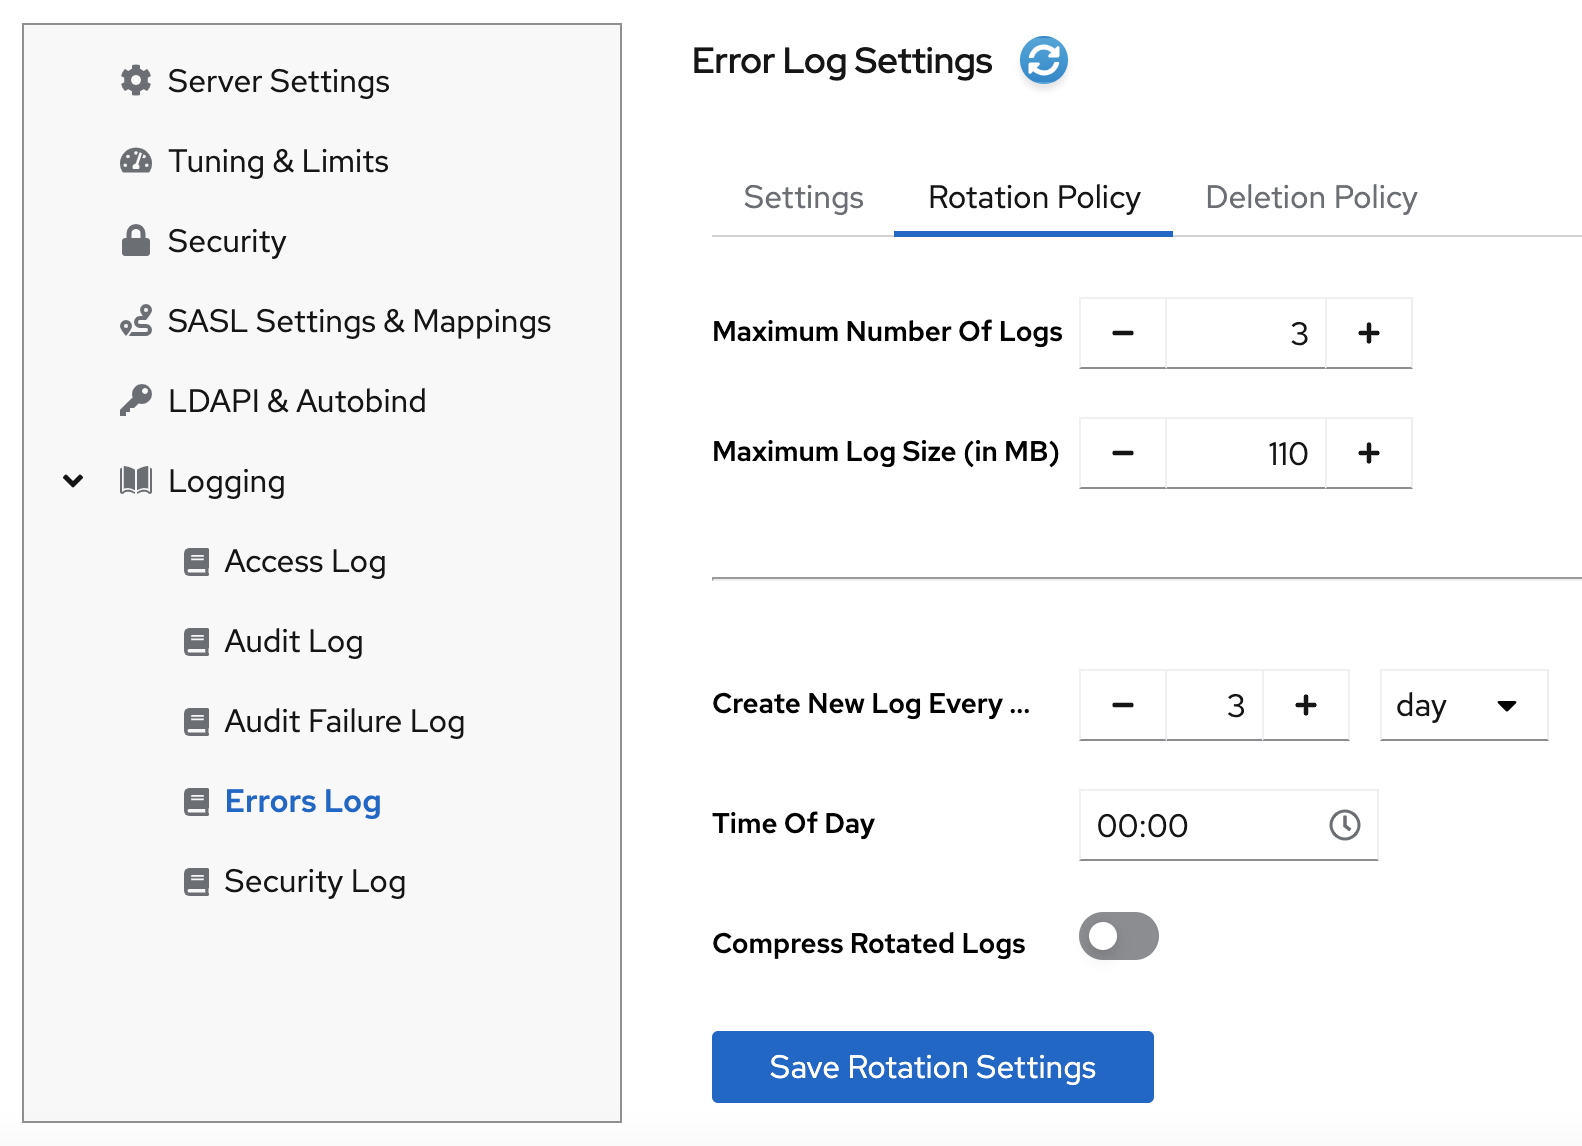
- Click the button to apply changes.
Additional resources
3.5. Defining a log deletion policy
Directory Server automatically deletes old archived log files if you set a deletion policy.
You can only set a log file deletion policy if you have a log file rotation policy set. Directory Server applies the deletion policy at the time of log rotation.
You can set the following configuration attributes to manage the log file deletion policy:
- Log archive exceeds (in MB)
- If the size of a log file of one type exceeds the configured value, the oldest log file of this type is automatically deleted.
- Free disk space (in MB)
- When the free disk space reaches this value, the oldest archived log file is automatically deleted.
- Log file is older than
- When a log file is older than the configured time, it is automatically deleted.
3.5.1. Configuring a log deletion policy using the command line
You can use the dsconf config replace command to modify the following attributes that manage deletion policies:
| access log | error log | audit log | audit fail log | security log | |
|---|---|---|---|---|---|
| Log archive exceeds (in MB) | nsslapd-accesslog-logmaxdiskspace | nsslapd-errorlog-logmaxdiskspace | nsslapd-auditlog-logmaxdiskspace | nsslapd-auditfaillog-logmaxdiskspace | nsslapd-securitylog-logmaxdiskspace |
| Free disk space (in MB) | nsslapd-accesslog-logminfreediskspace | nsslapd-errorlog-logminfreediskspace | nsslapd-auditlog-logminfreediskspace | nsslapd-auditfaillog-logminfreediskspace | nsslapd-securitylog-logminfreediskspace |
| Log file is older than | nsslapd-accesslog-logexpirationtime, nsslapd-accesslog-logexpirationtimeunit | nsslapd-errorlog-logminfreediskspace, nsslapd-errorlog-logexpirationtimeunit | nsslapd-auditlog-logminfreediskspace, nsslapd-auditlog-logexpirationtimeunit | nsslapd-auditfaillog-logminfreediskspace, nsslapd-auditfaillog-logexpirationtimeunit | nsslapd-securitylog-logminfreediskspace, nsslapd-securitylog-logexpirationtimeunit |
Procedure
For example, to auto-delete the oldest access log file if the total size of all access log files exceeds 500 MB, enter:
dsconf -D "cn=Directory Manager" ldap://server.example.com config replace nsslapd-accesslog-logmaxdiskspace=500
Additional resources
- For more details on deletion policy attributes, see the corresponding sections in the Configuration and schema reference guide.
3.5.2. Configuring a log deletion policy using the web console
You can set a log deletion policy using the web console.
Prerequisites
- You are logged in to the web console.
Procedure
- Select the instance.
-
Navigate to → and select the log type, for example,
Access Log. The Access Log Settings page opens. - Click the Deletion Policy tab.
Configure deletion policy parameters. For example, set maximum archive size to 600 MB and the log file age to 3 weeks.

- Click the button to apply changes.
Additional resources
3.6. Manual log file rotation
You can rotate log files manually only if you did not configure an automatic log file rotation or deletion policies.
Procedure
Stop the instance:
# dsctl instance_name stop-
Go to the log files directory. By default, Directory Server stores access, error, audit, audit fail log, and security files in the
/var/log/dirsrv/slapd-instance/directory. - Move or rename the log file you want to rotate to make it available for future reference.
Start the instance:
# dsctl instance_name restart
Additional resources
3.7. Configuring log levels
To manage how detailed logs are, and therefore the amount of information that is logged, you can specify log levels for access logging and error logging.
Changing the default log level can lead to very large log files. Red Hat recommends that you do not change the default logging values without being asked to do so by Red Hat technical support.
3.7.1. Configuring log levels using the command line
You can adjust log levels by setting the following configuration attributes:
-
nsslapd-accesslog-levelfor the access log -
nsslapd-errorlog-levelfor the error log
Use the dsconf config replace command to modify the log level attributes. The attribute values are additive: for example, if you set a log level value of 12, it includes levels 8 and 4.
Prerequisites
- You enabled access and error logging.
Procedure
For example, to enable Logging internal access operations (4) and Logging for connections, operations, and results (256) for the access log, set the
nsslapd-accesslog-levelattribute to 260 (4 + 256) with the following command:# dsconf -D "cn=Directory Manager" ldap://server.example.com config replace nsslapd-accesslog-level=260
-
For example, to enable Search filter logging (32) and Config file processing (64) log levels for the error log, set the
nsslapd-errorlog-levelattribute to 96 (32 + 64) with the following command:
# dsconf -D "cn=Directory Manager" ldap://server.example.com config replace nsslapd-errorlog-level=96Verification
When you set the access log level to Logging internal access operations (4), do the following to see if Directory Server started to log internal access events:
Restart the instance to trigger internal events by command:
# dsctl instance_name restart
Instance "instance_name" has been restarted
View the access log file and find internal operation records:
# cat /var/log/dirsrv/slapd-instance_name/access
...
[08/Nov/2022:16:29:05.556977401 -0500] conn=2 (Internal) op=1(1)(1) SRCH base="cn=config,cn=WritersData,cn=ldbm database,cn=plugins,cn=config" scope=1 filter="objectclass=vlvsearch" attrs=ALL
[08/Nov/2022:16:29:05.557250374 -0500] conn=2 (Internal) op=1(1)(1) RESULT err=0 tag=48 nentries=0 wtime=0.000016828 optime=0.000274854 etime=0.000288952
...
Additional resources
3.7.2. Configuring log levels using the web console
Prerequisites
- You are logged in to the web console.
- You enabled access and error logging.
Procedure
- Select the instance.
- Navigate to → .
-
Select the log type, for example,
Access Log. Click the button to see all available log levels for the log type.
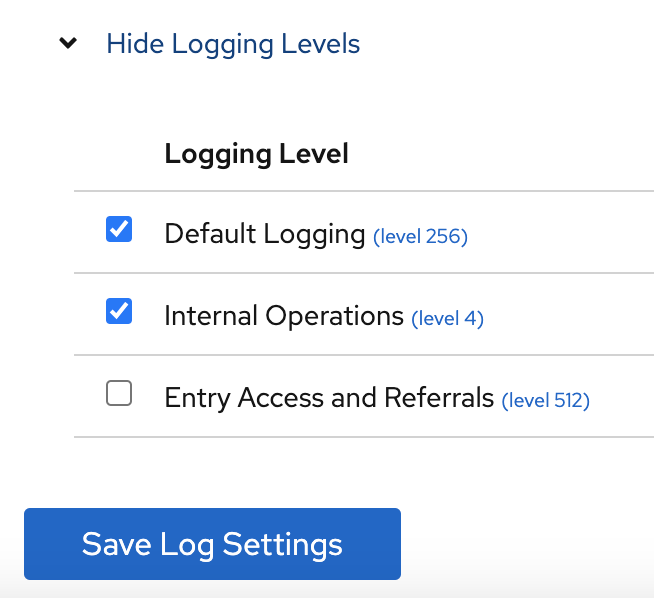
-
Select log levels, for example,
Default LoggingandInternal Operationslevels. - Click the button to apply changes.
Verification
To see if Directory Server started to log internal access events, do the following:
- Restart the instance by clicking button and then selecting . Directory Server restarts the instance and generates internal events.
- Navigate to → → .
Refresh access log and view recorded internal events:
[08/Nov/2022:17:04:17.035502206 -0500] conn=6 (Internal) op=1(2)(1) SRCH base="cn=config,cn=Example database,cn=ldbm database,cn=plugins,cn=config" scope=1 filter="objectclass=vlvsearch" attrs=ALL
[08/Nov/2022:17:04:17.035579829 -0500] conn=6 (Internal) op=1(2)(1) RESULT err=0 tag=48 nentries=0 wtime=0.000004563 optime=0.000078000 etime=0.000081911
Additional resources
3.8. Configuring logging for plug-ins
By default, Directory Server does not log internal events which plug-ins initiate. To debug plug-in operations, you can enable access and audit logging for all plug-ins, or for specific plug-ins.
3.8.1. Configuring logging for all plug-ins
Use nsslapd-plugin-logging attribute to configure logging for all plug-ins.
Procedure
To enable access and audit logging for all plug-ins, use the following command:
# dsconf -D "cn=Directory Manager" ldap://server.example.com config replace nsslapd-plugin-logging=on
Additional resources
For more details on the nsslapd-plugin-logging attribute, see the description sections:
3.8.2. Configuring logging for a specific plugin
Use nsslapd-logAccess and nsslapd-logAudit attributes to configure logging for a plug-in.
Prerequisites
-
The
nsslapd-accesslogattribute contains valid path and the filename for the access log file. -
The
nsslapd-auditlogattribute contains valid path and the filename for the audit log file.
Procedure
To enable access and audit logging for a specific plug-in, modify
nsslapd-logAccessandnsslapd-logAuditattributes using the LDAP interface:# ldapmodify -D "cn=Directory Manager" -W -x -H ldap://server.example.com:389 dn: cn=MemberOf Plugin,cn=plugins,cn=config changetype: modify replace: nsslapd-logAccess nsslapd-logAccess: on dn: cn=MemberOf Plugin,cn=plugins,cn=config changetype: modify replace: nsslapd-logAudit nsslapd-logAudit: on
Additional resources
For more details on the attributes, see the description sections:
3.9. Logging statistics per search operation
During some search operations, especially with filters such as (cn=user*), the time the server spends for receiving the tasks and then sending the result back (etime) can be very long.
Expanding the access log with information related to indexes used during search operation helps to diagnose why etime value is resource expensive.
Use the nsslapd-statlog-level attribute to enable collecting statistics, such as a number of index lookups (database read operations) and overall duration of index lookups for each search operation, with minimal impact on the server.
Prerequisites
- You enabled access logging.
Procedure
Enable search operation metrics:
# dsconf -D "cn=Directory Manager" ldap://server.example.com config replace nsslapd-statlog-level=1Restart the instance:
# dsctl instance_name restart
Verification
Perform a search operation:
# ldapsearch -D "cn=Directory Manager" -H ldap://server.example.com -b "dc=example,dc=com" -s sub -x "cn=user*"View the access log file and find the search statistics records:
# cat /var/log/dirsrv/slapd-instance_name/access
...
[16/Nov/2022:11:34:11.834135997 +0100] conn=1 op=73 SRCH base="dc=example,dc=com" scope=2 filter="(cn=user)"* attrs=ALL
[16/Nov/2022:11:34:11.835750508 +0100] conn=1 op=73 STAT read index: attribute=objectclass key(eq)=referral --> count 0
[16/Nov/2022:11:34:11.836648697 +0100] conn=1 op=73 STAT read index: attribute=cn key(sub)=er_ --> count 25
[16/Nov/2022:11:34:11.837538489 +0100] conn=1 op=73 STAT read index: attribute=cn key(sub)=ser --> count 25
[16/Nov/2022:11:34:11.838814948 +0100] conn=1 op=73 STAT read index: attribute=cn key(sub)=use --> count 25
[16/Nov/2022:11:34:11.841241531 +0100] conn=1 op=73 STAT read index: attribute=cn key(sub)=^us --> count 25
[16/Nov/2022:11:34:11.842230318 +0100] conn=1 op=73 STAT read index: duration 0.000010276
[16/Nov/2022:11:34:11.843185322 +0100] conn=1 op=73 RESULT err=0 tag=101 nentries=24 wtime=0.000078414 optime=0.001614101 etime=0.001690742
...
Additional resources
- TBA the link to nsslapd-statlog-level description
3.10. Compressing log files
To save disc space, you can enable log file compression that compresses archived logs into .gzip files.
Use the dsconf config replace command to modify the following attributes that manage log file compression:
-
nsslapd-accesslog-compress(access log) -
nsslapd-errorlog-compress(error log) -
nsslapd-auditlog-compress(audit log) -
nsslapd-auditfaillog-compress(audit fail log) -
nsslapd-securitylog-compress(security log)
By default, Directory Server compresses only archived security log files.
Procedure
To enable log file compression, run:
# dsconf -D "cn=Directory Manager" ldap://server.example.com config replace nsslapd-accesslog-compress=on nsslapd-errorlog-compress=onThe command enables compression for access and error logs.
To disable log file compression, run:
# dsconf -D "cn=Directory Manager" ldap://server.example.com config replace nsslapd-accesslog-compress=offThe command disables compression for the access log.
Verification
Check that the log file directory contains compressed logs files:
# ls /var/log/dirsrv/slapd-instance_name/
Additional resources
3.11. Disabling access log buffering for debugging purposes
For debugging purposes, you can disable access log buffering, which is enabled by default. With access log buffering disabled, Directory Server writes log entries directly to the disk.
Do not disable access logging in a normal operating environment. When you disable the buffering, Directory Server performance decreases, especially under heavy load.
3.11.1. Disabling access log buffering using the command line
If you disable access log buffering, Directory Server writes log entries directly to disk.
Procedure
To disable access log buffering, enter:
# dsconf -D "cn=Directory Manager" ldap://server.example.com config replace nsslapd-accesslog-logbuffering=off
Verification
Display the access log in continuous mode:
# tail -f /var/log/dirsrv/slapd-instance_name/access- Perform actions in the directory, such as searches.
- Monitor the access log. Log entries appear without delay at the moment when users perform actions in the directory.
3.11.2. Disabling access log buffering using the web console
If you disable access log buffering, Directory Server writes log entries directly to disk.
Procedure
- Navigate to → → → .
-
Deselect
Access Log Buffering Enabled. - Click .
Verification
- Navigate to → → .
-
Select
Continuously Refresh. - Perform actions in the directory, such as searches.
- Monitor the access log. Log entries appear without delay at the moment when users perform actions in the directory.
3.12. Disabling high-resolution log time stamps
By default, Directory Server logs entries with nanosecond precision:
[29/Jun/2022:09:10:04.300970708 -0400] conn=81 op=13 SRCH base="cn=dc\3Dexample\2Cdc\3Dcom,cn=mapping tree,cn=config" scope=0 filter="(objectClass=*)" attrs="cn"
[29/Jun/2022:09:10:04.301010337 -0400] conn=81 op=13 RESULT err=0 tag=101 nentries=1 wtime=0.000038066 optime=0.000040347 etime=0.000077742
Use the dsconf config replace command to modify the attribute that is responsible for the log time stamps.
Red Hat has deprecated the option to disable high-resolution log time stamps, and will remove it in future releases.
Procedure
- To disable high-resolution log time stamps in the command line, enter the following command:
# dsconf -D "cn=Directory Manager" ldap://server.example.com config replace nsslapd-logging-hr-timestamps-enabled=offVerification
- Verify that new log records have second precision. For example, open the access log file with the command:
# less /var/log/dirsrv/slapd-instance_name/access
Chapter 4. Monitoring the replication topology using the command line
To monitor the state of the directory data replication between suppliers, consumers, and hubs, you can use replication topology report that provides information on the replication progress, replica IDs, number of changes, and other parameters. To generate the report faster and make it more readable, you can configure your own credentials and aliases.
4.1. Displaying a replication topology report using the command line
To view overall information about the replication status for each agreement in your replication topology, you can display the replication topology report. To do so, use the dsconf replication monitor command.
Prerequisites
- The host is a member of replication topology.
- You initialized the consumers.
Procedure
To view a replication topology report, enter:
#
dsconf -D "cn=Directory Manager" ldap://supplier.example.com replication monitorThe
dsconfutility will request authentication credentials for each instance in the topology:Enter password for cn=Directory Manager on ldap://supplier.example.com:
passwordEnter a bind DN for consumer.example.com:389:cn=Directory ManagerEnter a password for cn=Directory Manager on consumer.example.com:389:passwordSupplier: server.example.com:389 -------------------------------- Replica Root: dc=example,dc=com Replica ID: 1 Replica Status: Online Max CSN: 5e3acb77001d00010000 Status For Agreement: "example-agreement" (consumer.example.com:1389) Replica Enabled: on Update In Progress: FALSE Last Update Start: 20211209122116Z Last Update End: 20211209122116Z Number Of Changes Sent: 1:21/0 Number Of Changes Skipped: None Last Update Status: Error (0) Replica acquired successfully: Incremental update succeeded Last Init Start: 20211209122111Z Last Init End: 20211209122114Z Last Init Status: Error (0) Total update succeeded Reap Active: 0 Replication Status: In Synchronization Replication Lag Time: 00:00:00 Supplier: consumer.example.com:1389 ----------------------------------- Replica Root: dc=example,dc=com Replica ID: 65535 Replica Status: Online Max CSN: 00000000000000000000
4.2. Setting credentials for replication monitoring in the .dsrc file
By default, the dsconf replication monitor command asks for bind DNs and passwords when authenticating to remote instances. To generate the report faster and easier in the future, you can set the bind DNs, and optionally passwords, for each server in the topology in the user’s ~/.dsrc file.
Prerequisites
- The host is a member of replication topology.
- You initialized the consumers.
Procedure
-
Optional: Create the
~/.dsrcfile. In the
~/.dsrcfile, set the bind DNs, and passwords. For example:[repl-monitor-connections] connection1 = server1.example.com:389:cn=Directory Manager:* connection2 = server2.example.com:389:cn=Directory Manager:[~/pwd.txt] connection3 = hub1.example.com:389:cn=Directory Manager:S3cret
This example uses connection1 to connection3 as keys for each entry. However, you can use any unique key.
When you run the
dsconf replication monitorcommand, thedsconfutility connects to all servers configured in replication agreements of the instance. If the utility finds the hostname in~/.dsrc, it uses the defined credentials to authenticate to the remote server. In the example above,dsconfuses the following credentials when connecting to a server:Hostname Bind DN Password setup method server1.example.com
cn=Directory Manager
Requests the password
server2.example.com
cn=Directory Manager
Reads the password from
~/pwd.txthub1.example.com
cn=Directory Manager
S3cret
Verification
-
Run the
dsconf replication monitorcommand to see Ifdsconfutility uses credentials configured in the~/.dsrcfile. For more information, see
Displaying a replication topology report using the command line.
Additional resources
4.3. Using aliases in the replication topology monitoring output
To make the report more readable, you can set your own aliases that will be displayed in the report output. By default, the replication monitoring report contains the hostnames of remote servers.
Prerequisites
- The host is a member of replication topology.
- You initialized the consumers.
Procedure
If you want to see aliases in the report, use one of the following methods:
Define the aliases in the
~/.dsrcfile:[repl-monitor-aliases] M1 = server1.example.com:389 M2 = server2.example.com:389
Define the aliases by passing the
-a alias=host_name:portparameter to thedsconf replication monitorcommand:#
dsconf -D "cn=Directory Manager" ldap://server.example.com replication monitor -a M1=server1.example.com:389 M2=server2.example.com:389
In both cases, the dsconf replication monitor command displays the alias in the output:
...
Supplier: M1 (server1.example.com:389)
--------------------------------
Replica Root: dc=example,dc=com

...
Supplier: M2 (server2.example.com:389)
--------------------------------
Replica Root: dc=example,dc=com
Additional resources
Chapter 5. Monitoring the replication topology using the web console
To monitor the state of the directory data replication between suppliers, consumers, and hubs, you can use replication topology report that provides information on the replication progress, replica IDs, number of changes, and other parameters. To generate the report faster and make it more readable, you can configure your own credentials and aliases.
5.1. Displaying a replication topology report using the web console
To view overall information about the replication status for each agreement in your replication topology, you can display the replication topology report.
Prerequisites
- The host is a member of replication topology.
- You initialized the consumers.
- You are logged in to the web console.
Procedure
- Navigate to → . The page opens.
- Click .
Enter the passwords for login to remote instances and click . Directory Server uses bind DNs values from existing replication agreements.
The replication topology report will be generated on the tab.
NoteTo generate another replication topology report, go to the tab.
5.2. Setting credentials for replication monitoring using the web console
To generate the replication topology report faster and easier, you can set your own bind DNs, and optionally passwords, for each server in the topology for authentication. In this case, you do not need to confirm replication credentials each time you want to generate a replication topology report. By default, Directory Server takes these credentials from existing replication agreements.
Prerequisites
- The host is a member of replication topology.
- You initialized the consumer.
- You are logged in to the web console.
Procedure
- Navigate to → . The page opens.
- Click .
Enter replication login credentials you want to use for authentication to remote instances:
-
Hostname. A remote instance hostname you want the server to authenticate to. -
Port. A remote instance port. -
Bind DN. Bind DN used for authentication to the remote instance. -
Password. A password used for authentication. -
Interactive Input. If checked, Directory Server will ask for a password every time you generate a replication topology report.
-
- Click .
Verification
Generate the replication topology report to see If the report asks for the credentials. For more information, see
Displaying a replication topology report using the web console.
5.3. Configuring replication naming aliases using the web console
To make the report more readable, you can set your own aliases that will be displayed in the report output. By default, the replication monitoring report contains the hostnames of servers.
Prerequisites
- The host is a member of replication topology.
- You initialized the consumers.
- You are logged in to the web console.
Procedure
- Navigate to → . The page opens.
- Click .
Enter alias details:
-
Alias. An alias that will be displayed in the replication topology report. -
Hostname. An instance hostname. -
Port. An instance port.
-
- Click .
Verification
- Generate the replication topology report to see If the report uses new aliases. For more information, see
Displaying a replication topology report using the web console.
Chapter 6. Tracking the bind DN for plug-in-initiated updates
In Directory Server, you can track which user performed an action that caused a plug-in to update an entry. If the tracking is enabled and a plug-in changes an entry as a consequence of an action performed by a user, you can see the user’s name in the modifiersname attribute of updated entry.
6.1. Tracking user information for entry modifications performed by a plug-in
When the user performs an action that changes an entry, it can trigger other, automatic changes across the directory tree. By default, Directory Server is not tracking the name of the user who performed the action that has initiated the data modification. To track the user information, you can use the nsslapd-plugin-binddn-tracking parameter.
For example, when the administrator deletes a user, the Referential Integrity Postoperation plug-in automatically removes the user from all groups. You can see the initial action in the entry as being performed by the user account bound to the server. But all related updates are, by default, shown as being performed by the plug-in, with no information about which user initiated the update.
A second example might be using the MemberOf plug-in to update user entries with group membership. The update to the group account is shown as being performed by the bound user, while the edit to the user entry is shown as being performed by the MemberOf plug-in:
dn: cn=example_group,ou=groups,dc=example,dc=com
modifiersname: uid=example,ou=people,dc=example,dc=com

dn: uid=example,ou=people,dc=example,dc=com
modifiersname: cn=MemberOf Plugin,cn=plugins,cn=config
The nsslapd-plugin-binddn-tracking parameter enables the server to track which user originated an update operation, as well as the internal plug-in which actually performed the operation. The bound user is shown in the modifiersname and creatorsname operational attributes, while the plug-in which performed the update is shown in the internalModifiersname and internalCreatorsname operational attributes. For example:
dn: uid=example,ou=people,dc=example,dc=com
modifiersname: uid=admin,ou=people,dc=example,dc=com
internalModifiersname: cn=MemberOf Plugin,cn=plugins,cn=config
The nsslapd-plugin-binddn-tracking parameter tracks and maintains the relationship between the bound user and all updates performed for that connection.
The internalModifiersname and internalCreatorsname attributes always show a plug-in as the identity. The value of the attribute is:
-
cn=ldbm database,cn=plugins,cn=configwhen the core Directory Server performs the change -
cn=the DN of the plug-in,cn=plugins,cn=configwhen a plug-in changed the entry
6.2. Enabling tracking the bind DN for plug-in-initiated updates using the command line
For data updates initiated by a plug-in, you often need to know which user has performed the action that led to the update. In the command line, set up the nsslapd-plugin-binddn-tracking parameter to track such user information.
Procedure
Set the
nsslapd-plugin-binddn-trackingparameter toon:# dsconf -D "cn=Directory Manager" ldap://server.example.com config replace nsslapd-plugin-binddn-tracking=on
Verification
-
Display the
modifiersnameandinternalModifiersnameattributes of an entry that was changed by a plug-in. For example, if thememberOfattribute is enabled, display the attributes of a user after you added the user to a group:
# ldapsearch -D "cn=Directory Manager" -W -H ldap://server.example.com -x -b "uid=example-user,ou=People,dc=example,dc=com" -s base -x internalModifiersname -x modifiersname
dn: uid=example-user,ou=people,dc=example,dc=com
modifiersname: uid=admin,ou=people,dc=example,dc=com
internalModifiersname: cn=MemberOf Plugin,cn=plugins,cn=config
Additional resources
6.3. Enabling tracking the bind DN for plug-in-initiated updates using the web console
For data updates initiated by a plug-in, you often need to know which user has performed the action that led to the update. Using the web console, you can enable tracking of the user information.
Prerequisites
- You are logged in to the Directory Server instance in the web console.
Procedure
- Open the → menu.
-
On the
Advanced Settingstab, selectEnable Plugin Bind DN Tracking. - Click .
Verification
-
Display the
modifiersnameandinternalModifiersnameattributes of an entry that was changed by a plug-in. For example, if thememberOfattribute is enabled, display the attributes of a user after you added the user to a group:
# ldapsearch -D "cn=Directory Manager" -W -H ldap://server.example.com -x -b "uid=example-user,ou=People,dc=example,dc=com" -s base -x internalModifiersname -x modifiersname
dn: uid=example-user,ou=people,dc=example,dc=com
modifiersname: uid=admin,ou=people,dc=example,dc=com
internalModifiersname: cn=MemberOf Plugin,cn=plugins,cn=config
Additional resources
Chapter 7. Monitoring the database activity
Administrators should monitor the database activity to ensure that tuning settings, such as caches, are properly configured.
7.1. Monitoring the database activity using the command line
To display the monitoring activity using the command line, display the dynamically-updated read-only attributes stored in the cn=monitor,cn=database_name,cn=ldbm database,cn=plugins,cn=config.
Procedure
To display the current activity of a database, enter:
# dsconf -D "cn=Directory Manager" ldap://server.example.com monitor backend userRootThis command displays the activity of the
userRootdatabase.
Additional resources
7.2. Monitoring the database activity using the web console
In the web console, Directory Server displays the values of the dynamically-updated read-only monitoring attributes from the cn=monitor,cn=database_name,cn=ldbm database,cn=plugins,cn=config in the `Monitoring´ tab.
Procedure
- Navigate to → → .
-
Display the cache values on the
Entry CacheandDN Cachetabs.
Additional resources
7.3. Database monitoring attributes
Table 7.1. Inheritance settings
| Attribute | Description |
|---|---|
|
|
Indicates whether the database is in read-only mode ( |
|
| The total number of successful entry cache lookups. The value is the total number of times the server could retrieve an entry from the entry cache without reloading it from the database. |
|
| The total number of entry cache lookups since you started the instance. The value is the total number, since the instance has been started, Directory Server tried to retrieve entry from the entry cache. |
|
| The number of entry cache tries to successful entry cache lookups. This number is based on the total lookups and hits since you last started the instance. The closer the entry cache hit ratio is to 100%, the better. Whenever an operation attempts to find an entry that is not present in the entry cache, the server needs to access the database to obtain the entry. Thus, as this ratio drops towards zero, the number of disk accesses increases, and directory search performance decreases. To improve this ratio, increase the size of the entry cache of the database.
To improve this ratio, increase the size of the entry cache by increasing the value of the |
|
| The total size, in bytes, of directory entries currently present in the entry cache.
To increase the size of the entries which can be present in the cache, increase the value of the |
|
| The maximum size, in bytes, of directory entries that Directory Server can maintain in the entry cache.
To increase the size of the entries which can be present in the cache, increase the value of the |
|
| The current number of entries stored in the entry cache of a given backend. |
|
| The maximum number of entries stored in the entry cache of a database.
To tune this value, increase the value of the |
|
| The number of times the server could process a request by obtaining a normalized distinguished name (DN) from the DN cache rather than normalizing it again. |
|
| The total number of DN cache accesses since you started the instance. |
|
| The ratio of cache tries to successful DN cache hits. The closer this value is to 100%, the better. |
|
| The total size, in bytes, of DN currently present in the DN cache.
To increase the size of the entries which can be present in the DN cache, increase the value of the |
|
| The maximum size, in bytes, of DNs that Directory Server can maintain in the DN cache.
To increase the size of the entries which can be present in the cache, increase the value of the |
|
| The number of DNs currently present in the DN cache. |
|
| The maximum number of DNs allowed in the DN cache. |
Chapter 8. Getting Directory Server access log using the command line
The logconv.pl command analyzes Directory Server access logs, extracts usage statistics, and counts occurrences of significant events specified on the command line. The logconv.pl command prints a list of total operations, total number of connections, counts per each operation type, counts for some extended operations like persistent searches, and bind information.
The logconv.pl command has the following syntax:
logconv.pl/path/to/accesslog
To analyze multiple access log files, you can use the following format with an asterisk (*):
logconv.pl /var/log/dirsrv/slapd-instance_name/access*
The logconv.pl command generates following three types of statistics that are useful for monitoring the Directory Server and optimizing Directory Server configuration:
- Counts of events, such as total binds and total searches performed.
-
Lists of the most frequently occurring parameters in LDAP requests. For example, the
logconv.plcommand generates lists of the top ten bind DNs, base DNs, filter strings, and attributes returned. -
Counts of occurrences for error codes such as those defined in
ldap.h.
8.1. Analyzing Directory Server access logs using the command line
The logconv.pl command analyzes Directory Server access logs and extracts usage statistics and counts occurrences of significant events.
The logconv.pl takes following options:
-
-S: specifies the time to begin the log file analysis. -
-E: specifies the time to stop the log files analysis. -
-bc: generates a report based on the number of DNs used to connect to the server and the total connection codes the server returns. -
-m: generates output data per second (-m) to a specified CSV output file. -
-M: generates output data with counts per minute (-M) to a specified CSV output file.
Procedure
To generate a simple access log summary, run the following command:
# logconv.pl /var/log/dirsrv/slapd-instance_name/access

Access Log Analyzer 8.2
Command: logconv.pl /var/log/dirsrv/slapd-instance_name/access
Processing 1 Access Log(s)...

[001] /var/log/dirsrv/slapd-instance_name/access size(bytes):77532

Total Log Lines Analysed:  527
Start of Logs:    14/Oct/2017:16:15:22.452909568
End of Logs:      14/Oct/2017:16:39:50.157790196

Processed Log Time:  0 Hours, 24 Minutes, 27.704877056 Seconds

Restarts:                     10
Secure Protocol Versions:
 - TLS1.2 client bound as uid=user_name,ou=people,o=example.com (11 connections)
 - TLS1.2 128-bit AES; client CN=CA Subsystem,O=example.com; issuer CN=Certificate Authority,O=example.com (11 connections)
 - TLS1.2 128-bit AES-GCM (2 connections)
 - TLS1.2 128-bit AES (3 connections)

Peak Concurrent Connections:  38
Total Operations:             4771
Total Results:                4653
Overall Performance:          97.5%

Total Connections:            249          (0.17/sec)  (10.18/min)
 - LDAP Connections:          107          (0.07/sec)  (4.37/min)
 - LDAPI Connections:         128          (0.09/sec)  (5.23/min)
 - LDAPS Connections:         14           (0.01/sec)  (0.57/min)
 - StartTLS Extended Ops:     2            (0.00/sec)  (0.08/min)

Searches:                     2963         (2.02/sec)  (121.13/min)
Modifications:                649          (0.44/sec)  (26.53/min)
Adds:                         785          (0.53/sec)  (32.09/min)
Deletes:                      10           (0.01/sec)  (0.41/min)
Mod RDNs:                     6            (0.00/sec)  (0.25/min)
Compares:                     0            (0.00/sec)  (0.00/min)
Binds:                        324          (0.22/sec)  (13.25/min)

Proxied Auth Operations:      0
Persistent Searches:          17
Internal Operations:          0
Entry Operations:             0
Extended Operations:          4
Abandoned Requests:           0
Smart Referrals Received:     0

VLV Operations:               30
VLV Unindexed Searches:       0
VLV Unindexed Components:     20
SORT Operations:              22

Entire Search Base Queries:   12
Paged Searches:               2
Unindexed Searches:           0
Unindexed Components:         149

FDs Taken:                    249
FDs Returned:                 212
Highest FD Taken:             107

Broken Pipes:                 0
Connections Reset By Peer:    0
Resource Unavailable:         0
Max BER Size Exceeded:        0

Binds:                        324
Unbinds:                      155
---------------------------------
 - LDAP v2 Binds:             41
 - LDAP v3 Binds:             180
 - AUTOBINDs(LDAPI):          103
 - SSL Client Binds:          0
 - Failed SSL Client Binds:   0
 - SASL Binds:                134
   - EXTERNAL: 114
   - GSSAPI: 20
 - Directory Manager Binds:   10
 - Anonymous Binds:           1

Cleaning up temp files...
Done.
The
logconv.plscript prints a list of total operations, total number of connections, counts per each operation type, counts for some extended operations like persistent searches, and bind information.Optional: If you must enable additional connection summaries passed as a single option, such as the number of DNs used to connect to the server (
b) and the total connection codes the server (c) returns, specify the-bcoption as follows:# lotgconv.pl -bc /var/log/dirsrv/slapd-instance_name/access ----- Total Connection Codes ----- U1 3 Cleanly Closed Connections B1 1 Bad Ber Tag Encountered ----- Top 20 Bind DN's ----- Number of Unique Bind DN's: 212 1801 cn=Directory Manager 1297 Anonymous Binds 311 uid=jsmith,ou=people... 87 uid=bjensen,ou=peopl... 85 uid=mreynolds,ou=peo... 69 uid=jrockford,ou=peo... 55 uid=sspencer,ou=peop...Optional: If you must enable data output for a certain start (
-S) and end time (-E) or within a specific range, run the following command# logconv.pl -S "[01/Jul/2022:16:11:47.000000000 -0400]" -E "[01/Jul/2022:17:23:08.999999999 -0400]" /var/log/dirsrv/slapd-instance_name/access ... ----------- Access Log Output ------------ Start of Logs: 01/Jul/2022:16:11:47 End of Logs: 01/Jul/2022:17:23:08When start and end times are set, the
logconv.plcommand first prints the time range given, then the summary for that period.Optional: If you must enable data output with counts per minute (
-M) or per second (-m), run the following command:# logconv.pl -m|-M outputFile accessLogFile