Chapter 7. Kernel crash dump guide
7.1. Introduction to kdump
7.1.1. About kdump and kexec
kdump is a service which provides a crash dumping mechanism. The service enables you to save the contents of the system memory for analysis.
kdump uses the kexec system call to boot into the second kernel (a capture kernel) without rebooting; and then captures the contents of the crashed kernel’s memory (a crash dump or a vmcore) and saves it into a file. The second kernel resides in a reserved part of the system memory.
A kernel crash dump can be the only information available in the event of a failure, the importance of having this data in a business critical environment cannot be underestimated. Red Hat advises that System Administrators regularly update and test kexec-tools in your normal kernel update cycle. This is especially important when new kernel features are implemented.
HP Watchdog timer (hpwdt) driver is pre-loaded in HP systems running as a RHEV hypervisor, so these systems can consume the NMI watchdog. Updated kexec-tools packages starting with kexec-tools-2.0.15-33.el7.x86_64 have preloaded the hpwdt driver.
If drivers bnx2x and bmx2fc are not blacklisted in the kdump kernel then the second kernel leads to panic and the dumps will not be captured.
7.1.2. Memory requirements
In order for kdump to be able to capture a kernel crash dump and save it for further analysis, a part of the system memory has to be permanently reserved for the capture kernel. When reserved, this part of the system memory is not available to main kernel.
The memory requirements vary based on certain system parameters. One of the major factors is the system’s hardware architecture. To find out the exact name of the machine architecture (such as x86_64) and print it to standard output, type the following command at a shell prompt:
uname -muname -m
Another factor which influences the amount of memory to be reserved is the total amount of installed system memory. For example, on the x86_64 architecture, the amount of reserved memory is 160 MB + 2 bits for every 4 KB of RAM. On a system with 1 TB of total physical memory installed, this means 224 MB (160 MB + 64 MB). For a complete list of memory requirements for kdump based on the system architecture and the amount of physical memory, see Section 7.8.1, “Memory requirements for kdump”.
On many systems, kdump can estimate the amount of required memory and reserve it automatically. This behavior is enabled by default, but only works on systems that have more than a certain amount of total available memory, which varies based on the system architecture. See Section 7.8.2, “Minimum threshold for automatic memory reservation” for a list of minimum requirements for automatic memory reservation based on the system architecture.
If the system has less than the minimum amount of memory required for the automatic allocation to work or if your use case requires a different value, you can configure the amount of reserved memory manually. For information on how to do so on the command line, see Section 7.2.2.1, “Configuring the memory usage”. For information on how to configure the amount of reserved memory in the graphical user interface, see Section 7.2.3.1, “Configuring the memory usage”.
It is highly recommended to test the configuration after setting up the kdump service, even when using the automatic memory reservation. For instructions on how to test your configuration, see Section 7.4, “Testing the kdump configuration”.
7.2.1. Installing kdump
In many cases, the kdump service is installed and activated by default on new Red Hat Enterprise Linux 7 installations. The Anaconda installer provides a screen for kdump configuration when performing an interactive installation using the graphical or text interface. The installer screen is titled Kdump and is available from the main Installation Summary screen, and only allows limited configuration - you can only select whether kdump is enabled and how much memory is reserved. Information about memory requirements for kdump is available in Section 7.8.1, “Memory requirements for kdump”. The Kdump configuration screen in the installer is documented in the Red Hat Enterprise Linux 7 Installation Guide.
In previous releases of Red Hat Enterprise Linux, kdump configuration was available in the Firstboot utility which was automatically executed after the installation finished and the system rebooted for the first time. Starting with Red Hat Enterprise Linux 7.1, kdump configuration has been moved into the installer.
Some installation options, such as custom Kickstart installations, do not have to install or enable kdump by default. If this is the case on your system, and you want to install kdump additionally, execute the following command as root at a shell prompt:
# yum install kexec-toolsyum install kexec-tools
The command above secures installation of kdump and all other necessary packages, assuming your system has an active subscription or a custom repository containing the kexec-tools package for your system’s architecture.
If you do not know whether kdump is installed on your system, you can check using rpm:
$rpm -q kexec-tools
rpm -q kexec-tools
Additionally, a graphical configuration tool is available, but not installed by default if you use the command described above. To install this utility, which is described in Section 7.2.3, “Configuring kdump in the graphical user interface”, use the following command as root:
# yum install system-config-kdumpyum install system-config-kdump
For more information on how to install new packages in Red Hat Enterprise Linux 7 using the Yum package manager, see the Red Hat Enterprise Linux 7 System Administrator’s Guide.
Starting with Red Hat Enterprise Linux 7.4 the Intel IOMMU driver is supported with kdump. When running kernels from version 7.3 or earlier, it is advised that Intel IOMMU support is disabled.
Memory reserved for the kdump kernel is always reserved during system boot, which means that the amount of memory is specified in the system’s boot loader configuration.
To specify the memory reserved for kdump kernel, set the crashkernel= option to the required value. For example, to reserve 128 MB of memory, use the following:
crashkernel=128M
crashkernel=128M
For information about how to change the crashkernel= option on AMD64 and Intel 64 systems and IBM Power Systems servers using the GRUB2 boot loader, and on IBM Z using zipl, see Section 3.1.1, “Setting kernel command-line parameters”.
The crashkernel= option can be defined in multiple ways. The auto value enables automatic configuration of reserved memory based on the total amount of memory in the system, following the guidelines described in Section 7.8.1, “Memory requirements for kdump”. Larger memory systems, up to the established limits of the operating system are calculated according to architecture with the crashkernel=auto option.
Replace the auto value with a specific amount of memory to change this behavior.
The crashkernel= option can be particularly useful with smaller memory systems. For example, to reserve 128 MB of memory, use the following:
crashkernel=128M
crashkernel=128M
You can also set the amount of reserved memory to be variable, depending on the total amount of installed memory. The syntax for variable memory reservation is crashkernel=<range1>:<size1>,<range2>:<size2>. For example:
crashkernel=512M-2G:64M,2G-:128M
crashkernel=512M-2G:64M,2G-:128M
The above example reserves 64 MB of memory if the total amount of system memory is 512 MB or higher and lower than 2 GB. If the total amount of memory is more than 2 GB, 128 MB is reserved for kdump instead.
Some systems require to reserve memory with a certain fixed offset. If the offset is set, the reserved memory begins there. To offset the reserved memory, use the following syntax:
crashkernel=128M@16M
crashkernel=128M@16M
The example above means that kdump reserves 128 MB of memory starting at 16 MB (physical address 0x01000000). If the offset parameter is set to 0 or omitted entirely, kdump offsets the reserved memory automatically. This syntax can also be used when setting a variable memory reservation as described above; in this case, the offset is always specified last (for example, crashkernel=512M-2G:64M,2G-:128M@16M).
When a kernel crash is captured, the core dump can be either stored as a file in a local file system, written directly to a device, or sent over a network using the NFS (Network File System) or SSH (Secure Shell) protocol. Only one of these options can be set at the moment. The default option is to store the vmcore file in the /var/crash directory of the local file system.
To store the
vmcorefile in/var/crash/directory of the local file system, edit the/etc/kdump.conffile and specify the path:path /var/crash
path /var/crash
CopyCopied! The option
path /var/crashrepresents the file system path in which thekdumpsaves thevmcorefile.Note-
When you specify a dump target in the
/etc/kdump.conffile, then the path is relative to the specified dump target. -
When you do not specify a dump target in the
/etc/kdump.conffile, then the path represents the absolute path from the root directory.
Depending on what is mounted in the current system, the dump target and the adjusted dump path are taken automatically.
Example 7.1. The
kdumptarget configurationgrep -v ^# etc/kdump.conf | grep -v ^$ ext4 /dev/mapper/vg00-varcrashvol path /var/crash core_collector makedumpfile -c --message-level 1 -d 31
grep -v ^# etc/kdump.conf | grep -v ^$
ext4 /dev/mapper/vg00-varcrashvol
path /var/crash
core_collector makedumpfile -c --message-level 1 -d 31
CopyCopied! Here, the dump target is specified (
ext4 /dev/mapper/vg00-varcrashvol), and thus mounted at/var/crash, thepathoption is also set to/var/crash, so thekdumpsaves thevmcorefile in the/var/crash/var/crashdirectory.-
When you specify a dump target in the
To change the dump location, as root, open the /etc/kdump.conf configuration file in a text editor and edit the options as described below.
To change the local directory in which the core dump is to be saved, remove the hash sign ("#") from the beginning of the #path /var/crash line, and replace the value with a desired directory path.
path /usr/local/cores
path /usr/local/cores
In Red Hat Enterprise Linux 7, the directory defined as the kdump target using the path directive must exist when the kdump systemd service is started - otherwise the service fails. This behavior is different from earlier releases of Red Hat Enterprise Linux, where the directory was being created automatically if it did not exist when starting the service.
Optionally, if you wish to write the file to a different partition, follow the same procedure with the one of the lines beginning with #ext4. Here, you can use either a device name (the #ext4 /dev/vg/lv_kdump line), a file system label (the #ext4 LABEL=/boot line) or a UUID (the #ext4 UUID=03138356-5e61-4ab3-b58e-27507ac41937 line). Change the file system type as well as the device name, label or UUID to the desired values.
- NOTE
-
The correct syntax for specifying UUID values is both
UUID="correct-uuid"`andUUID=correct-uuid.
For example:
ext4 UUID=03138356-5e61-4ab3-b58e-27507ac41937
ext4 UUID=03138356-5e61-4ab3-b58e-27507ac41937
Specifying storage devices using a LABEL= or UUID= is recommended. Disk device names such as /dev/sda3 are not guaranteed to be consistent across reboot. See the Red Hat Enterprise Linux 7 Storage Administration Guide for information about persistent disk device naming.
When dumping to DASD on s390x hardware, it is essential that the dump devices are correctly specified in /etc/dasd.conf before proceeding.
To write the dump directly to a device, remove the hash sign ("#") from the beginning of the #raw /dev/vg/lv_kdump line, and replace the value with a desired device name. For example:
raw /dev/sdb1
raw /dev/sdb1
To store the dump to a remote machine using the NFS protocol, remove the hash sign ("#") from the beginning of the #nfs my.server.com:/export/tmp line, and replace the value with a valid hostname and directory path. For example:
nfs penguin.example.com:/export/cores
nfs penguin.example.com:/export/cores
To store the dump to a remote machine using the SSH protocol, remove the hash sign ("#") from the beginning of the #ssh user@my.server.com line, and replace the value with a valid username and hostname. To include your SSH key in the configuration as well, remove the hash sign from the beginning of the #sshkey /root/.ssh/kdump_id_rsa line and change the value to the location of a key valid on the server you are trying to dump to. For example:
ssh john@penguin.example.com
sshkey /root/.ssh/mykey
ssh john@penguin.example.com
sshkey /root/.ssh/mykey
For information on how to configure an SSH server and set up a key-based authentication, see the Red Hat Enterprise Linux 7 System Administrator’s Guide.
For a complete list of currently supported and unsupported targets sorted by type, see Table 7.3, “Supported kdump Targets”.
To reduce the size of the vmcore dump file, kdump allows you to specify an external application (a core collector) to compress the data, and optionally leave out all irrelevant information. Currently, the only fully supported core collector is makedumpfile.
To enable the core collector, as root, open the /etc/kdump.conf configuration file in a text editor, remove the hash sign ("#") from the beginning of the #core_collector makedumpfile -l --message-level 1 -d 31 line, and edit the command line options as described below.
To enable the dump file compression, add the -l parameter. For example:
core_collector makedumpfile -l
core_collector makedumpfile -l
To remove certain pages from the dump, add the -d value parameter, where value is a sum of values of pages you want to omit as described in Table 7.4, “Supported Filtering Levels”. For example, to remove both zero and free pages, use the following:
core_collector makedumpfile -d 17 -c
core_collector makedumpfile -d 17 -c
See the makedumpfile(8) man page for a complete list of available options.
By default, kdump uses the kexec system call to boot into the second kernel (a capture kernel) without rebooting; and then captures the contents of the crashed kernel’s memory (a crash dump or a vmcore) and saves it into a file. After the successful save, kdump reboots the machine.
However, when kdump fails to create a core dump at the target location specified in Section 7.2.2.2, “Configuring the kdump target”, kdump reboots the system without saving the vmcore. To change this behavior, as root, open the /etc/kdump.conf configuration file in a text editor, remove the hash sign ("#") from the beginning of the #default shell line, and replace the value with a desired action as described in Table 7.5, “Supported Default Actions”.
For example:
default reboot
default reboot
7.2.2.5. Enabling the service
To start the kdump daemon at boot time, type the following at a shell prompt as root:
systemctlenablekdump.service
systemctl enable kdump.service
This enables the service for multi-user.target. Similarly, typing systemctl disable kdump disables kdump. To start the service in the current session, use the following command as root:
systemctlstartkdump.service
systemctl start kdump.service
In Red Hat Enterprise Linux 7, the directory defined as the kdump target must exist when the kdump systemd service is started - otherwise the service fails. This behavior is different from earlier releases of Red Hat Enterprise Linux, where the directory was being created automatically if it did not exist when starting the service.
For more information on systemd and configuring services in general, see the Red Hat Enterprise Linux 7 System Administrator’s Guide.
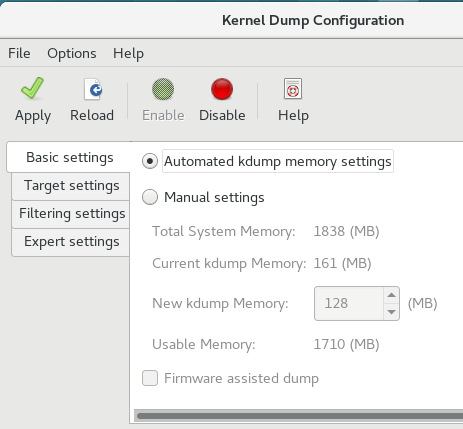
To start the Kernel Dump Configuration utility, select system-config-kdump at a shell prompt. As a result a window appears as shown in Figure 7.1, “Basic Settings”.
The utility allows you to configure kdump as well as to enable or disable starting the service at boot time. When you are done, click to save the changes. Unless you are already authenticated, enter the superuser password. The utility presents you with a reminder that you must reboot the system in order to apply any changes you have made to the configuration.
On IBM Z or PowerPC systems with SELinux running in Enforcing mode, the kdumpgui_run_bootloader Boolean must be enabled before launching the Kernel Dump Configuration utility. This Boolean allows system-config-kdump to run the boot loader in the bootloader_t SELinux domain. To permanently enable the Boolean, run the following command as root;
# setsebool -P kdumpgui_run_bootloader 1
setsebool -P kdumpgui_run_bootloader 1
When dumping to DASD on s390x hardware, it is essential that the dump devices are correctly specified in /etc/dasd.conf before proceeding.
The Basic Settings tab enables you to configure the amount of memory that is reserved for the kdump kernel. To do so, select the Manual settings radio button, and click the up and down arrow buttons next to the New kdump Memory field to increase or decrease the amount of memory to be reserved. Notice that the Usable Memory field changes accordingly showing you the remaining memory that is available to the system. See Section 7.1.2, “Memory requirements” for more information on kdump’s memory requirements.
Figure 7.1. Basic Settings
The Target Settings tab allows you to specify the target location for the vmcore dump. The dump can be either stored as a file in a local file system, written directly to a device, or sent over a network using the NFS (Network File System) or SSH (Secure Shell) protocol.
Figure 7.2. Target Settings
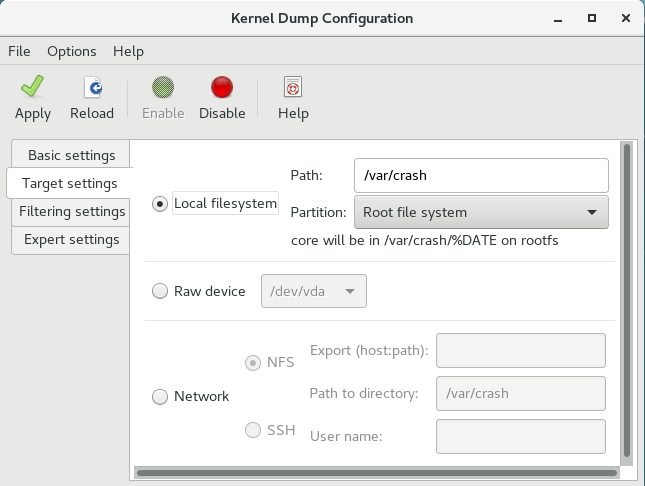
To save the dump to the local file system, select the Local filesystem radio button. Optionally, you can customize the settings by choosing a different partition from the Partition drop-down list and a target directory using the Path field.
In Red Hat Enterprise Linux 7, the directory defined as the kdump target must exist when the kdump systemd service is started - otherwise the service fails. This behavior is different from earlier releases of Red Hat Enterprise Linux, where the directory was being created automatically if it did not exist when starting the service.
To write the dump directly to a device, select the Raw device radio button, and choose the desired target device from the drop-down list next to it.
To send the dump to a remote machine over a network connection, select the Network radio button. To use the NFS protocol, select the NFS radio button, and fill the Server name and Path to directory fields. To use the SSH protocol, select the SSH radio button, and fill the Server name, Path to directory, and User name fields with the remote server address, target directory, and a valid user name respectively.
For information on how to configure an SSH server and set up a key-based authentication, see the Red Hat Enterprise Linux 7 System Administrator’s Guide. For a complete list of currently supported targets, see Table 7.3, “Supported kdump Targets”.
The Filtering Settings tab enables you to select the filtering level for the vmcore dump.
Figure 7.3. Filtering Settings

To exclude the zero page, cache page, cache private, user data, or free page from the dump, select the checkbox next to the appropriate label.
To choose which action should be performed when kdump fails to create a core dump, select an appropriate option from the Action if dumping fails drop-down list. Available options are:
- Dump to rootfs and reboot attempts to save the core locally and then reboots the system
- Reboot the default action which reboots the system
- Start a Shell to present a user with an inter active shell prompt
- Halt to halt the system
- Poweroff to power the system off
Figure 7.4. Filtering Settings

To customize the options that are passed to the makedumpfile core collector, edit the Core collector text field; see Section 7.2.2.3, “Configuring the core collector” for more information.
7.2.3.5. Enabling the service
To start the kdump service at boot time, click the button on the toolbar and then click the button. This enables and activates the service for multi-user.target. Click the button and confirm by clicking the button to disable the service immediately.
In Red Hat Enterprise Linux 7, the directory defined as the kdump target must exist when the kdump systemd service is started - otherwise the service fails. This behavior is different from earlier releases of Red Hat Enterprise Linux, where the directory was being created automatically if it did not exist when starting the service.
For more information on systemd targets and configuring services in general, see the Red Hat Enterprise Linux 7 System Administrator’s Guide.
Blacklisting the kernel drivers is a mechanism to prevent them from being loaded and used. Adding the drivers in /etc/sysconfig/kdump file, prevents the kdump initramfs from loading the blacklisted modules.
Blacklisting kernel drivers prevents the oom killer or other crash kernel failures. To blacklist the kernel drivers, you can update the KDUMP_COMMANDLINE_APPEND= variable in the /etc/sysconfig/kdump file and specify one of the following blacklisting option:
-
rd.driver.blacklist=<modules> -
modprobe.blacklist=<modules>
Procedure
Select the kernel module that you intend to blacklist:
$ lsmod
Module                  Size  Used by
fuse                  126976  3
xt_CHECKSUM            16384  1
ipt_MASQUERADE         16384  1
uinput                 20480  1
xt_conntrack           16384  1
lsmod
CopyCopied! The
lsmodcommand displays the list of modules that are loaded to the currently running kernel.Update the
KDUMP_COMMANDLINE_APPEND=line in the/etc/sysconfig/kdumpfile as:KDUMP_COMMANDLINE_APPEND="rd.driver.blacklist=hv_vmbus,hv_storvsc,hv_utils,hv_netvsc,hid-hyperv"
KDUMP_COMMANDLINE_APPEND="rd.driver.blacklist=hv_vmbus,hv_storvsc,hv_utils,hv_netvsc,hid-hyperv"
CopyCopied! You can also update the
KDUMP_COMMANDLINE_APPEND=line in the/etc/sysconfig/kdumpfile as:KDUMP_COMMANDLINE_APPEND="modprobe.blacklist=emcp modprobe.blacklist=bnx2fc modprobe.blacklist=libfcoe modprobe.blacklist=fcoe"
KDUMP_COMMANDLINE_APPEND="modprobe.blacklist=emcp modprobe.blacklist=bnx2fc modprobe.blacklist=libfcoe modprobe.blacklist=fcoe"
CopyCopied! Restart the kdump service:
$ systemctl restart kdump
systemctl restart kdump
CopyCopied!
7.4. Testing the kdump configuration
The commands below cause the kernel to crash. Use caution when following these steps, and by no means use them on a production system.
To test the configuration, reboot the system with kdump enabled, and make sure that the service is running:
~]# systemctl is-active kdump
active
~]# systemctl is-active kdump
active
Then type the following commands at a shell prompt:
echo 1 > /proc/sys/kernel/sysrqecho c > /proc/sysrq-trigger
echo 1 > /proc/sys/kernel/sysrq
echo c > /proc/sysrq-trigger
This forces the Linux kernel to crash, and the address-YYYY-MM-DD-HH:MM:SS/vmcore file is copied to the location you have selected in the configuration (that is, to /var/crash/ by default).
In addition to confirming the validity of the configuration, this action can also be used to record how long it takes to a crash dump to complete if it is performed under a representative test load.
7.4.1. Additional resources
7.4.1.1. Installed documentation
-
kdump.conf(5) — a manual page for the
/etc/kdump.confconfiguration file containing the full documentation of available options. -
zipl.conf(5) — a manual page for the
/etc/zipl.confconfiguration file. -
zipl(8) — a manual page for the
ziplboot loader utility for IBM Z. -
makedumpfile(8) — a manual page for the
makedumpfilecore collector. - kexec(8) — a manual page for kexec.
- crash(8) — a manual page for the crash utility.
-
/usr/share/doc/kexec-tools-version/kexec-kdump-howto.txt— an overview of thekdumpand kexec installation and usage.
7.4.1.2. Online documentation
- https://access.redhat.com/site/solutions/6038
-
The Red Hat Knowledgebase article about the
kexecandkdumpconfiguration. - https://access.redhat.com/site/solutions/223773
-
The Red Hat Knowledgebase article about supported
kdumptargets. - https://github.com/crash-utility/crash
- The crash utility Git repository.
- https://www.gnu.org/software/grub/
- The GRUB2 boot loader homepage and documentation.
The kexec and kdump mechanisms are a reliable and proven method of capturing a core dump on AMD64 and Intel 64 systems. However, some hardware with a longer history, particularly mini and mainframe systems, allows us to leverage the onboard firmware to isolate regions of memory and prevent any accidental overwriting of data that is important to the crash analysis.
This chapter covers some of the available firmware assisted dump methods and how they integrate with Red Hat Enterprise Linux.
Firmware-assisted dump (fadump) is a reliable alternative to kexec-kdump available on IBM PowerPC LPARS. It captures vmcore from a fully-reset system with PCI and I/O devices reinitialized. While this mechanism uses the firmware to preserve the memory in case of a crash, it reuses the kdump userspace scripts to save the vmcore"
To achieve this, fadump registers the regions of memory that must be preserved in the event of a crash with the system firmware. These regions consist of all the system memory contents, except the boot memory, system registers and hardware Page Table Entries (PTEs).
For further details about the fadump mechanism, including PowerPC-specific methods of resetting hardware, review /usr/share/doc/kexec-tools-X.y.z/fadump-howto.txt where "X.y.z" correspond to the version number of kexec-tools installed on your system.
The area of memory not preserved and known as boot memory is the amount of RAM required to successfully boot the kernel after a crash event. By default, the boot memory size is 256MB or 5% of total system RAM, whichever is larger.
Unlike a kexec-initiated event, the fadump process uses the production kernel to recover a crash dump. When booting after a crash, PowerPC hardware makes the device node /proc/device-tree/rtas/ibm,kernel-dump available to procfs, which the fadump-aware kdump scripts check for to save the vmcore. After this has completed, the system is rebooted cleanly.
Enabling fadump
-
Install and configure
kdumpas described in Section 7.2, “Installing and configuring kdump”. Add
fadump=onto theGRUB_CMDLINE_LINUXline in/etc/default/grub:GRUB_CMDLINE_LINUX="rd.lvm.lv=rhel/swap crashkernel=auto rd.lvm.lv=rhel/root rhgb quiet
fadump=on"GRUB_CMDLINE_LINUX="rd.lvm.lv=rhel/swap crashkernel=auto rd.lvm.lv=rhel/root rhgb quiet fadump=on"
CopyCopied! (optional) If you want to specify reserved boot memory instead of accepting the defaults, configure
crashkernel=xxMtoGRUB_CMDLINE_LINUXin/etc/default/grub, where xx is the amount of the memory required in megabytes:GRUB_CMDLINE_LINUX="rd.lvm.lv=rhel/swap crashkernel=xxM rd.lvm.lv=rhel/root rhgb quiet fadump=on"
GRUB_CMDLINE_LINUX="rd.lvm.lv=rhel/swap crashkernel=xxM rd.lvm.lv=rhel/root rhgb quiet fadump=on"
CopyCopied!
As with all boot configuration options, it is strongly recommended that you test the configuration before it is needed. If you observe Out of Memory (OOM) errors when booting from the crash kernel, increase the value specified in crashkernel= until the crash kernel can boot cleanly. Some trial and error may be required in this case.
There are two firmware assisted dump mechanisms on IBM Z. They are Stand-alone Dump and VMDUMP.
The kdump infrastructure is supported and utilized on these systems and configuration from Red Hat Enterprise Linux is described in Section 7.2, “Installing and configuring kdump”. However, there are potentially some advantages to using either of the firmware assisted methods IBM Z hardware provides.
The Stand-alone Dump (SADMP) mechanism is initiated and controlled from the system console, and must be stored on an IPL bootable device.
Similar to SADMP is VMDUMP. This tool is also initiated from the system console, but has a mechanism to retrieve the resulting dump from hardware and copy it to a system for analysis.
One advantage of these methods (and similarly to other hardware based dump mechanisms), is the ability to capture the state of a machine in the Early Boot phase (before the kdump service is started)
Although VMDUMP contains a mechanism to receive the dump file into a Red Hat Enterprise Linux system, the configuration and control of both SADMP and VMDUMP are managed from the IBM Z Hardware console.
IBM discuss SADMP in detail, in stand-alone dump program article and VMDUMP at VMDUMP article.
IBM also have a documentation set for using the dump tools on Red Hat Enterprise Linux 7 in Using the Dump Tools on Red Hat Enterprise Linux article.
The Fujitsu sadump mechanism is designed to provide a fallback dump capture in the event kdump is unable to complete successfully.
The sadump process is invoked manually from the system ManageMent Board (MMB) interface.
With this system, configure kdump as normal for an X86_64 server and then perform the following additional steps to enable sadump.
Add or edit the following lines in /etc/sysctl.conf to ensure that kdump starts as expected for sadump.
kernel.panic=0
kernel.unknown_nmi_panic=1
kernel.panic=0
kernel.unknown_nmi_panic=1
In addition to the above, you must also add some options to /etc/kdump.conf to ensure that kdump behaves correctly for sadump.
In particular, ensure that after kdump, the system does not reboot. If the system reboots after kdump has failed to save core, then you have no opportunity to invoke sadump.
Set the default action in /etc/kdump.conf to be either halt or shell to achieve this.
default shell
default shell
For details on configuring your hardware for sadump, see the FUJITSU Server PRIMEQUEST 2000 Series Installation Manual.
7.6. Analyzing a core dump
To determine the cause of the system crash, you can use the crash utility, which provides an interactive prompt very similar to the GNU Debugger (GDB). This utility allows you to interactively analyze a running Linux system as well as a core dump created by netdump, diskdump, xendump, or kdump.
7.6.1. Installing the crash utility
To install the crash analyzing tool, execute the following command from a shell prompt as root:
yum install crashyum install crash
In addition to crash, it is also necessary to install the kernel-debuginfo package that corresponds to your running kernel, which provides the data necessary for dump analysis. To install kernel-debuginfo we use the debuginfo-install command as root:
debuginfo-install kerneldebuginfo-install kernel
For more information on how to install new packages in Red Hat Enterprise Linux using the Yum package manager, see the Red Hat Enterprise Linux 7 System Administrator’s Guide.
7.6.2. Running the crash utility
To start the utility, type the command in the following form at a shell prompt:
crash/usr/lib/debug/lib/modules/<kernel>/vmlinux\/var/crash/<timestamp>/vmcore
crash /usr/lib/debug/lib/modules/<kernel>/vmlinux \ /var/crash/<timestamp>/vmcore
Use the same <kernel> version that was captured by kdump. To find out which kernel you are currently running, use the uname -r command.
Example 7.2. Running the crash utility
~]# crash /usr/lib/debug/lib/modules/2.6.32-69.el6.i686/vmlinux \
/var/crash/127.0.0.1-2010-08-25-08:45:02/vmcore

crash 5.0.0-23.el6
Copyright (C) 2002-2010  Red Hat, Inc.
Copyright (C) 2004, 2005, 2006  IBM Corporation
Copyright (C) 1999-2006  Hewlett-Packard Co
Copyright (C) 2005, 2006  Fujitsu Limited
Copyright (C) 2006, 2007  VA Linux Systems Japan K.K.
Copyright (C) 2005  NEC Corporation
Copyright (C) 1999, 2002, 2007  Silicon Graphics, Inc.
Copyright (C) 1999, 2000, 2001, 2002  Mission Critical Linux, Inc.
This program is free software, covered by the GNU General Public License,
and you are welcome to change it and/or distribute copies of it under
certain conditions.  Enter "help copying" to see the conditions.
This program has absolutely no warranty.  Enter "help warranty" for details.

GNU gdb (GDB) 7.0
Copyright (C) 2009 Free Software Foundation, Inc.
License GPLv3+: GNU GPL version 3 or later <http://gnu.org/licenses/gpl.html>
This is free software: you are free to change and redistribute it.
There is NO WARRANTY, to the extent permitted by law.  Type "show copying"
and "show warranty" for details.
This GDB was configured as "i686-pc-linux-gnu"...

      KERNEL: /usr/lib/debug/lib/modules/2.6.32-69.el6.i686/vmlinux
    DUMPFILE: /var/crash/127.0.0.1-2010-08-25-08:45:02/vmcore  [PARTIAL DUMP]
        CPUS: 4
        DATE: Wed Aug 25 08:44:47 2010
      UPTIME: 00:09:02
LOAD AVERAGE: 0.00, 0.01, 0.00
       TASKS: 140
    NODENAME: hp-dl320g5-02.lab.bos.redhat.com
     RELEASE: 2.6.32-69.el6.i686
     VERSION: #1 SMP Tue Aug 24 10:31:45 EDT 2010
     MACHINE: i686  (2394 Mhz)
      MEMORY: 8 GB
       PANIC: "Oops: 0002 [#1] SMP " (check log for details)
         PID: 5591
     COMMAND: "bash"
        TASK: f196d560  [THREAD_INFO: ef4da000]
         CPU: 2
       STATE: TASK_RUNNING (PANIC)

crash>
~]# crash /usr/lib/debug/lib/modules/2.6.32-69.el6.i686/vmlinux \
/var/crash/127.0.0.1-2010-08-25-08:45:02/vmcore
crash 5.0.0-23.el6
Copyright (C) 2002-2010 Red Hat, Inc.
Copyright (C) 2004, 2005, 2006 IBM Corporation
Copyright (C) 1999-2006 Hewlett-Packard Co
Copyright (C) 2005, 2006 Fujitsu Limited
Copyright (C) 2006, 2007 VA Linux Systems Japan K.K.
Copyright (C) 2005 NEC Corporation
Copyright (C) 1999, 2002, 2007 Silicon Graphics, Inc.
Copyright (C) 1999, 2000, 2001, 2002 Mission Critical Linux, Inc.
This program is free software, covered by the GNU General Public License,
and you are welcome to change it and/or distribute copies of it under
certain conditions. Enter "help copying" to see the conditions.
This program has absolutely no warranty. Enter "help warranty" for details.
GNU gdb (GDB) 7.0
Copyright (C) 2009 Free Software Foundation, Inc.
License GPLv3+: GNU GPL version 3 or later <http://gnu.org/licenses/gpl.html>
This is free software: you are free to change and redistribute it.
There is NO WARRANTY, to the extent permitted by law. Type "show copying"
and "show warranty" for details.
This GDB was configured as "i686-pc-linux-gnu"...
KERNEL: /usr/lib/debug/lib/modules/2.6.32-69.el6.i686/vmlinux
DUMPFILE: /var/crash/127.0.0.1-2010-08-25-08:45:02/vmcore [PARTIAL DUMP]
CPUS: 4
DATE: Wed Aug 25 08:44:47 2010
UPTIME: 00:09:02
LOAD AVERAGE: 0.00, 0.01, 0.00
TASKS: 140
NODENAME: hp-dl320g5-02.lab.bos.redhat.com
RELEASE: 2.6.32-69.el6.i686
VERSION: #1 SMP Tue Aug 24 10:31:45 EDT 2010
MACHINE: i686 (2394 Mhz)
MEMORY: 8 GB
PANIC: "Oops: 0002 [#1] SMP " (check log for details)
PID: 5591
COMMAND: "bash"
TASK: f196d560 [THREAD_INFO: ef4da000]
CPU: 2
STATE: TASK_RUNNING (PANIC)
crash>7.6.3. Displaying the message buffer
To display the kernel message buffer, type the log command at the interactive prompt.
Example 7.3. Displaying the kernel message buffer
crash> log
... several lines omitted ...
EIP: 0060:[<c068124f>] EFLAGS: 00010096 CPU: 2
EIP is at sysrq_handle_crash+0xf/0x20
EAX: 00000063 EBX: 00000063 ECX: c09e1c8c EDX: 00000000
ESI: c0a09ca0 EDI: 00000286 EBP: 00000000 ESP: ef4dbf24
 DS: 007b ES: 007b FS: 00d8 GS: 00e0 SS: 0068
Process bash (pid: 5591, ti=ef4da000 task=f196d560 task.ti=ef4da000)
Stack:
 c068146b c0960891 c0968653 00000003 00000000 00000002 efade5c0 c06814d0
<0> fffffffb c068150f b7776000 f2600c40 c0569ec4 ef4dbf9c 00000002 b7776000
<0> efade5c0 00000002 b7776000 c0569e60 c051de50 ef4dbf9c f196d560 ef4dbfb4
Call Trace:
 [<c068146b>] ? __handle_sysrq+0xfb/0x160
 [<c06814d0>] ? write_sysrq_trigger+0x0/0x50
 [<c068150f>] ? write_sysrq_trigger+0x3f/0x50
 [<c0569ec4>] ? proc_reg_write+0x64/0xa0
 [<c0569e60>] ? proc_reg_write+0x0/0xa0
 [<c051de50>] ? vfs_write+0xa0/0x190
 [<c051e8d1>] ? sys_write+0x41/0x70
 [<c0409adc>] ? syscall_call+0x7/0xb
Code: a0 c0 01 0f b6 41 03 19 d2 f7 d2 83 e2 03 83 e0 cf c1 e2 04 09 d0 88 41 03 f3 c3 90 c7 05 c8 1b 9e c0 01 00 00 00 0f ae f8 89 f6 <c6> 05 00 00 00 00 01 c3 89 f6 8d bc 27 00 00 00 00 8d 50 d0 83
EIP: [<c068124f>] sysrq_handle_crash+0xf/0x20 SS:ESP 0068:ef4dbf24
CR2: 0000000000000000
crash> log ... several lines omitted ... EIP: 0060:[<c068124f>] EFLAGS: 00010096 CPU: 2 EIP is at sysrq_handle_crash+0xf/0x20 EAX: 00000063 EBX: 00000063 ECX: c09e1c8c EDX: 00000000 ESI: c0a09ca0 EDI: 00000286 EBP: 00000000 ESP: ef4dbf24 DS: 007b ES: 007b FS: 00d8 GS: 00e0 SS: 0068 Process bash (pid: 5591, ti=ef4da000 task=f196d560 task.ti=ef4da000) Stack: c068146b c0960891 c0968653 00000003 00000000 00000002 efade5c0 c06814d0 <0> fffffffb c068150f b7776000 f2600c40 c0569ec4 ef4dbf9c 00000002 b7776000 <0> efade5c0 00000002 b7776000 c0569e60 c051de50 ef4dbf9c f196d560 ef4dbfb4 Call Trace: [<c068146b>] ? __handle_sysrq+0xfb/0x160 [<c06814d0>] ? write_sysrq_trigger+0x0/0x50 [<c068150f>] ? write_sysrq_trigger+0x3f/0x50 [<c0569ec4>] ? proc_reg_write+0x64/0xa0 [<c0569e60>] ? proc_reg_write+0x0/0xa0 [<c051de50>] ? vfs_write+0xa0/0x190 [<c051e8d1>] ? sys_write+0x41/0x70 [<c0409adc>] ? syscall_call+0x7/0xb Code: a0 c0 01 0f b6 41 03 19 d2 f7 d2 83 e2 03 83 e0 cf c1 e2 04 09 d0 88 41 03 f3 c3 90 c7 05 c8 1b 9e c0 01 00 00 00 0f ae f8 89 f6 <c6> 05 00 00 00 00 01 c3 89 f6 8d bc 27 00 00 00 00 8d 50 d0 83 EIP: [<c068124f>] sysrq_handle_crash+0xf/0x20 SS:ESP 0068:ef4dbf24 CR2: 0000000000000000
Type help log for more information on the command usage.
The kernel message buffer includes the most essential information about the system crash and, as such, it is always dumped first in to the vmcore-dmesg.txt file. This is useful when an attempt to get the full vmcore file failed, for example because of lack of space on the target location. By default, vmcore-dmesg.txt is located in the /var/crash/ directory.
7.6.4. Displaying a backtrace
To display the kernel stack trace, type the bt command at the interactive prompt. You can use bt <pid> to display the backtrace of a single process.
Example 7.4. Displaying the kernel stack trace
crash> bt
PID: 5591   TASK: f196d560  CPU: 2   COMMAND: "bash"
 #0 [ef4dbdcc] crash_kexec at c0494922
 #1 [ef4dbe20] oops_end at c080e402
 #2 [ef4dbe34] no_context at c043089d
 #3 [ef4dbe58] bad_area at c0430b26
 #4 [ef4dbe6c] do_page_fault at c080fb9b
 #5 [ef4dbee4] error_code (via page_fault) at c080d809
    EAX: 00000063  EBX: 00000063  ECX: c09e1c8c  EDX: 00000000  EBP: 00000000
    DS:  007b      ESI: c0a09ca0  ES:  007b      EDI: 00000286  GS:  00e0
    CS:  0060      EIP: c068124f  ERR: ffffffff  EFLAGS: 00010096
 #6 [ef4dbf18] sysrq_handle_crash at c068124f
 #7 [ef4dbf24] __handle_sysrq at c0681469
 #8 [ef4dbf48] write_sysrq_trigger at c068150a
 #9 [ef4dbf54] proc_reg_write at c0569ec2
#10 [ef4dbf74] vfs_write at c051de4e
#11 [ef4dbf94] sys_write at c051e8cc
#12 [ef4dbfb0] system_call at c0409ad5
    EAX: ffffffda  EBX: 00000001  ECX: b7776000  EDX: 00000002
    DS:  007b      ESI: 00000002  ES:  007b      EDI: b7776000
    SS:  007b      ESP: bfcb2088  EBP: bfcb20b4  GS:  0033
    CS:  0073      EIP: 00edc416  ERR: 00000004  EFLAGS: 00000246
crash> bt
PID: 5591 TASK: f196d560 CPU: 2 COMMAND: "bash"
#0 [ef4dbdcc] crash_kexec at c0494922
#1 [ef4dbe20] oops_end at c080e402
#2 [ef4dbe34] no_context at c043089d
#3 [ef4dbe58] bad_area at c0430b26
#4 [ef4dbe6c] do_page_fault at c080fb9b
#5 [ef4dbee4] error_code (via page_fault) at c080d809
EAX: 00000063 EBX: 00000063 ECX: c09e1c8c EDX: 00000000 EBP: 00000000
DS: 007b ESI: c0a09ca0 ES: 007b EDI: 00000286 GS: 00e0
CS: 0060 EIP: c068124f ERR: ffffffff EFLAGS: 00010096
#6 [ef4dbf18] sysrq_handle_crash at c068124f
#7 [ef4dbf24] __handle_sysrq at c0681469
#8 [ef4dbf48] write_sysrq_trigger at c068150a
#9 [ef4dbf54] proc_reg_write at c0569ec2
#10 [ef4dbf74] vfs_write at c051de4e
#11 [ef4dbf94] sys_write at c051e8cc
#12 [ef4dbfb0] system_call at c0409ad5
EAX: ffffffda EBX: 00000001 ECX: b7776000 EDX: 00000002
DS: 007b ESI: 00000002 ES: 007b EDI: b7776000
SS: 007b ESP: bfcb2088 EBP: bfcb20b4 GS: 0033
CS: 0073 EIP: 00edc416 ERR: 00000004 EFLAGS: 00000246
Type help bt for more information on the command usage.
7.6.5. Displaying a process status
To display status of processes in the system, type the ps command at the interactive prompt. You can use ps <pid> to display the status of a single process.
Example 7.5. Displaying the status of processes in the system
crash> ps
   PID    PPID  CPU   TASK    ST  %MEM     VSZ    RSS  COMM
>     0      0   0  c09dc560  RU   0.0       0      0  [swapper]
>     0      0   1  f7072030  RU   0.0       0      0  [swapper]
      0      0   2  f70a3a90  RU   0.0       0      0  [swapper]
>     0      0   3  f70ac560  RU   0.0       0      0  [swapper]
      1      0   1  f705ba90  IN   0.0    2828   1424  init
... several lines omitted ...
   5566      1   1  f2592560  IN   0.0   12876    784  auditd
   5567      1   2  ef427560  IN   0.0   12876    784  auditd
   5587   5132   0  f196d030  IN   0.0   11064   3184  sshd
>  5591   5587   2  f196d560  RU   0.0    5084   1648  bash
crash> ps
PID PPID CPU TASK ST %MEM VSZ RSS COMM
> 0 0 0 c09dc560 RU 0.0 0 0 [swapper]
> 0 0 1 f7072030 RU 0.0 0 0 [swapper]
0 0 2 f70a3a90 RU 0.0 0 0 [swapper]
> 0 0 3 f70ac560 RU 0.0 0 0 [swapper]
1 0 1 f705ba90 IN 0.0 2828 1424 init
... several lines omitted ...
5566 1 1 f2592560 IN 0.0 12876 784 auditd
5567 1 2 ef427560 IN 0.0 12876 784 auditd
5587 5132 0 f196d030 IN 0.0 11064 3184 sshd
> 5591 5587 2 f196d560 RU 0.0 5084 1648 bash
Type help ps for more information on the command usage.
To display basic virtual memory information, type the vm command at the interactive prompt. You can use vm <pid> to display information on a single process.
Example 7.6. Displaying virtual memory information of the current context
crash> vm
PID: 5591   TASK: f196d560  CPU: 2   COMMAND: "bash"
   MM       PGD      RSS    TOTAL_VM
f19b5900  ef9c6000  1648k    5084k
  VMA       START      END    FLAGS  FILE
f1bb0310    242000    260000 8000875  /lib/ld-2.12.so
f26af0b8    260000    261000 8100871  /lib/ld-2.12.so
efbc275c    261000    262000 8100873  /lib/ld-2.12.so
efbc2a18    268000    3ed000 8000075  /lib/libc-2.12.so
efbc23d8    3ed000    3ee000 8000070  /lib/libc-2.12.so
efbc2888    3ee000    3f0000 8100071  /lib/libc-2.12.so
efbc2cd4    3f0000    3f1000 8100073  /lib/libc-2.12.so
efbc243c    3f1000    3f4000 100073
efbc28ec    3f6000    3f9000 8000075  /lib/libdl-2.12.so
efbc2568    3f9000    3fa000 8100071  /lib/libdl-2.12.so
efbc2f2c    3fa000    3fb000 8100073  /lib/libdl-2.12.so
f26af888    7e6000    7fc000 8000075  /lib/libtinfo.so.5.7
f26aff2c    7fc000    7ff000 8100073  /lib/libtinfo.so.5.7
efbc211c    d83000    d8f000 8000075  /lib/libnss_files-2.12.so
efbc2504    d8f000    d90000 8100071  /lib/libnss_files-2.12.so
efbc2950    d90000    d91000 8100073  /lib/libnss_files-2.12.so
f26afe00    edc000    edd000 4040075
f1bb0a18   8047000   8118000 8001875  /bin/bash
f1bb01e4   8118000   811d000 8101873  /bin/bash
f1bb0c70   811d000   8122000 100073
f26afae0   9fd9000   9ffa000 100073
... several lines omitted ...
crash> vm PID: 5591 TASK: f196d560 CPU: 2 COMMAND: "bash" MM PGD RSS TOTAL_VM f19b5900 ef9c6000 1648k 5084k VMA START END FLAGS FILE f1bb0310 242000 260000 8000875 /lib/ld-2.12.so f26af0b8 260000 261000 8100871 /lib/ld-2.12.so efbc275c 261000 262000 8100873 /lib/ld-2.12.so efbc2a18 268000 3ed000 8000075 /lib/libc-2.12.so efbc23d8 3ed000 3ee000 8000070 /lib/libc-2.12.so efbc2888 3ee000 3f0000 8100071 /lib/libc-2.12.so efbc2cd4 3f0000 3f1000 8100073 /lib/libc-2.12.so efbc243c 3f1000 3f4000 100073 efbc28ec 3f6000 3f9000 8000075 /lib/libdl-2.12.so efbc2568 3f9000 3fa000 8100071 /lib/libdl-2.12.so efbc2f2c 3fa000 3fb000 8100073 /lib/libdl-2.12.so f26af888 7e6000 7fc000 8000075 /lib/libtinfo.so.5.7 f26aff2c 7fc000 7ff000 8100073 /lib/libtinfo.so.5.7 efbc211c d83000 d8f000 8000075 /lib/libnss_files-2.12.so efbc2504 d8f000 d90000 8100071 /lib/libnss_files-2.12.so efbc2950 d90000 d91000 8100073 /lib/libnss_files-2.12.so f26afe00 edc000 edd000 4040075 f1bb0a18 8047000 8118000 8001875 /bin/bash f1bb01e4 8118000 811d000 8101873 /bin/bash f1bb0c70 811d000 8122000 100073 f26afae0 9fd9000 9ffa000 100073 ... several lines omitted ...
Type help vm for more information on the command usage.
7.6.7. Displaying open files
To display information about open files, type the files command at the interactive prompt. You can use files <pid> to display files opened by only one selected process.
Example 7.7. Displaying information about open files of the current context
crash> files
PID: 5591   TASK: f196d560  CPU: 2   COMMAND: "bash"
ROOT: /    CWD: /root
 FD    FILE     DENTRY    INODE    TYPE  PATH
  0  f734f640  eedc2c6c  eecd6048  CHR   /pts/0
  1  efade5c0  eee14090  f00431d4  REG   /proc/sysrq-trigger
  2  f734f640  eedc2c6c  eecd6048  CHR   /pts/0
 10  f734f640  eedc2c6c  eecd6048  CHR   /pts/0
255  f734f640  eedc2c6c  eecd6048  CHR   /pts/0
crash> files PID: 5591 TASK: f196d560 CPU: 2 COMMAND: "bash" ROOT: / CWD: /root FD FILE DENTRY INODE TYPE PATH 0 f734f640 eedc2c6c eecd6048 CHR /pts/0 1 efade5c0 eee14090 f00431d4 REG /proc/sysrq-trigger 2 f734f640 eedc2c6c eecd6048 CHR /pts/0 10 f734f640 eedc2c6c eecd6048 CHR /pts/0 255 f734f640 eedc2c6c eecd6048 CHR /pts/0
Type help files for more information on the command usage.
7.6.8. Exiting the utility
To exit the interactive prompt and terminate crash, type exit or q.
Example 7.8. Exiting the crash utility
crash> exit
~]#
crash> exit
~]#
7.7. Frequently asked questions
What considerations need to be made for using Kdump in a clustered environment?
How do I configure kdump for use with the RHEL 6, 7 High Availability Add-On? shows the options available to system administrators using the High Availability Add-On.
Kdump fails during early boot, How do I capture the boot log?
If there is a problem booting the second kernel, it is necessary to review the early boot logs, these can be obtained by enabling a serial console to the affected machine.
How do I setup serial console in RHEL7? shows the configuration needed to enable access to the early boot messages.
How do I increase the messaging from makedumpfile for debugging?
In the event that makedumpfile fails, then it is necessary to increase the log level to understand what is going wrong. This is different from setting the dump level and is achieved by editing /etc/kdump.conf and increasing the message_level option to makedumpfile on the core_collector line entry.
By default makedumpfile is set to level 1, which restricts the output prints to progress indicator. Enable all the debugging information by setting this message level to 31. Message level 31 will print details about progress indicator, common message, error message, debug message and report message.
For more information about the message level options, see the makedumpfile (8) manual page.
Ensure that your core_collector config line looks similar to this when set:
core_collector makedumpfile -l --message-level 1 -d 31
core_collector makedumpfile -l --message-level 1 -d 31
How do I debug Dracut?
Sometimes dracut can fail to build an initramfs. If this happens, increase the log level in dracut to isolate the issue.
Edit /etc/kdump.conf and change the dracut_args line to include the option -L 5 in addition to any other dracut arguments you require.
If you have no other options configured in dracut_args, the result looks similar to this:
dracut_args -L 5
dracut_args -L 5
What methods of dumping are available for virtual machines?
In most cases, the kdump mechanism is sufficient for obtaining a memory dump from a machine after a crash or panic. This can be set up in the same manner as installations to bare metal.
However, in some cases, it is necessary to work directly with the hypervisor to obtain a crash dump. There are two mechanisms available with libvirt to achieve this; pvpanic and virsh dump. Both of these methods are described in the Virtualization Deployment and Administration Guide.
The pvpanic mechanism can be found at Virtualization Deployment and Administration Guide - Setting a Panic Device.
The virsh dump command is discussed in Virtualization Deployment and Administration Guide - Creating a Dump File of a Domain’s Core.
How do I upload a large dump file to Red Hat Support Services?
In some cases, it might be necessary to send a kernel crash dump file to Red Hat Global Support Services for analysis. However, the dump file can be very large, even after being filtered. Since files larger than 250 MB cannot be uploaded directly through the Red Hat Customer Portal when opening a new support case, an FTP server is provided by Red Hat for uploading large files.
The FTP server’s address is dropbox.redhat.com and the files are to be uploaded in the /incoming/ directory. Your FTP client needs to be set into passive mode; if your firewall does not allow this mode, use the origin-dropbox.redhat.com server using active mode.
Make sure that the uploaded files are compressed using a program such as gzip and properly and descriptively named. Using your support case number in the file name is recommended. After successfully uploading all necessary files, provide the engineer in charge of your support case with the exact file name and its SHA1 or MD5 checksum.
For more specific instructions and additional information, see How to provide files to Red Hat Support.
How much time is needed for a crash dump to complete?
It is often necessary, for the purposes of disaster recovery planning, to know how long a dump takes to complete. However, the length of time it takes is highly dependent on the amount of memory being copied to disk and the speed of the interfaces between RAM and storage.
For any test of timings, the system must be operating under a representative load, otherwise the page exclusion choices can present a false view of kdump behavior with a fully loaded production system. This discrepancy is present especially when working with very large quantities of RAM.
Also consider storage interfaces in your planning when assessing time to dump. Because of network constraints, a connection dumping over ssh for example, can take longer to complete than a locally attached SATA disk.
How is Kdump configured during installation?
You can configure kdump during installation with a limited set of options in kickstart or the interactive GUI.
The kdump configuration using the anaconda installation GUI is documented in the KDUMP section of the Installation Guide.
The kickstart syntax is:
%addon com_redhat_kdump [--disable,enable] [--reserve-mb=[auto,value]]
%end
%addon com_redhat_kdump [--disable,enable] [--reserve-mb=[auto,value]]
%end
With this add-on to Kickstart, you can disable or enable kdump functionality, optionally defining the reserved memory size, either by explicitly invoking the default option of auto (which is also the case if the entire switch is omitted) or specifying a numeric value in megabytes.
To learn how Kickstart can be used to automate system deployments, read Kickstart Installations in the Installation Guide.
For further details about Kickstart add-on syntax, review the Kickstart Syntax Reference in the Installation Guide.
7.8.1. Memory requirements for kdump
In order for kdump to be able to capture a kernel crash dump and save it for further analysis, a part of the system memory has to be permanently reserved for the capture kernel.
For information on how to change memory settings on the command line, see Section 7.2.2.1, “Configuring the memory usage”. For instructions on how to set up the amount of reserved memory in the graphical user interface, see Section 7.2.3.1, “Configuring the memory usage”.
Table 7.1 lists memory reserved automatically by kdump on kernel and kernel-alt packages. kdump auto reserves memory based on the CPU architecture, and total available physical memory.
| CPU architecture | Available memory | Crash memory automatically reserved |
|---|---|---|
| AMD64 and Intel 64 (x86_64) | 2 GB and more | 161 MB + 64 MB per 1 TB |
| 64-bit ARM architecture (arm64) | 2 GB and more | 512 MB |
| IBM POWER ppc64/ppc64le | 2 GB to 4 GB | 384 MB |
| 4 GB to 16 GB | 512 MB | |
| 16 GB to 64 GB | 1 GB | |
| 64 GB to 128 GB | 2 GB | |
| 128 GB and more | 4 GB | |
| IBM Z (s390x) | 4 GB and more |
161 MB + 64 MB per 1 TB |
For more information about various Red Hat Enterprise Linux technology capabilities and limits, see https://access.redhat.com/articles/rhel-limits.
On some systems, it is possible to allocate memory for kdump automatically, either by using the crashkernel=auto parameter in the bootloader’s configuration file, or by enabling this option in the graphical configuration utility. For this automatic reservation to work, however, a certain amount of total memory needs to be available in the system. This amount differs based on the system’s architecture.
The table below lists the thresholds for automatic memory allocation for kernel and kernel-alt packages. If the system has less memory than specified in the table, memory needs to be reserved manually.
For information on how to change these settings on the command line, see Section 7.2.2.1, “Configuring the memory usage”. For instructions on how to change the amount of reserved memory in the graphical user interface, see Section 7.2.3.1, “Configuring the memory usage”.
| Architecture | Required Memory |
|---|---|
|
AMD64 and Intel 64 ( | 2 GB |
|
IBM POWER ( | 2 GB |
|
IBM Z ( | 4 GB |
|
64-bit ARM architecture ( | 2 GB |
7.8.3. Supported kdump targets
When a kernel crash is captured, the core dump can be either written directly to a device, stored as a file on a local file system, or sent over a network. The table below contains a complete list of dump targets that are currently supported or explicitly unsupported by kdump.
For information on how to configure the target type on the command line, see Section 7.2.2.2, “Configuring the kdump target”. For information on how to do so in the graphical user interface, see Section 7.2.3.2, “Configuring the kdump target”.
| Type | Supported Targets | Unsupported Targets |
|---|---|---|
| Raw device | All locally attached raw disks and partitions. | |
| Local file system |
|
Any local file system not explicitly listed as supported in this table, including the |
| Remote directory |
Remote directories accessed using the |
Remote directories on the |
|
Remote directories accessed using the |
| |
|
Remote directories accessed using the |
Remote directories accessed using the | Multipath-based storages. |
|
Remote directories accessed over | ||
|
Remote directories accessed using the | ||
| Remote directories accessed using wireless network interfaces. | ||
When dumping to a software FCoE target, you can encounter Out of Memory (OOM) issue. In such cases, increase the default crashkernel=auto parameter value. For more information on how to set up this kernel boot parameter, see Section 7.2.2.1, “Configuring the memory usage”.
To reduce the size of the dump file, kdump uses the makedumpfile core collector to compress the data and optionally leave out irrelevant information. The table below contains a complete list of filtering levels that are currently supported by the makedumpfile utility.
For instructions on how to configure the core collector on the command line, see Section 7.2.2.3, “Configuring the core collector”. For information on how to do so in the graphical user interface, see Section 7.2.3.3, “Configuring the core collector”.
| Option | Description |
|---|---|
|
| Zero pages |
|
| Cache pages |
|
| Cache private |
|
| User pages |
|
| Free pages |
The makedumpfile command supports removal of transparent huge pages and hugetlbfs pages on Red Hat Enterprise Linux 7.3 and later. Consider both these types of hugepages User Pages and remove them using the -8 level.
7.8.5. Supported default actions
By default, when kdump fails to create a core dump, the operating system reboots. You can, however, configure kdump to perform a different operation in case it fails to save the core dump to the primary target. The table below lists all default actions that are currently supported by kdump.
For detailed information on how to set up the default action on the command line, see Section 7.2.2.4, “Configuring the default action”. For information on how to do so in the graphical user interface, see Section 7.2.3.4, “Configuring the default action”.
| Option | Description |
|---|---|
|
| Attempt to save the core dump to the root file system. This option is especially useful in combination with a network target: if the network target is unreachable, this option configures kdump to save the core dump locally. The system is rebooted afterwards. |
|
| Reboot the system, losing the core dump in the process. |
|
| Halt the system, losing the core dump in the process. |
|
| Power off the system, losing the core dump in the process. |
|
| Run a shell session from within the initramfs, allowing the user to record the core dump manually. |
7.8.6. Estimating kdump size
When planning and building your kdump environment it is necessary to know how much space is required for the dump file before one is produced. The makedumpfile command can help with this.
Estimate the space required for the dump file using the --mem-usage functionality as:
# makedumpfile -f --mem-usage /proc/kcore
The --mem-usage functionality using -f option, works with the Kernel version v4.11 and later.
For Kernel versions earlier than v4.11, before using --mem-usage with option -f , ensure that the Kernel is patched with upstream commit 464920104bf7.
The --mem-usage option provides a useful report about excludable pages, that can be used to determine which dump level you want to assign. Run this command when the system is under representative load, otherwise makedumpfile returns a smaller value than is expected in your production environment.
[root@hostname ~]# makedumpfile -f --mem-usage /proc/kcore

TYPE            PAGES                   EXCLUDABLE      DESCRIPTION
----------------------------------------------------------------------
ZERO            501635                  yes             Pages filled with zero
CACHE           51657                   yes             Cache pages
CACHE_PRIVATE   5442                    yes             Cache pages + private
USER            16301                   yes             User process pages
FREE            77738211                yes             Free pages
KERN_DATA       1333192                 no              Dumpable kernel data
makedumpfile -f --mem-usage /proc/kcore
The makedumpfile command reports in pages. This means that you must calculate the size of memory in use against the kernel page size, which in the Red Hat Enterprise Linux kernel, is 4 kilobytes for AMD64 and Intel 64 architectures, and 64 kilobytes for IBM POWER architecture.
The following table provides an overview of architectures and available memory support on kernel and kernel-alt packages.
| CPU architecture | Available memory | RHEL 7.5 and earlier | RHEL 7.6 and later | RHEL-ALT-7.4 | RHEL-ALT-7.5 and later |
|---|---|---|---|---|---|
|
| 2GB and more | 161MB + 64MB per 1TB | 161MB + 64MB/1TB | 2GB to 160MB | 2GB to 160MB |
|
| 2GB and more | N/A | N/A | 2GB to 512MB | 2GB to 512MB |
|
| 2GB to 4GB | 384MB | 384MB | N/A | N/A |
| 4GB to 16GB | 512MB | 512MB | N/A | N/A | |
| 16GB to 64GB | 1GB | 1GB | N/A | N/A | |
| 64GB to 128GB | 2GB | 2GB | N/A | N/A | |
| 128GB and more | 4GB | 4GB | N/A | N/A | |
|
| 2GB to 4GB | 384MB | 384MB | 384MB | 384MB |
| 4GB to 16GB | 512MB | 512MB | 512MB | 512MB | |
| 16GB to 64GB | 1GB | 1GB | 1GB | 1GB | |
| 64GB to 128GB | 2GB | 2GB | 2GB | 2GB | |
| 128GB and more | 4GB | 4GB | 4GB | 4GB | |
|
| 2GB to 4GB | N/A | N/A | 384MB | 384MB |
| 4GB to 16GB | N/A | N/A | 512MB | 512MB | |
| 16GB to 64GB | N/A | N/A | 1GB | 1GB | |
| 64GB to 128GB | N/A | N/A | 2GB | 2GB | |
| 128GB and more | N/A | N/A | 4GB | 4GB | |
|
| 4GB and more | 161MB + 64MB per 1TB | 161MB + 64MB per 1TB | 161MB + 64MB per 1TB | 160MB |
7.9.1. Rebooting kernel with kexec
The kexec system call enables loading and booting into another kernel from the currently running kernel, thus performing a function of a boot loader from within the kernel.
The kexec utility loads the kernel and the initramfs image for the kexec system call to boot into another kernel.
The following section describes how to manually invoke the kexec system call when using the`kexec` utility to reboot into another kernel.
Execute the
kexecutility:# kexec -l /boot/vmlinuz-3.10.0-1040.el7.x86_64 --initrd=/boot/initramfs-3.10.0-1040.el7.x86_64.img --reuse-cmdline
kexec -l /boot/vmlinuz-3.10.0-1040.el7.x86_64 --initrd=/boot/initramfs-3.10.0-1040.el7.x86_64.img --reuse-cmdline
CopyCopied! The command manually loads the kernel and the initramfs image for the
kexecsystem call.Reboot the system:
# reboot
reboot
CopyCopied! The command detects the kernel, shuts down all services and then calls the
kexecsystem call to reboot into the kernel you provided in the previous step.
When you use the kexec -e command to reboot the kernel, the system does not go through the standard shutdown sequence before starting the next kernel, which may cause data loss or an unresponsive system.
7.10. Portal labs relevant to kdump
The Portal Labs are small web applications that can help system administrators perform several system tasks. There are currently two labs focused on Kdump. The Kdump Helper and the Kernel Oops Analyzer.
7.10.1. Kdump helper
The Kdump Helper is a series of questions and actions that assist in preparing the configuration files for kdump.
The Lab’s workflow includes steps for both clustered and standalone environments.
7.10.2. Kernel oops analyzer
The Kernel Oops Analyzer is a tool to process Oops messages and search for known solutions without having to unwind the crash dump stack.
The Kernel Oops Analyzer uses information from makedumpfile to compare the oops message from a crashed machine with known issues in the knowledge base. This can enable System Administrators to rule out known issues quickly after an unexpected outage, and before opening a support ticket for a further analysis.