
监控
在 OpenShift Container Platform 4.2 中配置和使用监控堆栈
摘要
第 1 章 集群监控
1.1. 关于集群监控
OpenShift Container Platform 包括一个预配置、预安装且自助更新的监控堆栈,它基于 Prometheus 开源项目及其更广的生态系统。它提供对集群组件的监控,并且包含一组警报(在发生任何问题时立即通知集群管理员)以及一组 Grafana 仪表板。集群监控堆栈只支持监控 OpenShift Container Platform 集群。
为确保与将来的 OpenShift Container Platform 更新兼容,只有特定的监控堆栈选项配置被支持。
1.1.1. 堆栈组件和受监控目标
监控堆栈包括以下组件:
表 1.1. 监控堆栈组件
| 组件 | 描述 |
|---|---|
| Cluster Monitoring Operator | OpenShift Container Platform Cluster Monitoring Operator (CMO) 是堆栈的核心组件。它控制部署的监控组件和资源,并确保它们始终处于最新状态。 |
| Prometheus Operator | Prometheus Operator (PO) 可以创建、配置和管理 Prometheus 和 Alertmanager 实例。还能根据熟悉的 Kubernetes 标签查询来自动生成监控目标配置。 |
| Prometheus | Prometheus 是监控堆栈所依据的系统与服务监控系统。 |
| Prometheus Adapter | Prometheus Adapter 公开用于 Pod 横向自动扩展的集群资源指标 API。资源指标是指 CPU 与内存使用情况。 |
| Alertmanager | Alertmanager 服务处理 Prometheus 发送的警报。 |
|
|
|
|
|
|
|
|
|
| Grafana | Grafana 分析平台提供用于分析和直观呈现指标的仪表板。由监控堆栈提供的 Grafana 实例及其仪表板是只读的。 |
监控堆栈的所有组件都由堆栈监控,并在 OpenShift Container Platform 更新时自动更新。
除了堆栈本身的组件外,监控堆栈还监控:
- CoreDNS
- Elasticsearch(如果安装了 Logging)
- Etcd
- Fluentd(如果安装了 Logging)
- HAProxy
- 镜像 registry
- Kubelets
- Kubernetes apiserver
- Kubernetes 控制器管理器
- Kubernetes 调度程序
- Metering(如果安装了 Metering)
- OpenShift apiserver
- OpenShift 控制器管理器
- Operator Lifecycle Manager (OLM)
- Telemeter Client
每个 OpenShift Container Platform 组件负责自己的监控配置。对于组件监控的问题,请在 Bugzilla 中针对具体组件(而非常规的监控组件)创建一个程序错误报告。
其他 OpenShift Container Platform 框架组件也可能会公开指标。如需详细信息,请参阅相应的文档。
后续步骤
1.2. 配置监控堆栈
在 OpenShift Container Platform 4 之前,Prometheus Cluster Monitoring 堆栈是通过 Ansible 清单文件配置的。为此,堆栈公开了一小部分可用配置选项作为 Ansible 的变量。您需要在安装 OpenShift Container Platform 前配置该堆栈。
在 OpenShift Container Platform 4 中,Ansible 不再是安装 OpenShift Container Platform 的主要方法。安装之前,安装程序只提供非常少的配置选项。大多数 OpenShift 框架组件(包括 Prometheus Cluster Monitoring 堆栈)都在安装后进行配置。
本节介绍支持的配置,演示如何配置监控堆栈,并且展示几个常见的配置情景。
先决条件
- 监控堆栈会带来额外的资源需求。请参考缩放 Cluster Monitoring Operator 中的计算资源建议,并验证您是否有充足的资源。
1.2.1. 维护和支持
若要配置 OpenShift Container Platform Monitoring,支持的方式是使用本文中介绍的选项。请勿使用其他配置,因为不受支持。各个 Prometheus 发行版本的配置范例可能会有所变化,只有掌握了所有可能的配置,才能稳妥应对这样的配置变化。如果使用并非本节所描述的配置,您的更改可能会丢失,因为 cluster-monitoring-operator 会调节差异。根据设计,Operator 默认将一切还原到定义的状态。
明确不支持的情形包括:
-
在
openshift-*命名空间中创建额外的ServiceMonitor对象。这会扩大集群监控 Prometheus 实例抓取目标的范围,可能会造成无法考量的冲突和负载差异。这些因素可能会导致 Prometheus 设置不稳定。 -
创建非预期的
ConfigMap对象或PrometheusRule对象。这会导致集群监控 Prometheus 实例包含额外的警报和记录规则。 - 修改堆栈的资源。Prometheus 监控堆栈确保其资源始终处于期望的状态。如果修改了资源,堆栈会重置它们。
- 将堆栈资源用于其他目的。Prometheus Cluster Monitoring 堆栈所创建的资源并不是为了供任何其他资源使用,因为不能保证向后兼容性。
- 使 Cluster Monitoring Operator 停止调节监控堆栈。
- 添加新的警报规则。
- 修改监控堆栈 Grafana 实例。
1.2.2. 创建集群监控 ConfigMap
要配置 Prometheus Cluster Monitoring 堆栈,您必须创建集群监控 ConfigMap。
先决条件
-
安装了
ocCLI 工具 - 拥有集群的管理特权
流程
检查
cluster-monitoring-configConfigMap 对象是否存在:$ oc -n openshift-monitoring get configmap cluster-monitoring-config
如果不存在,请创建:
$ oc -n openshift-monitoring create configmap cluster-monitoring-config
开始编辑
cluster-monitoring-configConfigMap:$ oc -n openshift-monitoring edit configmap cluster-monitoring-config
如果
data部分不存在,则进行创建:apiVersion: v1 kind: ConfigMap metadata: name: cluster-monitoring-config namespace: openshift-monitoring data: config.yaml: |
1.2.3. 配置集群监控堆栈
您可以使用 ConfigMaps 配置 Prometheus Cluster Monitoring 堆栈。ConfigMaps 配置 Cluster Monitoring Operator,后者配置堆栈的组件。
先决条件
-
确保
cluster-monitoring-configConfigMap 带有data/config.yaml部分。
流程
开始编辑
cluster-monitoring-configConfigMap:$ oc -n openshift-monitoring edit configmap cluster-monitoring-config
将您的配置以键值对
<component_name>: <component_configuration>的形式放到data/config.yaml下:apiVersion: v1 kind: ConfigMap metadata: name: cluster-monitoring-config namespace: openshift-monitoring data: config.yaml: | <component>: <configuration_for_the_component>相应地替换
<component>和<configuration_for_the_component>。例如,创建以下 ConfigMap 来为 Prometheus 配置持久性卷声明 (PVC):
apiVersion: v1 kind: ConfigMap metadata: name: cluster-monitoring-config namespace: openshift-monitoring data: config.yaml: | prometheusK8s: volumeClaimTemplate: spec: storageClassName: fast volumeMode: filesystem resources: requests: storage: 40Gi此处的 prometheusK8s 定义 Prometheus 组件,后面几行则定义其配置。
- 保存文件以使改变生效。受新配置影响的 Pod 会自动重启。
1.2.4. 可配置的监控组件
下表显示了您可以配置的监控组件,以及 ConfigMap 中用来指定这些组件的键:
表 1.2. 可配置的监控组件
| 组件 | 键 |
|---|---|
| Prometheus Operator |
|
| Prometheus |
|
| Alertmanager |
|
| kube-state-metrics |
|
| openshift-state-metrics |
|
| Grafana |
|
| Telemeter Client |
|
| Prometheus Adapter |
|
在以上列表中,只有 Prometheus 和 Alertmanager 有许多配置选项。所有其他组件通常仅提供 nodeSelector 字段,用于部署到指定节点。
1.2.5. 将监控组件移到其他节点
您可以将任何监控堆栈组件移到特定的节点。
先决条件
-
确保
cluster-monitoring-configConfigMap 带有data/config.yaml部分。
流程
开始编辑
cluster-monitoring-configConfigMap:$ oc -n openshift-monitoring edit configmap cluster-monitoring-config
在
data/config.yaml下为组件指定nodeSelector约束:apiVersion: v1 kind: ConfigMap metadata: name: cluster-monitoring-config namespace: openshift-monitoring data: config.yaml: | <component>: nodeSelector: <node_key>: <node_value> <node_key>: <node_value> <...>相应地替换
<component>,并将<node_key>: <node_value>替换为用于指定目标节点的键值对映射。通常只使用一个键值对。组件只能在以各个指定键值对作为标签的节点上运行。节点也可以有附加标签。
例如,要将组件移到具有
foo: bar标签的节点上,请使用:apiVersion: v1 kind: ConfigMap metadata: name: cluster-monitoring-config namespace: openshift-monitoring data: config.yaml: | prometheusOperator: nodeSelector: foo: bar prometheusK8s: nodeSelector: foo: bar alertmanagerMain: nodeSelector: foo: bar kubeStateMetrics: nodeSelector: foo: bar grafana: nodeSelector: foo: bar telemeterClient: nodeSelector: foo: bar k8sPrometheusAdapter: nodeSelector: foo: bar openshiftStateMetrics: nodeSelector: node-role.kubernetes.io/infra: ""- 保存文件以使改变生效。受新配置影响的组件会自动移到新节点上。
其他资源
-
参阅 Kubernetes 文档来详细了解
nodeSelector约束。
1.2.6. 为监控组件分配容忍(tolerations)
您可以为任何监控堆栈组件分配容忍,以便将其移到污点。
先决条件
-
确保
cluster-monitoring-configConfigMap 带有data/config.yaml部分。
流程
开始编辑
cluster-monitoring-configConfigMap:$ oc -n openshift-monitoring edit configmap cluster-monitoring-config
为组件指定
tolerations:apiVersion: v1 kind: ConfigMap metadata: name: cluster-monitoring-config namespace: openshift-monitoring data: config.yaml: | <component>: tolerations: <toleration_specification>相应地替换
<component>和<toleration_specification>。例如,
oc adm taint nodes node1 key1=value1:NoSchedule污点可以防止调度程序将 Pod 放置到foo: bar节点中。要让alertmanagerMain组件忽略这个污点并且照常将alertmanagerMain放置到foo: bar,请使用以下容忍:apiVersion: v1 kind: ConfigMap metadata: name: cluster-monitoring-config namespace: openshift-monitoring data: config.yaml: | alertmanagerMain: nodeSelector: foo: bar tolerations: - key: "key1" operator: "Equal" value: "value1" effect: "NoSchedule"- 保存文件以使改变生效。这样就会自动应用新组件放置配置。
其他资源
- 参阅 OpenShift Container Platform 文档中有关污点和容忍的内容。
- 参阅 Kubernetes 文档中有关污点和容忍的内容。
1.2.7. 配置持久性存储
如果使用持久性存储运行集群监控,您的指标将保存在持久性卷(PV)中,并可在 Pod 重新启动或重新创建后保留。如果您需要预防指标或警报数据丢失,这是理想方案。在生产环境中,强烈建议配置持久性存储。由于 IO 需求很高,使用本地存储颇有优势。
请参阅建议的可配置存储技术。
先决条件
- 分配充足的专用本地持久性存储,以确保磁盘不会被填满。您需要的存储量取决于 Pod 的数目。如需有关持久性存储系统要求的信息,请参阅 Prometheus 数据库存储要求。
- 确保持久性卷 (PV) 已准备好以供持久性卷声明 (PVC) 使用,每个副本一个 PV。由于 Prometheus 有两个副本并且 Alertmanager 有三个副本,因此您需要五个 PV 来支持整个监控堆栈。PV 应该从 Local Storage Operator 中提供。如果启用了动态置备的存储,则这项要求不适用。
- 使用块存储类型。
- 配置本地持久性存储。
1.2.7.1. 配置本地持久性卷声明
要让 Prometheus 或 Alertmanager 使用持久性卷 (PV),您首先必须配置持久性卷声明 (PVC)。
先决条件
-
确保
cluster-monitoring-configConfigMap 带有data/config.yaml部分。
流程
编辑
cluster-monitoring-configConfigMap:$ oc -n openshift-monitoring edit configmap cluster-monitoring-config
将组件的 PVC 配置放在
data/config.yaml下:apiVersion: v1 kind: ConfigMap metadata: name: cluster-monitoring-config namespace: openshift-monitoring data: config.yaml: | <component>: volumeClaimTemplate: metadata: name: <PVC_name_prefix> spec: storageClassName: <storage_class> resources: requests: storage: <amount_of_storage>如需有关如何指定
volumeClaimTemplate的信息,请参阅 Kubernetes 文档中与 PersistentVolumeClaim 相关的内容。例如,若要配置一个 PVC 来声明用于 Prometheus 的本地持久性存储,请使用:
apiVersion: v1
kind: ConfigMap
metadata:
  name: cluster-monitoring-config
  namespace: openshift-monitoring
data:
  config.yaml: |
    prometheusK8s:
      volumeClaimTemplate:
        metadata:
          name: localpvc
        spec:
          storageClassName: local-storage
          resources:
            requests:
              storage: 40Gi
在上例中,由 Local Storage Operator 创建的存储类称为
local-storage。若要配置一个 PVC 来声明用于 Alertmanager 的本地持久性存储,请使用:
apiVersion: v1 kind: ConfigMap metadata: name: cluster-monitoring-config namespace: openshift-monitoring data: config.yaml: | alertmanagerMain: volumeClaimTemplate: metadata: name: localpvc spec: storageClassName: local-storage resources: requests: storage: 40Gi- 保存文件以使改变生效。受新配置影响的 Pod 会自动重启,并且应用新的存储配置。
1.2.7.2. 修改 Prometheus 指标数据的保留时间
默认情况下,Prometheus Cluster Monitoring 堆栈将 Prometheus 数据的保留时间配置为 15 天。您可以修改保留时间来更改将在多久后删除数据。
先决条件
-
确保
cluster-monitoring-configConfigMap 带有data/config.yaml部分。
流程
开始编辑
cluster-monitoring-configConfigMap:$ oc -n openshift-monitoring edit configmap cluster-monitoring-config
将保留时间配置放在
data/config.yaml下:apiVersion: v1 kind: ConfigMap metadata: name: cluster-monitoring-config namespace: openshift-monitoring data: config.yaml: | prometheusK8s: retention: <time_specification>将
<time_specification>替换为一个数字,后面紧跟ms(毫秒)、s(秒)、m(分钟)、h(小时)、d(天)、w(周)或y(年)。例如,若要将保留时间配置为 24 小时,请使用:
apiVersion: v1 kind: ConfigMap metadata: name: cluster-monitoring-config namespace: openshift-monitoring data: config.yaml: | prometheusK8s: retention: 24h- 保存文件以使改变生效。受新配置影响的 Pod 会自动重启。
1.2.8. 配置 Alertmanager
Prometheus Alertmanager 是管理传入警报的组件,其包括:
- 静默警报
- 禁止警报
- 聚合警报
- 可靠数据去重警报
- 分组警报
- 使用电子邮件、PagerDuty 和 HipChat 等接收工具以通知形式发送分组警报
1.2.8.1. Alertmanager 默认配置
OpenShift Container Platform Monitoring Alertmanager 集群的默认配置如下:
global:
  resolve_timeout: 5m
route:
  group_wait: 30s
  group_interval: 5m
  repeat_interval: 12h
  receiver: default
  routes:
  - match:
      alertname: Watchdog
    repeat_interval: 5m
    receiver: watchdog
receivers:
- name: default
- name: watchdog
OpenShift Container Platform 监控功能附带 Watchdog 警报,它会持续触发。Alertmanager 重复向通知提供程序发送 Watchdog 警报通知,例如: PagerDuty。此提供程序通常会在管理员停止收到 Watchdog 警告时通知管理员。这种机制有助于确保 Prometheus 的继续操作以及 Alertmanager 和通知提供程序之间的持续通信。
1.2.8.2. 应用自定义 Alertmanager 配置
您可以通过编辑 openshift-monitoring 命名空间中的 alertmanager-main secret,覆盖默认的 Alertmanager 配置。
先决条件
-
安装了用来处理 JSON 数据的
jq工具
流程
将当前活跃的 Alertmanager 配置输出到
alertmanager.yaml文件:$ oc -n openshift-monitoring get secret alertmanager-main --template='{{ index .data "alertmanager.yaml" }}' |base64 -d > alertmanager.yaml将
alertmanager.yaml文件中的配置改为您的新配置:global: resolve_timeout: 5m route: group_wait: 30s group_interval: 5m repeat_interval: 12h receiver: default routes: - match: alertname: Watchdog repeat_interval: 5m receiver: watchdog - match: service: <your_service> 1 routes: - match: <your_matching_rules> 2 receiver: <receiver> 3 receivers: - name: default - name: watchdog - name: <receiver> <receiver_configuration>例如,以下列表配置用于通知的 PagerDuty:
global:
  resolve_timeout: 5m
route:
  group_wait: 30s
  group_interval: 5m
  repeat_interval: 12h
  receiver: default
  routes:
  - match:
      alertname: Watchdog
    repeat_interval: 5m
    receiver: watchdog
  - match: service: example-app routes: - match: severity: critical receiver: team-frontend-page
receivers:
- name: default
- name: watchdog
- name: team-frontend-page pagerduty_configs: - service_key: "your-key"
采用此配置时,由
example-app服务触发的、严重性为critical的警报将使用team-frontend-page接收器发送;即,这些警报将传给选定人员。应用文件中的新配置:
$ oc -n openshift-monitoring create secret generic alertmanager-main --from-file=alertmanager.yaml --dry-run -o=yaml | oc -n openshift-monitoring replace secret --filename=-
其他资源
- 参阅 PagerDuty 官方网站来进一步了解 PagerDuty。
-
参阅 PagerDuty Prometheus 集成指南来学习如何检索
service_key。 - 参阅 Alertmanager 配置来配置通过不同警报接收器发送警报。
1.2.8.3. 警报规则
OpenShift Container Platform Cluster Monitoring 默认附带一组预定义的警报规则。
请注意:
- 默认的警报规则专门用于 OpenShift Container Platform 集群,别无它用。例如,您可以获得集群中持久性卷的警报,但不会获得自定义命名空间中持久性卷的警报。
- 目前无法添加自定义警报规则。
- 有些警报规则的名称相同。这是有意设计的。它们发送关于同一事件但具有不同阈值和/或不同严重性的警报。
- 在禁止规则中,触发较高的严重性时会禁止较低严重性。
1.2.8.4. 列出起作用的警报规则
您可以列出当前应用到集群的警报规则。
流程
配置所需的端口转发:
$ oc -n openshift-monitoring port-forward svc/prometheus-operated 9090
获取包含作用中警报规则及其属性的 JSON 对象:
$ curl -s http://localhost:9090/api/v1/rules | jq '[.data.groups[].rules[] | select(.type=="alerting")]'
[
  {
    "name": "ClusterOperatorDown",
    "query": "cluster_operator_up{job=\"cluster-version-operator\"} == 0",
    "duration": 600,
    "labels": {
      "severity": "critical"
    },
    "annotations": {
      "message": "Cluster operator {{ $labels.name }} has not been available for 10 mins. Operator may be down or disabled, cluster will not be kept up to date and upgrades will not be possible."
    },
    "alerts": [],
    "health": "ok",
    "type": "alerting"
  },
  {
    "name": "ClusterOperatorDegraded",
    ...
其他资源
- 另请参阅 Alertmanager 文档。
1.3. 管理集群警报
OpenShift Container Platform 4.2 为 Alertmanager 提供了一个 Web 界面,供您用于管理警报。本节演示如何使用 Alerting UI。
1.3.1. Alerting UI 的内容
本节演示并说明 Alerting UI 的内容,该 UI 是 Alertmanager 的 Web 界面。
Alerting UI 主要有三个页面,即 Alerts、Silences 和 YAML 页面。
若要访问 Alerts 页面,可在 OpenShift Container Platform Web 控制台中点击 Monitoring → Alerting → Alerts。
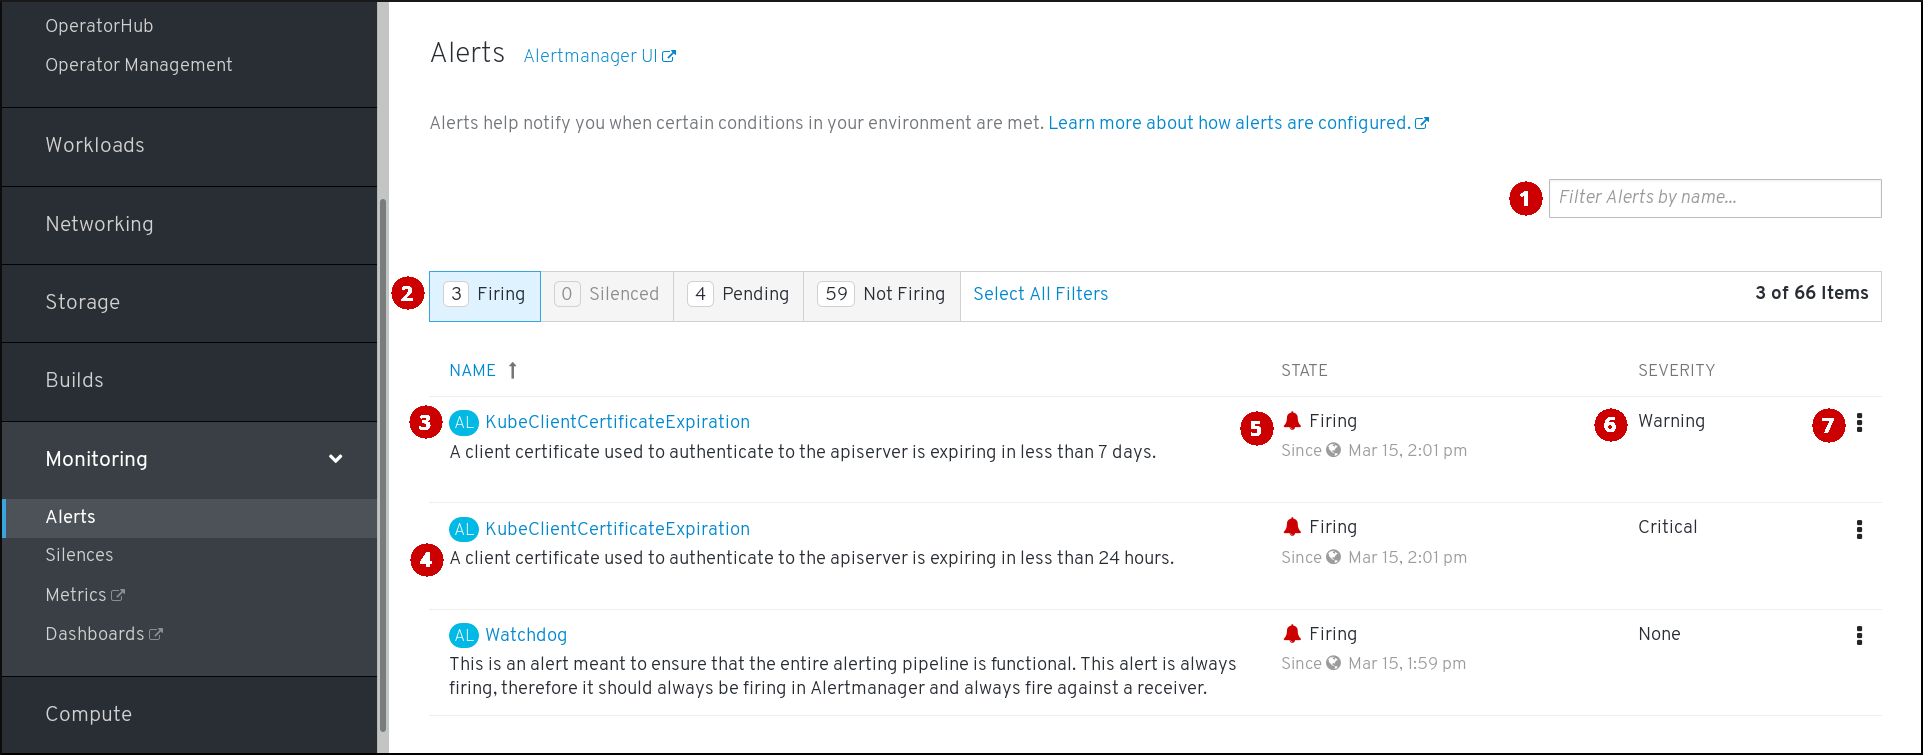
- 按名称过滤警报。
- 按状态过滤警报。若要触发警报,某些警报需要在超时时间内持续满足特定条件。如果警报的某一条件当前为真,但其超时时间尚未结束,那么这个警报处于 Pending 状态。
- 警报的名称。
- 警报的描述。
- 警报的当前状态,以及该警报进入此状态的时间。
- 警报的严重性标签值。
- 您可以对警报执行的操作。
若要访问 Silences 页面,可在 OpenShift Container Platform Web 控制台中点击 Monitoring → Alerting → Silences。
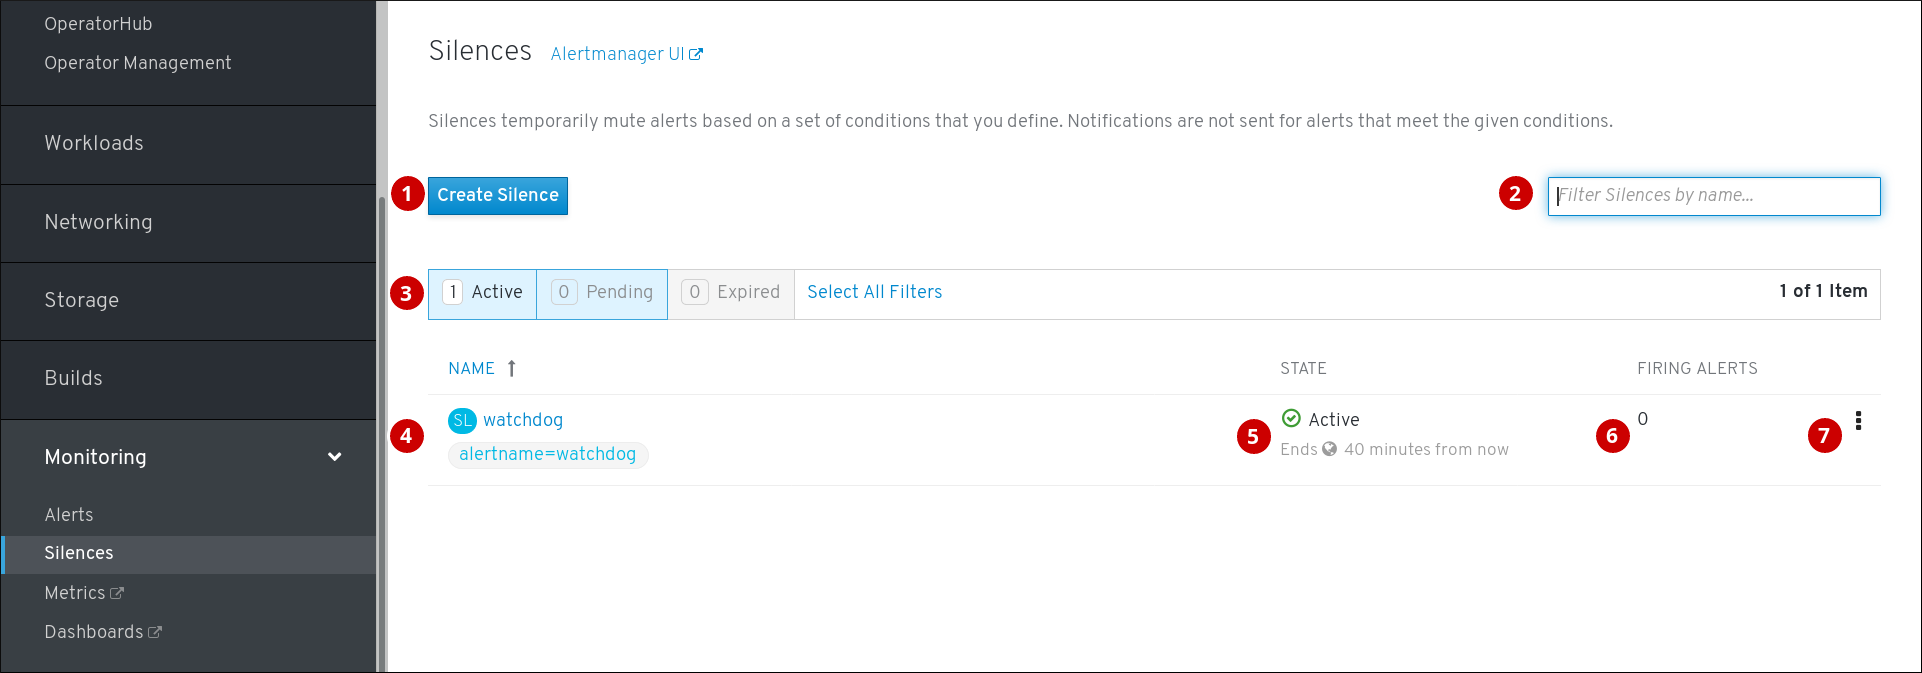
- 为警报创建静默。
- 按名字过滤静默。
- 按状态过滤静默。如果静默为待处理状态,这表示其当前不活跃,因为它已调度到以后的某一时间启动。如果静默已到期,这表示它不再活跃,因为已经达到其结束时间。
- 静默的描述。包括指定与之匹配的警报。
- 静默的当前状态。活跃的静默会显示何时结束,待处理的静默则显示何时启动。
- 被静默时设置为静默的警报数。
- 您可以对静默执行的操作。
若要访问 YAML 页面,可在 OpenShift Container Platform Web 控制台中点击 Monitoring → Alerting → YAML。
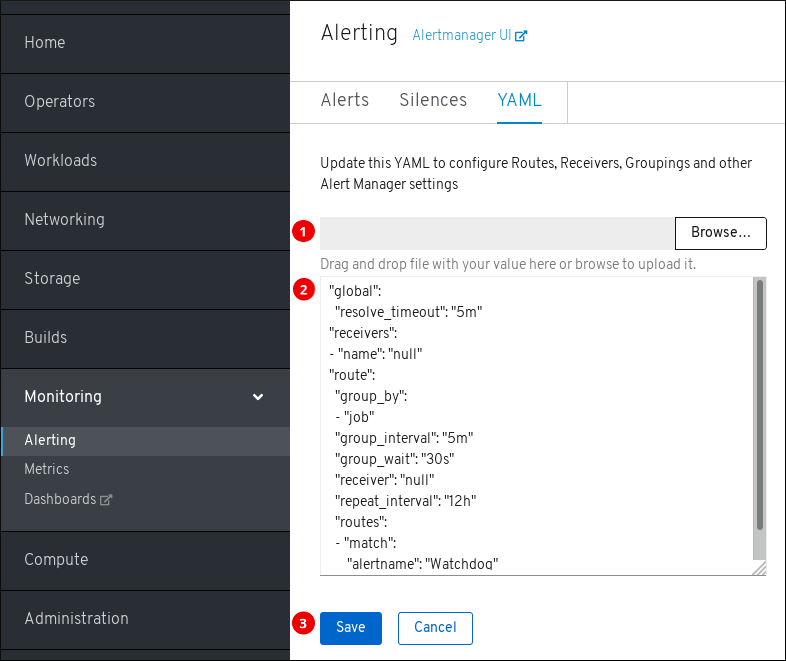
- 上传含有 Alertmanager 配置的文件。
- 检查并编辑当前的 Alertmanager 配置。
- 保存更新的 Alertmanager 配置。
另外,每个页面的标题旁边还有一个 Alertmanager 旧界面链接。
其他资源
- 参阅配置 Alertmanager 以进一步了解如何更改 Alertmanager 配置。
1.3.2. 获取关于警报和警报规则的信息
您可以查找警报,并查看有关这个警报或相关警报规则的信息。
流程
- 打开 OpenShift Container Platform Web 控制台,并浏览至 Monitoring → Alerting → Alerts 页面。
- 可选:使用 Filter Alerts by name 字段来按照名称过滤警报。
- 可选:使用 Firing、Silenced、Pending 和 Not firing 状态按钮中的一个或多个按钮来根据状态过滤警报。
- 可选:点击 Name、State 和 Severity 列标题中的一个或多个标题对警报进行排序。
在看到所需警报后,您可以查看该警报的详情或相关警报规则的详情。
要查看警报详情,请点击警报的名称。这是包含警报详情的页面:
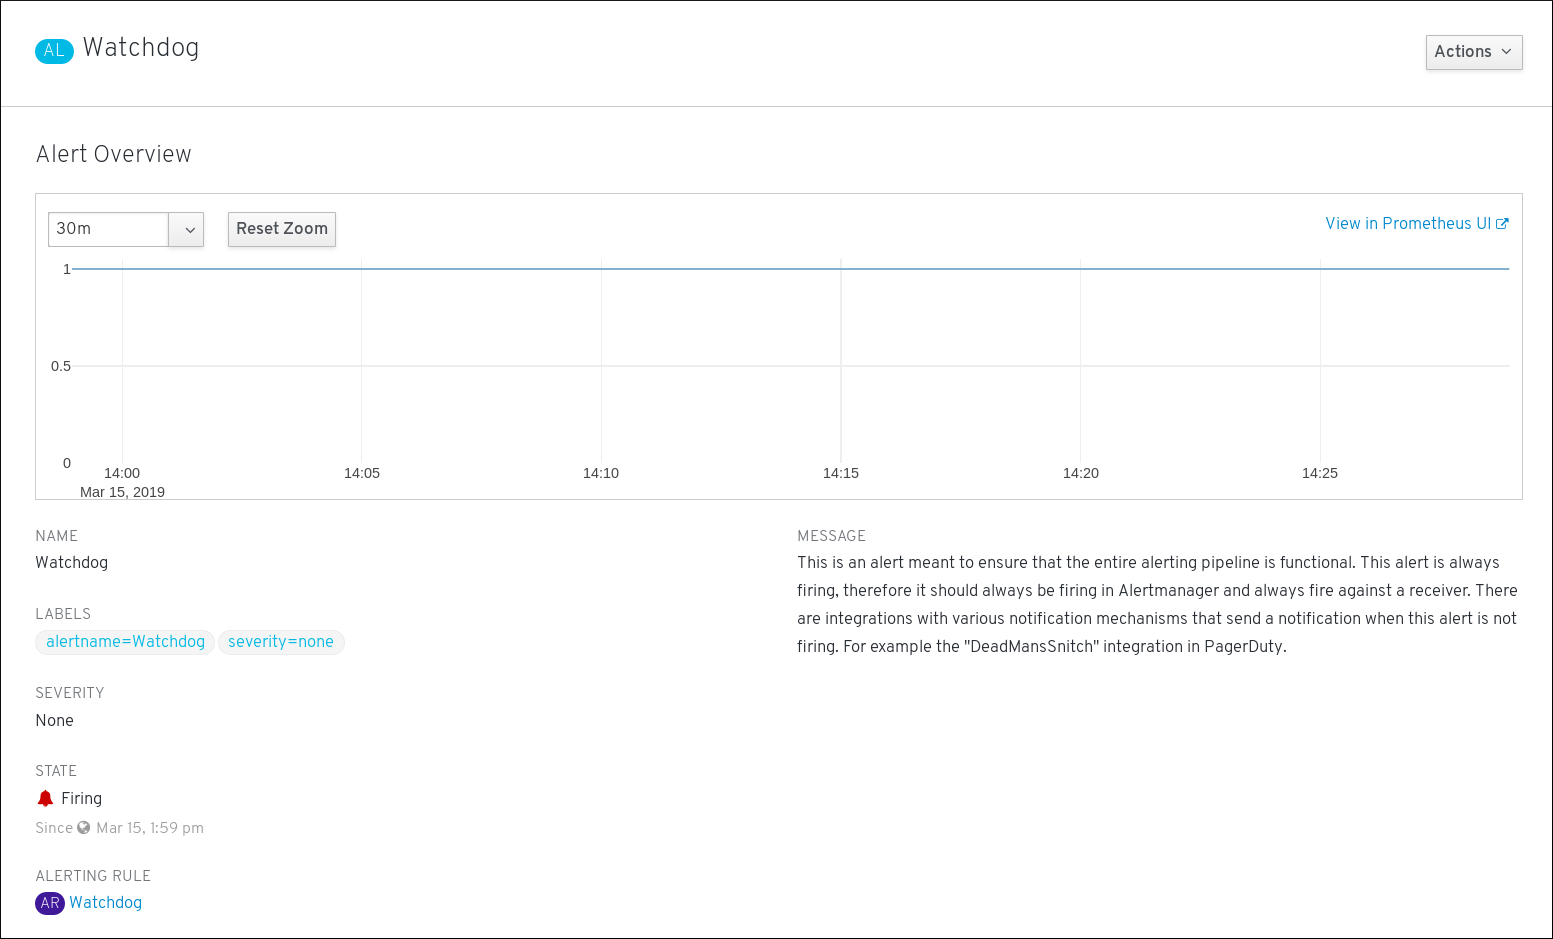
该页面包含注明警报时序的图形。还有与此警报相关的信息,包括:
- 其相关警报规则的链接
- 警报的描述
要查看警报规则详情,请点击最后一列中的按钮并选择 View Alerting Rule。这是包含警报规则详情的页面:
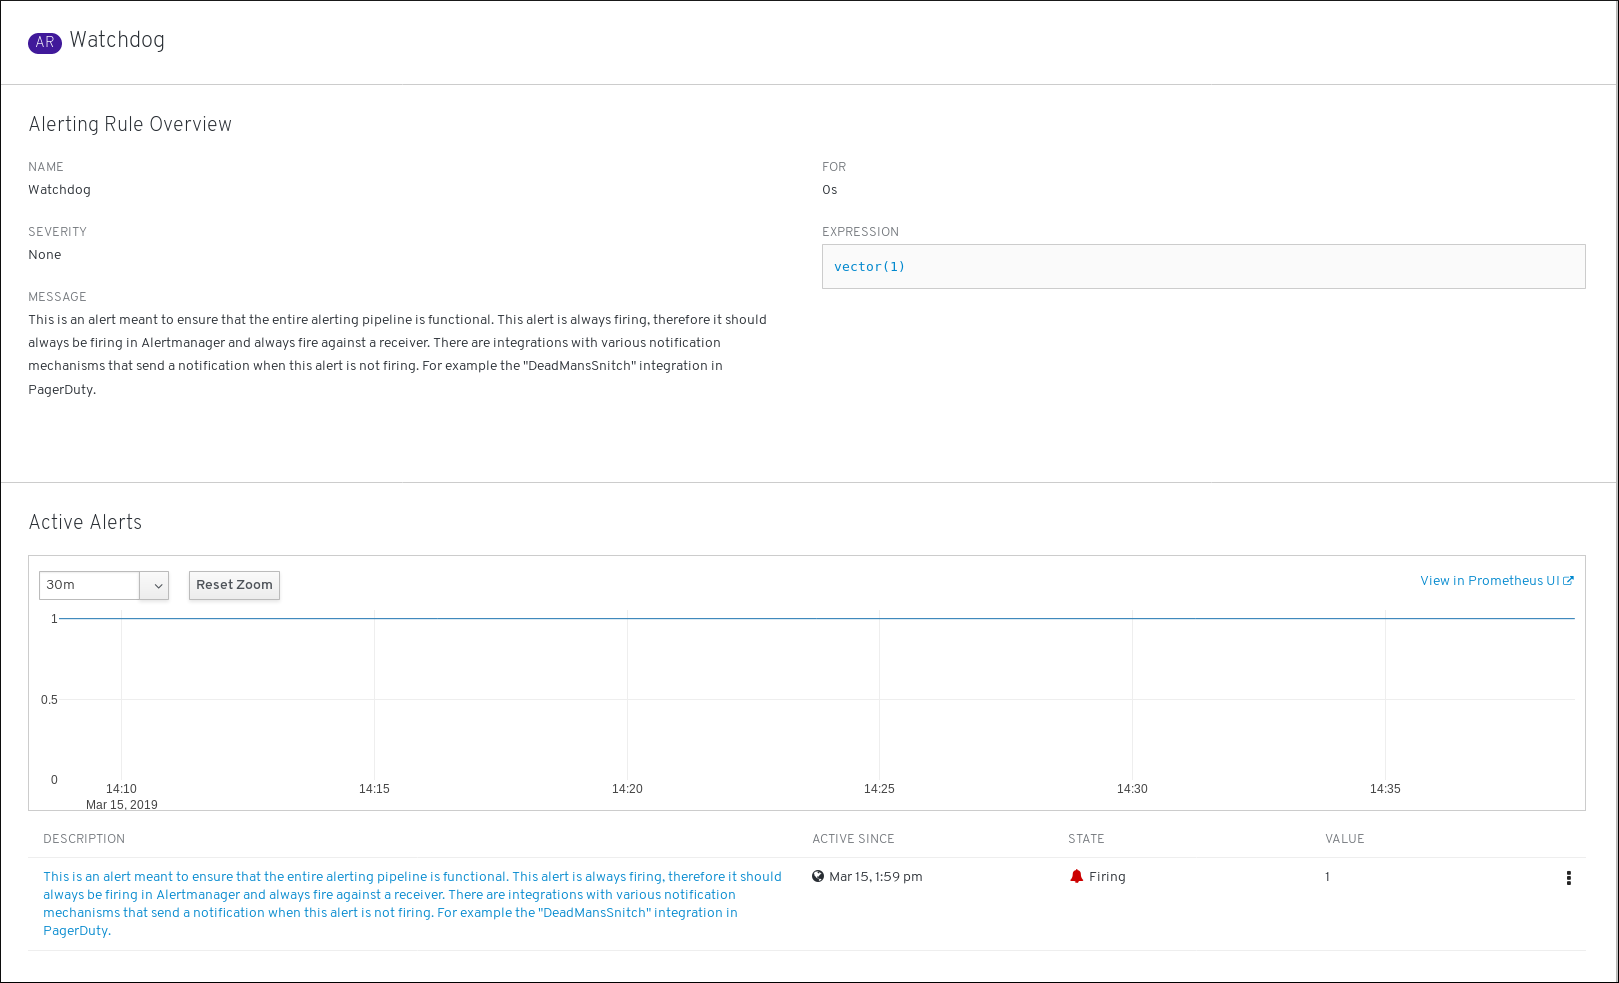
该页面包含与警报规则相关的信息,包括:
- 警报规则名称、严重性和描述
- 定义触发此警报的条件的表达式
- 触发警报的条件得到满足的时间
- 受警报规则约束的各个警报的图形,其中显示了触发该警报的值
- 受警报规则约束的所有警报的列表
1.3.3. 静默警报
您可以静默特定的警报,或者静默符合您定义的指定条件的警报。
流程
通过创建警报指定条件来静默一组警报:
- 浏览到 OpenShift Container Platform Web 控制台的 Monitoring → Alerting → Silences 页面。
- 点击 Create Silence。
- 填充 Create Silence 表单。
- 若要创建静默,请点击 Create。
静默特定的警报:
- 浏览到 OpenShift Container Platform Web 控制台的 Monitoring → Alerting → Alerts 页面。
- 针对您想要静默的警报,点击最后一列中的按钮,然后点击 Silence Alert。这时会显示 Create Silence 表单,其中预先填充了所选警报的指定条件。
- 可选:修改静默。
- 若要创建静默,请点击 Create。
1.3.4. 获取有关静默的信息
您可以查找静默并查看其详情。
流程
- 打开 OpenShift Container Platform Web 控制台,并浏览至 Monitoring → Alerting → Silences 页面。
- 可选:使用 Filter Silences by name 字段来按照名称过滤静默。
- 可选:使用 Active、Pending 和 Expired 状态按钮中的一个或多个按钮,以按状态过滤静默。
- 可选:点击 Name、State 和 Firing alerts 列标题中的一个或多个标题对静默进行排序。
看到所需静默后,您可以点击其名称查看详情,其中包括:
- 警报指定条件
- 状态
- 开始时间
- 结束时间
- 触发警报的数目和列表
1.3.5. 编辑静默
您可以编辑静默,这样会导致现有静默到期,并以更改后的配置创建新静默。
流程
- 浏览到 Monitoring → Alerting → Silences 页面。
针对您想要修改的静默,点击最后一列中的按钮,然后点击 Edit silence。
或者,也可以点击特定静默的 Silence Overview 页中的 Actions → Edit Silence。
- 在 Edit Silence 页中,输入您的更改,再点击 Save 按钮。这会使现有的静默到期,并以所选配置创建新静默。
1.3.6. 使静默到期
您可以让静默到期。让静默到期会永久停用这一静默。
流程
- 浏览到 Monitoring → Alerting → Silences 页面。
针对您想要令其到期的静默,点击最后一列中的按钮,然后点击 Expire Silence。
或者,也可以点击特定静默的 Silence Overview 页面中的 Actions → Expire Silence 按钮。
- 点击 Expire Silence 进行确认。这会使静默到期。
后续步骤
1.4. 检查集群指标
OpenShift Container Platform 4.2 为 Prometheus 提供了一个 Web 界面,可供您运行 Prometheus Query Language (PromQL) 查询并查看图表中呈现的指标。此功能提供集群状态的综合概览,并可供您用于排查问题。
1.4.1. Metrics UI 的内容
本节演示并说明 Metrics UI 的内容,该 UI 是 Prometheus 的 Web 界面。
若要访问 Metrics 页面,可在 OpenShift Container Platform Web 控制台中点击 Monitoring → Metrics。
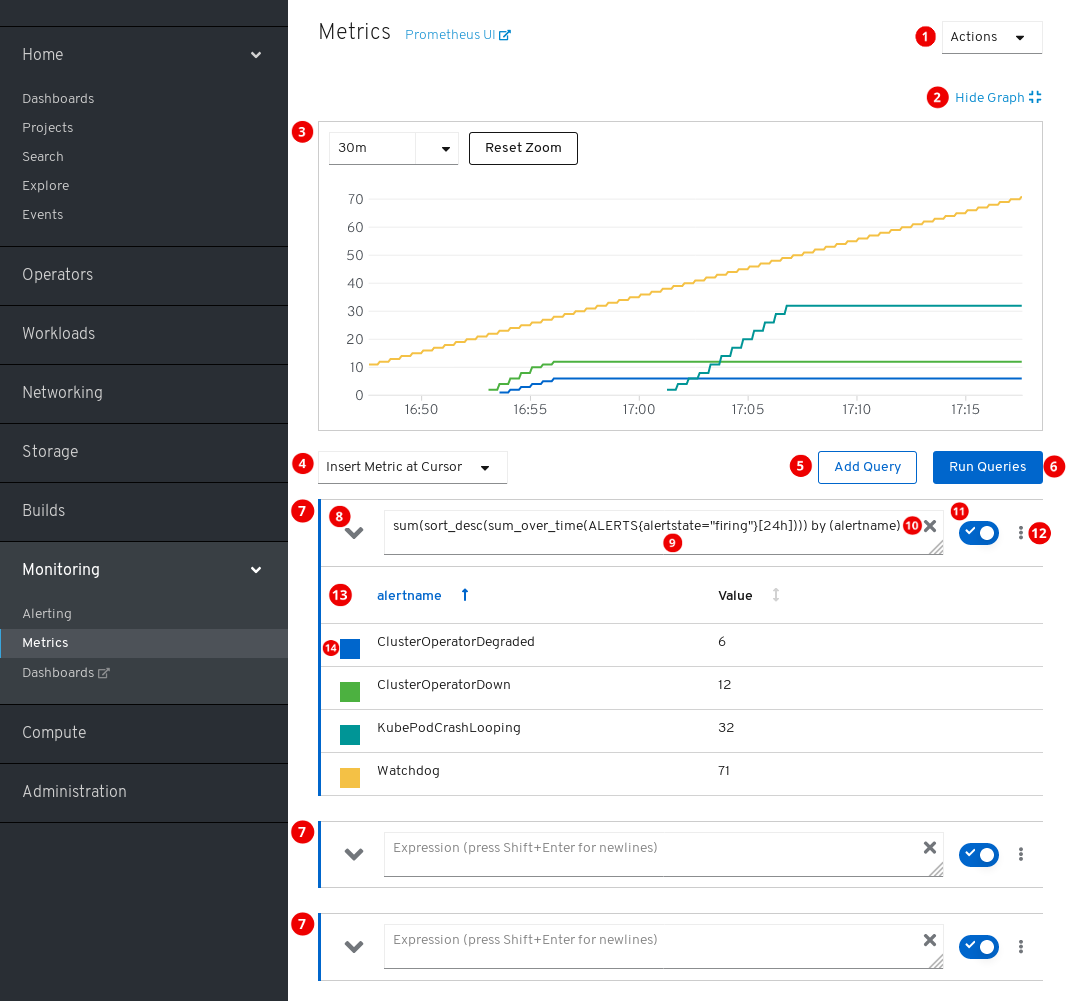
操作。
- 添加查询。
- 展开或折叠所有查询表。
- 删除所有查询。
- 隐藏图表。
- 交互式图表。
- 可用指标的目录。
- 添加查询。
- 运行查询。
- 查询表单。
- 展开或折叠表单。
- 查询。
- 清除查询。
- 启用或禁用查询。
特定查询的操作。
- 启用或禁用查询。
- 在图表中显示或隐藏查询的所有系列。
- 删除查询。
- 查询的指标表。
- 分配给指标图形的颜色。点击方块可以显示或隐藏指标图形。
另外,页面标题旁边也提供 Prometheus 旧界面的链接。
1.4.2. 运行指标查询
您可以通过输入一个或多个 Prometheus Query Language (PromQL) 查询来开始使用指标。
流程
- 打开 OpenShift Container Platform Web 控制台,并浏览至 Monitoring → Metrics 页面。
在查询字段中,输入您的 PromQL 查询。
- 要显示所有可用的指标和 PromQL 函数,请点击 Insert Metric at Cursor。
- 如需多个查询,请点击 Add Query。
-
若要删除查询,请点击查询的
 ,然后选择 Delete query。
- 若要保留查询但不运行查询,请点击 Disable query 按钮。
完成创建查询后,点击 Run Queries 按钮。图表中会直观呈现查询的指标。如果查询无效,则 UI 会显示错误消息。
注意如果查询对大量数据进行运算,这可能会在绘制时序图时造成浏览器超时或过载。要避免这种情况,请隐藏图形并且仅使用指标表来校准查询。然后,在找到可行的查询后,启用图表来绘制图形。
- 可选:页面 URL 现在包含您运行的查询。要在以后再次使用这一组查询,请保存这个 URL。
其他资源
1.4.3. 探索视觉化指标
运行查询后,指标会显示在交互式图表中。图表的 X 轴代表时间。Y 轴代表指标值。每个指标都以带颜色的图形显示。您可以操作图表并探索指标。
流程
最初,图表中显示所有启用的查询中的所有指标。您可以要选择显示哪些指标。
-
要隐藏查询的所有指标,请点击查询的
,然后点击 Hide all series。
- 要隐藏特定的指标,请转至查询表,然后点击指标名称旁边带颜色的方块。
-
要隐藏查询的所有指标,请点击查询的
要放大图表并更改显示的时间范围,请执行以下操作之一:
- 点击图表并在水平方向上拖动,以可视化方式选择时间范围。
- 使用左上角的菜单来选择时间范围。
要重置时间范围,请点击 Reset Zoom。
- 要显示所有查询在特定时间点的输出,请将鼠标光标停留在图表中的对应点上。弹出框中会显示查询输出。
- 如需有关特定查询的指标的详细信息,请使用下拉按钮展开该查询的表。每个指标均显示其当前的值。
- 要隐藏图表,请点击 Hide Graph。
1.5. 访问 Prometheus、Alertmanager 和 Grafana。
要使用监控堆栈收集的数据,您可能需要使用 Prometheus、Alertmanager 和 Grafana 界面。它们都默认可用。
1.5.1. 使用 Web 控制台访问 Prometheus、Alerting UI 和 Grafana
您可以使用 Web 浏览器,从 OpenShift Container Platform Web 控制台访问 Prometheus、Alerting 和 Grafana 的 Web UI。
此过程中访问的 Alerting UI 是 Alertmanager 的新界面。
先决条件
-
根据 OpenShift Container Platform 身份进行身份验证,并使用与 OpenShift Container Platform 其他位置相同的凭证或验证方式。您必须使用具有所有命名空间的读取访问权限的角色,如
cluster-monitoring-view集群角色。
流程
- 浏览到 OpenShift Container Platform Web 控制台并进行身份验证。
要访问 Prometheus,请浏览到 Monitoring → Metrics 页面。
要访问 Alerting UI,请浏览到 Monitoring → Alerting 页面。
要访问 Grafana,请浏览到 Monitoring → Dashboards 页面。
1.5.2. 直接访问 Prometheus、Alertmanager 和 Grafana
您可以使用 oc 工具和 Web 浏览器来访问 Prometheus、Alertmanager 和 Grafana 的 Web UI。
此过程中访问的 Alertmanager UI 是 Alertmanager 的旧界面。
先决条件
-
根据 OpenShift Container Platform 身份进行身份验证,并使用与 OpenShift Container Platform 其他位置相同的凭证或验证方式。您必须使用具有所有命名空间的读取访问权限的角色,如
cluster-monitoring-view集群角色。
流程
运行:
$ oc -n openshift-monitoring get routes
NAME                HOST/PORT                                                     ...
alertmanager-main   alertmanager-main-openshift-monitoring.apps._url_.openshift.com ...
grafana             grafana-openshift-monitoring.apps._url_.openshift.com           ...
prometheus-k8s      prometheus-k8s-openshift-monitoring.apps._url_.openshift.com    ...
在地址前附加
https://,您无法使用未加密的连接访问 Web UI。例如,这是为 Alertmanager 生成的 URL:
https://alertmanager-main-openshift-monitoring.apps._url_.openshift.com
- 使用 Web 浏览器浏览到该地址并进行身份验证。
其他资源
- 如需有关 Alertmanager 新界面的文档,请参阅管理集群警报。
监控路由由 Cluster Monitoring Operator 管理,用户不可修改。
第 2 章 公开用于自动扩展的自定义应用程序指标
您可以为 Pod 横向自动扩展导出自定义应用程序指标。
Prometheus Adapter 只是技术预览功能。技术预览功能不被红帽产品服务等级协议 (SLA) 支持,且可能在功能方面有缺陷。红帽不推荐在生产环境中使用它们。这些技术预览功能可以使用户提早试用新的功能,并有机会在开发阶段提供反馈意见。
有关红帽技术预览功能支持范围的详情,请参阅 https://access.redhat.com/support/offerings/techpreview/。
2.1. 公开用于 Pod 横向自动扩展的自定义应用程序指标
您可以使用 prometheus-adapter 资源,为 Pod 横向自动扩展显示自定义应用程序指标。
先决条件
-
确保安装了自定义 Prometheus 实例。本例中假定 Prometheus 已安装到
default命名空间。 -
确保为应用程序配置了监控功能。本例假定应用程序及服务监控器已安装到
default命名空间。
流程
-
为您的配置创建一个 YAML 文件。本例中称为
deploy.yaml。 添加相应的配置,以便为
prometheus-adapter创建服务帐户、必要角色和角色绑定:kind: ServiceAccount apiVersion: v1 metadata: name: custom-metrics-apiserver namespace: default --- apiVersion: rbac.authorization.k8s.io/v1 kind: ClusterRole metadata: name: custom-metrics-server-resources rules: - apiGroups: - custom.metrics.k8s.io resources: ["*"] verbs: ["*"] --- apiVersion: rbac.authorization.k8s.io/v1 kind: ClusterRole metadata: name: custom-metrics-resource-reader rules: - apiGroups: - "" resources: - namespaces - pods - services verbs: - get - list --- apiVersion: rbac.authorization.k8s.io/v1 kind: ClusterRoleBinding metadata: name: custom-metrics:system:auth-delegator roleRef: apiGroup: rbac.authorization.k8s.io kind: ClusterRole name: system:auth-delegator subjects: - kind: ServiceAccount name: custom-metrics-apiserver namespace: default --- apiVersion: rbac.authorization.k8s.io/v1 kind: RoleBinding metadata: name: custom-metrics-auth-reader namespace: kube-system roleRef: apiGroup: rbac.authorization.k8s.io kind: Role name: extension-apiserver-authentication-reader subjects: - kind: ServiceAccount name: custom-metrics-apiserver namespace: default --- apiVersion: rbac.authorization.k8s.io/v1 kind: ClusterRoleBinding metadata: name: custom-metrics-resource-reader roleRef: apiGroup: rbac.authorization.k8s.io kind: ClusterRole name: custom-metrics-resource-reader subjects: - kind: ServiceAccount name: custom-metrics-apiserver namespace: default --- apiVersion: rbac.authorization.k8s.io/v1 kind: ClusterRoleBinding metadata: name: hpa-controller-custom-metrics roleRef: apiGroup: rbac.authorization.k8s.io kind: ClusterRole name: custom-metrics-server-resources subjects: - kind: ServiceAccount name: horizontal-pod-autoscaler namespace: kube-system ---
添加
prometheus-adapter的自定义指标的配置:apiVersion: v1 kind: ConfigMap metadata: name: adapter-config namespace: default data: config.yaml: | rules: - seriesQuery: 'http_requests_total{namespace!="",pod!=""}' 1 resources: overrides: namespace: {resource: "namespace"} pod: {resource: "pod"} service: {resource: "service"} name: matches: "^(.*)_total" as: "${1}_per_second" 2 metricsQuery: 'sum(rate(<<.Series>>{<<.LabelMatchers>>}[2m])) by (<<.GroupBy>>)' ---添加将
prometheus-adapter注册为 API 服务的配置:apiVersion: v1 kind: Service metadata: annotations: service.alpha.openshift.io/serving-cert-secret-name: prometheus-adapter-tls labels: name: prometheus-adapter name: prometheus-adapter namespace: default spec: ports: - name: https port: 443 targetPort: 6443 selector: app: prometheus-adapter type: ClusterIP --- apiVersion: apiregistration.k8s.io/v1beta1 kind: APIService metadata: name: v1beta1.custom.metrics.k8s.io spec: service: name: prometheus-adapter namespace: default group: custom.metrics.k8s.io version: v1beta1 insecureSkipTLSVerify: true groupPriorityMinimum: 100 versionPriority: 100 ---显示要使用的 Prometheus Adapter 镜像:
$ kubectl get -n openshift-monitoring deploy/prometheus-adapter -o jsonpath="{..image}"
quay.io/openshift-release-dev/ocp-v4.2-art-dev@sha256:76db3c86554ad7f581ba33844d6a6ebc891236f7db64f2d290c3135ba81c264c
添加部署
prometheus-adapter的配置:apiVersion: apps/v1 kind: Deployment metadata: labels: app: prometheus-adapter name: prometheus-adapter namespace: default spec: replicas: 1 selector: matchLabels: app: prometheus-adapter template: metadata: labels: app: prometheus-adapter name: prometheus-adapter spec: serviceAccountName: custom-metrics-apiserver containers: - name: prometheus-adapter image: openshift-release-dev/ocp-v4.2-art-dev 1 args: - --secure-port=6443 - --tls-cert-file=/var/run/serving-cert/tls.crt - --tls-private-key-file=/var/run/serving-cert/tls.key - --logtostderr=true - --prometheus-url=http://prometheus-operated.default.svc:9090/ - --metrics-relist-interval=1m - --v=4 - --config=/etc/adapter/config.yaml ports: - containerPort: 6443 volumeMounts: - mountPath: /var/run/serving-cert name: volume-serving-cert readOnly: true - mountPath: /etc/adapter/ name: config readOnly: true - mountPath: /tmp name: tmp-vol volumes: - name: volume-serving-cert secret: secretName: prometheus-adapter-tls - name: config configMap: name: adapter-config - name: tmp-vol emptyDir: {}- 1
image: openshift-release-dev/ocp-v4.2-art-dev指定上一步中找到的 Prometheus Adapter 镜像。
将配置文件应用到集群:
$ oc apply -f deploy.yaml
- 现在,应用程序的指标已经公开,并可用于配置 Pod 横向自动扩展。
其他资源