
OVS-DPDK 종료일 종료일 가이드
문제 해결 절차를 종료하기 위한 OVS-DPDK 엔드가 포함된 가이드
초록
접두부
이 문서에는 Red Hat OpenStack Platform 13의 패킷 손실과 관련된 일반적인 문제를 식별하고 해결하기 위한 OVS-DPDK 시스템 관리자가 포함되어 있습니다. 이 가이드에 설명된 프로시저는 이전에 게시된 지식 베이스 문서를 대체합니다.
1장. 사전 점검
이 가이드에서는 다음 문서의 계획 및 배포 절차에 대해 잘 알고 있다고 가정합니다.
2장. OVS-DPDK 배포 검증
이 장에서는 배포를 수행하기 위한 검증 단계를 설명합니다.
2.1. OpenStack 확인
다음 명령을 사용하여 OpenStack 및 OVS-DPDK 구성을 확인합니다.
2.1.1. 네트워크 에이전트 표시
Alive 값이 True 이고 각 에이전트에 대해 상태가 UP 인지 확인합니다. 문제가 있는 경우 /var/ log/containers/neutron 및 에서 로그를 확인하여 문제를 확인합니다.
/var/ log/openvswitch/ovs-vswitchd.log
$ openstack network agent list

+------------------+------------------+------------------+-------------------+-------+-------+--------------------+
| ID               | Agent Type       | Host             | Availability Zone | Alive | State | Binary             |
+------------------+------------------+------------------+-------------------+-------+-------+--------------------+
| 19188fa7-50f1-4a | DHCP agent       | control-0.locald | nova              | True  | UP    | neutron-dhcp-agent |
| b1-a86c-         |                  | omain            |                   |       |       |                    |
| 986724e6e75d     |                  |                  |                   |       |       |                    |
| 6b58175c-a07e-49 | L3 agent         | control-0.locald | nova              | True  | UP    | neutron-l3-agent   |
| 56-a736-dc2a3f27 |                  | omain            |                   |       |       |                    |
| 2a34             |                  |                  |                   |       |       |                    |
| b4bc9e26-959c-   | Metadata agent   | control-0.locald | None              | True  | UP    | neutron-metadata-  |
| 402a-ab24-b7ccad |                  | omain            |                   |       |       | agent              |
| b8119f           |                  |                  |                   |       |       |                    |
| eb7df511-5e09-46 | Open vSwitch     | control-0.locald | None              | True  | UP    | neutron-           |
| 55-a82d-         | agent            | omain            |                   |       |       | openvswitch-agent  |
| 8aa52537f730     |                  |                  |                   |       |       |                    |
| fc1a71f0-06af-   | Open vSwitch     | compute-0.locald | None              | True  | UP    | neutron-           |
| 43e3-b48a-       | agent            | omain            |                   |       |       | openvswitch-agent  |
| f0923bcec843     |                  |                  |                   |       |       |                    |
+------------------+------------------+------------------+-------------------+-------+-------+--------------------+
2.1.2. Compute 서비스에서 호스트 표시
status 값이 enabled 이고 각 호스트에 대해 State 가 up 인지 확인합니다. 문제가 있는 경우 /var/log/containers/nova 의 로그를 참조하여 문제를 확인합니다.
$ openstack compute service list

+----+------------------+-----------------------+----------+---------+-------+----------------------------+
| ID | Binary           | Host                  | Zone     | Status  | State | Updated At                 |
+----+------------------+-----------------------+----------+---------+-------+----------------------------+
|  3 | nova-consoleauth | control-0.localdomain | internal | enabled | up    | 2019-02-06T16:21:52.000000 |
|  4 | nova-scheduler   | control-0.localdomain | internal | enabled | up    | 2019-02-06T16:21:51.000000 |
|  5 | nova-conductor   | control-0.localdomain | internal | enabled | up    | 2019-02-06T16:21:50.000000 |
|  6 | nova-compute     | compute-0.localdomain | dpdk     | enabled | up    | 2019-02-06T16:21:45.000000 |
+----+------------------+-----------------------+----------+---------+-------+----------------------------+
Red Hat OpenStack Platform 설정 확인에 대한 자세한 내용은 Upgrading Red Hat OpenStack Platform 가이드에서 컨테이너화된 오버클라우드 검증을 참조하십시오.
2.2. Compute 노드 OVS 구성 확인
네트워크 어댑터 및 OpenvSwitch의 구성 및 상태를 확인하려면 다음 단계를 완료합니다.
컴퓨팅 노드에서 DPDK 네트워크 장치를 확인하려면 다음 명령을 실행합니다. 이 rpm은 리포지토리:
rhel-7-server-extras-rpms에 있습니다.$ yum install dpdk-tools
DPDK에서 관리하는 네트워크 장치와 네트워킹에 사용되는 장치를 표시합니다.
$ dpdk-devbind --status
DPDK 드라이버를 사용하는 장치는 Tripleo 컴퓨팅 역할 템플릿의
ovs_유형입니다.dpdk_bond또는 ovs_dpdk_portNetwork devices using DPDK-compatible driver ============================================ 0000:04:00.1 'Ethernet 10G 2P X520 Adapter 154d' drv=vfio-pci unused= 0000:05:00.0 'Ethernet 10G 2P X520 Adapter 154d' drv=vfio-pci unused= Network devices using kernel driver =================================== 0000:02:00.0 'NetXtreme BCM5720 Gigabit Ethernet PCIe 165f' if=em1 drv=tg3 unused=vfio-pci *Active* 0000:02:00.1 'NetXtreme BCM5720 Gigabit Ethernet PCIe 165f' if=em2 drv=tg3 unused=vfio-pci 0000:03:00.0 'NetXtreme BCM5720 Gigabit Ethernet PCIe 165f' if=em3 drv=tg3 unused=vfio-pci 0000:03:00.1 'NetXtreme BCM5720 Gigabit Ethernet PCIe 165f' if=em4 drv=tg3 unused=vfio-pci *Active* 0000:04:00.0 'Ethernet 10G 2P X520 Adapter 154d' if=p1p1 drv=ixgbe unused=vfio-pci 0000:05:00.1 'Ethernet 10G 2P X520 Adapter 154d' if=p2p2 drv=ixgbe unused=vfio-pci
다음 명령을 실행하여 DPDK가 활성화되어 있는지 확인합니다.
$ sudo  ovs-vsctl get Open_vSwitch . iface_types

[dpdk, dpdkr, dpdkvhostuser, dpdkvhostuserclient, geneve, gre, internal, lisp, patch, stt, system, tap, vxlan]
다음 명령을 실행합니다. DPDK 호환 드라이버의 PCI 장치(예:
0000:04:00.1및:05:00.0)를표시합니다.유형: dpdk로$ ovs-vsctl show Bridge "br-link0" Controller "tcp:127.0.0.1:6633" is_connected: true fail_mode: secure Port "phy-br-link0" Interface "phy-br-link0" type: patch options: {peer="int-br-link0"} Port "dpdkbond0" Interface "dpdk1" type: dpdk options: {dpdk-devargs="0000:04:00.1", n_rxq="2"} Interface "dpdk0" type: dpdk options: {dpdk-devargs="0000:05:00.0", n_rxq="2"} Port "br-link0" Interface "br-link0" type: internal ovs_version: "2.9.0"다음 출력에는 오류가 표시됩니다.
Port "dpdkbond0"
           Interface "dpdk1"
               type: dpdk
               options: {dpdk-devargs="0000:04:00.1", n_rxq="2"}
               error: "Error attaching device '0000:04:00.1' to DPDK"
인터페이스에 대한 세부 정보를 표시하려면 다음 명령을 실행합니다.
$ sudo ovs-vsctl list interface dpdk1 | egrep "name|mtu|options|status"
다음 명령을 실행합니다. lacp는 활성화되어 있지 않습니다.
$ ovs-appctl bond/show dpdkbond0

bond_mode: active-backup
bond may use recirculation:
no, Recirc-ID : -1
bond-hash-basis: 0
updelay: 0 ms
downdelay: 0 ms
lacp_status: off
lacp_fallback_ab: false
active slave mac: a0:36:9f:e5:da:82(dpdk1)

slave dpdk0: enabled
    may_enable: true

slave dpdk1: enabled
    active slave
    may_enable: true
빠른 데이터 경로(사용자 공간) 네트워킹을 위해 컴퓨팅 노드의 모든 ovs 브리지가
netdev인지 확인합니다.참고시스템(kernel)과 netdev(사용자 공간) 데이터 경로 유형을 혼합하는 것은 지원되지 않습니다.
$ ovs-vsctl list bridge | grep -e name -e datapath_type

datapath_type       : netdev
name                : br-int
datapath_type       : netdev
name                : "br-link0"
다음 명령을 실행하여 영구 Open vSwitch 오류를 확인합니다.
$ grep ERROR /var/log/openvswitch/ovs-vswitchd.log
2.3. 인스턴스 구성을 위한 OVS 확인
vhostuserECDHE가 작동하도록 하려면 플레이버를 사용하여 전용 CPU 및 대규모 페이지를 사용하도록 OVS-DPDK 포트로 인스턴스를 구성합니다. 자세한 내용은 다음에서 3단계를 참조하십시오. 플레이버를 생성하고 OVS-DPDK의 인스턴스를 배포 합니다.
인스턴스 구성을 확인하려면 다음 단계를 완료합니다.
인스턴스에 고정 CPU가 있는지 확인합니다. 전용 CPU는
virsh로 식별할 수 있습니다.$ sudo virsh vcpupin 2
인스턴스에 사용된 에뮬레이터 스레드가 해당 인스턴스에 할당된 동일한 vCPU에서 실행되지 않는지 확인합니다.
$ sudo virsh emulatorpin 2
참고Red Hat OpenStack Platform 12부터는 플레이버에서 에뮬레이터 스레드를 실행할 위치를 선택할 수 있습니다. Red Hat OpenStack Platform 12를 사용하여 에뮬레이터 스레드 정책 구성을 참조하십시오.
이전 버전의 경우 인스턴스의 전원이 켜질 때 에뮬레이터 스레드 고정을 수동으로 수행해야 합니다. isolcpus를 사용하거나 최적의 에뮬레이터 스레드 고정을 사용하여 NFV와 함께 NFV에서 virsh emulatorpin을 사용하는 경우의 영향을 참조하십시오.
인스턴스가 대규모 페이지를 사용하고 있는지 확인합니다. 이는 최적의 성능을 위해 필요합니다.
$ sudo virsh numatune 1
인스턴스의 수신 대기열이 폴링 모드 드라이버(PMD)에 의해 서비스되고 있는지 확인합니다.
포트 및 대기열은 PMD에서 동등하게 균형을 유지해야 합니다. 최적으로 네트워크 어댑터와 동일한 NUMA 노드의 CPU에 의해 포트가 서비스됩니다.
$ sudo ovs-appctl dpif-netdev/pmd-rxq-show

pmd thread numa_id 0 core_id 2:
    isolated : false
    port: dpdk0               queue-id:  1    pmd usage:  0 %
    port: dpdk1               queue-id:  0    pmd usage:  0 %
    port: vhu94ccc316-ea      queue-id:  0    pmd usage:  0 %
pmd thread numa_id 1 core_id 3:
    isolated : false
pmd thread numa_id 0 core_id 22:
    isolated : false
    port: dpdk0               queue-id:  0    pmd usage:  0 %
    port: dpdk1               queue-id:  1    pmd usage:  0 %
    port: vhu24e6c032-db      queue-id:  0    pmd usage:  0 %
pmd thread numa_id 1 core_id 23:
    isolated : false
PMD에 대한 통계를 표시합니다. 이를 통해 PMD에서 대기열의 균형이 얼마나 잘 맞는지 확인할 수 있습니다. 자세한 내용은 Open vSwitch 설명서의 PMD Threads 를 참조하십시오.
참고pmd-rxq-rebalance옵션이 OVS 2.9.0에 추가되었습니다. 이 명령은 최신 rxq 처리 주기 정보를 기반으로 PMD 간에 균형을 유지하기 위해 새 PMD 큐 할당을 수행합니다.pmd-stats-show명령은 PMD가 실행 중이거나 통계가 마지막으로 삭제된 이후의 전체 기록을 표시합니다. 정리되지 않은 경우 포트가 설정되기 전에 통계에 통합되고 데이터가 전달되었습니다. 데이터 경로의 로드를 확인하는 데 사용되는 경우(일반적으로)는 쓸모가 없을 것입니다.시스템을 안정적인 상태로 만들고 통계를 지우고 몇 초 동안 기다린 다음 통계를 표시하는 것이 가장 좋습니다. 이는 데이터 경로에 대한 정확한 설명을 제공합니다.
다음 명령을 사용하여 PMD에 대한 통계를 표시합니다.
$ sudo ovs-appctl dpif-netdev/pmd-stats-show

pmd thread numa_id 0 core_id 2:
    packets received: 492207
    packet recirculations: 0
    avg. datapath passes per packet: 1.00
    emc hits: 419949
    megaflow hits: 2485
    avg. subtable lookups per megaflow hit: 1.33
    miss with success upcall: 69773
    miss with failed upcall: 0
    avg. packets per output batch: 1.00
    idle cycles: 1867450752126715 (100.00%)
    processing cycles: 5274066849 (0.00%)
    avg cycles per packet: 3794046054.19 (1867456026193564/492207)
    avg processing cycles per packet: 10715.14 (5274066849/492207)
pmd thread numa_id 1 core_id 3:
    packets received: 0
    packet recirculations: 0
    avg. datapath passes per packet: 0.00
    emc hits: 0
    megaflow hits: 0
    avg. subtable lookups per megaflow hit: 0.00
    miss with success upcall: 0
    miss with failed upcall: 0
    avg. packets per output batch: 0.00
pmd thread numa_id 0 core_id 22:
    packets received: 493258
    packet recirculations: 0
    avg. datapath passes per packet: 1.00
    emc hits: 419755
    megaflow hits: 3223
    avg. subtable lookups per megaflow hit: 1.49
    miss with success upcall: 70279
    miss with failed upcall: 1
    avg. packets per output batch: 1.00
    idle cycles: 1867449561100794 (100.00%)
    processing cycles: 6465180459 (0.00%)
    avg cycles per packet: 3785961963.68 (1867456026281253/493258)
    avg processing cycles per packet: 13107.10 (6465180459/493258)
pmd thread numa_id 1 core_id 23:
    packets received: 0
    packet recirculations: 0
    avg. datapath passes per packet: 0.00
    emc hits: 0
    megaflow hits: 0
    avg. subtable lookups per megaflow hit: 0.00
    miss with success upcall: 0
    miss with failed upcall: 0
    avg. packets per output batch: 0.00
main thread:
    packets received: 16
    packet recirculations: 0
    avg. datapath passes per packet: 1.00
    emc hits: 1
    megaflow hits: 9
    avg. subtable lookups per megaflow hit: 1.00
    miss with success upcall: 6
    miss with failed upcall: 0
    avg. packets per output batch: 1.00
PMD 통계를 재설정합니다.
pmd-stats-show명령은 마지막pmd-stats-clear명령 이후 PMD 통계를 표시합니다. 이전pmd-stats-clear가 발행된 경우 PMD가 실행을 시작한 이후의 데이터가 포함됩니다.로드 중인 시스템을 검사하는 경우 PMD 통계를 지우고 이를 표시하는 것이 유용합니다. 그렇지 않으면 트래픽 흐름 전에 시스템이 로드되지 않은 이전 시점의 데이터를 통계에 포함할 수도 있습니다.
다음 명령을 사용하여 PMD 통계를 재설정합니다.
$ sudo ovs-appctl dpif-netdev/pmd-stats-clear
2.4. 기타 유용한 명령
이러한 명령을 사용하여 추가 검증 검사를 수행합니다.
os-net-config로 구성된 OVS-DPDK 포트 및 물리적 NIC 매핑을 찾습니다.
cat /var/lib/os-net-config/dpdk_mapping.yaml
Nova 인스턴스 $ID가 있는 인스턴스의 DPDK 포트를 찾습니다.
sudo ovs-vsctl find interface external_ids:vm-uuid="$ID" | grep ^name
DPDK 포트를 사용하여 인스턴스의 Nova ID 검색
sudo ovs-vsctl get interface vhu24e6c032-db external_ids:vm-uuid
dpdk 포트에서 tcpdump 수행
sudo ovs-tcpdump -i vhu94ccc316-ea
OVS-tcpdump 는 rhel-7-server-openstack-13-devtools-rpms 리포지토리에 있는 openvswitch-test RPM에서 가져온 것입니다.
성능 문제를 위해 ovs-tcpdump 는 프로덕션 환경에 권장되지 않습니다. 자세한 내용은 다음을 참조하십시오. Red Hat OpenStack Platform의 vhost-user 인터페이스에서 ovs-tcpdump를 사용하는 방법은 무엇입니까?
2.5. 간단한 Compute 노드 CPU 파티셔닝 및 메모리 검사
사전 요구 사항
배포된 컴퓨팅 노드에서 이 명령을 실행하고 cpu 마스크가 TripleO Heat Template 값에 매핑되는 방법을 확인합니다.
$ sudo ovs-vsctl get Open_vSwitch . other_config

{dpdk-init="true", dpdk-lcore-mask="300003", dpdk-socket-mem="3072,1024", pmd-cpu-mask="c0000c"}
다음을 확인합니다.
-
DPDK-lcore-mask는 TripleO Heat템플릿의 OvsDpdkCoreList에 매핑됩니다. -
TripleO Heat
템플릿의 DPDK-socket-mem이 OvsDpdkSocketMemory에 매핑됩니다. PMD-cpu-mask는 TripleO Heat템플릿의 OvsPmdCoreList에 매핑됩니다.이러한 cpu 마스크를 TripleO Heat Templates로 다시 조정할 수 있는 10진수 값으로 변환하려면 다음을 참조하십시오. 16진수 CPU 마스크를 비트 마스크로 변환하고 마스킹된 CPU를 식별하는 방법은 무엇입니까?
2.5.1. CPU 감지
pid 1의 CPU를 감지하려면 다음 명령을 사용합니다. PMD 또는 Nova vCPU는 다음 코어에서 실행되지 않아야 합니다.
$ taskset -c -p 1

pid 1's current affinity list: 0,1,20,21
2.5.2. PMD 스레드 감지
PMD 스레드를 보려면 다음 명령을 사용합니다. 출력에 Tripleo 매개변수 OvsPmdCoreList 의 값이 반영되어야 합니다. Tripleo 매개변수 OvsDpdkCoreList 또는 의 값과 겹치지 않아야 합니다.
HostIsolatedCores list
$ ps -T -o spid,comm -p $(pidof ovs-vswitchd) |grep '\<pmd' |while read spid name; do echo $name $(taskset -p -c $spid); done

pmd44 pid 679318's current affinity list: 3
pmd45 pid 679319's current affinity list: 23
pmd46 pid 679320's current affinity list: 22
pmd47 pid 679321's current affinity list: 2
2.5.3. NUMA 노드 감지
최적의 성능을 위해 인스턴스의 물리적 네트워크 어댑터, PMD 스레드 및 고정 CPU가 모두 동일한 NUMA 노드에 있는지 확인합니다. 자세한 내용은 다음을 참조하십시오. CPU 및 NUMA 노드.
다음은 NUMA 할당 검사를 위한 간단한 방법입니다.
컴퓨팅 노드에서 인스턴스의 vhu 포트를 검사합니다.
$ sudo virsh domiflist 1

Interface  Type       Source     Model       MAC
-------------------------------------------------------
vhu24e6c032-db vhostuser  -          virtio      fa:16:3e:e3:c4:c2
해당 포트를 서비스하는 PMD 스레드를 검사하고 NUMA 노드를 확인합니다.
$ sudo ovs-appctl dpif-netdev/pmd-rxq-show

pmd thread numa_id 0 core_id 2:
    isolated : false
    port: vhu24e6c032-db      queue-id:  0    pmd usage:  0 %
    port: vhu94ccc316-ea      queue-id:  0    pmd usage:  0 %
인스턴스에 대한 물리적 고정된 cpu를 찾습니다. 예를 들어 이 인스턴스의 포트는 cpu 2에 있으며 인스턴스는 cpus 34 및 6에 의해 제공됩니다.
$ sudo virsh dumpxml 1 | grep cpuset

    <vcpupin 1 vcpu='0' cpuset='34'/>
    <emulatorpin cpuset='6'/>
각 NUMA 노드의 코어를 검사합니다. 인스턴스를 서비스하는 CPU(34,6)는 동일한 NUMA 노드(0)에 있습니다.
$ lscpu | grep ^NUMA

NUMA node(s):          2
NUMA node0 CPU(s):     0,2,4,6,8,10,12,14,16,18,20,22,24,26,28,30,32,34,36,38
NUMA node1 CPU(s):     1,3,5,7,9,11,13,15,17,19,21,23,25,27,29,31,33,35,37,39
또한 OVS DPDK에서 관리하지 않는 네트워크 어댑터에는 해당 어댑터에 속하는 NUMA 노드를 나타내는 항목이 있습니다.
$ sudo cat /sys/class/net/<device name>/device/numa_node
또는 OVS DPDK에서 관리하는 경우 PCI 주소를 쿼리하여 네트워크 어댑터의 NUMA 노드를 볼 수 있습니다.
$ sudo lspci -v -s 05:00.1 | grep -i numa

Flags: bus master, fast devsel, latency 0, IRQ 203, NUMA node 0
이러한 관행은 PMD, 인스턴스 및 네트워크 어댑터가 모두 NUMA 0에 있음을 보여줍니다. openvswitch 로그( /var/log/openvswitch에 위치)에서 교차 NUMA 폴링을 나타내는 경우 다음과 유사한 로그 항목을 찾습니다.
dpif_netdev|WARN|There's no available (non-isolated) pmd thread on numa node 0. Queue 0 on port 'dpdk0' will be assigned to the pmd on core 7 (numa node 1). Expect reduced performance.
2.5.4. 분리된 CPU 감지
다음 명령을 사용하여 분리된 CPU를 표시합니다. 출력은 TripleO 매개 변수 IsolCpusList 의 값과 동일해야 합니다.
$ cat /etc/tuned/cpu-partitioning-variables.conf | grep -v ^#

isolated_cores=2-19,22-39
2.5.5. Nova 인스턴스에 전용 CPU 감지
다음 명령을 사용하여 Nova 인스턴스 전용 CPU를 표시합니다. 이 출력은 PMD( poll mode driver) CPU 없이 isolcpus의 값과 동일해야 합니다.
$ grep ^vcpu_pin_set /var/lib/config-data/puppet-generated/nova_libvirt/etc/nova/nova.conf

vcpu_pin_set=4-19,24-39
2.5.6. 대규모 페이지 설정 확인
계산 노드에서 대규모 페이지 구성을 확인합니다.
[root@compute-0 ~]# cat /sys/devices/system/node/node*/meminfo  | grep -i huge
Node 0 AnonHugePages:      4096 kB
Node 0 HugePages_Total:    16
Node 0 HugePages_Free:     11
Node 0 HugePages_Surp:      0
Node 1 AnonHugePages:      8192 kB
Node 1 HugePages_Total:    16
Node 1 HugePages_Free:     15
Node 1 HugePages_Surp:      0
대규모 페이지가 구성되어 있지 않거나 소진된 경우 KernelArgs를 참조하십시오.
2.6. 패킷 드롭다운의 원인
일반적으로 큐가 충분히 빨리 드레이닝되지 않은 경우 패킷이 큐가 가득 찼을 때 삭제됩니다. 병목 현상이 발생하면 대기열이 충분히 빨리 드레이닝되지 않을 때 큐를 드레이닝해야 하는 엔티티입니다. 대부분의 경우 드롭 카운터는 삭제된 패킷을 추적하는 데 사용됩니다. 하드웨어 또는 소프트웨어 설계 버그로 인해 패킷이 드롭 카운터를 건너뛸 수 있습니다.
DPDK(Data Plan Development Kit)에는 패킷 전달을 위한 testpmd 애플리케이션이 포함되어 있습니다. 이 장에 표시된 시나리오에서 testpmd 는 VM에 설치되고 할당된 논리 코어(lcores)가 있는 포트를 폴링하여 한 포트에서 다른 포트로 패킷을 전달합니다. testpmd 는 일반적으로 테스트할 트래픽 생성기와 함께 사용됩니다. 이 경우 물리적 가상 물리적(PVP) 경로의 처리량을 처리량으로 사용합니다.
2.6.1. 물리적 NIC 드레이닝에 OVS-DPDK Too Slow
이 예에서는 PMD 스레드가 물리적 네트워크 어댑터(dpdk0)의 수신(RX) 큐를 폴링하는 작업을 수행함을 보여줍니다. PMD 스레드가 패킷 볼륨을 따라 유지할 수 없거나 중단된 경우 패킷이 삭제될 수 있습니다.
그림 2.1. 물리적 어댑터 RX 큐 폴링
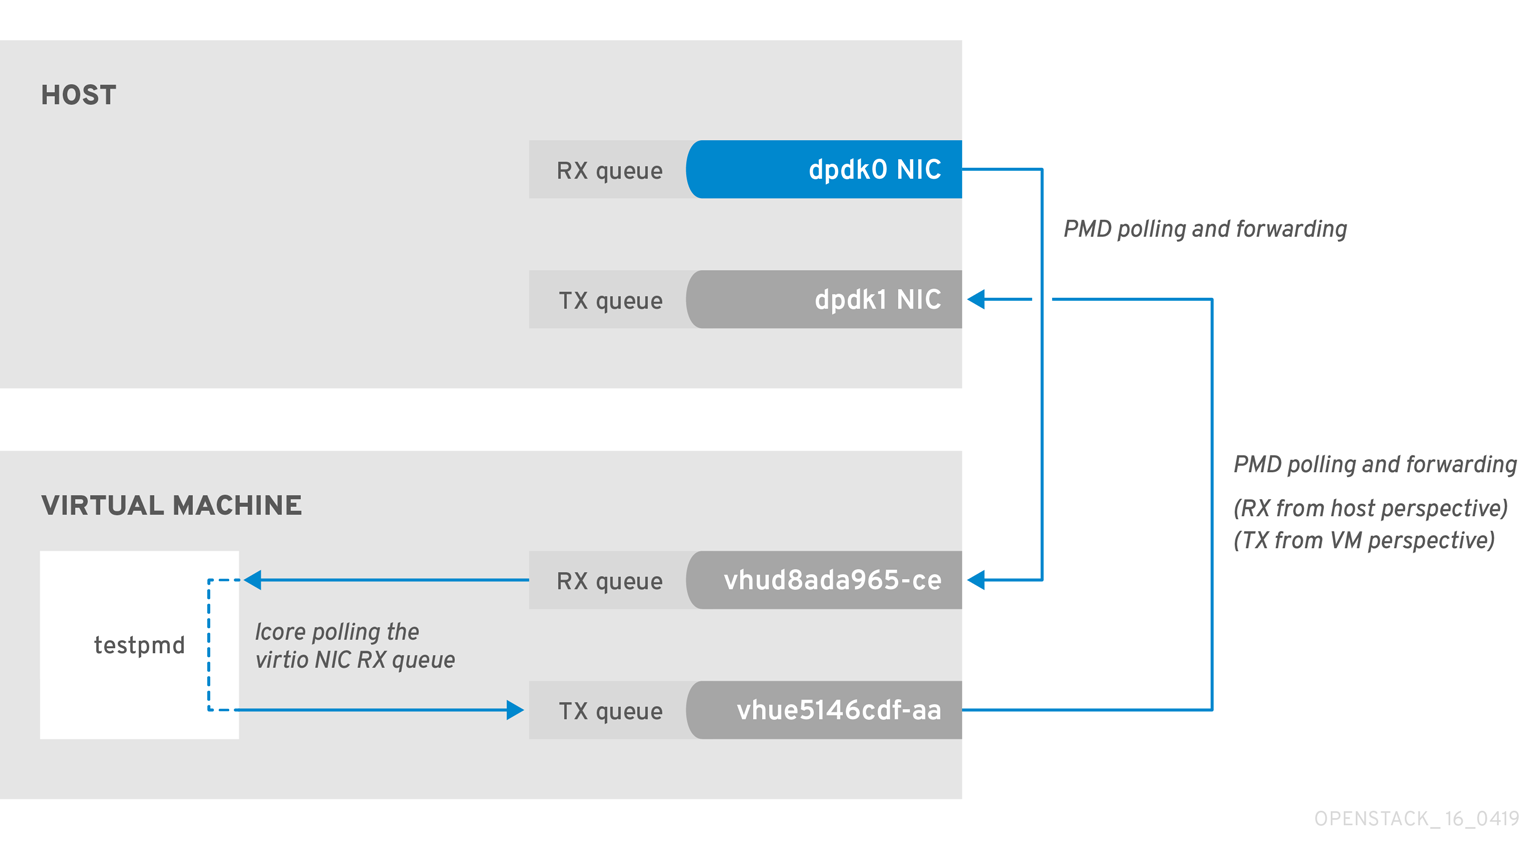
다음 명령은 dpdk0 인터페이스의 통계를 보여줍니다. ovs-dpdk가 물리적 어댑터를 충분히 빠르게 드레이닝하지 않기 때문에 패킷이 삭제되는 경우 rx_dropped 의 값이 빠르게 증가합니다.
PMD에 대한 NUMA 노드당 물리적 CPU 코어가 두 개 이상 없어야 합니다.
# ovs-vsctl --column statistics list interface dpdk0

statistics          : {mac_local_errors=0, mac_remote_errors=0, "rx_1024_to_1522_packets"=26, "rx_128_to_255_packets"=243,
"rx_1523_to_max_packets"=0, "rx_1_to_64_packets"=102602, "rx_256_to_511_packets"=6100, "rx_512_to_1023_packets"=27,
"rx_65_to_127_packets"=16488, rx_broadcast_packets=2751, rx_bytes=7718218, rx_crc_errors=0, rx_dropped=0, rx_errors=0,
rx_fragmented_errors=0, rx_illegal_byte_errors=0, rx_jabber_errors=0, rx_length_errors=0, rx_mac_short_dropped=0,
rx_mbuf_allocation_errors=0, rx_oversize_errors=0, rx_packets=125486, rx_undersized_errors=0, "tx_1024_to_1522_packets"=63,
"tx_128_to_255_packets"=319, "tx_1523_to_max_packets"=0, "tx_1_to_64_packets"=1053, "tx_256_to_511_packets"=50,
"tx_512_to_1023_packets"=68, "tx_65_to_127_packets"=7732, tx_broadcast_packets=12, tx_bytes=466813, tx_dropped=0,
tx_errors=0, tx_link_down_dropped=0, tx_multicast_packets=5642, tx_packets=9285}
2.6.2. VM Too Slow to Drain vhost-user
이 예는 figure 2.1 의 예와 유사합니다. 이 예제에서는 lcore 스레드가 인스턴스 수신(RX) 큐로 전송된 패킷 볼륨에 의해 압도되는 경우 패킷 손실이 발생할 수 있다는 것입니다.
자세한 내용은 다음 문서를 참조하십시오.
그림 2.2. 가상 어댑터 RX 큐 폴링
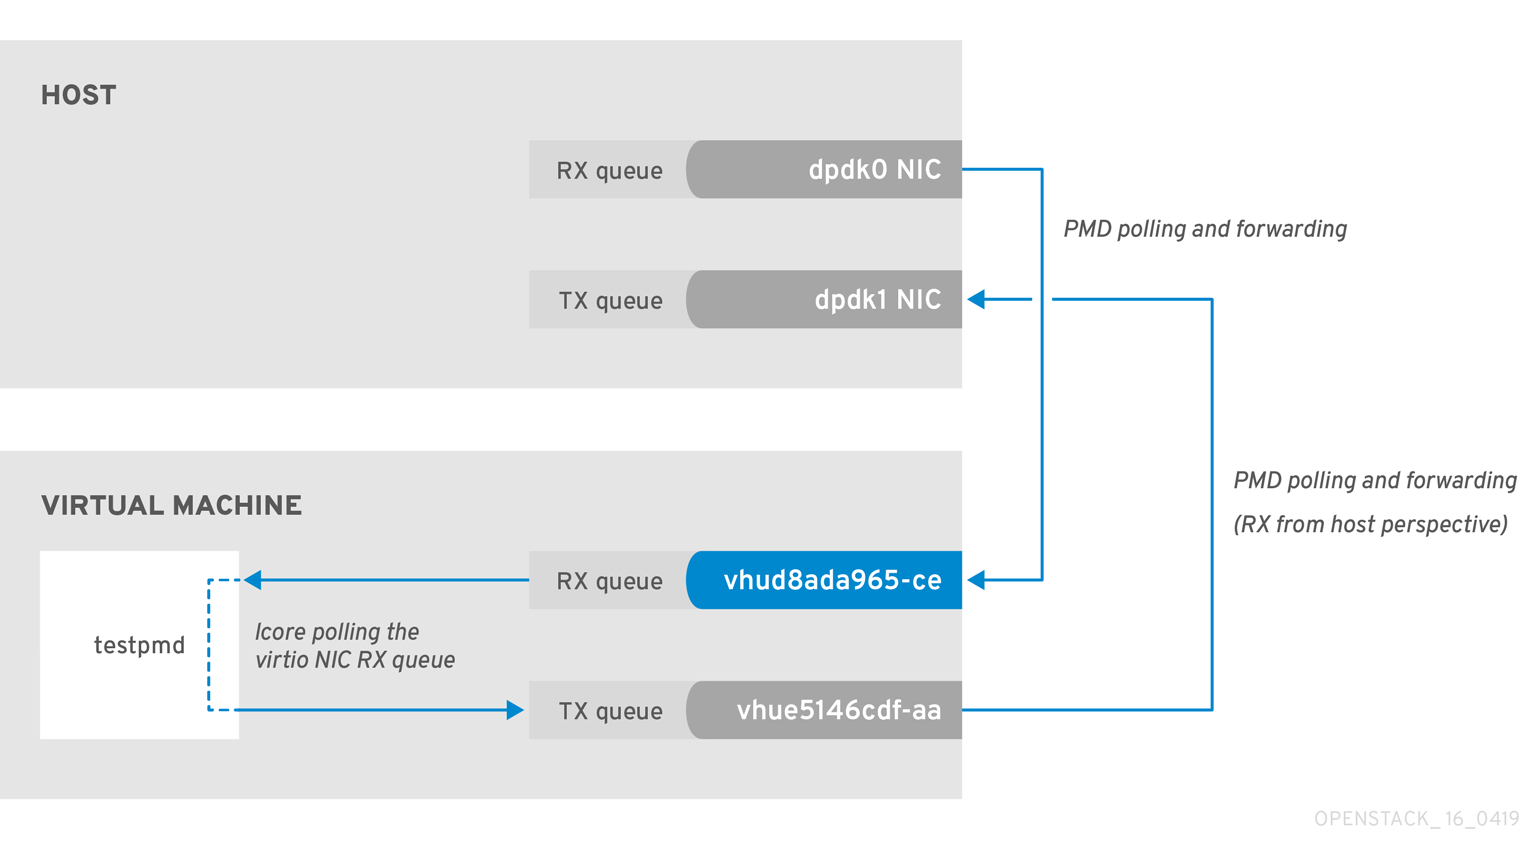
호스트의 tx_dropped 값이 VM의 rx_dropped 값에 해당하는지 확인하려면 다음 명령을 실행합니다.
ovs-vsctl --column statistics list interface vhud8ada965-ce

statistics          : {"rx_1024_to_1522_packets"=0, "rx_128_to_255_packets"=0, "rx_1523_to_max_packets"=0,
"rx_1_to_64_packets"=0, "rx_256_to_511_packets"=0, "rx_512_to_1023_packets"=0, "rx_65_to_127_packets"=0, rx_bytes=0,
rx_dropped=0, rx_errors=0, rx_packets=0, tx_bytes=0, tx_dropped=0, tx_packets=0}
2.6.3. vhost-user 드레인 OVS-DPDK Too Slow
이 예에서 PMD 스레드는 호스트 관점에서 수신 대기열인 virtio TX를 폴링합니다. PMD 스레드가 패킷 볼륨에 의해 압도되거나 중단된 경우 패킷이 삭제될 수 있습니다.
그림 2.3. 가상 어댑터 TX 큐 폴링
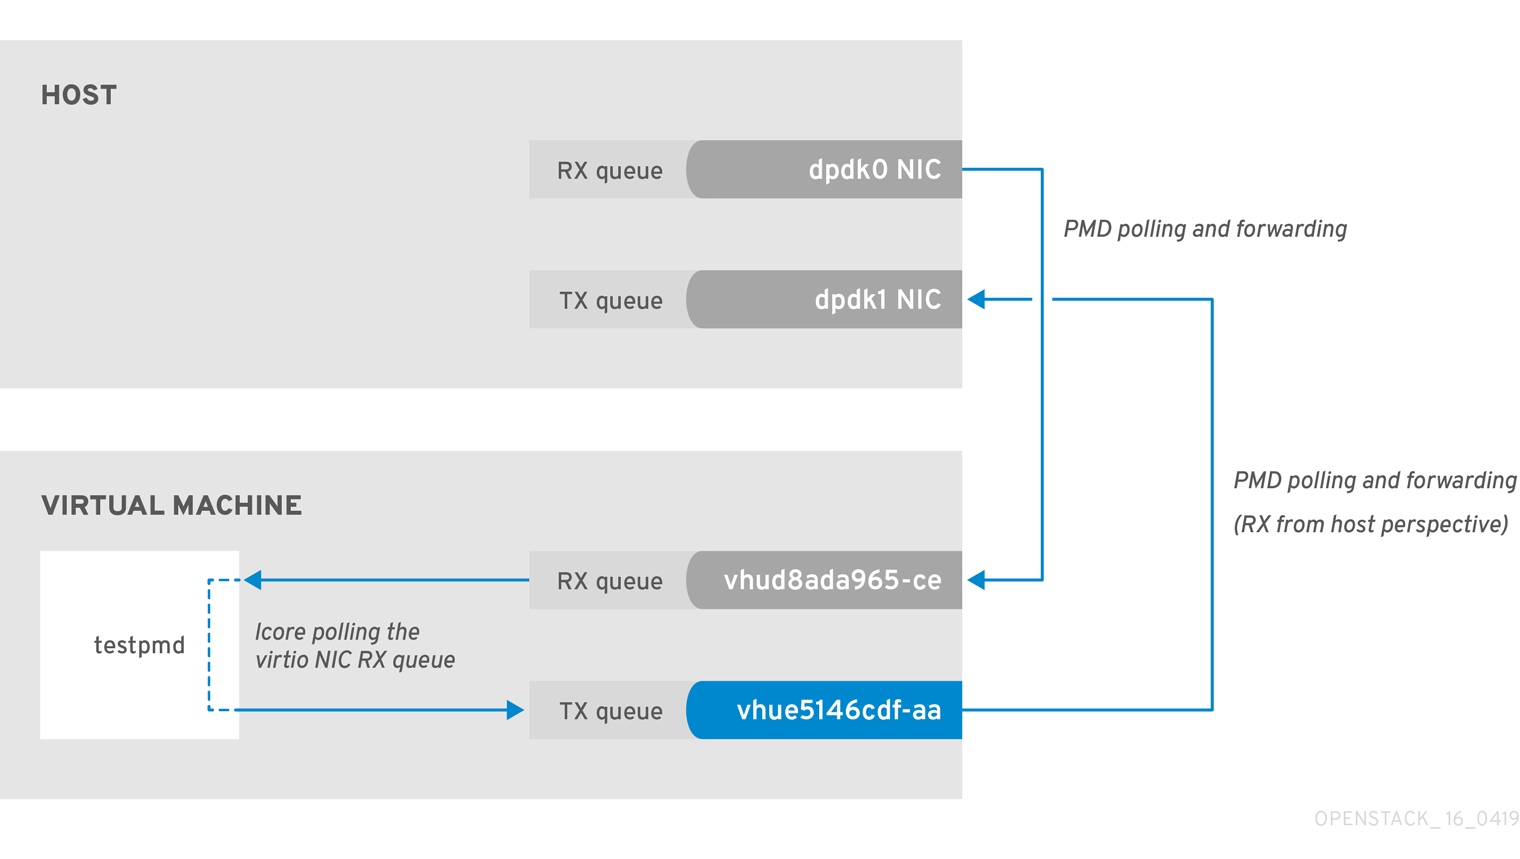
VM에서 패킷의 반환 경로를 추적하고 호스트(tx_dropped) 및 VM(rx_dropped)의 드롭 카운터에서 값을 제공하며 다음 명령을실행합니다.
ovs-vsctl --column statistics list interface vhue5146cdf-aa

statistics          : {"rx_1024_to_1522_packets"=0, "rx_128_to_255_packets"=0, "rx_1523_to_max_packets"=0,
"rx_1_to_64_packets"=0, "rx_256_to_511_packets"=0, "rx_512_to_1023_packets"=0, "rx_65_to_127_packets"=0,
rx_bytes=0, rx_dropped=0, rx_errors=0, rx_packets=0, tx_bytes=0, tx_dropped=0, tx_packets=0}
2.6.4. Egress 물리 인터페이스에서 패킷 손실
PCIe와 RAM 간의 전송 속도가 느리면 물리적 어댑터가 TX 큐에서 패킷을 삭제할 수 있습니다. 이 문제가 거의 발생하지 않지만 이 문제를 식별하고 해결하는 방법을 아는 것이 중요합니다.
그림 2.4. 물리적 어댑터 TX 큐 폴링
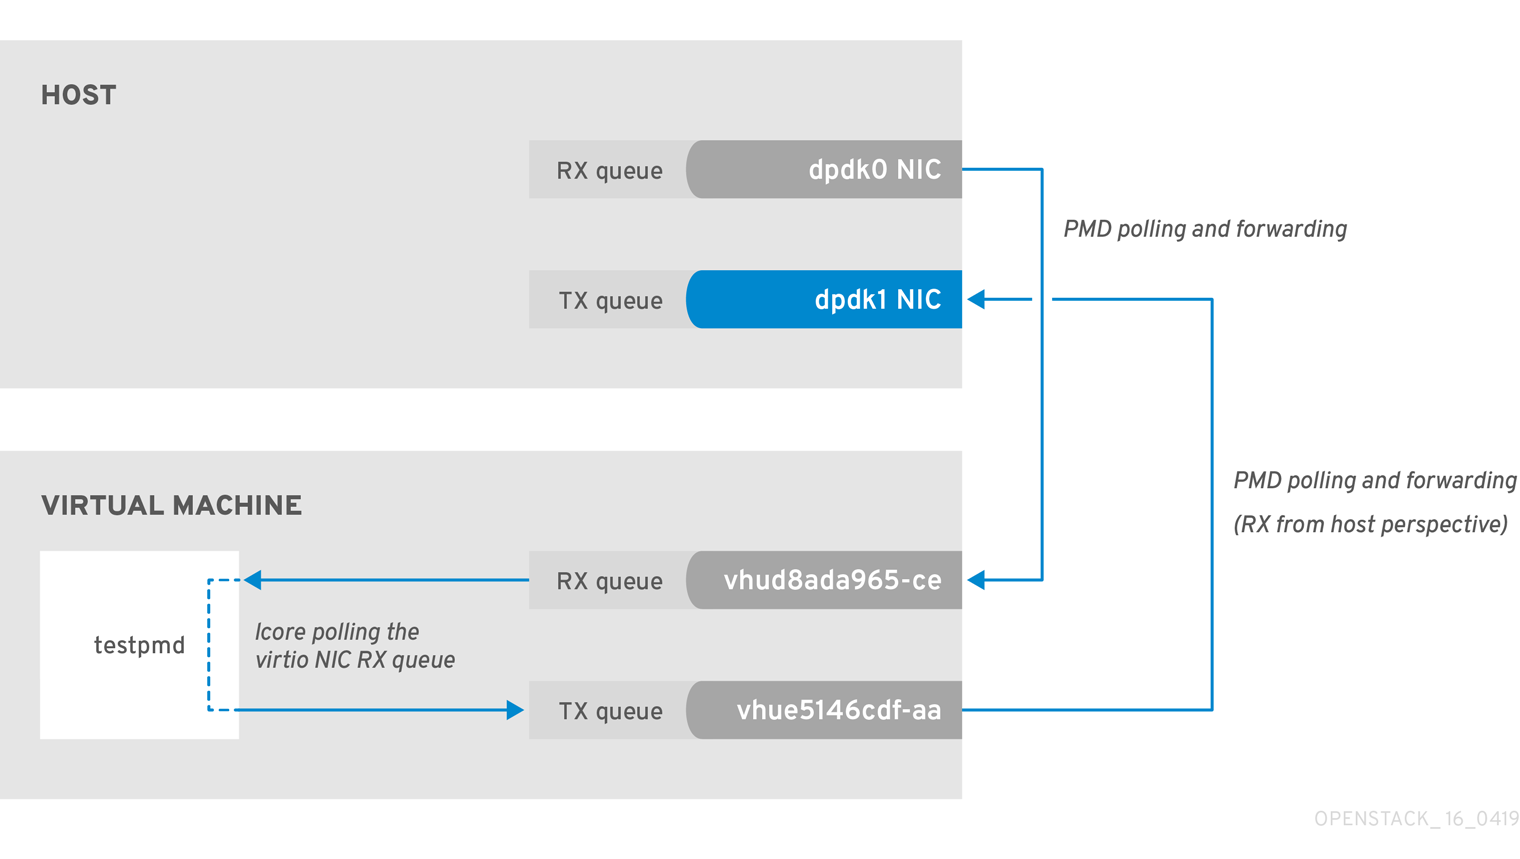
다음 명령은 dpdk1 인터페이스의 통계를 보여줍니다. tx_dropped 가 0보다 크고 빠르게 증가하는 경우 Red Hat에서 지원 케이스를 열 수 있습니다.
ovs-vsctl --column statistics list interface dpdk1

statistics          : {mac_local_errors=0, mac_remote_errors=0, "rx_1024_to_1522_packets"=26,
"rx_128_to_255_packets"=243, "rx_1523_to_max_packets"=0, "rx_1_to_64_packets"=102602, "rx_256_to_511_packets"=6100,
"rx_512_to_1023_packets"=27, "rx_65_to_127_packets"=16488, rx_broadcast_packets=2751, rx_bytes=7718218,
rx_crc_errors=0, rx_dropped=0, rx_errors=0, rx_fragmented_errors=0, rx_illegal_byte_errors=0, rx_jabber_errors=0,
rx_length_errors=0, rx_mac_short_dropped=0, rx_mbuf_allocation_errors=0, rx_oversize_errors=0, rx_packets=125486,
rx_undersized_errors=0, "tx_1024_to_1522_packets"=63, "tx_128_to_255_packets"=319, "tx_1523_to_max_packets"=0,
"tx_1_to_64_packets"=1053, "tx_256_to_511_packets"=50, "tx_512_to_1023_packets"=68, "tx_65_to_127_packets"=7732,
tx_broadcast_packets=12, tx_bytes=466813, tx_dropped=0, tx_errors=0, tx_link_down_dropped=0,
tx_multicast_packets=5642, tx_packets=9285}
이러한 유형의 패킷 손실이 표시되면 메모리 채널 재구성을 고려하십시오.
- 메모리 채널을 계산하려면 다음을 참조하십시오. Network Functions Virtualization Planning and Conifguration Guide 의 메모리 매개변수 입니다.
- 메모리 채널 수를 확인하려면 다음을 참조하십시오. Red Hat OpenStack Platform에서 NeutronDpdkMemoryChannels 또는 OvsDpdkMemoryChannels의 메모리 채널 수를 확인하는 방법은 무엇입니까.
3장. NFV Command Cheatannotation
이 장에서는 Red Hat OpenStack Platform 13 시스템 관찰에 가장 일반적으로 사용되는 명령이 포함되어 있습니다.
아래 명령 중 일부는 기본적으로 사용할 수 없습니다. 지정된 노드에 필요한 툴을 설치하려면sudo yum install tuna qemu-kvm-tools perf kernel-tools dmidecode명령을 실행하십시오.
3.1. UNIX 소켓
이 명령을 사용하여 프로세스 포트 및 UNIX 소켓 도메인을 표시합니다.
| 동작 | 명령 |
|---|---|
| 호스트 이름 조회 없이 모든 상태(LISTEN,ECDHEBLISHED, CLOSE_WAIT 등)에 모든 TCP 및 UDPECDSAKETS 표시 | # lsof -ni |
| 호스트 이름을 조회하지 않고 모든 상태(LISTEN,ECDHEBLISHED, CLOSE_WAIT 등)에 모든 TCPECDHEKETS 표시 | # lsof -nit |
| 호스트 이름 조회 없이 모든 상태(LISTEN,ECDHEBLISHED, CLOSE_WAIT 등)에 모든 UDPECDSAKETS 표시 | # lsof -niu |
| IPv4의 호스트 이름 조회 없이 모든 상태(LISTEN,ECDHEBLISHED, CLOSE_WAIT 등)에 모든 TCP 및 UDPECDSAKETS 표시 | # lsof -ni4 |
| IPv6의 호스트 이름 조회 없이 모든 상태(LISTEN,ECDHEBLISHED, CLOSE_WAIT 등)에 모든 TCP 및 UDPECDSAKETS 표시 | # lsof -ni6 |
| 지정된 포트에 대한 호스트 이름 조회 없이 모든 관련ECDHEKETS(LISTEN,ECDHEBLISHED, CLOSE_WAIT 등)를 표시합니다. | # lsof -ni :4789 |
| 호스트 이름 조회 없이 LISTEN 상태로 모든ECDHEKETS 표시 | # ss -ln |
| IPv4의 호스트 이름 조회 없이 LISTEN 상태로 모든ECDHEKETS 표시 | # ss -ln4 |
| IPv6의 호스트 이름 조회 없이 LISTEN 상태로 모든ECDHEKETS 표시 | # ss -ln6 |
3.2. IP
이러한 명령을 사용하여 IP L2 및 L3 구성, 드라이버, PCI 버스 및 네트워크 통계를 표시합니다.
| 동작 | 명령 |
|---|---|
| 모든 L2(실제 및 가상 인터페이스 모두) 인터페이스 및 해당 통계 표시 | # IP -s 링크 쇼 |
| 모든 L3 인터페이스 및 통계 표시 | # IP -s addr show |
| 기본 (main) IP 라우팅 테이블 표시 | # IP 경로 쇼 |
| 지정된 라우팅 테이블의 라우팅 규칙 표시 | # IP route show table external |
| 모든 라우팅 테이블 표시 | # IP 규칙 쇼 |
| 지정된 대상에 대한 라우팅 규칙 표시 | # IP route get 1.1.1.1 |
| 모든 Linux 네임스페이스 표시 | # IP netns show |
| Linux 네임스페이스에 로그인 | # IP netns exec ns0 bash |
| 지정된 인터페이스의 자세한 네트워크 인터페이스 카운터 표시 | # tail /sys/class/net/ens6/statistics/* |
| 지정된 본딩 장치의 자세한 본딩 정보를 표시 | # cat /proc/net/bonding/bond1 |
| 글로벌 네트워크 인터페이스 카운터 보기 표시 | # cat /proc/net/dev |
| 물리적 연결 유형(TP, FIBER 등), 링크 속도 모드 지원 및 지정된 네트워크 인터페이스에 대해 연결된 표시 | # ethtool ens6 |
| 지정된 네트워크 인터페이스의 Linux 드라이버, 드라이버 버전, 펌웨어 및 PCIe BUS ID를 표시 | # ethtool -i ens6 |
| 지정된 네트워크 인터페이스에 대한 기본, 활성화 및 비활성화 하드웨어 오프로드 표시 | # ethtool -k ens6 |
| 지정된 네트워크 인터페이스에 대한ECDHE(multiqueue) 구성 표시 | # ethtool -l ens6 |
| 지정된 네트워크 인터페이스에 대해 RX 및 TX 모두에 대한 update를 변경 | # ethtool -L ens6 결합된 8 |
| 지정된 네트워크 인터페이스에 대해서만 TX 설정 변경 | # ethtool -L ens6 tx 8 |
| 지정된 네트워크 인터페이스의 대기열 크기 표시 | # ethtool -g ens6 |
| 지정된 네트워크 인터페이스의 RX 큐 크기 변경 | # ethtool -G ens6 rx 4096 |
| 향상된 네트워크 통계 표시 | # cat /proc/net/softnet_stat |
| 빠른 중요한 네트워크 장치 정보(인터페이스 이름, MAC, NUMA, PCIe 슬롯, 펌웨어, 커널 드라이버) 표시 | # biosdevname -d |
| 커널 내부 드롭 카운터를 표시합니다. 자세한 내용은 다음을 참조하십시오. 네트워크 데이터 처리 모니터링. | # cat /proc/net/softnet_stat |
3.3. OVS
이러한 명령을 사용하여 Open vSwitch 관련 정보를 표시합니다.
| 동작 | 명령 |
|---|---|
| OVS DPDK 사람이 읽을 수 있는 통계 | Open vSwitch DPDK Labtistics에서 참조하십시오. |
| OVS 기본 정보(버전, dpdk enabled, PMD 코어, lcore, ODL 브리지 매핑, 밸런싱, 자동 밸런싱 등) 표시 | # ovs-vsctl list Open_vSwitch |
| OVS 글로벌 전환 보기 표시 | # ovs-vsctl show |
| OVS 모든 세부 인터페이스 표시 | # OVS-vsctl list 인터페이스 |
| 하나의 인터페이스에 대한 OVS 세부 정보 표시(링크 속도, MAC, 상태, 통계 등) | # ovs-vsctl list interface dpdk0 |
| 지정된 인터페이스의 OVS 카운터 표시 | # ovs-vsctl get interface dpdk0 statistics |
| OVS 모든 세부 포트 표시 | # OVS-vsctl list 포트 |
| 하나의 포트에 대한 OVS 세부 정보 표시 (링크 속도, MAC, 상태, 통계 등) | # ovs-vsctl list port vhu3gf0442-00 |
| 하나의 브릿지에 대한 OVS 세부 정보 표시(datapath 유형, 멀티 캐스트 스누핑, stp 상태 등) | # OVS-vsctl list bridge br-int |
| OVS 로그 상태 표시 | # OVS-appctl vlog/list |
| 모든 OVS 로그를 디버그로 변경 | # OVS-appctl vlog/set dbg |
| 파일 로그 출력의 디버그 모드로 하나의 특정 OVS 하위 시스템 변경 | # OVS-appctl vlog/set file:backtrace:dbg |
| 모든 OVS 로그 비활성화 | # OVS-appctl vlog/set off |
| 파일 로그 출력에 대해서만 debug로 모든 OVS 하위 시스템 변경 | # OVS-appctl vlog/set file:dbg |
| 모든 OVS 고급 명령 표시 | # OVS-appctl list-commands |
| 모든 OVS 본딩 표시 | # OVS-appctl bond/list |
| 특정 OVS 본딩에 대한 세부 정보 표시(상태, 본딩 모드, 전달 모드, LACP 상태, 본딩 멤버 상태, 연결 상태) | # ovs-appctl bond/show bond1 |
| 멤버, 본딩 및 파트너 스위치를 위한 고급 LACP 정보 표시 | # ovs-appctl lacp/show |
| OVS 인터페이스 카운터 표시 | # ovs-appctl dpctl/show -s |
| 반복의 차이점을 강조하는 OVS 인터페이스 카운터 표시 | # watch -d -n1 "ovs-appctl dpctl/show -s|grep -A4 -E '(dpdk|dpdkvhostuser)'|grep -v '\-\-'" |
| 지정된 포트에 대한 OVS mempool 정보 표시 | # ovs-appctl netdev-dpdk/get-mempool-info dpdk0 |
| PMD 성능 통계 표시 | # ovs-appctl dpif-netdev/pmd-stats-show |
| PMD 성능 통계를 일관된 방식으로 표시 | # ovs-appctl dpif-netdev/pmd-stats-clear && sleep 60s && ovs-appctl dpif-netdev/pmd-stats-show |
| DPDK 인터페이스 통계를 사람이 읽을 수 있는 표시 | # OVS-vsctl get 인터페이스 dpdk0 statistics|sed -e "s/,/\n/g" -e "s/[\\",\{,\}, ]///g" -e "s/=/ =ECDHE /g" |
| 포트/ 큐 및 PMD 스레드 간 OVS 매핑 표시 | # ovs-appctl dpif-netdev/pmd-rxq-show |
| OVS PMD 리밸런스 트리거 (PMD 사이클 사용률 기반) | # ovs-appctl dpif-netdev/pmd-rxq-rebalance |
| OVS 포트와 특정 PMD 간에 선호도 생성(모든 밸런싱에서 PMD 비활성화) | # ovs-vsctl set interface dpdk other_config:pmd-rxq-affinity="0:2,1:4" |
| (OVS 2.11 이상 및 FDP18.09) 사이클에 따라 PMD 밸런싱 설정 | # ovs-vsctl set Open_vSwitch . other_config:pmd-rxq-assign=cycles |
| (OVS 2.11 이상 및 FDP18.09) 라운드 로빈에서 PMD 밸런싱 설정 | # ovs-vsctl set Open_vSwitch . other_config:pmd-rxq-assign=roundrobin |
| OVS-DPDK 물리 포트 대기열 수 설정 | # OVS-vsctl set interface dpdk options:n_rxq=2 |
| OVS-DPDK 물리 포트 크기 설정 | # OVS-vsctl set Interface dpdk0 options:n_rxq_desc=4096 # OVS-vsctl set Interface dpdk0 options:n_txq_desc=4096 |
| OVS MAC 주소 테이블 표시 (action=normal에 사용) | # ovs-appctl fdb/show br-provider |
| OVS vSwitch MAC 주소 테이블 변경 시간 설정(기본값: 300초) | # ovs-vsctl set bridge br-provider other_config:mac-aging-time=900 |
| OVS vSwitch MAC 주소 테이블 크기 설정(기본값: 2048s) | # ovs-vsctl set bridge br-provider other_config:mac-table-size=204800 |
| OVS 데이터 경로 흐름 표시(커널 공간) | # ovs-dpctl dump-flows -m |
| OVS 데이터 경로 흐름 표시(dpdk) | # OVS-appctl dpif/dump-flows -m br-provider |
| datapath 흐름 포트 번호와 포트 이름 간 매핑 표시 | # OVS-dpctl show |
| 지정된 브릿지에 OVS OpenFlow 규칙 표시 | # OVS-ofctl dump-flows br-provider |
| OpenFlow 흐름 포트 번호와 포트 이름 간 매핑 표시 | # OVS-ofctl show br-provider |
| (OVS 2.11+) - 자동 리밸런스 활성화 | # ovs-vsctl set Open_vSwitch . other_config:pmd-auto-lb="true" |
| (OVS 2.11+) - 자동 리밸런스 간격을 다른 값으로 변경 (기본값 1분) | # ovs-vsctl set Open_vSwitch . other_config:pmd-auto-lb-rebalance-intvl="5" |
| 자세한 OVS 내부 구성 | # man ovs-vswitchd.conf.db |
| OVS tcpdump를 다운로드하려면 | # curl -O -L ovs-tcpdump.in |
| DPDK 인터페이스에서 패킷 캡처를 수행하려면 | # OVS-tcpdump.py --db-sock unix:/var/run/openvswitch/db.sock -i <bond/vhu> <tcpdump standard arguments such as -v -nn -e -w <path/to/file>> |
| (OVS 2.10+) 자세한 PMD 성능 통계 | # ovs-appctl dpif-netdev/pmd-perf-show |
3.4. IRQ
이러한 명령을 사용하여 IIRQ(Interrupt Request Line) 소프트웨어 및 하드웨어 인터럽트를 표시합니다.
| 동작 | 명령 |
|---|---|
| ksoftirqd 작업자가 실행하는 CPU당 CPU당 분산 표시 | # cat /proc/softirqs | less -S |
| 초당 ksoftirqd 작업자가 실행하는 CPU당 CPU당 분산 표시 | # watch -n1 -d -t "cat /proc/softirqs" |
| CPU당 하드웨어 및 소프트웨어 인터럽트(NMI, LOC, TLB, RSE,kubelet, NPI, hieradataW) 분산 표시 | # cat /proc/interrupts | less -S |
| 초당 CPU당 하드웨어 및 소프트웨어 인터럽트(NMI, LOC, TLB, RSE,kubelet, NPI, hieradataW) 분산 표시 | # watch -n1 -d -t "cat /proc/interrupts" |
| 타이머 인터럽트 표시 | # cat /proc/interrupts | grep -E "LOC|CPU" | less -S |
| 1초마다 타이머 인터럽트 표시 | # watch -n1 -d -t "cat /proc/interrupts | grep -E 'LOC|CPU'" |
| 기본 IRQ CPU 선호도 표시 | # cat /proc/irq/default_smp_affinity |
| 지정된 IRQ에 대한 IRQ 선호도 표시(CPUMask) | # cat /proc/irq/89/smp_affinity |
| 지정된 IRQ(DEC)에 대한 IRQ 선호도 표시 | # cat /proc/irq/89/smp_affinity_list |
| 지정된 IRQ에 대한 IRQ 선호도 설정(CPUMask) | # echo -n 1000 > /proc/irq/89/smp_affinity |
| 지정된 IRQ(DEC)에 IRQ 선호도 설정 | # echo -n 12 > /proc/irq/89/smp_affinity_list |
| 하드웨어 인터럽트 CPU 선호도 표시 | # tuna --show_irqs |
| 지정된 IRQ(DEC 지원 범위)에 대한 IRQ 선호도 설정 (예: 0-4에서 4까지) | # tuna --irqs=<IRQ> --cpus=<CPU> --move |
| IRQ CPU 사용률 표시 | #ECDHEstat -I CPU | less -S |
| 지정된 CPU에 대한 IRQ CPU 사용률 표시 | # mpstat -I CPU -P 4 | less -S |
| controlPlaneIRQ CPU 사용률 배포 표시 | #ECDHEstat -I SCPU | less -S |
| 지정된 CPU에 대한controlPlaneIRQ CPU 사용률 표시 | # mpstat -I SCPU -P 4 | less -S |
3.5. 프로세스
이러한 명령을 사용하여 Linux, 프로세스 스케줄러 및 CPU 유사성에 프로세스 및 스레드를 표시합니다.
| 동작 | 명령 |
|---|---|
| 모든 프로세스 스레드를 포함한 지정된 프로세스 이름 배포 CPU 사용량 및 CPU 선호도에 대해 표시 | # pidstat -p $(pidof qemu-kvm) -t |
| 모든 프로세스 스레드를 포함하여 지정된 프로세스 이름 배포 CPU 사용량 및 CPU 선호도(30회 반복의 경우 10초)에 대해 표시 | # pidstat -p $(pidof qemu-kvm) -t 10 30 |
| 모든 프로세스 스레드를 포함하여 지정된 프로세스 이름 페이지 폴트 및 메모리 사용률에 대한 표시 | # pidstat -p $(pidof qemu-kvm) -t -r |
| 모든 프로세스 스레드를 포함한 지정된 프로세스 이름 I/O 통계에 대한 표시 | # pidstat -p $(pidof qemu-kvm) -t -d |
| 지정된 프로세스 이름에 해당 PID, 프로세스 이름을 포함한 모든 하위 PID 및 CPU 시간 표시 | # ps -T -C qemu-kvm |
| 지정된 프로세스와 모든 하위 PID(s) 실시간 성능 통계에 대한 표시 | # top -H -p $(pidof qemu-kvm) |
| 프로세스 스케줄러 유형, 우선 순위, 명령, CPU 선호도 및 컨텍스트 전환 정보를 사용하여 모든 시스템 스레드 표시 | # tuna --show_threads |
| 우선 순위가 가장 높은 지정된 PID RealTime(FIFO) 스케줄링에 대해 설정 | # tuna --threads=<PID> --priority=FIFO:99 |
| PMD 및 CPU 스레드 일정 변경 작업 표시 | # watch -n1 -d "grep -E 'pmd|CPU' /proc/sched_debug" |
| 브라우저 스케줄러 내부 작업 통계 | # less /proc/sched_debug |
| 포괄적인 프로세스 통계 및 선호도 보기를 표시합니다.
| # top |
| 모든 시스템 프로세스 및 해당 CPU 선호도 표시 | # ps -eF |
| 중단 및 실행 중인 프로세스를 표시하고 절전 시 모든 시스템 프로세스를 표시합니다. | # ps -elfL |
| 지정된 PID에 대한 CPU 유사성 표시 | # taskset --pid $(pidof qemu-kvm) |
| 지정된 PID에 대한 CPU 유사성 설정 | # taskset --pid --cpu-list 0-9,20-29 $(pidof <Process>) |
3.6. KVM
이러한 명령을 사용하여 KVM(커널 기반 가상 머신) 관련 도메인 통계를 표시합니다.
| 동작 | 명령 |
|---|---|
| 실시간 KVM 하이퍼바이저 통계(VMExit, VMEntry, vCPU 해제, 컨텍스트 전환, 타이머, Halt Pool, vIRQ) 표시 | # kvm_stat |
| 깊은 KVM 하이퍼바이저 통계 표시 | # kvm_stat --once |
| 지정된 게스트에 대한 실시간 KVM 하이퍼바이저 통계 표시(VMExit, VMEntry, vCPU 발생, 컨텍스트 전환, 타이머, Halt Pool, vIRQ) | # kvm_stat --guest=<VM name> |
| 지정된 게스트에 대한 딥 KVM 하이퍼바이저 통계 표시 | # kvm_stat --once --guest=<VM name> |
| KVM 프로파일 링 트랩 통계 표시 | # perf kvm stat live |
| KVM 프로파일 링 통계 표시 | # perf kvm top |
| 지정된 VM에 대한 vCPU 고정 표시 | # virsh vcpupin <Domain name/ID> |
| 지정된 VM에 대한 QEMU 에뮬레이터 스레드 표시 | # virsh emulatorpin <Domain name/ID> |
| 지정된 VM에 대한 NUMA 고정 표시 | # virsh numatune <Domain name/ID> |
| 지정된 VM에 대한 메모리 통계 표시 | # virsh dommemstat <Domain name/ID> |
| 지정된 VM에 대한 vCPU 통계 표시 | # virsh nodecpustats <Domain name/ID> |
| 지정된 VM의 모든 vNIC 표시 | # virsh domiflist <Domain name/ID> |
| 지정된 VM에 대한 vNIC 통계를 표시합니다( DPDK VHU에서는 작동하지 않음) | # virsh domifstat <Domain name/ID> <vNIC> |
| 지정된 VM의 모든 vDisk 표시 | # virsh domblklist <Domain name/ID> |
| 지정된 VM에 대한 vDisk 통계 표시 | # virsh domblkstat <Domain name/ID> <vDisk> |
| 지정된 VM에 대한 모든 통계 표시 | # virsh domstats <Domain name/ID> |
3.7. CPU
이러한 명령을 사용하여 CPU 사용률, 프로세스 CPU 배포, 빈도 및 SMI를 표시합니다.
| 동작 | 명령 |
|---|---|
| 모든 프로세스 스레드를 포함한 지정된 프로세스 이름 배포 CPU 사용량 및 CPU 선호도에 대해 표시 | # pidstat -p $(pidof qemu-kvm) -t |
| 가상 메모리, I/O 및 CPU 통계 표시 | # vmstat 1 |
| 집계된 자세한 CPU 사용량 표시 | # mpstat |
| 자세한 CPU 사용 배포 표시 | #ECDHEstat -P ALL |
| 지정된 CPU에 대한 자세한 CPU 사용량 배포를 표시합니다(범위를 지원하지 않음) | # mpstat -P 2,3,4,5 |
| 30회 반복을 위해 지정된 CPU의 자세한 CPU 사용량 표시 10초 | # mpstat -P 2,3,4,5 10 30 |
| 지정된 CPU 빈도에 대한 하드웨어 제한 및 빈도 정책 표시 | # cpupower -c 24 frequency-info |
| 현재 CPU 빈도 정보 표시 | # cpupower -c all frequency-info|grep -E "current CPU frequency|analyzing CPU" |
| 모든 CPU에 대한 빈도 및 CPU % C-States 통계 표시 | # cpupower monitor |
| 모든 CPU의 실시간 빈도 및 CPU % C-States 통계 표시 | # watch -n1 -d "cpupower monitor" |
| SMI를 포함한 모든 CPU에 대한 보다 자세한 빈도 및 CPU % C-States 통계를 표시합니다(RT에 유용함) | # turbostat --interval 1 |
| SMI를 포함하여 지정된 CPU에 대한 더 자세한 빈도 및 CPU % C-States 통계를 표시합니다( RT에 유용함) | # turbostat --interval 1 --cpu 4 |
| CPU 세부 정보 표시 및ECDSA 지원 | # lscpu |
| Intel CPU 관련 사양: CPU 사용량, CPU IPC, CPU 실행 %, L3 및 L2 Cache Hit, Miss, Miss, Temperature, Memory 채널 사용량, QPI/UPI 사용량에 대한 매우 낮은 수준의 세부 정보를 표시합니다. | Git clone ProcessorECDHE Monitor make ./pcm.x" |
3.8. NUMA
이러한 명령을 사용하여 NUMA(Non-Uniform Memory Access) 통계 및 프로세스 배포를 표시합니다.
| 동작 | 명령 |
|---|---|
| 하드웨어 NUMA 토폴로지 표시 | # numactl -H |
| NUMA 통계 표시 | # numastat -n |
| 시스템 전체 메모리 사용량과 같이 meminfo 표시 | # numastat -m |
| 지정된 프로세스 이름에 대한 NUMA 메모리 세부 정보 및 밸런싱 표시 | # numastat qemu-kvm |
| 지정된 NUMA 노드 특정 통계에 대한 표시 | # /sys/devices/system/node/node<NUMA 노드 number>/numastat |
| NUMA 노드 및 PCI 장치를 사용하여 NUMA 토폴로지를 매우 명확하게 보여줍니다. | # lstopo --physical |
| 관련 장치를 사용하여 물리적 NUMA 토폴로지의 그래프(svg 형식) 생성 | # lstopo --physical --output-format svg > topology.svg |
3.9. 메모리
이러한 명령을 사용하여 메모리 통계, 대규모 페이지, DPC, 물리적 DIMM 및 빈도를 표시합니다.
| 동작 | 명령 |
|---|---|
| 시스템 전체 메모리 사용량과 같이 meminfo 표시 | # numastat -m |
| 가상 메모리, I/O 및 CPU 통계 표시 | # vmstat 1 |
| 글로벌 메모리 정보 표시 | # cat /proc/meminfo |
| 지정된 NUMA 노드에 대한 총 2MB 대규모 페이지 수 표시 | # /sys/devices/system/node/node<NUMA 노드 번호>/hugepages/hugepages-2048kB/nr_hugepages |
| 지정된 NUMA 노드에 대한 총 1GB 대규모 페이지 수 표시 | # /sys/devices/system/node/node<NUMA 노드 번호>/hugepages/hugepages-1048576kB/nr_hugepages |
| 지정된 NUMA 노드에 대해 총 사용 가능한 2MB 대규모 페이지 표시 | # /sys/devices/system/node/node<NUMA 노드 번호>/hugepages/hugepages-2048kB/free_hugepages |
| 지정된 NUMA 노드에 대해 총 1GB의 대규모 페이지 표시 | # /sys/devices/system/node/node<NUMA 노드 번호>/hugepages/hugepages-1048576kB/free_hugepages |
| 100x 2MB 대규모 페이지를 NUMA0에 실시간으로 할당합니다(NUMA 노드는 변경할 수 있음) | # echo 100 > /sys/devices/system/node0/hugepages/hugepages-2048kB/nr_hugepages |
| 100x 1GB 대규모 페이지를 NUMA0에 실시간으로 할당합니다(NUMA 노드는 변경할 수 있음) | # echo 100 > /sys/devices/system/node0/hugepages/hugepages-1048576kB/nr_hugepages |
| 실시간 SLAB 정보 표시 | # slabtop |
| 자세한 SLAB 정보 표시 | # cat /proc/slabinfo |
| 총 설치된 메모리 DIMM 표시 | # dmidecode -t memory | grep Locator |
| 설치된 메모리 DIMM 속도 표시 | # dmidecode -t memory | grep speed |
3.10. PCI
이러한 명령을 사용하여 PCI 통계, PCI 세부 정보 및 PCI 드라이버 덮어쓰기를 표시합니다.
| 동작 | 명령 |
|---|---|
| 시스템의 자세한 PCI 장치 정보 표시 | # lspci -vvvnn |
| PCI 트리 보기 표시 | # lspci -vnnt |
| PCI 장치 NUMA 정보 표시 | # lspci -vmm |
| 지정된 장치에 대한 PCIe 최대 링크 속도 표시 | # lspci -s 81:00.0 -vv | grep LnkCap |
| 지정된 장치에 대한 PCIe 링크 속도 상태 표시 | # lspci -s 81:00.0 -vv | grep LnkSta |
| PCI 장치 및 커널 드라이버 표시 | # driverctl list-devices |
| PCI 장치 드라이버 덮어쓰기 표시( DPDK 및 SR-IOV 인터페이스의 경우typical) | # driverctl list-overrides |
| PCI 장치에 대해 다른 커널 드라이버 설정 (재부팅 영구) | # driverctl set-override 0000:81:00.0 vfio-pci |
| PCI 장치에 대해 재정의되지 않은 커널 드라이버(Device가 사용 중인 경우 명령이 중단됨) | # driverctl unset-override 0000:81:00.0 |
3.11. tuned
이러한 명령을 사용하여 tuned 프로필, 확인 및 로그를 표시합니다.
| 동작 | 명령 |
|---|---|
| 튜닝된 현재 활성화된 프로필 및 설명 표시 | # tuned-adm profile_info |
| 튜닝 가능한 프로필 및 현재 활성화된 프로필 표시 | # tuned-adm list |
| 특정 tuned 프로필 활성화 | # tuned-adm 프로필 realtime-virtual-host |
| 현재 활성화된 프로파일 확인 | # tuned-adm verify |
| tuned의 로그 | # less /var/log/tuned/tuned.log |
3.12. 프로파일 링 프로세스
이러한 명령을 사용하여 CPU 프로파일, 프로세스 프로파일 및 KVM 프로파일링을 표시합니다.
| 섹션 | 동작 | 명령 |
|---|---|---|
| process | 특정 PID에서 프로파일링 | # perf record -F 99 -p PID |
| process | 특정 PID에서 30초 동안 프로파일링 | # perf record -F 99 -p PID sleep 30 |
| process | 특정 PID에서 실시간 프로파일링 | # perf top -F 99 -p PID |
| CPU | 모든 이벤트에 대해 30초 동안 특정 CPU 코어 목록에서 프로파일링 | # perf record -F 99 -g -C <CPU Core(s)> Limit-Limitsleep 30s |
| CPU | 이벤트에 대한 특정 CPU 코어 목록에서 실시간 프로파일링 | # perf top -F 99 -g -C <CPU Core(s)> |
| 컨텍스트 전환 | 특정 CPU Core 목록에서 30 초 동안 프로 파일링 및 컨텍스트 전환만 검색 | # perf record -F 99 -g -g -e sched:sched_switch -C <CPU Core(s)> limits-annotationsleep 30 |
| KVM | 정해진 시간 동안 KVM 게스트 프로파일 | # perf kvm stat 레코드 수면 30s |
| cache | 캐시 효율성을 찾고 5초 동안 특정 CPU 코어 목록에서 프로파일링 | # perf stat -C <CPU Core(s)> -B -e cache-references,cache-misses,cycles,instructions,branches,faults,migrations sleep 5 |
| 보고서 | perf 프로파일 분석 | # perf 보고서 |
| 보고서 | stdout의 perf 프로파일 보고 | # perf report --stdio |
| 보고서 | stdout의 KVM 프로파일 | # perf kvm stat 보고서 |
3.13. 블록 I/O
이러한 명령을 사용하여 스토리지 I/O 배포 및 I/O 프로파일링을 표시합니다.
| 동작 | 명령 |
|---|---|
| 모든 시스템 장치에 대한 I/O 세부 정보 표시 | # iostat |
| 모든 시스템 장치의 고급 I/O 세부 정보 표시 | # iostat -x |
| 30회 반복을 위해 모든 시스템 장치의 고급 I/O 세부 정보를 10초마다 표시 | # iostat -x 10 30 |
| 지정된 블록 장치에 대한 고급 I/O 프로파일 생성 | # blktrace -d /dev/sda -w 10 && blkparse -i sda.* -d sda.bin |
| blktrace 프로파일 링 보고 | # btt -i sda.bin |
3.14. 실시간
이러한 명령을 사용하여 실시간 테스트 관련, SMI 및 대기 시간을 표시합니다.
| 동작 | 명령 |
|---|---|
| SMI가 일반적인 RT 커널 실행을 차단하는지 여부를 확인합니다. | # hwlatdetect --duration=3600 --threshold=25 |
| 여러 추가 옵션을 사용하여 지정된 시간에 대한 최대 스케줄링 대기 시간을 확인합니다.
| # cyclictest --duration=3600 \ --mlockall \ --priority=99 \ --nanosleep \ --interval=200 \ --histogram=5000 \ --histfile=./output \ --threads \ --numa \ --notrace |
3.15. 보안
이러한 명령을 사용하여 사양 실행 및 GRUB 부팅 매개 변수를 확인합니다.
| 동작 | 명령 |
|---|---|
| 현재 모든 Speculative 실행 보안 상태 확인 | |
| 모든 Speculative Execution 수정을 비활성화하는 GRUB 매개변수 | spectre_v2=off spec_store_bypass_disable=off pti=off l1tf=off kvm-intel.vmentry_l1d_flush=never |
| CVE-2017-5753 (Spectre variant 1) 상태 확인 | # cat /sys/devices/system/cpu/vulnerabilities/spectre_v1 |
| IBPB 및 Retpoline 확인 (CVE-2017-5715 Spectre 변형 2) 상태 | # cat /sys/devices/system/cpu/vulnerabilities/spectre_v2 |
| KPTI(CVE-2017-5754 Meltdown) 상태 확인 | # cat /sys/devices/system/cpu/vulnerabilities/meltdown |
| Spectre-ECDSA (CVE-2018-3639 Spectre Variant 4) 상태 확인 | # cat /sys/devices/system/cpu/vulnerabilities/spec_store_bypass |
| Check ForeECDHE (CVE-2018-3615 Spectre Varian 5 also known as L1TF) 상태 | # cat /sys/devices/system/cpu/vulnerabilities/l1tf |
| ForeECDHE VMEntry L1 캐시 효과 확인 | # cat /sys/module/kvm_intel/parameters/vmentry_l1d_flush |
| SMT 상태 확인 | # cat /sys/devices/system/cpu/smt/control |
3.16. Juniper Contrail vRouter
이러한 명령을 사용하여 vRouter VIF, MPLS, Nexthost, VRF, VRF의 경로, 흐름 및 덤프 정보를 표시합니다.
| 동작 | 명령 |
|---|---|
| vRouter 커널 공간 사람이 읽을 수 있는 통계 | |
| vRouter DPDK 사람이 읽을 수 있는 통계 | |
| DPDK 인터페이스에서 패킷 캡처를 수행하려면 (vifdump 후에는 grep을 사용하지 마십시오) | # vifdump vif0/234 <tcpdump 표준 인수 (예: -v -nn -e -w <path/to/file>>) |
| 모든 vRouter 인터페이스 및 하위 인터페이스 통계 및 세부 정보 표시 | # VIF --list |
| vRouter 통계 및 지정된 인터페이스에 대한 세부 정보 표시 | # VIF --list --get 234 |
| 모든 인터페이스 및 하위 인터페이스의 vRouter 팩러 속도 표시 | # VIF --list --rate |
| 지정된 인터페이스에 대한 vRouter 팩러 속도 표시 | # VIF --list --rate --get 234 |
| 지정된 인터페이스에 대한 vRouter 패킷 드롭 통계 표시 | # vif --list --get 234 --get-drop-stats |
| vRouter 흐름 표시 | # flow -l |
| 실시간 vRouter 흐름 작업 표시 | # flow -r |
| 지정된 VRF에 대한 vRouter 패킷 통계를 표시합니다 (vif --list에서 VRF 번호를 찾을 수 있음) | # vrfstats --get 0 |
| 모든 VRF에 대한 vRouter 패킷 통계 표시 | # vrfstats --dump |
| 지정된 VRF에 대한 vRouter 라우팅 테이블 표시 (vif --list에서 VRF 번호를 찾을 수 있음) | # RT --dump 0 |
| 지정된 VRF에 대한 vRouter IPv4 라우팅 테이블 표시 (vif --list에서 VRF 번호를 찾을 수 있음) | # RT --dump 0 --family inet |
| 지정된 VRF에 대한 vRouter IPv6 라우팅 테이블 표시 (vif --list에서 VRF 번호를 찾을 수 있음) | # RT --dump 0 --family inet6 |
| 지정된 VRF에 대한 vRouter 전달 테이블을 표시합니다 (vif --list에서 VRF 번호를 찾을 수 있음) | # RT --dump 0 --family bridge |
| 지정된 주소의 VRF에 vRouter 경로 대상을 표시 | # RT --get 0.0.0.0/0 --vrf 0 --family inet |
| vRouter 드롭 통계 표시 | # dropstats |
| 지정된 DPDK 코어의 vRouter 드롭 통계 표시 | # dropstats --core 11 |
| vRouter MPLS 라벨 표시 | # MPLS --dump |
| 지정된 하나에 대한 vRouter nexthop 표시 (--dump 출력에서 찾을 수 있음) | # NH --get 21 |
| 모든 vRouter nexthop 표시 | # NH --list |
| 모든 vRouter VXLAN VNID 표시 | # vxlan --dump |
| vRouter 에이전트(supervisor, xmmp 연결, vrouter 에이전트 등) 상태 표시 | # contrail-status |
| vRouter를 재시작(및 모든 Contrail 로컬 컴퓨팅 노드 구성 요소) | # systemctl restart supervisor-vrouter |
Juniper Contrail vRouter CLI utilitlies에 대한 자세한 내용은 다음 문서를 참조하십시오.
3.17. 컨테이너
컨테이너에는 일반적으로 사용되는 Docker 및 Podman 명령 중 일부입니다.
| 동작 | Docker RHEL7 | podman RHEL8 |
|---|---|---|
| 실행 중인 모든 컨테이너 표시 | # Docker ps | # podman ps |
| 모든 컨테이너 표시 (실행, 정지 등) | # docker ps -a | # podman ps -a |
| 출력이 잘리지 않고 모든 컨테이너(실행, 중지된 등) 표시 | # docker ps -a --no-trunc | # podman ps -a --no-trunc |
| 모든 컨테이너 (실행, 중지된 등) json 출력을 표시 | # docker ps --format '{{ json .}}' | jq -C '.' s|# podman ps -a --format json | jq -C '.' |
| 지정된 컨테이너의 컨테이너 프로세스 트리 표시 | # Docker top <컨테이너 ID> | # podman pod top <컨테이너 ID> |
| 실시간 컨테이너 리소스 사용률(CPU, 메모리, I/O, Net) - search-like | # Docker 통계 | # podman stats |
| 지정된 컨테이너의 실시간 리소스 사용률(CPU, 메모리, I/O, Net) 표시 | # Docker 통계 <컨테이너 ID> | # podman statistics <컨테이너 ID> |
| 실행 중인 컨테이너에 로그인합니다. | # Docker exec -it <container ID> /bin/bash | # podman exec -it <container ID> /bin/bash |
| root 사용자로 실행 중인 컨테이너에 root 사용자로 로그인 | # docker exec -u root -it <container ID> /bin/bash | # podman exec -u root -it <container ID> /bin/bash |
| 지정된 컨테이너에 포트 매핑 표시 | # Docker 포트 <컨테이너 ID> | # podman port <container ID> |
| 이름, ID, 태그를 사용하여 로컬에 저장된 모든 이미지를 표시 | # Docker 이미지 ls # Docker 이미지 | # podman image ls # podman images" |
| 지정된 이미지의 기록 표시 | # Docker history <image id> | # podman history <image id> |
| 지정된 컨테이너에 대한 낮은 수준 구성 표시 | # Docker inspect <container ID> | # podman inspect <container ID> |
| 지정된 컨테이너의 모든 볼륨 표시 | # Docker inspect -f "{{ .Mounts }}" <container ID> | # podman inspect -f "{{ .Mounts }}" <container ID> |
| 동일한 패턴으로 모든 컨테이너를 다시 시작 | # docker ps -q --filter "name=swift" | xargs -n1 docker restart | # podman ps -q --filter "name=swift" | xargs -n1 docker restart |
docker 또는 podman에 대한 자세한 내용은 다음 문서를 참조하십시오.
3.18. OpenStack
이러한 OpenStack 명령을 사용하여 VM 컴퓨팅 노드를 표시합니다.
| 동작 | 명령 |
|---|---|
| 컴퓨팅 노드별로 정렬된 계산 노드의 모든 VM 목록을 표시 | $ Nova list --fields name,OS-EXT-SRV-ATTR:host --sort host |
| vm 이름으로 정렬된 계산 노드의 모든 VM 목록을 표시 | $ Nova list --fields name,OS-EXT-SRV-ATTR:host |
4장. 인스턴스의 탭 인터페이스 TX 큐에서 높은 패킷 손실
이 섹션을 사용하여 OVS-DPDK가 아닌 커널 네트워킹의 TX 큐에서 패킷 손실 문제를 해결합니다.
4.1. 증상
호스트 전용 네트워킹을 사용하여 VNF(가상 네트워크 기능)를 테스트하는 동안 인스턴스의 탭 인터페이스 TX 큐에서 높은 패킷 손실이 관찰될 수 있습니다. 테스트 설정은 노드의 한 VM에서 동일한 노드의 다른 VM으로 패킷을 보냅니다. 패킷 손실이 버스트에 나타납니다.
다음 예제에서는 탭의 TX 큐에서 많은 수의 삭제된 패킷을 보여줍니다.
ip -s -s link ls dev tapc18eb09e-01
69: tapc18eb09e-01: <BROADCAST,MULTICAST,UP,LOWER_UP> mtu 1500 qdisc pfifo_fast master qbrc18eb09e-01 state UNKNOWN mode DEFAULT qlen 1000
    link/ether fe:16:3e:a5:17:c0 brd ff:ff:ff:ff:ff:ff
    RX: bytes  packets  errors  dropped overrun mcast
    5500034259301 132047795 0       0       0       0
    RX errors: length   crc     frame   fifo    missed
               0        0       0       0       0
    TX: bytes  packets  errors  dropped carrier collsns
    5481296464 81741449 0       11155280 0       0
    TX errors: aborted  fifo   window heartbeat transns
           0        0       0       0       0
4.2. 진단
이 섹션에서는 탭(커널 경로) 인터페이스에서 패킷 드롭을 검사합니다. 사용자 datapath의 vhost 사용자 인터페이스에서 패킷이 드롭된 경우 https://access.redhat.com/solutions/3381011를 참조하십시오.
TX는 인스턴스의 vCPU와 하이퍼바이저의 기타 프로세스 간의 중단으로 인해 발생합니다. 탭 인터페이스의 TX 큐는 인스턴스에서 패킷을 가져올 수 없는 경우 잠시 동안 패킷을 저장할 수 있는 버퍼입니다. 이 문제는 인스턴스의 CPU가 충분한 시간 동안 실행(또는 정지)되지 않는 경우 발생합니다.
TUN/TAP 장치는 한 쪽이 커널 네트워크 인터페이스이고 다른 쪽 끝은 사용자 공간 파일 설명자인 가상 장치입니다.
TUN/TAP 인터페이스는 다음 두 가지 모드 중 하나로 실행될 수 있습니다.
- 탭 모드는 L2 헤더와 함께 L2 이더넷 프레임을 장치에 공급하고 사용자 공간으로부터 동일한 정보를 수신할 것으로 예상됩니다. 이 모드는 VM에 사용됩니다.
- Tun 모드는 L3 헤더와 함께 L3 IP 패킷을 장치에 공급하고, 사용자 공간으로부터 동일한 수신을 받을 것으로 예상합니다. 이 모드는 주로 VPN 클라이언트에 사용됩니다.
KVM 네트워킹에서 사용자 공간 파일 설명자는 qemu-kvm 프로세스에서 소유합니다. 탭으로 전송되는 프레임(하이퍼 바이저의 관점에서 TX)은 qemu-kvm 내부의 L2 프레임으로 끝납니다. 그러면 가상 네트워크 인터페이스에 수신되는 네트워크 패킷이 VM(VM의 관점에서 RX)에 수신될 때 해당 프레임이 VM의 가상 네트워크 장치에 공급할 수 있습니다.
TUN/TAP의 주요 개념은 하이퍼바이저의 전송 방향이 가상 머신의 수신 방향이라는 것입니다. 이는 반대 방향으로도 마찬가지입니다. 하이퍼바이저에 대한 수신은 가상 머신에서 전송하는 것과 동일합니다.
virtio-net 장치에는 패킷의 "링 버퍼"가 없습니다. 즉, VM이 수신되지 않기 때문에 TUN/TAP 장치의 TX 큐가 채워지면 (충분하게 또는 전혀) 새 패킷이 이동하려면 하이퍼바이저가 탭에서 TX 손실이 발생합니다.
TUN/TAP에서 TX 손실이 발생하는 경우 이를 방지하기 위해 탭 txqueuelen 을 늘리면 RX 링 버퍼를 늘려 물리적 NIC에서 손실 수신을 중지하는 것과 유사합니다.
그러나 VM이 수신 시 "가장 낮음"과 "해결"이라고 가정합니다. VM이 항상 충분히 빠르게 실행되지 않거나 전혀 수신하지 않으면 TX 큐 길이를 조정하는 데 도움이 되지 않습니다. VM이 실행되고 있지 않거나 수신되지 않는 이유를 찾아야 합니다.
4.2.1. 해결방법
더 높은 대기 시간 및 기타 불리한 비용으로 소형 정지를 완화하려면 TX 큐를 늘립니다.
txqueuelen 을 일시적으로 늘리려면 다음 명령을 사용하십시오.
/sbin/ip link set tap<uuid> txqueuelen <new queue length>
4.2.2. 진단 단계
다음 스크립트를 사용하여 CPU 시간이 하이퍼바이저에서 도용되는 영향을 확인합니다.
[root@ibm-x3550m4-9 ~]# cat generate-tx-drops.sh
#!/bin/bash

trap 'cleanup' INT

cleanup() {
  echo "Cleanup ..."
  if [ "x$HPING_PID" != "x" ]; then
    echo "Killing hping3 with PID $HPING_PID"
    kill $HPING_PID
  fi
  if [ "x$DD_PID" != "x" ]; then
    echo "Killing dd with PID $DD_PID"
    kill $DD_PID
  fi
  exit 0
}

VM_IP=10.0.0.20
VM_TAP=tapc18eb09e-01
VM_INSTANCE_ID=instance-00000012
LAST_CPU=$( lscpu | awk '/^CPU\(s\):/ { print $NF - 1 }' )
# this is a 12 core system, we are sending everything to CPU 11,
# so the taskset mask is 800 so set dd affinity only for last CPU
TASKSET_MASK=800

# pinning vCPU to last pCPU
echo "virsh vcpupin $VM_INSTANCE_ID 0 $LAST_CPU"
virsh vcpupin $VM_INSTANCE_ID 0 $LAST_CPU

# make sure that: nova secgroup-add-rule default udp 1 65535 0.0.0.0/0
# make sure that: nova secgroup-add-rule default tcp 1 65535 0.0.0.0/0
# make sure that: nova secgroup-add-rule default icmp -1 -1 0.0.0.0/0
# --fast, --faster or --flood can also be used
echo "hping3 -u -p 5000 $VM_IP --faster > /dev/null "
hping3 -u -p 5000 $VM_IP --faster > /dev/null &
HPING_PID=$!

echo "hping is running, but dd not yet:"
for i in { 1 .. 3 }; do
  date
  echo "ip -s -s link ls dev $VM_TAP"
  ip -s -s link ls dev $VM_TAP
  sleep 5
done

echo "Starting dd and pinning it to the same pCPU as the instance"
echo "dd if=/dev/zero of=/dev/null"
dd if=/dev/zero of=/dev/null &
DD_PID=$!
echo "taskset -p $TASKSET_MASK $DD_PID"
taskset -p $TASKSET_MASK $DD_PID

for i in { 1 .. 3 }; do
  date
  echo "ip -s -s link ls dev $VM_TAP"
  ip -s -s link ls dev $VM_TAP
  sleep 5
done

cleanup
인스턴스에 로그인하고 dd if=/dev/zero of=/dev/null 을 시작하여 유일한 vCPU에서 추가 로드를 생성합니다. 이는 설명용입니다. VM 내에서 로드 없이 동일한 테스트를 반복할 수 있습니다. TX 드롭은 하이퍼바이저의 다른 프로세스가 인스턴스의 vCPU에서 시간을 도용하는 경우에만 발생합니다.
다음 예제에서는 테스트 전 인스턴스를 보여줍니다.
%Cpu(s): 22.3 us, 77.7 sy,  0.0 ni,  0.0 id,  0.0 wa,  0.0 hi,  0.0 si,  0.0 st
KiB Mem :  1884108 total,  1445636 free,    90536 used,   347936 buff/cache
KiB Swap:        0 total,        0 free,        0 used.  1618720 avail Mem

  PID USER      PR  NI    VIRT    RES    SHR S %CPU %MEM     TIME+ COMMAND
30172 root      20   0  107936    620    528 R 99.9  0.0   0:05.89 dd
다음 스크립트를 실행하고 TX 큐에서 삭제된 패키지를 확인합니다. 이는 dd 프로세스가 인스턴스 CPU에서 상당한 처리 시간을 사용하는 경우에만 발생합니다.
[root@ibm-x3550m4-9 ~]# ./generate-tx-drops.sh
virsh vcpupin instance-00000012 0 11

hping3 -u -p 5000 10.0.0.20 --faster > /dev/null
hping is running, but dd not yet:
Tue Nov 29 12:28:22 EST 2016
ip -s -s link ls dev tapc18eb09e-01
69: tapc18eb09e-01: <BROADCAST,MULTICAST,UP,LOWER_UP> mtu 1500 qdisc pfifo_fast master qbrc18eb09e-01 state UNKNOWN mode DEFAULT qlen 1000
    link/ether fe:16:3e:a5:17:c0 brd ff:ff:ff:ff:ff:ff
    RX: bytes  packets  errors  dropped overrun mcast
    5500034259301 132047795 0       0       0       0
    RX errors: length   crc     frame   fifo    missed
               0        0       0       0       0
    TX: bytes  packets  errors  dropped carrier collsns
    5481296464 81741449 0       11155280 0       0
    TX errors: aborted  fifo   window heartbeat transns
               0        0       0       0       0
Tue Nov 29 12:28:27 EST 2016
ip -s -s link ls dev tapc18eb09e-01
69: tapc18eb09e-01: <BROADCAST,MULTICAST,UP,LOWER_UP> mtu 1500 qdisc pfifo_fast master qbrc18eb09e-01 state UNKNOWN mode DEFAULT qlen 1000
    link/ether fe:16:3e:a5:17:c0 brd ff:ff:ff:ff:ff:ff
    RX: bytes  packets  errors  dropped overrun mcast
    5500055729011 132445382 0       0       0       0
    RX errors: length   crc     frame   fifo    missed
               0        0       0       0       0
    TX: bytes  packets  errors  dropped carrier collsns
    5502766282 82139038 0       11155280 0       0
    TX errors: aborted  fifo   window heartbeat transns
               0        0       0       0       0
Tue Nov 29 12:28:32 EST 2016
ip -s -s link ls dev tapc18eb09e-01
69: tapc18eb09e-01: <BROADCAST,MULTICAST,UP,LOWER_UP> mtu 1500 qdisc pfifo_fast master qbrc18eb09e-01 state UNKNOWN mode DEFAULT qlen 1000
    link/ether fe:16:3e:a5:17:c0 brd ff:ff:ff:ff:ff:ff
    RX: bytes  packets  errors  dropped overrun mcast
    5500077122125 132841551 0       0       0       0
    RX errors: length   crc     frame   fifo    missed
               0        0       0       0       0
    TX: bytes  packets  errors  dropped carrier collsns
    5524159396 82535207 0       11155280 0       0
    TX errors: aborted  fifo   window heartbeat transns
               0        0       0       0       0
Tue Nov 29 12:28:37 EST 2016
ip -s -s link ls dev tapc18eb09e-01
69: tapc18eb09e-01: <BROADCAST,MULTICAST,UP,LOWER_UP> mtu 1500 qdisc pfifo_fast master qbrc18eb09e-01 state UNKNOWN mode DEFAULT qlen 1000
    link/ether fe:16:3e:a5:17:c0 brd ff:ff:ff:ff:ff:ff
    RX: bytes  packets  errors  dropped overrun mcast
    5500098181033 133231531 0       0       0       0
    RX errors: length   crc     frame   fifo    missed
               0        0       0       0       0
    TX: bytes  packets  errors  dropped carrier collsns
    5545218358 82925188 0       11155280 0       0
    TX errors: aborted  fifo   window heartbeat transns
               0        0       0       0       0
Tue Nov 29 12:28:42 EST 2016
ip -s -s link ls dev tapc18eb09e-01
69: tapc18eb09e-01: <BROADCAST,MULTICAST,UP,LOWER_UP> mtu 1500 qdisc pfifo_fast master qbrc18eb09e-01 state UNKNOWN mode DEFAULT qlen 1000
    link/ether fe:16:3e:a5:17:c0 brd ff:ff:ff:ff:ff:ff
    RX: bytes  packets  errors  dropped overrun mcast
    5500119152685 133619793 0       0       0       0
    RX errors: length   crc     frame   fifo    missed
               0        0       0       0       0
    TX: bytes  packets  errors  dropped carrier collsns
    5566184804 83313451 0       11155280 0       0
    TX errors: aborted  fifo   window heartbeat transns
               0        0       0       0       0
Starting dd and pinning it to the same pCPU as the instance
dd if=/dev/zero of=/dev/null
taskset -p 800 8763
pid 8763's current affinity mask: fff
pid 8763's new affinity mask: 800
Tue Nov 29 12:28:47 EST 2016
ip -s -s link ls dev tapc18eb09e-01
69: tapc18eb09e-01: <BROADCAST,MULTICAST,UP,LOWER_UP> mtu 1500 qdisc pfifo_fast master qbrc18eb09e-01 state UNKNOWN mode DEFAULT qlen 1000
    link/ether fe:16:3e:a5:17:c0 brd ff:ff:ff:ff:ff:ff
    RX: bytes  packets  errors  dropped overrun mcast
    5500140267091 134010698 0       0       0       0
    RX errors: length   crc     frame   fifo    missed
               0        0       0       0       0
    TX: bytes  packets  errors  dropped carrier collsns
    5587300452 83704477 0       11155280 0       0
    TX errors: aborted  fifo   window heartbeat transns
               0        0       0       0       0
Tue Nov 29 12:28:52 EST 2016
ip -s -s link ls dev tapc18eb09e-01
69: tapc18eb09e-01: <BROADCAST,MULTICAST,UP,LOWER_UP> mtu 1500 qdisc pfifo_fast master qbrc18eb09e-01 state UNKNOWN mode DEFAULT qlen 1000
    link/ether fe:16:3e:a5:17:c0 brd ff:ff:ff:ff:ff:ff
    RX: bytes  packets  errors  dropped overrun mcast
    5500159822749 134372711 0       0       0       0
    RX errors: length   crc     frame   fifo    missed
               0        0       0       0       0
    TX: bytes  packets  errors  dropped carrier collsns
    5606853168 84066563 0       11188074 0       0
    TX errors: aborted  fifo   window heartbeat transns
               0        0       0       0       0
Tue Nov 29 12:28:57 EST 2016
ip -s -s link ls dev tapc18eb09e-01
69: tapc18eb09e-01: <BROADCAST,MULTICAST,UP,LOWER_UP> mtu 1500 qdisc pfifo_fast master qbrc18eb09e-01 state UNKNOWN mode DEFAULT qlen 1000
    link/ether fe:16:3e:a5:17:c0 brd ff:ff:ff:ff:ff:ff
    RX: bytes  packets  errors  dropped overrun mcast
    5500179161241 134730729 0       0       0       0
    RX errors: length   crc     frame   fifo    missed
               0        0       0       0       0
    TX: bytes  packets  errors  dropped carrier collsns
    5626179144 84424451 0       11223096 0       0
    TX errors: aborted  fifo   window heartbeat transns
               0        0       0       0       0
Tue Nov 29 12:29:02 EST 2016
ip -s -s link ls dev tapc18eb09e-01
69: tapc18eb09e-01: <BROADCAST,MULTICAST,UP,LOWER_UP> mtu 1500 qdisc pfifo_fast master qbrc18eb09e-01 state UNKNOWN mode DEFAULT qlen 1000
    link/ether fe:16:3e:a5:17:c0 brd ff:ff:ff:ff:ff:ff
    RX: bytes  packets  errors  dropped overrun mcast
    5500198344463 135085948 0       0       0       0
    RX errors: length   crc     frame   fifo    missed
               0        0       0       0       0
    TX: bytes  packets  errors  dropped carrier collsns
    5645365410 84779752 0       11260740 0       0
    TX errors: aborted  fifo   window heartbeat transns
               0        0       0       0       0
Tue Nov 29 12:29:07 EST 2016
ip -s -s link ls dev tapc18eb09e-01
69: tapc18eb09e-01: <BROADCAST,MULTICAST,UP,LOWER_UP> mtu 1500 qdisc pfifo_fast master qbrc18eb09e-01 state UNKNOWN mode DEFAULT qlen 1000
    link/ether fe:16:3e:a5:17:c0 brd ff:ff:ff:ff:ff:ff
    RX: bytes  packets  errors  dropped overrun mcast
    5500217014275 135431570 0       0       0       0
    RX errors: length   crc     frame   fifo    missed
               0        0       0       0       0
    TX: bytes  packets  errors  dropped carrier collsns
    5664031398 85125418 0       11302179 0       0
    TX errors: aborted  fifo   window heartbeat transns
               0        0       0       0       0
Cleanup ...
Killing hping3 with PID 8722
Killing dd with PID 8763
[root@ibm-x3550m4-9 ~]#
--- 10.0.0.20 hping statistic ---
3919615 packets transmitted, 0 packets received, 100% packet loss
round-trip min/avg/max = 0.0/0.0/0.0 ms
다음 예제에서는 테스트 중 하이퍼바이저에 dd 의 영향을 보여줍니다. st 레이블은 하이퍼바이저에서 유출된 시간의 백분율을 나타냅니다.
%Cpu(s):  7.0 us, 27.5 sy,  0.0 ni,  0.0 id,  0.0 wa,  0.0 hi, 20.2 si, 45.4 st
KiB Mem :  1884108 total,  1445484 free,    90676 used,   347948 buff/cache
KiB Swap:        0 total,        0 free,        0 used.  1618568 avail Mem

  PID USER      PR  NI    VIRT    RES    SHR S %CPU %MEM     TIME+ COMMAND
30172 root      20   0  107936    620    528 R 54.3  0.0   1:00.50 dd
테스트가 너무 오래 실행되는 경우 시간 초과 가능성을 포함하여 인스턴스의 테스트의 두 번째 절반 동안 ssh 가 느려질 수 있습니다.
4.3. 해결책
TX 큐를 늘리면 이러한 소형 정지를 완화하는 데 도움이 되지만 커널 매개변수에서 CPU 고정 및 isolcpu를 완전히 격리하는 것이 최상의 솔루션입니다. 자세한 내용은 OpenStack에서 NUMA로 CPU 고정 구성을 참조하십시오.
5장. Open vSwitch DPDK를 사용한 인스턴스 VHU 인터페이스의 TX Drops
다음 절차를 사용하여 인스턴스 vHU(VHU) 인터페이스에서 전송 드롭의 문제를 해결합니다.
5.1. 증상
커널은 커널 또는 qemu 프로세스를 통과하지 않고 virtio 전송을 사용하여 vswitch에서 게스트로 이동합니다. 이는 VHU 인터페이스를 사용한 패킷을 통해 수행됩니다.
VHU는 주로 DPDK librte_vhost에 의해 구현되며 패킷 배치를 전송하거나 수신하는 기능도 제공합니다. VHU의 백엔드는 가상 머신과 패킷을 교환하기 위해 qemu에서 제공하는 virtio 링입니다. virtio 링에는 설명자 및 버퍼로 구성된 특수 형식이 있습니다.
TX/RX(transmit/receive) 통계는 OVS(OpenvSwitch)용 통계입니다. 즉, 전송 통계는 VM에 대한 통계 수신과 직접 관련이 있습니다.
VM이 패킷을 충분히 빠르게 처리하지 않으면 OVS TX 큐가 오버플로우되고 패킷을 삭제합니다.
5.1.1. 패킷 드롭다운에 대한 설명
포화화된 virtio 링으로 인해 TX가 vhost-user 장치에 드롭됩니다. virtio 링은 게스트 메모리에 있으며, vhost-user가 패킷을 푸시하고 VM에서 사용하는 대기열처럼 작동합니다. VM이 패킷을 사용하기에 충분히 빠르지 않으면 virtio 링이 버퍼가 부족하고 vhost-user가 패킷을 삭제합니다.
Perf 및 Ftrace 툴을 사용하여 패킷 드롭 문제를 해결합니다.
- Perf를 사용하여 qemu 스레드 선점 여부를 표시할 수 있는 스케줄러 스위치 수를 계산합니다.
- Ftrace를 사용하여 선점의 이유와 시간을 표시합니다.
선점을 위한 이유는 다음과 같습니다.
시간 중단(커널 정상적인 시간):
이는 적어도 두 개의 컨텍스트 전환 비용이 추가됩니다. 타이머 인터럽트는 또한 예기치 않은 시간이 걸릴 수 있는 RCU(Read-copy update) 콜백을 실행할 수 있습니다.
- CPU 전원 관리 및 하이퍼 스레딩
이러한 도구는 다음 패키지에서 찾을 수 있습니다.
5.1.2. 다른 드롭 다운에 대한 설명
OVS 2.9 이전에는 vHost 사용자 포트가 in dpdkvhostuser 모드로 생성되었습니다. 이 모드에서 OVS는 vhost 서버 역할을 하며 QEMU가 클라이언트 역할을 합니다. 인스턴스가 중단되거나 재시작되면 OVS 브리지의 vhost 사용자 포트가 계속 활성 상태이면 VM에 대해 설정된 패킷을 삭제합니다. 이렇게 하면 tx_drop_counter 가 증가합니다.
다음 예에서는 nova stop <UUID> 를 사용하여 VM이 중지되었습니다.
[root@overcloud-compute-0 network-scripts]# ovs-vsctl list interface vhubd172106-73 | grep _state
admin_state         : up
link_state          : down
이는 ip link set dev <br internal port name> down 및 frame이 사용자 공간에 삭제되어 커널 포트가 종료될 때 발생하는 것과 유사합니다.
VM이 가동되면 동일한 vhu 소켓에 연결되고 virtio 링 버퍼를 비우기 시작합니다. TX는 더 이상 중단되지 않으며 정상적인 네트워크 트래픽이 재개됩니다.
5.1.3. DPDK의 TX 및 RX 큐 길이 증가
다음 OpenStack director 템플릿을 수정하여 DPDK의 TX 및 RX 큐 길이를 변경할 수 있습니다.
NovaComputeExtraConfig:
        nova::compute::libvirt::rx_queue_size: '"1024"'
        nova::compute::libvirt::tx_queue_size: '"1024"'
다음 예제에서는 검증 검사를 보여줍니다.
[root@overcloud-compute-1 ~]# ovs-vsctl get interface vhu9a9b0feb-2e status
{features="0x0000000150208182", mode=client, num_of_vrings="2", numa="0",
socket="/var/lib/vhost_sockets/vhu9a9b0feb-2e", status=connected, "vring_0_size"="1024",
"vring_1_size"="1024"}

[root@overcloud-compute-1 ~]# virsh dumpxml instance-00000017 | grep rx
<driver rx_queue_size='1024' tx_queue_size='1024'/>
<driver rx_queue_size='1024' tx_queue_size='1024'/>
커널 제한으로 인해 1024 이상으로 큐 크기를 늘릴 수 없습니다.
DPDK를 통해 neutron 네트워크에 PXE 부팅을 사용할 수 있도록 계획하는 경우 PXE 버전이 1024바이트를 지원하는지 확인해야 합니다.
5.2. 진단
게스트가 패킷을 수신할 수 없는 경우 TX가 vhost 사용자 포트로 드롭된 것을 확인할 수 있습니다. TCP는 일반적인 네트워크 조건에서 발생하는 패킷 손실에서 복구하도록 설계되었습니다. NFVi는 패킷 드롭에 대한 허용성이 저하되는 엄격한 요구 사항을 가지고 있습니다.
NFVi의 경우 커널 datapath가 너무 느릴 때 DPDK 가속 OVS를 사용합니다. 또한 호스트의 패킷 처리 속도와 일치시킬 수 있는 DPDK 지원 게스트를 배포하는 것이 중요합니다.
5.3. 해결책
VM에 할당된 vCPU가 게스트의 작업만 처리하는지 확인합니다.
다음 템플릿 매개변수를 사용하여 클러스터가 배포되었는지 확인합니다.
-
IsolcpusList: 예약에서 CPU를 제거 -
NovaVcpuPinSet: 고정을 위해 CPU 할당 -
NovaComputeCpuSharedSet: 에뮬레이터 스레드 고정에 CPU 할당
-
예제:
    parameter_defaults:
      ComputeOvsDpdkParameters:
        KernelArgs: "default_hugepagesz=1GB hugepagesz=1G hugepages=32 iommu=pt intel_iommu=on isolcpus=2-19,22-39"
        IsolCpusList: "2-19,22-39"
        NovaVcpuPinSet: ['4-19,24-39']
        NovaReservedHostMemory: 4096
        OvsDpdkSocketMemory: "3072,1024"
        OvsDpdkMemoryChannels: "4"
        OvsDpdkCoreList: "0,20,1,21"
        OvsPmdCoreList: "2,22,3,23"
NovaComputeCpuSharedSet: [0,20,1,21]- 고정 CPU 및 에뮬레이터 풀 세트를 사용하는 플레이버와 함께 VM을 배포해야 합니다.
예제:
openstack flavor create --ram <size_mb> --disk <size_gb> -\
-vcpus <vcpus> --property dpdk=true \
--property hw:mem_page_size=1G \
--property hw:cpu_policy=dedicated \
--property hw:emulator_threads_policy=share <flavor>
- 이러한 설정이 의도한 대로 작동하는지 확인합니다. 자세한 내용은 Simple Compute Node CPU Partitioning and Memory Checks 를 참조하십시오.
인스턴스에 완전히 전용 CPU 리소스를 할당하고 네트워크 패킷 손실을 계속 관찰하는 경우 인스턴스가 올바르게 조정되고 DPDK가 활성화되어 있는지 확인합니다.
6장. DPDK를 사용하여 Open vSwitch에서 pmd-stats-show 명령의 출력 해석
DPDK와 함께 OVS(Open vSwitch)에서 pmd-stats-show 명령(ovs-appctl dpif-netdev/pmd-stats-show)의 출력을 해석하려면 이 섹션을 사용합니다.
6.1. 증상
ovs-appctl dpif-netdev/pmd-stats-show 명령은 부정확한 측정을 제공합니다. 이는 PMD가 시작된 이후 차트로 작성된 수집 통계 때문입니다.
6.2. 진단
유용한 출력을 얻으려면 시스템을 안정적인 상태로 설정하고 측정하려는 통계를 재설정합니다.
# put system into steady state
ovs-appctl dpif-netdev/pmd-stats-clear
# wait <x> seconds
sleep <x>
ovs-appctl dpif-netdev/pmd-stats-show
출력 예는 다음과 같습니다.
[root@overcloud-compute-0 ~]# ovs-appctl dpif-netdev/pmd-stats-clear && sleep 10 && ovs-appctl dpif-netdev/pmd-stats-show |
egrep 'core_id (2|22):' -A9
pmd thread numa_id 0 core_id 22:
    emc hits:17461158
    megaflow hits:0
    avg. subtable lookups per hit:0.00
    miss:0
    lost:0
    polling cycles:4948219259 (25.81%)
    processing cycles:14220835107 (74.19%)
    avg cycles per packet: 1097.81 (19169054366/17461158)
    avg processing cycles per packet: 814.43 (14220835107/17461158)
--
pmd thread numa_id 0 core_id 2:
    emc hits:14874381
    megaflow hits:0
    avg. subtable lookups per hit:0.00
    miss:0
    lost:0
    polling cycles:5460724802 (29.10%)
    processing cycles:13305794333 (70.90%)
    avg cycles per packet: 1261.67 (18766519135/14874381)
    avg processing cycles per packet: 894.54 (13305794333/14874381)
core_id 2 는 주로 사용 중이므로 시간 처리의 70%와 폴링의 30%를 사용합니다.
polling cycles:5460724802 (29.10%)
processing cycles:13305794333 (70.90%)
이 예에서 miss 는 DPDK 데이터 경로('emc' 또는 'dp' 분류자)에서 분류되지 않은 패킷을 나타냅니다. 정상적인 상황에서는 프로토 계층으로 전송됩니다. 드물지만 흐름 재활성화 잠금으로 인해 또는 proto 계층이 오류를 반환하면 패킷이 삭제됩니다. 이 경우 손실된 값도 손실을 나타내기 위해 증가합니다.
emc hits:14874381
megaflow hits:0
avg. subtable lookups per hit:0.00
miss:0
lost:0
자세한 내용은 OVS-DPDK Datapath Classifier 를 참조하십시오.
6.3. 해결책
이 섹션에서는 ovs-appctl 명령을 사용하여 트래픽 흐름을 확인하는 절차를 보여줍니다.
6.3.1. 유휴 PMD
다음 예제에서는 core_ids가 dpdk0을 통해 전달되는 관리 트래픽만 dpdk0에 고정되는 PMD를 제공하는 시스템을 보여줍니다.
[root@overcloud-compute-0 ~]# ovs-appctl dpif-netdev/pmd-stats-clear && sleep 10 && ovs-appctl dpif-netdev/pmd-stats-show |
egrep 'core_id (2|22):' -A9
pmd thread numa_id 0 core_id 22:
    emc hits:0
    megaflow hits:0
    avg. subtable lookups per hit:0.00
    miss:0
    lost:0
    polling cycles:12613298746 (100.00%)
    processing cycles:0 (0.00%)
--
pmd thread numa_id 0 core_id 2:
    emc hits:5
    megaflow hits:0
    avg. subtable lookups per hit:0.00
    miss:0
    lost:0
    polling cycles:12480023709 (100.00%)
    processing cycles:14354 (0.00%)
    avg cycles per packet: 2496007612.60 (12480038063/5)
    avg processing cycles per packet: 2870.80 (14354/5)
6.3.2. 패킷 드롭을 사용한 로드 테스트 아래의 PMD
다음 예제에서는 core_ids가 dpdk0을 통해 이동하는 로드 테스트와 함께 dpdk0에 고정된 PMD를 제공하는 시스템을 보여줍니다.
[root@overcloud-compute-0 ~]# ovs-appctl dpif-netdev/pmd-stats-clear && sleep 10 && ovs-appctl dpif-netdev/pmd-stats-show |
egrep 'core_id (2|4|22|24):' -A9
pmd thread numa_id 0 core_id 22:
    emc hits:35497952
    megaflow hits:0
    avg. subtable lookups per hit:0.00
    miss:0
    lost:0
    polling cycles:1446658819 (6.61%)
    processing cycles:20453874401 (93.39%)
    avg cycles per packet: 616.95 (21900533220/35497952)
    avg processing cycles per packet: 576.20 (20453874401/35497952)
--
pmd thread numa_id 0 core_id 2:
    emc hits:30183582
    megaflow hits:0
    avg. subtable lookups per hit:0.00
    miss:2
    lost:0
    polling cycles:1497174615 (6.85%)
    processing cycles:20354613261 (93.15%)
    avg cycles per packet: 723.96 (21851787876/30183584)
    avg processing cycles per packet: 674.36 (20354613261/30183584)
패킷이 떨어지면 처리 사이클 대 폴링 사이클 (90 % 이상의 처리 사이클)의 높은 비율을 볼 수 있습니다.
polling cycles:1497174615 (6.85%)
processing cycles:20354613261 (93.15%)
패킷당 평균 사이클 (CPP) 및 패킷당 평균 처리 사이클 (PCPP)을 확인합니다. 유휴 사이클이 계산되지 않으므로 완전히 로드된 PMD의 경우 PCPP/CPP 비율이 1일 것으로 예상할 수 있습니다.
avg cycles per packet: 723.96 (21851787876/30183584)
avg processing cycles per packet: 674.36 (20354613261/30183584)
6.3.3. loadtest 아래에 있는 PMD 및 50%의 capacity
다음 예제에서는 core_ids가 dpdk0에 고정되는 PMD를 제공하는 시스템을 보여줍니다. dpdk0을 통해 로드 테스트가 전달되고 이 dpdk0 인터페이스의 6.4 Mpp(최대 용량의 약 50%)를 전송합니다(약 12.85 Mpps).
[root@overcloud-compute-0 ~]# ovs-appctl dpif-netdev/pmd-stats-clear && sleep 10 && ovs-appctl dpif-netdev/pmd-stats-show |
egrep 'core_id (2|4|22|24):' -A9
pmd thread numa_id 0 core_id 22:
    emc hits:17461158
    megaflow hits:0
    avg. subtable lookups per hit:0.00
    miss:0
    lost:0
    polling cycles:4948219259 (25.81%)
    processing cycles:14220835107 (74.19%)
    avg cycles per packet: 1097.81 (19169054366/17461158)
    avg processing cycles per packet: 814.43 (14220835107/17461158)
--
pmd thread numa_id 0 core_id 2:
    emc hits:14874381
    megaflow hits:0
    avg. subtable lookups per hit:0.00
    miss:0
    lost:0
    polling cycles:5460724802 (29.10%)
    processing cycles:13305794333 (70.90%)
    avg cycles per packet: 1261.67 (18766519135/14874381)
    avg processing cycles per packet: 894.54 (13305794333/14874381)
pps가 인터페이스의 최대 절반 정도인 경우, 처리 주기 대 폴링 주기(약 70% 처리 주기)의 더 낮은 비율을 볼 수 있습니다.
polling cycles:5460724802 (29.10%)
processing cycles:13305794333 (70.90%)
6.3.4. hit vs miss vs 손실
다음 예제는 주제와 관련된 도움말 페이지를 보여줍니다.
an ovs-vswitchd
(...)
   DPIF-NETDEV COMMANDS
       These commands are used to expose  internal  information  (mostly  statistics)
       about  the  `dpif-netdev`  userspace datapath. If there is only one datapath
       (as is often the case, unless dpctl/ commands are used), the dp  argument  can
       be omitted.

       dpif-netdev/pmd-stats-show [dp]
              Shows  performance  statistics  for each pmd thread of the datapath dp.
              The special thread ``main'' sums up the statistics  of  every  non  pmd
              thread.   The  sum of ``emc hits'', ``masked hits'' and ``miss'' is the
              number of packets received by the datapath.  Cycles are  counted  using
              the  TSC  or  similar  facilities when available on the platform.  To
              reset these counters use dpif-netdev/pmd-stats-clear. The  duration  of
              one cycle depends on the measuring infrastructure.
(...)

Raw

man ovs-dpctl
(...)
       dump-dps
              Prints the name of each configured datapath on a separate line.

       [-s | --statistics] show [dp...]
              Prints  a summary of configured datapaths, including their datapath numbers and a list of ports connected to each datapath.  (The local port is
              identified as port 0.)  If -s or --statistics is specified, then packet and byte counters are also printed for each port.

              The datapath numbers consists of flow stats and mega flow mask stats.

              The "lookups" row displays three stats related to flow lookup triggered by processing incoming packets in the datapath. "hit"  displays  number
              of  packets  matches  existing flows. "missed" displays the number of packets not matching any existing flow and require user space processing.
              "lost" displays number of packets destined for user space process but subsequently dropped before reaching userspace.  The  sum  of  "hit"  and
              "miss" equals to the total number of packets datapath processed.
(...)

Raw

man ovs-vswitchd
(...)
       dpctl/show [-s | --statistics] [dp...]
              Prints a summary of configured datapaths, including their datapath numbers and a list of ports connected to each datapath.  (The local port is  identified  as
              port 0.)  If -s or --statistics is specified, then packet and byte counters are also printed for each port.

              The datapath numbers consists of flow stats and mega flow mask stats.

              The  "lookups"  row  displays  three  stats  related to flow lookup triggered by processing incoming packets in the datapath. "hit" displays number of packets
              matches existing flows. "missed" displays the number of packets not matching any existing flow and require user space processing.  "lost" displays  number  of
              packets  destined for user space process but subsequently dropped before reaching userspace. The sum of "hit" and "miss" equals to the total number of packets
              datapath processed.
(...)
일부 문서는 커널 datapath를 참조하기 때문에 사용자 공간 처리가 표시되면 패킷이 커널 sw 캐시 (equivalents to emc & dpcls)에서 분류되지 않고 사용자 공간의proto 계층으로 전송됩니다.
7장. nova에서 SR-IOV 포트 연결 및 분리
다음 섹션을 사용하여 SR-IOV 포트를 연결 및 분리합니다.
7.1. 증상
Red Hat OpenStack Platform 10 이상 nova에서 SR-IOV 포트를 연결하거나 분리할 수 없습니다. Nova 로그는 아직 VIF 유형 hw_veb에 대한 변환이 표시되지 않습니다.
7.2. 진단
SR-IOV 포트를 이미 생성된 인스턴스에 연결하거나 분리할 수 없습니다. SR-IOV 포트는 인스턴스 생성 시 연결해야 합니다.
7.3. 해결책
다음 예제에서는 인스턴스가 부팅된 후 인터페이스를 연결하려고 하는 방법을 보여줍니다.
RHEL_INSTANCE_COUNT=1
NETID=$(neutron net-list | grep provider1 | awk '{print $2}')
for i in `seq 1 $RHEL_INSTANCE_COUNT`;do
#  nova floating-ip-create provider1
  portid1=`neutron port-create sriov1 --name sriov1 --binding:vnic-type direct  | awk '$2 == "id" {print $(NF-1)}'`
  portid2=`neutron port-create sriov2 --name sriov2 --binding:vnic-type direct  | awk '$2 == "id" {print $(NF-1)}'`
  openstack server create --flavor m1.small  --image rhel --nic net-id=$NETID --key-name id_rsa   sriov_vm${i}
  serverid=`openstack server list | grep sriov_vm${i} | awk '{print $2}'`
  status="NONE"
  while [ "$status" != "ACTIVE" ]; do
    echo "Server $serverid not active ($status)" ; sleep 5 ;
    status=`openstack server show $serverid | grep -i status | awk '{print $4}'`
  done
  nova interface-attach --port-id $portid1 $serverid
  nova interface-attach --port-id $portid2 $serverid
done
이 오류는 다음과 같은 오류와 함께 실패합니다.
ERROR (ClientException): Unexpected API Error. Please report this at http://bugs.launchpad.net/nova/ and attach the Nova API log if possible.
<type 'exceptions.KeyError'> (HTTP 500) (Request-ID: req-36b544f4-91a6-442e-a30d-6148220d1449)
올바른 방법은 SR-IOV 포트를 사용하여 직접 인스턴스를 생성하는 것입니다.
RHEL_INSTANCE_COUNT=1
NETID=$(neutron net-list | grep provider1 | awk '{print $2}')
for i in `seq 1 $RHEL_INSTANCE_COUNT`;do
#  nova floating-ip-create provider1
  portid1=`neutron port-create sriov1 --name sriov1 --binding:vnic-type direct  | awk '$2 == "id" {print $(NF-1)}'`
  portid2=`neutron port-create sriov2 --name sriov2 --binding:vnic-type direct  | awk '$2 == "id" {print $(NF-1)}'`
  openstack server create --flavor m1.small  --image rhel --nic net-id=$NETID --nic port-id=$portid1 --nic port-id=$portid2 --key-name id_rsa   sriov_vm${i}
done
8장. Open vSwitch DPDK를 사용하여 LACP 결합 구성 및 테스트
LACP를 사용한 OVS 본딩은 사용 중인 RHOSP(Red Hat OpenStack Platform) 버전에 따라 지원되지 않을 수 있습니다. 제품 설명서를 확인하여 LACP를 사용한 OVS 본딩이 지원되는지 확인합니다.
Open vSwitch DPDK를 사용하여 LACP 본딩을 구성하고 테스트하려면 다음 작업을 완료합니다.
- LACP의 스위치 포트를 구성합니다.
- LACP용 Linux 커널 본딩을 기준으로 구성합니다.
- LACP에 대해 OVS DPDK 본딩을 구성합니다.
이 주제에서는 Dell S4048-ON 스위치를 사용한 스위치 구성에 대해 설명합니다. RHEL 및 OVS 구성은 동일하게 유지되지만 다른 스위치 벤더의 운영 체제는 다른 구문을 사용하여 LACP를 구성합니다.
8.1. LACP의 스위치 포트 구성
스위치 인터페이스를 기본 설정으로 재설정합니다.
S4048-ON-sw#config t
S4048-ON-sw(conf)#default int te1/2
S4048-ON-sw(conf)#default int te1/7
포트 채널 및 기타 포트 설정을 구성합니다.
S4048-ON-sw(conf)#int range te1/2,te1/7
S4048-ON-sw(conf-if-range-te-1/2,te-1/7)#port-channel-protocol lacp
S4048-ON-sw(conf-if-range-te-1/2,te-1/7-lacp)#
S4048-ON-sw(conf-if-range-te-1/2,te-1/7-lacp)#port-channel 1 mode active
S4048-ON-sw(conf-if-range-te-1/2,te-1/7-lacp)#end
S4048-ON-sw#config t
S4048-ON-sw(conf)#int range te1/2,te1/7
S4048-ON-sw(conf-if-range-te-1/2,te-1/7)# no ip address
S4048-ON-sw(conf-if-range-te-1/2,te-1/7)# mtu 9216
S4048-ON-sw(conf-if-range-te-1/2,te-1/7)# flowcontrol rx on tx off
S4048-ON-sw(conf-if-range-te-1/2,te-1/7)# no shutdown
S4048-ON-sw(conf-if-range-te-1/2,te-1/7)#end
S4048-ON-sw#show run int te1/2
!
interface TenGigabitEthernet 1/2
 no ip address
 mtu 9216
 flowcontrol rx on tx off
!
 port-channel-protocol LACP
  port-channel 1 mode active
 no shutdown
VLAN을 구성합니다.
S4048-ON-sw#config t
S4048-ON-sw(conf)#int range vlan901-909
S4048-ON-sw(conf-if-range-vl-901-909)#tagged Port-channel 1
S4048-ON-sw(conf-if-range-vl-901-909)#end
S4048-ON-sw#
VLAN 태그를 확인합니다.
S4048-ON-sw#show vlan id 902

Codes: * - Default VLAN, G - GVRP VLANs, R - Remote Port Mirroring VLANs, P - Primary, C - Community, I - Isolated
       O - Openflow, Vx - Vxlan
Q: U - Untagged, T - Tagged
   x - Dot1x untagged, X - Dot1x tagged
   o - OpenFlow untagged, O - OpenFlow tagged
   G - GVRP tagged, M - Vlan-stack
   i - Internal untagged, I - Internal tagged, v - VLT untagged, V - VLT tagged

    NUM    Status    Description                     Q Ports
    902    Active    Tenant                          T Po1()
                                                     T Te 1/1,1/3-1/6,1/8-1/20
LACP 구성을 확인합니다.
S4048-ON-sw#show lacp 1
Port-channel 1 admin up, oper down, mode lacp
LACP Fast Switch-Over Disabled
Actor   System ID:  Priority 32768, Address 1418.7789.9a8a
Partner System ID:  Priority 0, Address 0000.0000.0000
Actor Admin Key 1, Oper Key 1, Partner Oper Key 1, VLT Peer Oper Key 1
LACP LAG 1 is an individual link

LACP LAG 1 is a normal LAG

A - Active LACP, B - Passive LACP, C - Short Timeout, D - Long Timeout
E - Aggregatable Link, F - Individual Link, G - IN_SYNC, H - OUT_OF_SYNC
I - Collection enabled, J - Collection disabled, K - Distribution enabled
L - Distribution disabled, M - Partner Defaulted, N - Partner Non-defaulted,
O - Receiver is in expired state, P - Receiver is not in expired state

Port Te 1/2 is disabled, LACP is disabled and mode is lacp
Port State: Not in Bundle
  Actor   Admin: State ACEHJLMP Key 1 Priority 32768
           Oper: State ACEHJLMP Key 1 Priority 32768
  Partner is not present

Port Te 1/7 is enabled, LACP is enabled and mode is lacp
Port State: Not in Bundle
  Actor   Admin: State ACEHJLMP Key 1 Priority 32768
           Oper: State ACEHJLMP Key 1 Priority 32768
  Partner is not present
8.2. LACP의 Linux 커널 결합 구성
Linux 커널 본딩을 기준선으로 구성한 다음 호스트가 스위치를 사용하여 LACP 본딩을 구성할 수 있는지 확인합니다.
모든 인터페이스를 커널 공간으로 이동하고 커널 공간 본딩을 사용하여 테스트합니다. 이 예제에서 p1p1은 버스 주소
0000:04:00.0에 매핑되고 p1p2는 버스 주소0000:04:00.1에 매핑됩니다.[root@baremetal ~]# driverctl unset-override 0000:04:00.0 [root@baremetal ~]# driverctl unset-override 0000:04:00.1
본딩 드라이버를 로드하고, 본딩 인터페이스(
bond10) 및슬레이브 인터페이스p1p1 및를 구성합니다.p1p2[root@baremetal ~]# modprobe bonding miimon=100 mode=4 lacp_rate=1 [root@baremetal ~]# ip link add name bond10 type bond [root@baremetal ~]# ifenslave bond10 p1p1 p1p2 Illegal operation; the specified master interface 'bond10' is not up. [root@baremetal ~]# ip link set dev bond10 up [root@baremetal ~]# ifenslave bond10 p1p1 p1p2
RHEL에서 LACP 확인:
[root@baremetal ~]# cat /proc/net/bonding/bond10
Ethernet Channel Bonding Driver: v3.7.1 (April 27, 2011)

Bonding Mode: IEEE 802.3ad Dynamic link aggregation
Transmit Hash Policy: layer2 (0)
MII Status: up
MII Polling Interval (ms): 100
Up Delay (ms): 0
Down Delay (ms): 0
802.3ad info
LACP rate: fast
Min links: 0
Aggregator selection policy (ad_select): stable
System priority: 65535
System MAC address: a0:36:9f:e3:dd:c8
Active Aggregator Info:
        Aggregator ID: 1
        Number of ports: 2
        Actor Key: 13
        Partner Key: 1
        Partner Mac Address: 14:18:77:89:9a:8a

Slave Interface: p1p1
MII Status: up
Speed: 10000 Mbps
Duplex: full
Link Failure Count: 0
Permanent HW addr: a0:36:9f:e3:dd:c8
Slave queue ID: 0
Aggregator ID: 1
Actor Churn State: monitoring
Partner Churn State: monitoring
Actor Churned Count: 0
Partner Churned Count: 0
details actor lacp pdu:
    system priority: 65535
    system mac address: a0:36:9f:e3:dd:c8
    port key: 13
    port priority: 255
        port number: 1
        port state: 63
    details partner lacp pdu:
        system priority: 32768
        system mac address: 14:18:77:89:9a:8a
        oper key: 1
        port priority: 32768
        port number: 203
        port state: 63

    Slave Interface: p1p2
    MII Status: up
    Speed: 10000 Mbps
    Duplex: full
    Link Failure Count: 0
    Permanent HW addr: a0:36:9f:e3:dd:ca
    Slave queue ID: 0
    Aggregator ID: 1
    Actor Churn State: monitoring
    Partner Churn State: monitoring
    Actor Churned Count: 0
    Partner Churned Count: 0
    details actor lacp pdu:
        system priority: 65535
        system mac address: a0:36:9f:e3:dd:c8
        port key: 13
        port priority: 255
        port number: 2
        port state: 63
    details partner lacp pdu:
        system priority: 32768
        system mac address: 14:18:77:89:9a:8a
        oper key: 1
        port priority: 32768
        port number: 208
        port state: 63
스위치에서 LACP를 확인합니다.
S4048-ON-sw#show lacp 1
Port-channel 1 admin up, oper up, mode lacp
LACP Fast Switch-Over Disabled
Actor   System ID:  Priority 32768, Address 1418.7789.9a8a
Partner System ID:  Priority 65535, Address a036.9fe3.ddc8
Actor Admin Key 1, Oper Key 1, Partner Oper Key 13, VLT Peer Oper Key 1
LACP LAG 1 is an aggregatable link
LACP LAG 1 is a normal LAG

A - Active LACP, B - Passive LACP, C - Short Timeout, D - Long Timeout
E - Aggregatable Link, F - Individual Link, G - IN_SYNC, H - OUT_OF_SYNC
I - Collection enabled, J - Collection disabled, K - Distribution enabled
L - Distribution disabled, M - Partner Defaulted, N - Partner Non-defaulted,
O - Receiver is in expired state, P - Receiver is not in expired state

Port Te 1/2 is enabled, LACP is enabled and mode is lacp
Port State: Bundle
  Actor   Admin: State ACEHJLMP Key 1 Priority 32768
           Oper: State ACEGIKNP Key 1 Priority 32768
  Partner Admin: State BDFHJLMP Key 0 Priority 0
           Oper: State ACEGIKNP Key 13 Priority 255

Port Te 1/7 is enabled, LACP is enabled and mode is lacp
Port State: Bundle
  Actor   Admin: State ACEHJLMP Key 1 Priority 32768
           Oper: State ACEGIKNP Key 1 Priority 32768
  Partner Admin: State BDFHJLMP Key 0 Priority 0
           Oper: State ACEGIKNP Key 13 Priority 255
S4048-ON-sw#
본딩 구성을 제거합니다.
[root@baremetal ~]# ip link del dev bond10
[root@baremetal ~]#
본딩 모드 변경에 대한 자세한 내용은 다음을 참조하십시오. 시스템을 재부팅하지 않고 본딩 모드를 변경하는 방법은 무엇입니까?
8.3. LACP의 OVS DPDK 본딩 구성
다음 목표는 OVS DPDK 내에서 LACP 본딩을 구성하는 것입니다.
8.3.1. Open vSwitch 준비
대규모 페이지 및 기타 값이 RHEL에 구성되어 있는지 확인합니다.
[root@baremetal bonding]# cat /proc/cmdline
BOOT_IMAGE=/boot/vmlinuz-3.10.0-693.17.1.el7.x86_64 root=UUID=fa414390-f78d-49d4-a164-54615a32977b ro console=tty0
console=ttyS0,115200n8 crashkernel=auto rhgb quiet default_hugepagesz=1GB hugepagesz=1G hugepages=32 iommu=pt intel_iommu=on
isolcpus=2,4,6,8,10,12,14,16,18,22,24,26,28,30,32,34,36,38,3,5,7,9,11,13,15,17,19,23,25,27,29,31,33,35,37,39 skew_tick=1
nohz=on nohz_full=2,4,6,8,10,12,14,16,18,22,24,26,28,30,32,34,36,38,3,5,7,9,11,13,15,17,19,23,25,27,29,31,33,35,37,39
rcu_nocbs=2,4,6,8,10,12,14,16,18,22,24,26,28,30,32,34,36,38,3,5,7,9,11,13,15,17,19,23,25,27,29,31,33,35,37,39
tuned.non_isolcpus=00300003 intel_pstate=disable nosoftlockup
DPDK에 대해 OVS를 구성합니다.
[root@baremetal bonding]# ovs-vsctl list Open_vSwitch | grep other
other_config        : {}
[root@baremetal bonding]# ovs-vsctl --no-wait set Open_vSwitch . other_config:pmd-cpu-mask=0x17c0017c
[root@baremetal bonding]# ovs-vsctl --no-wait set Open_vSwitch . other_config:dpdk-lcore-mask=0x00000001
[root@baremetal bonding]# ovs-vsctl --no-wait set Open_vSwitch . other_config:dpdk-init="true"
인터페이스를 사용자 공간으로 전환합니다.
[root@baremetal bonding]# ethtool -i p1p1 | grep bus
bus-info: 0000:04:00.0
[root@baremetal bonding]# ethtool -i p1p2 | grep bus
bus-info: 0000:04:00.1
[root@baremetal bonding]# driverctl set-override 0000:04:00.0 vfio-pci
[root@baremetal bonding]# driverctl set-override 0000:04:00.1 vfio-pci
Open vSwitch를 다시 시작,
journalctl -u ovs-vswitchd -f &백그라운드에서 실행:[root@baremetal bonding]# systemctl restart openvswitch Apr 19 13:02:49 baremetal systemd[1]: Stopping Open vSwitch Forwarding Unit... Apr 19 13:02:49 baremetal systemd[1]: Stopping Open vSwitch Forwarding Unit... Apr 19 13:02:49 baremetal ovs-ctl[91399]: Exiting ovs-vswitchd (91202) [ OK ] Apr 19 13:02:49 baremetal ovs-ctl[91399]: Exiting ovs-vswitchd (91202) [ OK ] Apr 19 13:02:49 baremetal systemd[1]: Starting Open vSwitch Forwarding Unit... Apr 19 13:02:49 baremetal systemd[1]: Starting Open vSwitch Forwarding Unit... Apr 19 13:02:49 baremetal ovs-ctl[91483]: Starting ovs-vswitchd EAL: Detected 40 lcore(s) Apr 19 13:02:49 baremetal ovs-ctl[91483]: Starting ovs-vswitchd EAL: Detected 40 lcore(s) Apr 19 13:02:49 baremetal ovs-ctl[91483]: EAL: Probing VFIO support... Apr 19 13:02:49 baremetal ovs-vswitchd[91509]: EAL: Probing VFIO support... Apr 19 13:02:49 baremetal ovs-ctl[91483]: EAL: VFIO support initialized Apr 19 13:02:49 baremetal ovs-vswitchd[91509]: EAL: VFIO support initialized Apr 19 13:02:49 baremetal ovs-ctl[91483]: EAL: Probing VFIO support... Apr 19 13:02:49 baremetal ovs-vswitchd[91509]: EAL: Probing VFIO support... Apr 19 13:02:49 baremetal ovs-ctl[91483]: EAL: VFIO support initialized Apr 19 13:02:49 baremetal ovs-vswitchd[91509]: EAL: VFIO support initialized Apr 19 13:02:59 baremetal ovs-ctl[91483]: EAL: PCI device 0000:04:00.0 on NUMA socket 0 Apr 19 13:02:59 baremetal ovs-ctl[91483]: EAL: probe driver: 8086:154d net_ixgbe Apr 19 13:02:59 baremetal ovs-ctl[91483]: EAL: PCI device 0000:04:00.0 on NUMA socket 0 Apr 19 13:02:59 baremetal ovs-ctl[91483]: EAL: probe driver: 8086:154d net_ixgbe Apr 19 13:02:59 baremetal ovs-vswitchd[91509]: EAL: PCI device 0000:04:00.0 on NUMA socket 0 Apr 19 13:02:59 baremetal ovs-ctl[91483]: EAL: using IOMMU type 1 (Type 1) Apr 19 13:02:59 baremetal ovs-vswitchd[91509]: EAL: probe driver: 8086:154d net_ixgbe Apr 19 13:02:59 baremetal ovs-vswitchd[91509]: EAL: using IOMMU type 1 (Type 1) Apr 19 13:02:59 baremetal ovs-vswitchd[91509]: EAL: PCI device 0000:04:00.0 on NUMA socket 0 Apr 19 13:02:59 baremetal ovs-ctl[91483]: EAL: using IOMMU type 1 (Type 1) Apr 19 13:02:59 baremetal ovs-vswitchd[91509]: EAL: probe driver: 8086:154d net_ixgbe Apr 19 13:02:59 baremetal ovs-vswitchd[91509]: EAL: using IOMMU type 1 (Type 1) Apr 19 13:02:59 baremetal ovs-ctl[91483]: EAL: Ignore mapping IO port bar(2) addr: 3021 Apr 19 13:02:59 baremetal ovs-ctl[91483]: EAL: Ignore mapping IO port bar(2) addr: 3021 Apr 19 13:02:59 baremetal ovs-vswitchd[91509]: EAL: Ignore mapping IO port bar(2) addr: 3021 Apr 19 13:02:59 baremetal ovs-vswitchd[91509]: EAL: Ignore mapping IO port bar(2) addr: 3021 Apr 19 13:02:59 baremetal ovs-vswitchd[91509]: EAL: PCI device 0000:04:00.1 on NUMA socket 0 Apr 19 13:02:59 baremetal ovs-vswitchd[91509]: EAL: PCI device 0000:04:00.1 on NUMA socket 0 Apr 19 13:02:59 baremetal ovs-ctl[91483]: EAL: PCI device 0000:04:00.1 on NUMA socket 0 Apr 19 13:02:59 baremetal ovs-ctl[91483]: EAL: PCI device 0000:04:00.1 on NUMA socket 0 Apr 19 13:02:59 baremetal ovs-ctl[91483]: EAL: probe driver: 8086:154d net_ixgbe Apr 19 13:02:59 baremetal ovs-ctl[91483]: EAL: probe driver: 8086:154d net_ixgbe Apr 19 13:02:59 baremetal ovs-vswitchd[91509]: EAL: probe driver: 8086:154d net_ixgbe Apr 19 13:02:59 baremetal ovs-vswitchd[91509]: EAL: probe driver: 8086:154d net_ixgbe Apr 19 13:02:59 baremetal ovs-ctl[91483]: EAL: Ignore mapping IO port bar(2) addr: 3001 Apr 19 13:02:59 baremetal ovs-ctl[91483]: EAL: Ignore mapping IO port bar(2) addr: 3001 Apr 19 13:02:59 baremetal ovs-vswitchd[91509]: EAL: Ignore mapping IO port bar(2) addr: 3001 Apr 19 13:02:59 baremetal ovs-vswitchd[91509]: EAL: Ignore mapping IO port bar(2) addr: 3001 Apr 19 13:03:00 baremetal ovs-ctl[91483]: EAL: PCI device 0000:05:00.0 on NUMA socket 0 Apr 19 13:03:00 baremetal ovs-ctl[91483]: EAL: PCI device 0000:05:00.0 on NUMA socket 0 Apr 19 13:03:00 baremetal ovs-vswitchd[91509]: EAL: PCI device 0000:05:00.0 on NUMA socket 0 Apr 19 13:03:00 baremetal ovs-vswitchd[91509]: EAL: PCI device 0000:05:00.0 on NUMA socket 0 Apr 19 13:03:00 baremetal ovs-ctl[91483]: EAL: probe driver: 8086:154d net_ixgbe Apr 19 13:03:00 baremetal ovs-ctl[91483]: EAL: probe driver: 8086:154d net_ixgbe Apr 19 13:03:00 baremetal ovs-ctl[91483]: EAL: PCI device 0000:05:00.1 on NUMA socket 0 Apr 19 13:03:00 baremetal ovs-ctl[91483]: EAL: PCI device 0000:05:00.1 on NUMA socket 0 Apr 19 13:03:00 baremetal ovs-ctl[91483]: EAL: probe driver: 8086:154d net_ixgbe Apr 19 13:03:00 baremetal ovs-ctl[91483]: EAL: probe driver: 8086:154d net_ixgbe Apr 19 13:03:00 baremetal ovs-vswitchd[91509]: EAL: probe driver: 8086:154d net_ixgbe Apr 19 13:03:00 baremetal ovs-vswitchd[91509]: EAL: probe driver: 8086:154d net_ixgbe Apr 19 13:03:00 baremetal ovs-vswitchd[91509]: EAL: PCI device 0000:05:00.1 on NUMA socket 0 Apr 19 13:03:00 baremetal ovs-vswitchd[91509]: EAL: PCI device 0000:05:00.1 on NUMA socket 0 Apr 19 13:03:00 baremetal ovs-vswitchd[91509]: EAL: probe driver: 8086:154d net_ixgbe Apr 19 13:03:00 baremetal ovs-vswitchd[91509]: EAL: probe driver: 8086:154d net_ixgbe Apr 19 13:03:00 baremetal ovs-ctl[91483]: [ OK ] Apr 19 13:03:00 baremetal ovs-ctl[91483]: [ OK ] Apr 19 13:03:00 baremetal ovs-ctl[91483]: Enabling remote OVSDB managers [ OK ] Apr 19 13:03:00 baremetal ovs-ctl[91483]: Enabling remote OVSDB managers [ OK ] Apr 19 13:03:00 baremetal systemd[1]: Started Open vSwitch Forwarding Unit. Apr 19 13:03:00 baremetal systemd[1]: Started Open vSwitch Forwarding Unit. [root@baremetal bonding]#
8.3.2. LACP 본드 구성
본딩을 추가합니다.
[root@baremetal bonding]# ovs-vsctl add-br ovsbr0  -- set bridge ovsbr0  datapath_type=netdev
[root@baremetal bonding]# ovs-vsctl add-bond ovsbr0 dpdkbond dpdk0 dpdk1     bond_mode=balance-tcp     lacp=active -- set
interface dpdk0 type=dpdk     -- set Interface dpdk1 type=dpdk
Open vSwitch에서 확인합니다.
[root@baremetal bonding]# ovs-appctl lacp/show dpdkbond
---- dpdkbond ----
        status: active negotiated
        sys_id: a0:36:9f:e3:dd:c8
        sys_priority: 65534
        aggregation key: 1
        lacp_time: slow

slave: dpdk0: current attached
        port_id: 2
        port_priority: 65535
        may_enable: true

        actor sys_id: a0:36:9f:e3:dd:c8
        actor sys_priority: 65534
        actor port_id: 2
        actor port_priority: 65535
        actor key: 1
        actor state: activity aggregation synchronized collecting distributing

        partner sys_id: 14:18:77:89:9a:8a
        partner sys_priority: 32768
        partner port_id: 203
        partner port_priority: 32768
        partner key: 1
        partner state: activity timeout aggregation synchronized collecting distributing

slave: dpdk1: current attached
        port_id: 1
        port_priority: 65535
        may_enable: true

        actor sys_id: a0:36:9f:e3:dd:c8
        actor sys_priority: 65534
        actor port_id: 1
        actor port_priority: 65535
        actor key: 1
        actor state: activity aggregation synchronized collecting distributing

        partner sys_id: 14:18:77:89:9a:8a
        partner sys_priority: 32768
        partner port_id: 208
        partner port_priority: 32768
        partner key: 1
        partner state: activity timeout aggregation synchronized collecting distributing

[root@baremetal bonding]# ovs-appctl bond/show dpdkbond
---- dpdkbond ----
bond_mode: balance-tcp
bond may use recirculation: yes, Recirc-ID : 1
bond-hash-basis: 0
updelay: 0 ms
downdelay: 0 ms
next rebalance: 6817 ms
lacp_status: negotiated
active slave mac: a0:36:9f:e3:dd:c8(dpdk0)

slave dpdk0: enabled
        active slave
        may_enable: true

slave dpdk1: enabled
        may_enable: true
스위치에서 확인합니다.
S4048-ON-sw#show lacp 1
Port-channel 1 admin up, oper up, mode lacp
LACP Fast Switch-Over Disabled
Actor   System ID:  Priority 32768, Address 1418.7789.9a8a
Partner System ID:  Priority 65534, Address a036.9fe3.ddc8
Actor Admin Key 1, Oper Key 1, Partner Oper Key 1, VLT Peer Oper Key 1
LACP LAG 1 is an aggregatable link
LACP LAG 1 is a normal LAG

A - Active LACP, B - Passive LACP, C - Short Timeout, D - Long Timeout
E - Aggregatable Link, F - Individual Link, G - IN_SYNC, H - OUT_OF_SYNC
I - Collection enabled, J - Collection disabled, K - Distribution enabled
L - Distribution disabled, M - Partner Defaulted, N - Partner Non-defaulted,
O - Receiver is in expired state, P - Receiver is not in expired state

Port Te 1/2 is enabled, LACP is enabled and mode is lacp
Port State: Bundle
  Actor   Admin: State ACEHJLMP Key 1 Priority 32768
           Oper: State ACEGIKNP Key 1 Priority 32768
  Partner Admin: State BDFHJLMP Key 0 Priority 0
           Oper: State ADEGIKNP Key 1 Priority 65535

Port Te 1/7 is enabled, LACP is enabled and mode is lacp
Port State: Bundle
  Actor   Admin: State ACEHJLMP Key 1 Priority 32768
           Oper: State ACEGIKNP Key 1 Priority 32768
  Partner Admin: State BDFHJLMP Key 0 Priority 0
           Oper: State ADEGIKNP Key 1 Priority 65535
S4048-ON-sw#
8.3.3. OVS에서 포트 비활성화 / 비활성화
ovs-ofctl mod-port <bridge> <port> [up|down]을 사용하여 포트를 활성화하거나 비활성화할 수 있습니다.
포트를 종료합니다.
[root@baremetal bonding]# ovs-ofctl mod-port ovsbr0 dpdk1 down
종료를 확인합니다.
[root@baremetal bonding]# ovs-appctl lacp/show dpdkbond
---- dpdkbond ----
        status: active negotiated
        sys_id: a0:36:9f:e3:dd:c8
        sys_priority: 65534
        aggregation key: 1
        lacp_time: slow

slave: dpdk0: current attached
        port_id: 2
        port_priority: 65535
        may_enable: true

        actor sys_id: a0:36:9f:e3:dd:c8
        actor sys_priority: 65534
        actor port_id: 2
        actor port_priority: 65535
        actor key: 1
        actor state: activity aggregation synchronized collecting distributing

        partner sys_id: 14:18:77:89:9a:8a
        partner sys_priority: 32768
        partner port_id: 203
        partner port_priority: 32768
        partner key: 1
        partner state: activity timeout aggregation synchronized collecting distributing

slave: dpdk1: defaulted detached
        port_id: 1
        port_priority: 65535
        may_enable: false

        actor sys_id: a0:36:9f:e3:dd:c8
        actor sys_priority: 65534
        actor port_id: 1
        actor port_priority: 65535
        actor key: 1
        actor state: activity aggregation defaulted

        partner sys_id: 00:00:00:00:00:00
        partner sys_priority: 0
        partner port_id: 0
        partner port_priority: 0
        partner key: 0
        partner state:
[root@baremetal bonding]# ovs-appctl bond/show dpdkbond
---- dpdkbond ----
bond_mode: balance-tcp
bond may use recirculation: yes, Recirc-ID : 1
bond-hash-basis: 0
updelay: 0 ms
downdelay: 0 ms
next rebalance: 3315 ms
lacp_status: negotiated
active slave mac: a0:36:9f:e3:dd:c8(dpdk0)

slave dpdk0: enabled
        active slave
        may_enable: true

slave dpdk1: disabled
        may_enable: false
스위치에서 확인합니다.
S4048-ON-sw#show lacp 1
Port-channel 1 admin up, oper up, mode lacp
LACP Fast Switch-Over Disabled
Actor   System ID:  Priority 32768, Address 1418.7789.9a8a
Partner System ID:  Priority 65534, Address a036.9fe3.ddc8
Actor Admin Key 1, Oper Key 1, Partner Oper Key 1, VLT Peer Oper Key 1
LACP LAG 1 is an aggregatable link
LACP LAG 1 is a normal LAG

A - Active LACP, B - Passive LACP, C - Short Timeout, D - Long Timeout
E - Aggregatable Link, F - Individual Link, G - IN_SYNC, H - OUT_OF_SYNC
I - Collection enabled, J - Collection disabled, K - Distribution enabled
L - Distribution disabled, M - Partner Defaulted, N - Partner Non-defaulted,
O - Receiver is in expired state, P - Receiver is not in expired state

Port Te 1/2 is enabled, LACP is enabled and mode is lacp
Port State: Bundle
  Actor   Admin: State ACEHJLMP Key 1 Priority 32768
           Oper: State ACEGIKNP Key 1 Priority 32768
  Partner Admin: State BDFHJLMP Key 0 Priority 0
           Oper: State ADEGIKNP Key 1 Priority 65535

Port Te 1/7 is disabled, LACP is disabled and mode is lacp
Port State: Not in Bundle
  Actor   Admin: State ACEHJLMP Key 1 Priority 32768
           Oper: State ACEHJLNP Key 1 Priority 32768
  Partner is not present
포트를 다시 활성화합니다.
[root@baremetal bonding]# ovs-ofctl mod-port ovsbr0 dpdk1 up
RHEL에서 확인합니다.
[root@baremetal bonding]# ovs-appctl bond/show dpdkbond
---- dpdkbond ----
bond_mode: balance-tcp
bond may use recirculation: yes, Recirc-ID : 1
bond-hash-basis: 0
updelay: 0 ms
downdelay: 0 ms
next rebalance: 7846 ms
lacp_status: negotiated
active slave mac: a0:36:9f:e3:dd:c8(dpdk0)

slave dpdk0: enabled
        active slave
        may_enable: true

slave dpdk1: enabled
        may_enable: true

[root@baremetal bonding]# ovs-appctl lacp/show dpdkbond
---- dpdkbond ----
        status: active negotiated
        sys_id: a0:36:9f:e3:dd:c8
        sys_priority: 65534
        aggregation key: 1
        lacp_time: slow

slave: dpdk0: current attached
        port_id: 2
        port_priority: 65535
        may_enable: true

        actor sys_id: a0:36:9f:e3:dd:c8
        actor sys_priority: 65534
        actor port_id: 2
        actor port_priority: 65535
        actor key: 1
        actor state: activity aggregation synchronized collecting distributing

        partner sys_id: 14:18:77:89:9a:8a
        partner sys_priority: 32768
        partner port_id: 203
        partner port_priority: 32768
        partner key: 1
        partner state: activity timeout aggregation synchronized collecting distributing

slave: dpdk1: current attached
        port_id: 1
        port_priority: 65535
        may_enable: true

        actor sys_id: a0:36:9f:e3:dd:c8
        actor sys_priority: 65534
        actor port_id: 1
        actor port_priority: 65535
        actor key: 1
        actor state: activity aggregation synchronized collecting distributing

        partner sys_id: 14:18:77:89:9a:8a
        partner sys_priority: 32768
        partner port_id: 208
        partner port_priority: 32768
        partner key: 1
        partner state: activity timeout aggregation synchronized collecting distributing
스위치에서 확인합니다.
S4048-ON-sw#show lacp 1
Port-channel 1 admin up, oper up, mode lacp
LACP Fast Switch-Over Disabled
Actor   System ID:  Priority 32768, Address 1418.7789.9a8a
Partner System ID:  Priority 65534, Address a036.9fe3.ddc8
Actor Admin Key 1, Oper Key 1, Partner Oper Key 1, VLT Peer Oper Key 1
LACP LAG 1 is an aggregatable link
LACP LAG 1 is a normal LAG

A - Active LACP, B - Passive LACP, C - Short Timeout, D - Long Timeout
E - Aggregatable Link, F - Individual Link, G - IN_SYNC, H - OUT_OF_SYNC
I - Collection enabled, J - Collection disabled, K - Distribution enabled
L - Distribution disabled, M - Partner Defaulted, N - Partner Non-defaulted,
O - Receiver is in expired state, P - Receiver is not in expired state

Port Te 1/2 is enabled, LACP is enabled and mode is lacp
Port State: Bundle
  Actor   Admin: State ACEHJLMP Key 1 Priority 32768
           Oper: State ACEGIKNP Key 1 Priority 32768
  Partner Admin: State BDFHJLMP Key 0 Priority 0
           Oper: State ADEGIKNP Key 1 Priority 65535

Port Te 1/7 is enabled, LACP is enabled and mode is lacp
Port State: Bundle
  Actor   Admin: State ACEHJLMP Key 1 Priority 32768
           Oper: State ACEGIKNP Key 1 Priority 32768
  Partner Admin: State BDFHJLMP Key 0 Priority 0
           Oper: State ADEGIKNP Key 1 Priority 65535
9장. OVS DPDK를 사용하여 다양한 본딩 모드 배포
Red Hat OpenStack Platform에서 OVS-DPDK를 사용하여 다양한 본딩 모드를 배포하려면 다음 절차를 사용하십시오.
9.1. 해결책
compute.yaml 환경 파일을 다음과 같이 변경합니다. 이 예제에서는 MTU 값도 2000으로 설정합니다.
(...)
            -
              type: ovs_user_bridge
              name: br-link
              mtu: 2000
              use_dhcp: false
              members:
                -
                  type: ovs_dpdk_bond
                  name: dpdkbond0
                  ovs_options: "bond_mode=balance-slb"
                  mtu: 2000
                  ovs_extra:
                    - set interface dpdk0 mtu_request=$MTU
                    - set interface dpdk1 mtu_request=$MTU
                  members:
                    -
                      type: ovs_dpdk_port
                      name: dpdk0
                      members:
                        -
                          type: interface
                          name: p1p2
                    -
                      type: ovs_dpdk_port
                      name: dpdk1
                      members:
                        -
                          type: interface
                          name: p1p1
(...)
위 템플릿 변경 사항을 사용하여 오버클라우드를 배포하거나 재배포합니다. 완료되면 오버클라우드 노드에서 다음 단계를 수행합니다.
os-net-config 구성을 확인합니다.
cat /etc/os-net-config/config.json | python -m json.tool
(...)
        {
            "members": [
                {
                    "members": [
                        {
                            "members": [
                                {
                                    "name": "p1p2",
                                    "type": "interface"
                                }
                            ],
                            "name": "dpdk0",
                            "type": "ovs_dpdk_port"
                        },
                        {
                            "members": [
                                {
                                    "name": "p1p1",
                                    "type": "interface"
                                }
                            ],
                            "name": "dpdk1",
                            "type": "ovs_dpdk_port"
                        }
                    ],
                    "mtu": 2000,
                    "name": "dpdkbond0",
                    "ovs_extra": [
                        "set interface dpdk0 mtu_request=$MTU",
                        "set interface dpdk1 mtu_request=$MTU"
                    ],
                    "ovs_options": "bond_mode=balance-slb",
                    "type": "ovs_dpdk_bond"
                }
            ],
            "mtu": 2000,
            "name": "br-link",
            "type": "ovs_user_bridge",
            "use_dhcp": false
        },
(...)
본딩 확인:
[root@overcloud-compute-0 ~]# ovs-appctl bond/show dpdkbond0
---- dpdkbond0 ----
bond_mode: balance-slb
bond may use recirculation: no, Recirc-ID : -1
bond-hash-basis: 0
updelay: 0 ms
downdelay: 0 ms
next rebalance: 9221 ms
lacp_status: off
active slave mac: a0:36:9f:e5:da:82(dpdk1)

slave dpdk0: enabled
    may_enable: true

slave dpdk1: enabled
    active slave
    may_enable: true
10장. ovs-vsctl show 메시지에서 Could not open network device dpdk0 (No such device) 을 열 수 없습니다.
10.1. 증상
ovs-vsctl show 메시지에서 Could not open network device dpdk0 (No such device) 이 표시됩니다.
10.2. 진단
Red Hat은 DPDK 지원 하드웨어에 나열된 Poll Mode Drivers(PMD) 서브 세트를 지원합니다. Red Hat은 2017년 8월에 지원되지 않는 PMD를 비활성화했습니다.
업스트림 PMD에는 보안 또는 성능 문제가 있을 수 있습니다. 따라서 PMD는 Red Hat의 자격 테스트를 통과하기 위해 상당한 테스트를 거쳐야 합니다.
/usr/share/doc/openvswitch-<version>/README.DPDK-PMDS에서 활성화된 모든 PMD 목록을 볼 수 있습니다. 이 목록에는 Red Hat에서 지원하지 않는 PMD가 포함될 수 있습니다. README.DPDK-PMDS 에 나열되지 않은 폴링 모드 드라이버는 지원되지 않습니다.
10.3. 해결책
다음 예제에서는 openvswitch-2.6.1에 지원되는 PMD를 보여줍니다.
[root@overcloud-compute-0 ~]# cat /usr/share/doc/openvswitch-2.6.1/README.DPDK-PMDS
DPDK drivers included in this package:

E1000
ENIC
I40E
IXGBE
RING
VIRTIO

For more information about the drivers, see
http://dpdk.org/doc/guides-16.11/nics/index.html
이 예에서는 openvswitch-2.9.0에 지원되는 PMD를 보여줍니다.
[root@undercloud-r430 ~]# cat /usr/share/doc/openvswitch-2.9.0/README.DPDK-PMDS
DPDK drivers included in this package:

BNXT
E1000
ENIC
FAILSAFE
I40E
IXGBE
MLX4
MLX4_GLUE
MLX5
MLX5_GLUE
NFP
RING
SOFTNIC
VIRTIO

For more information about the drivers, see
http://dpdk.org/doc/guides-17.11/nics/index.html
11장. Open vSwitch DPDK를 사용하여 게스트 RAM 할당에 사용 가능한 무료 호스트 메모리 페이지 충분하지 않음
11.1. 증상
충분한 대규모 페이지 및 기타 리소스가 있는 컴퓨팅 노드에 인스턴스를 배포하고 다음 예와 같은 출력이 표시됩니다.
[stack@undercloud-4 ~]$ nova show 1b72e7a1-c298-4c92-8d2c-0a9fe886e9bc
(...)
| fault                                | {"message": "Exceeded maximum number of retries. Exceeded max scheduling attempts 3
for instance 1b72e7a1-c298-4c92-8d2c-0a9fe886e9bc. Last exception: internal error: process exited while connecting to monitor:
2017-11-23T19:53:20.311446Z qemu-kvm: -chardev pty,id=cha", "code": 500, "details": "  File \"/usr/lib/python2.7/site-packages
/nova/conductor/manager.py\", line 492, in build_instances |
|                                      |     filter_properties, instances[0].uuid)                                                                                                                                                                                                                                                                                                                                                                   |
|                                      |   File \"/usr/lib/python2.7/site-packages/nova/scheduler/utils.py\", line 184, in
populate_retry                                                                                                                                                                                                                                                                                                            |
|                                      |     raise exception.MaxRetriesExceeded(reason=msg)                                                                                                                                                                                                                                                                                                                                                          |
|                                      | ", "created": "2017-11-23T19:53:22Z"}
(...)
컴퓨팅 노드의 /var/log/containers/nova/nova-compute.log 는 다음과 같은 ERROR 메시지를 제공합니다.
2017-11-23 19:53:21.021 153615 ERROR nova.compute.manager [instance: 1b72e7a1-c298-4c92-8d2c-0a9fe886e9bc]
2017-11-23T19:53:20.477183Z qemu-kvm: -object memory-backend-file,id=ram-node0,prealloc=yes,mem-path=/dev/hugepages/libvirt
/qemu/7-instance-00000006,share=yes,size=536870912,host-nodes=0,policy=bind: os_mem_prealloc: Insufficient free host memory
pages available to allocate guest RAM
또한 libvirt는 다음 로그 파일을 생성합니다.
[root@overcloud-compute-1 qemu]# cat instance-00000006.log
2017-11-23 19:53:02.145+0000: starting up libvirt version: 3.2.0, package: 14.el7_4.3 (Red Hat, Inc.
<http://bugzilla.redhat.com/bugzilla>, 2017-08-22-08:54:01, x86-039.build.eng.bos.redhat.com), qemu version: 2.9.0(qemu-
kvm-rhev-2.9.0-10.el7), hostname: overcloud-compute-1.localdomain
LC_ALL=C PATH=/usr/local/sbin:/usr/local/bin:/usr/sbin:/usr/bin QEMU_AUDIO_DRV=none /usr/libexec/qemu-kvm -name
guest=instance-00000006,debug-threads=on -S -object secret,id=masterKey0,format=raw,file=/var/lib/libvirt/qemu/domain-
5-instance-00000006/master-key.aes -machine pc-i440fx-rhel7.4.0,accel=kvm,usb=off,dump-guest-core=off -cpu
SandyBridge,vme=on,hypervisor=on,arat=on,tsc_adjust=on,xsaveopt=on -m 512 -realtime mlock=off -smp
1,sockets=1,cores=1,threads=1 -object memory-backend-file,id=ram-node0,prealloc=yes,mem-path=/dev/hugepages/libvirt/qemu/5
-instance-00000006,share=yes,size=536870912,host-nodes=0,policy=bind -numa node,nodeid=0,cpus=0,memdev=ram-node0 -uuid
1b72e7a1-c298-4c92-8d2c-0a9fe886e9bc -smbios 'type=1,manufacturer=Red Hat,product=OpenStack
Compute,version=14.0.8-5.el7ost,serial=4f88fcca-0cd3-4e19-8dc4-4436a54daff8,uuid=1b72e7a1-c298-4c92-8d2c
-0a9fe886e9bc,family=Virtual Machine' -no-user-config -nodefaults -chardev socket,id=charmonitor,path=/var/lib/libvirt
/qemu/domain-5-instance-00000006/monitor.sock,server,nowait -mon chardev=charmonitor,id=monitor,mode=control -rtc
base=utc,driftfix=slew -global kvm-pit.lost_tick_policy=delay -no-hpet -no-shutdown -boot strict=on -device piix3
-usb-uhci,id=usb,bus=pci.0,addr=0x1.0x2 -drive file=/var/lib/nova/instances/1b72e7a1-c298-4c92-8d2c-0a9fe886e9bc
/disk,format=qcow2,if=none,id=drive-virtio-disk0,cache=none -device virtio-blk-pci,scsi=off,bus=pci.0,addr=0x4,drive=drive-
virtio-disk0,id=virtio-disk0,bootindex=1 -chardev socket,id=charnet0,path=/var/run/openvswitch/vhu9758ef15-d2 -netdev vhost-
user,chardev=charnet0,id=hostnet0 -device virtio-net-pci,netdev=hostnet0,id=net0,mac=fa:16:3e:d6:89:65,bus=pci.0,addr=0x3
-add-fd set=0,fd=29 -chardev file,id=charserial0,path=/dev/fdset/0,append=on -device isa-serial,chardev=charserial0,id=serial0
-chardev pty,id=charserial1 -device isa-serial,chardev=charserial1,id=serial1 -device usb-tablet,id=input0,bus=usb.0,port=1
-vnc 172.16.2.8:2 -k en-us -device cirrus-vga,id=video0,bus=pci.0,addr=0x2 -device virtio-balloon-
pci,id=balloon0,bus=pci.0,addr=0x5 -msg timestamp=on
2017-11-23T19:53:03.217386Z qemu-kvm: -chardev pty,id=charserial1: char device redirected to /dev/pts/3 (label charserial1)
2017-11-23T19:53:03.359799Z qemu-kvm: -object memory-backend-file,id=ram-node0,prealloc=yes,mem-path=/dev/hugepages/libvirt
/qemu/5-instance-00000006,share=yes,size=536870912,host-nodes=0,policy=bind: os_mem_prealloc: Insufficient free host memory
pages available to allocate guest RAM

2017-11-23 19:53:03.630+0000: shutting down, reason=failed
2017-11-23 19:53:10.052+0000: starting up libvirt version: 3.2.0, package: 14.el7_4.3 (Red Hat, Inc.
<http://bugzilla.redhat.com/bugzilla>, 2017-08-22-08:54:01, x86-039.build.eng.bos.redhat.com), qemu version: 2.9.0(qemu-
kvm-rhev-2.9.0-10.el7), hostname: overcloud-compute-1.localdomain
LC_ALL=C PATH=/usr/local/sbin:/usr/local/bin:/usr/sbin:/usr/bin QEMU_AUDIO_DRV=none /usr/libexec/qemu-kvm -name
guest=instance-00000006,debug-threads=on -S -object secret,id=masterKey0,format=raw,file=/var/lib/libvirt/qemu/domain-
6-instance-00000006/master-key.aes -machine pc-i440fx-rhel7.4.0,accel=kvm,usb=off,dump-guest-core=off -cpu
SandyBridge,vme=on,hypervisor=on,arat=on,tsc_adjust=on,xsaveopt=on -m 512 -realtime mlock=off -smp
1,sockets=1,cores=1,threads=1 -object memory-backend-file,id=ram-node0,prealloc=yes,mem-path=/dev/hugepages/libvirt/qemu/6-
instance-00000006,share=yes,size=536870912,host-nodes=0,policy=bind -numa node,nodeid=0,cpus=0,memdev=ram-node0 -uuid
1b72e7a1-c298-4c92-8d2c-0a9fe886e9bc -smbios 'type=1,manufacturer=Red Hat,product=OpenStack
Compute,version=14.0.8-5.el7ost,serial=4f88fcca-0cd3-4e19-8dc4-4436a54daff8,uuid=1b72e7a1-c298-4c92-8d2c-
0a9fe886e9bc,family=Virtual Machine' -no-user-config -nodefaults -chardev socket,id=charmonitor,path=/var/lib/libvirt
/qemu/domain-6-instance-00000006/monitor.sock,server,nowait -mon chardev=charmonitor,id=monitor,mode=control -rtc
base=utc,driftfix=slew -global kvm-pit.lost_tick_policy=delay -no-hpet -no-shutdown -boot strict=on -device piix3
-usb-uhci,id=usb,bus=pci.0,addr=0x1.0x2 -drive file=/var/lib/nova/instances/1b72e7a1-c298-4c92-8d2c-0a9fe886e9bc
/disk,format=qcow2,if=none,id=drive-virtio-disk0,cache=none -device virtio-blk-pci,scsi=off,bus=pci.0,addr=0x4,drive=drive-
virtio-disk0,id=virtio-disk0,bootindex=1 -chardev socket,id=charnet0,path=/var/run/openvswitch/vhu9758ef15-d2 -netdev vhost-
user,chardev=charnet0,id=hostnet0 -device virtio-net-pci,netdev=hostnet0,id=net0,mac=fa:16:3e:d6:89:65,bus=pci.0,addr=0x3
-add-fd set=0,fd=29 -chardev file,id=charserial0,path=/dev/fdset/0,append=on -device isa-serial,chardev=charserial0,id=serial0
-chardev pty,id=charserial1 -device isa-serial,chardev=charserial1,id=serial1 -device usb-tablet,id=input0,bus=usb.0,port=1
-vnc 172.16.2.8:2 -k en-us -device cirrus-vga,id=video0,bus=pci.0,addr=0x2 -device virtio-balloon-
pci,id=balloon0,bus=pci.0,addr=0x5 -msg timestamp=on
2017-11-23T19:53:11.466399Z qemu-kvm: -chardev pty,id=charserial1: char device redirected to /dev/pts/3 (label charserial1)
2017-11-23T19:53:11.729226Z qemu-kvm: -object memory-backend-file,id=ram-node0,prealloc=yes,mem-path=/dev/hugepages/libvirt
/qemu/6-instance-00000006,share=yes,size=536870912,host-nodes=0,policy=bind: os_mem_prealloc: Insufficient free host memory
pages available to allocate guest RAM

2017-11-23 19:53:12.159+0000: shutting down, reason=failed
2017-11-23 19:53:19.370+0000: starting up libvirt version: 3.2.0, package: 14.el7_4.3 (Red Hat, Inc.
<http://bugzilla.redhat.com/bugzilla>, 2017-08-22-08:54:01, x86-039.build.eng.bos.redhat.com), qemu version: 2.9.0(qemu-
kvm-rhev-2.9.0-10.el7), hostname: overcloud-compute-1.localdomain
LC_ALL=C PATH=/usr/local/sbin:/usr/local/bin:/usr/sbin:/usr/bin QEMU_AUDIO_DRV=none /usr/libexec/qemu-kvm -name
guest=instance-00000006,debug-threads=on -S -object secret,id=masterKey0,format=raw,file=/var/lib/libvirt/qemu/domain-
7-instance-00000006/master-key.aes -machine pc-i440fx-rhel7.4.0,accel=kvm,usb=off,dump-guest-core=off -cpu
SandyBridge,vme=on,hypervisor=on,arat=on,tsc_adjust=on,xsaveopt=on -m 512 -realtime mlock=off -smp
1,sockets=1,cores=1,threads=1 -object memory-backend-file,id=ram-node0,prealloc=yes,mem-path=/dev/hugepages/libvirt/qemu/7-
instance-00000006,share=yes,size=536870912,host-nodes=0,policy=bind -numa node,nodeid=0,cpus=0,memdev=ram-node0 -uuid
1b72e7a1-c298-4c92-8d2c-0a9fe886e9bc -smbios 'type=1,manufacturer=Red Hat,product=OpenStack
Compute,version=14.0.8-5.el7ost,serial=4f88fcca-0cd3-4e19-8dc4-4436a54daff8,uuid=1b72e7a1-c298-4c92-8d2c
-0a9fe886e9bc,family=Virtual Machine' -no-user-config -nodefaults -chardev socket,id=charmonitor,path=/var/lib/libvirt
/qemu/domain-7-instance-00000006/monitor.sock,server,nowait -mon chardev=charmonitor,id=monitor,mode=control -rtc
base=utc,driftfix=slew -global kvm-pit.lost_tick_policy=delay -no-hpet -no-shutdown -boot strict=on -device piix3-
usb-uhci,id=usb,bus=pci.0,addr=0x1.0x2 -drive file=/var/lib/nova/instances/1b72e7a1-c298-4c92-8d2c-0a9fe886e9bc
/disk,format=qcow2,if=none,id=drive-virtio-disk0,cache=none -device virtio-blk-pci,scsi=off,bus=pci.0,addr=0x4,drive=drive-
virtio-disk0,id=virtio-disk0,bootindex=1 -chardev socket,id=charnet0,path=/var/run/openvswitch/vhu9758ef15-d2 -netdev vhost-
user,chardev=charnet0,id=hostnet0 -device virtio-net-pci,netdev=hostnet0,id=net0,mac=fa:16:3e:d6:89:65,bus=pci.0,addr=0x3
-add-fd set=0,fd=29 -chardev file,id=charserial0,path=/dev/fdset/0,append=on -device isa-serial,chardev=charserial0,id=serial0
-chardev pty,id=charserial1 -device isa-serial,chardev=charserial1,id=serial1 -device usb-tablet,id=input0,bus=usb.0,port=1
-vnc 172.16.2.8:2 -k en-us -device cirrus-vga,id=video0,bus=pci.0,addr=0x2 -device virtio-balloon-
pci,id=balloon0,bus=pci.0,addr=0x5 -msg timestamp=on
2017-11-23T19:53:20.311446Z qemu-kvm: -chardev pty,id=charserial1: char device redirected to /dev/pts/3 (label charserial1)
2017-11-23T19:53:20.477183Z qemu-kvm: -object memory-backend-file,id=ram-node0,prealloc=yes,mem-path=/dev/hugepages/libvirt
/qemu/7-instance-00000006,share=yes,size=536870912,host-nodes=0,policy=bind: os_mem_prealloc: Insufficient free host memory
pages available to allocate guest RAM

2017-11-23 19:53:20.724+0000: shutting down, reason=failed
11.2. 진단
추가 설정이 없으면 nova에서 다른 프로세스에서 특정 양의 대규모 페이지 메모리를 사용하는지 알 수 없습니다. 기본적으로 nova는 인스턴스에 모든 대규모 페이지 메모리를 사용할 수 있다고 가정합니다. 이 NUMA 노드에 pCPU가 남아 있고 사용 가능한 hugepage 메모리가 있는 경우 Nova는 먼저 NUMA 노드 0을 채웁니다. 이 문제는 다음과 같은 원인으로 인해 발생할 수 있습니다.
- 요청된 pCPU가 여전히 NUMA 0에 적합합니다.
- 모든 기존 인스턴스의 메모리와 생성된 인스턴스의 메모리를 결합한 메모리는 여전히 NUMA 노드 0에 적합합니다.
- OVS와 같은 다른 프로세스에는 NUMA 노드 0에 일정 양의 hugepage 메모리가 있습니다.
[Errno 12] 메모리 오류를 할당할 수 없도록 대규모 페이지 멀티플라이어와 동일한 플레이버 RAM 양을 할당해야 합니다.
11.2.1. 진단 단계
meminfo를 확인합니다. 다음은 NUMA 노드당 2MB hugepages 및 512개의 사용 가능한 hugepages이 있는 하이퍼바이저를 보여줍니다.[root@overcloud-compute-1 ~]# cat /sys/devices/system/node/node*/meminfo | grep -i huge Node 0 AnonHugePages: 2048 kB Node 0 HugePages_Total: 1024 Node 0 HugePages_Free: 512 Node 0 HugePages_Surp: 0 Node 1 AnonHugePages: 2048 kB Node 1 HugePages_Total: 1024 Node 1 HugePages_Free: 512 Node 1 HugePages_Surp: 0
NUMA 아키텍처를 확인합니다.
[root@overcloud-compute-1 nova]# lscpu  | grep -i NUMA
NUMA node(s):          2
NUMA node0 CPU(s):     0-3
NUMA node1 CPU(s):     4-7
OVS에서 예약된 대규모 페이지를 확인합니다. 다음 출력에서 OVS는 NUMA 노드당 512MB의 대규모 페이지를 예약합니다.
[root@overcloud-compute-1 virt]# ovs-vsctl list Open_vSwitch | grep mem
other_config        : {dpdk-init="true", dpdk-lcore-mask="3", dpdk-socket-mem="512,512", pmd-cpu-mask="1e"}
다음 플레이버를 사용하여 인스턴스 배포(1 vCPU 및 512MB 또는 메모리):
[stack@undercloud-4 ~]$ nova flavor-show m1.tiny
+----------------------------+-------------------------------------------------------------+
| Property                   | Value                                                       |
+----------------------------+-------------------------------------------------------------+
| OS-FLV-DISABLED:disabled   | False                                                       |
| OS-FLV-EXT-DATA:ephemeral  | 0                                                           |
| disk                       | 8                                                           |
| extra_specs                | {"hw:cpu_policy": "dedicated", "hw:mem_page_size": "large"} |
| id                         | 49debbdb-c12e-4435-97ef-f575990b352f                        |
| name                       | m1.tiny                                                     |
| os-flavor-access:is_public | True                                                        |
| ram                        | 512                                                         |
| rxtx_factor                | 1.0                                                         |
| swap                       |                                                             |
| vcpus                      | 1                                                           |
+----------------------------+-------------------------------------------------------------+
새 인스턴스가 부팅되고 NUMA 1의 메모리를 사용합니다.
[stack@undercloud-4 ~]$ nova list | grep d98772d1-119e-48fa-b1d9-8a68411cba0b
| d98772d1-119e-48fa-b1d9-8a68411cba0b | cirros-test0 | ACTIVE | -          | Running     |
provider1=2000:10::f816:3eff:fe8d:a6ef, 10.0.0.102 |
[root@overcloud-compute-1 nova]# cat /sys/devices/system/node/node*/meminfo  | grep -i huge
Node 0 AnonHugePages:      2048 kB
Node 0 HugePages_Total:  1024
Node 0 HugePages_Free:      0
Node 0 HugePages_Surp:      0
Node 1 AnonHugePages:      2048 kB
Node 1 HugePages_Total:  1024
Node 1 HugePages_Free:    256
Node 1 HugePages_Surp:      0
nova boot --nic net-id=$NETID --image cirros --flavor m1.tiny --key-name id_rsa cirros-test0
이 인스턴스가 부팅되지 않습니다.
[stack@undercloud-4 ~]$ nova list
+--------------------------------------+--------------+--------+------------+-------------+-----------------------------------------+
| ID                                   | Name         | Status | Task State | Power State | Networks                                           |
+--------------------------------------+--------------+--------+------------+-------------+-----------------------------------------+
| 1b72e7a1-c298-4c92-8d2c-0a9fe886e9bc | cirros-test0 | ERROR  | -          | NOSTATE     |                                                    |
| a44c43ca-49ad-43c5-b8a1-543ed8ab80ad | cirros-test0 | ACTIVE | -          | Running     |
provider1=2000:10::f816:3eff:fe0f:565b, 10.0.0.105 |
| e21ba401-6161-45e6-8a04-6c45cef4aa3e | cirros-test0 | ACTIVE | -          | Running     |
provider1=2000:10::f816:3eff:fe69:18bd, 10.0.0.111 |
+--------------------------------------+--------------+--------+------------+-------------+-----------------------------------------+
compute 노드에서 NUMA 노드 0의 무료 대규모 페이지가 소진되었는지 확인합니다. 그러나 NUMA 노드 1에는 충분한 공간이 있습니다.
[root@overcloud-compute-1 qemu]# cat /sys/devices/system/node/node*/meminfo  | grep -i huge
Node 0 AnonHugePages:      2048 kB
Node 0 HugePages_Total:  1024
Node 0 HugePages_Free:      0
Node 0 HugePages_Surp:      0
Node 1 AnonHugePages:      2048 kB
Node 1 HugePages_Total:  1024
Node 1 HugePages_Free:    512
Node 1 HugePages_Surp:      0
/var/log/containers/nova/nova-compute.log의 정보는 인스턴스 CPU가 NUMA 노드 0에 고정되었음을 보여줍니다.<name>instance-00000006</name> <uuid>1b72e7a1-c298-4c92-8d2c-0a9fe886e9bc</uuid> <metadata> <nova:instance xmlns:nova="http://openstack.org/xmlns/libvirt/nova/1.0"> <nova:package version="14.0.8-5.el7ost"/> <nova:name>cirros-test0</nova:name> <nova:creationTime>2017-11-23 19:53:00</nova:creationTime> <nova:flavor name="m1.tiny"> <nova:memory>512</nova:memory> <nova:disk>8</nova:disk> <nova:swap>0</nova:swap> <nova:ephemeral>0</nova:ephemeral> <nova:vcpus>1</nova:vcpus> </nova:flavor> <nova:owner> <nova:user uuid="5d1785ee87294a6fad5e2bdddd91cc20">admin</nova:user> <nova:project uuid="8c307c08d2234b339c504bfdd896c13e">admin</nova:project> </nova:owner> <nova:root type="image" uuid="6350211f-5a11-4e02-a21a-cb1c0d543214"/> </nova:instance> </metadata> <memory unit='KiB'>524288</memory> <currentMemory unit='KiB'>524288</currentMemory> <memoryBacking> <hugepages> <page size='2048' unit='KiB' nodeset='0'/> </hugepages> </memoryBacking> <vcpu placement='static'>1</vcpu> <cputune> <shares>1024</shares> <vcpupin vcpu='0' cpuset='2'/> <emulatorpin cpuset='2'/> </cputune> <numatune> <memory mode='strict' nodeset='0'/> <memnode cellid='0' mode='strict' nodeset='0'/> </numatune>
numatune 섹션에서 nodeset="0"은 NUMA 0에서 메모리가 클레임됨을 나타냅니다.
11.3. 해결책
관리자는 인스턴스에서 사용하지 않는 대규모 페이지 메모리 양을 nova에 입력할 수 있습니다.
[root@overcloud-compute-1 virt]# grep reserved_huge /var/lib/config-data/puppet-generated/nova_libvirt/etc/nova/nova.conf -B1
[DEFAULT]
reserved_huge_pages=node:0,size:2048,count:512
reserved_huge_pages=node:1,size:2048,count:512
size 매개변수는 KiB의 대규모 페이지 크기입니다. count 매개변수는 NUMA 노드당 OVS에서 사용하는 대규모 페이지 수입니다. 예를 들어 Open vSwitch에서 사용하는 소켓 메모리의 4096의 경우 다음 값을 사용합니다.
[DEFAULT]
reserved_huge_pages=node:0,size:1GB,count:4
reserved_huge_pages=node:1,size:1GB,count:4
OpenStack director 를 사용하여 구현하는 방법에 대한 자세한 내용은 Red Hat OpenStack Platform 10의 /etc/nova/nova.conf에 reserved_huge_pages를 설정하는 방법을 참조하십시오.
reserved_huge_pages = None

(Unknown) Number of huge/large memory pages to reserved per NUMA host cell.

Possible values:

    A list of valid key=value which reflect NUMA node ID, page size (Default unit is KiB) and number of pages to be reserved.

    reserved_huge_pages = node:0,size:2048,count:64 reserved_huge_pages = node:1,size:1GB,count:1

    In this example we are reserving on NUMA node 0 64 pages of 2MiB and on NUMA node 1 1 page of 1GiB.
/etc/nova/nova.conf 에서 debug를 활성화하면 openstack-nova-compute 를 다시 시작한 후 로그에 다음 정보가 표시됩니다.
[root@overcloud-compute-1 virt]# docker restart nova_compute
(...)
[root@overcloud-compute-1 virt]# grep reserved_huge_pages /var/log/containers/nova/nova-compute.log | tail -n1
2017-12-19 17:56:40.727 26691 DEBUG oslo_service.service [req-e681e97d-7d99-4ba8-bee7-5f7a3f655b21 - - - - -]
reserved_huge_pages            = [{'node': '0', 'count': '512', 'size': '2048'}, {'node': '1', 'count': '512', 'size':
'2048'}] log_opt_values /usr/lib/python2.7/site-packages/oslo_config/cfg.py:2622
[root@overcloud-compute-1 virt]#
12장. perf를 사용하여 OVS DPDK PMD CPU 사용량 문제 해결 및 문제 해결 데이터 전송
- 사전 요구 사항 이 섹션의 단계를 사용하여 문제 해결 도구를 설치합니다.
컴퓨팅 노드에
perf를 설치합니다.yum install perf -y
Open vSwitch 디버그 RPM을 설치합니다.
subscription-manager repos --enable=rhel-7-server-openstack-13-debug-rpms
pidstat명령을 설치해야 합니다.yum install sysstat -y
12.1. 진단
이 섹션의 단계를 사용하여 데이터 문제를 해결하고 수집합니다.
12.1.1. PMD 스레드
PMD 스레드의 위치를 확인합니다.
IFS=$'\n' ; for l in $(ps -T -p `pidof ovs-vswitchd` | grep pmd);do PID=`echo $l | awk '{print $2}'`; PMD=`echo $l | awk
'{print $NF}'` ; PCPU=`taskset -c -p $PID | awk '{print $NF}'` ; echo "$PMD with PID $PID in on pCPU $PCPU"; done
예를 들면 다음과 같습니다.
[root@overcloud-compute-1 ~]# IFS=$'\n' ; for l in $(ps -T -p `pidof ovs-vswitchd` | grep pmd);do PID=`echo $l | awk
'{print $2}'`; PMD=`echo $l | awk '{print $NF}'` ; PCPU=`taskset -c -p $PID | awk '{print $NF}'` ; echo "$PMD with PID $PID in on pCPU
$PCPU"; done
pmd545 with PID 412314 in on pCPU 2
pmd555 with PID 412315 in on pCPU 4
pmd550 with PID 412316 in on pCPU 6
pmd551 with PID 412317 in on pCPU 8
pmd553 with PID 412318 in on pCPU 22
pmd554 with PID 412319 in on pCPU 24
pmd549 with PID 412320 in on pCPU 26
pmd556 with PID 412321 in on pCPU 28
pmd546 with PID 412322 in on pCPU 3
pmd548 with PID 412323 in on pCPU 5
pmd547 with PID 412324 in on pCPU 23
pmd552 with PID 412325 in on pCPU 25
문제를 재현하는 동안 perf 레코드를 실행하고 출력을 저장합니다.
gather_perf_data_a.sh 스크립트를 생성합니다.cat<<'EOF'>>gather_perf_data_a.sh #!/bin/bash -x IFS=$'\n' ; dir_name=/tmp/perf_record_a mkdir ${dir_name} rm -f ${dir_name}/* for l in $(ps -T -p `pidof ovs-vswitchd` | grep pmd);do PID=`echo $l | awk '{print $2}'`; PMD=`echo $l | awk '{print $NF}'` ; PCPU=`taskset -c -p $PID | awk '{print $NF}'` ; echo "$PMD with PID $PID in on pCPU $PCPU"; done > ${dir_name}/pmds.txt for l in $(ps -T -p `pidof ovs-vswitchd` | grep pmd);do PID=`echo $l | awk '{print $2}'`; PMD=`echo $l | awk '{print $NF}'` ; PCPU=`taskset -c -p $PID | awk '{print $NF}'` ; echo "$PMD with PID $PID in on pCPU $PCPU"; date perf record -C $PCPU -g -o perf_record_-g_$PCPU sleep 60 & done sleep 80 for l in $(ps -T -p `pidof ovs-vswitchd` | grep pmd);do PID=`echo $l | awk '{print $2}'`; PMD=`echo $l | awk '{print $NF}'` ; PCPU=`taskset -c -p $PID | awk '{print $NF}'` ; echo "$PMD with PID $PID in on pCPU $PCPU"; date perf record -C $PCPU -o perf_record_$PCPU sleep 60 & done sleep 80 for f in perf_record_-g_*;do perf report -g -i $f | cat > ${dir_name}/perf_report_$f.txt ; rm -f $f done for f in perf_record_*;do perf report -i $f | cat > ${dir_name}/perf_report_$f.txt ; rm -f $f done archive_name="${dir_name}_`hostname`_`date '+%F_%H%m%S'`.tar.gz" tar -czf $archive_name ${dir_name} echo "Archived all data in archive ${archive_name}" EOF스크립트를 실행합니다.
chmod +x gather_perf_data_a.sh
./gather_perf_data_a.sh
보고서는 perf report -i ${archive_name} 을 사용하여 읽을 수 있습니다. Red Hat 지원을 통해 열린 케이스인 경우 결과 tar 아카이브를 케이스에 첨부합니다.
12.1.2. 추가 데이터
추가 데이터를 수집하려면
gather_perf_data_b.sh스크립트를 생성합니다.cat<<'EOF'>>gather_perf_data_b.sh #!/bin/bash -x dir_name=/tmp/perf_record_b mkdir ${dir_name} rm -f ${dir_name}/* date > ${dir_name}/pidstat1.txt pidstat -u -t -p `pidof ovs-vswitchd`,`pidof ovsdb-server` 5 12 >> ${dir_name}/pidstat1.txt & perf record -p `pidof ovs-vswitchd` -g --call-graph dwarf sleep 60 sleep 20 date > ${dir_name}/pidstat2.txt pidstat -u -t -p `pidof ovs-vswitchd`,`pidof ovsdb-server` 1 60 >> ${dir_name}/pidstat2.txt mv perf.data perf.data_openvswitch perf script -F tid -i perf.data_openvswitch | sort -u | grep -o '[0-9]*' | xargs -n1 -I{} perf report -i perf.data_openvswitch --no-children --percentage relative --stdio --tid {} -g none > ${dir_name}/perf_reports.txt perf script -F tid -i perf.data_openvswitch | sort -u | grep -o '[0-9]*' | xargs -n1 -I{} perf report -i perf.data_openvswitch --no-children --percentage relative --stdio --tid {} > ${dir_name}/perf_reports_callgraph.txt rm -f perf.data_openvswitch archive_name="${dir_name}_`hostname`_`date '+%F_%H%m%S'`.tar.gz" tar -czf $archive_name ${dir_name} echo "Archived all data in archive ${archive_name}" EOF스크립트를 실행합니다.
chmod +x gather_perf_data_b.sh
./gather_perf_data_b.sh
참고디스크 공간이 충분한지 확인합니다. 'perf.data' 파일은 여러 기가바이트의 디스크 공간을 사용할 수 있습니다.
Red Hat 지원 티켓에 해당하는 경우 결과 tar 아카이브를 케이스에 첨부합니다.
12.1.3. Open vSwitch 로그
모든 OVS(Open vSwitch) 로그를 제공합니다.
/var에 디스크 공간이 충분한지 확인합니다.df -h를 사용하여 /var 및du -sh /var/log/openvswitch의 디스크 공간을 확인하여 OVS 로그의 총 크기를 확인합니다.tar -cvzf /var/openvswitch_`hostname`_`date +"%F_%H%M%S"`.tar.gz /var/log/openvswitch
-
결과 파일(예:
/var/openvswitch_overcloud-compute-0_2018-02-27_153713.tar.gz)을 분석의 지원 케이스에 연결합니다. sosreport를 생성하고 제공합니다.
/var에 디스크 공간이 충분한지 확인합니다.df -h를 사용하여/var의 디스크 공간을 확보합니다.sosreport --batch --all-logs
13장. NFV와 함께 가상 환경에서 virsh emulatorpin 사용
NFV를 통한 Red Hat OpenStack Platform에서 virsh emulatorpin 사용의 영향을 확인하려면 이 절차를 사용하십시오.
13.1. 증상
Red Hat OpenStack Platform {vernum} NFV 환경에서 패킷 손실이 발생하고 에뮬레이터 스레드 고정이 구성되지 않았습니다.
13.2. 해결책
이 섹션을 사용하여 에뮬레이터 스레드 고정을 조사하고 구성합니다.
13.2.1. qemu-kvm 에뮬레이터 스레드
에뮬레이터 스레드는 가상 머신 하드웨어 에뮬레이션을 위한 인터럽트 요청 및 비차단 프로세스를 처리합니다. vCPU를 실행하지 않는 스레드는 qemu-kvm 에뮬레이터 스레드입니다. 다음 예제를 참조하십시오.
[root@overcloud-compute-0 ~]# ps -Tp `pgrep -f instance-00000009`
    PID    SPID TTY          TIME CMD
 364936  364936 ?        00:00:02 qemu-kvm
 364936  364946 ?        00:00:00 qemu-kvm
 364936  364952 ?        00:00:52 CPU 0/KVM
 364936  364953 ?        00:00:26 CPU 1/KVM
 364936  364954 ?        00:00:30 CPU 2/KVM
 364936  364956 ?        00:00:00 vnc_worker
Linux CFS(완전히 공정한 스케줄러)로 인해 에뮬레이터 스레드는 일반적으로 libvirt의 에뮬레이터 핀 세트에 정의된 내에서 하나의 pCPU에서 다른 pCPU로 주기적으로 이동합니다.
NFV 컨텍스트에서 isolcpus 매개변수를 사용할 때 에뮬레이터 스레드를 구성하면 문제가 발생할 수 있습니다. 이 커널 구성은 해당 CPU에서 CFS 스케줄링을 비활성화하기 때문입니다. isolcpus 매개변수 를 사용하지 않는 경우 에뮬레이터 스레드가 패킷을 처리하는 CPU를 중단하면 패킷 손실이 발생할 수 있습니다.
에뮬레이터 스레드의 예는 다음과 같습니다.
- QEMU-kvm 스레드
- vnc_worker 스레드
- vhost-<qemu-kvm PID> 커널 스레드( virtio virtio-net 사용)(하이퍼바이저의 커널 네트워킹)
13.2.2. 에뮬레이터 스레드 고정의 기본 동작
기본적으로 nova는 모든 vCPU에 할당된 pCPU에 걸쳐 설정된 에뮬레이터 스레드 고정을 구성합니다. isolcpus 매개변수를 사용하지 않는 경우 에뮬레이터 스레드는 모든 pCPU에서 예약할 수 있으며 주기적으로 하나의 pCPU에서 다른 스레드로 이동합니다.
virsh dumpxml instance-0000001d
(...)
  <vcpu placement='static'>4</vcpu>
  <cputune>
    <shares>4096</shares>
    <vcpupin vcpu='0' cpuset='34'/>
    <vcpupin vcpu='1' cpuset='14'/>
    <vcpupin vcpu='2' cpuset='10'/>
    <vcpupin vcpu='3' cpuset='30'/>
    <emulatorpin cpuset='10,14,30,34'/>
  </cputune>
(...)
[root@overcloud-compute-0 ~]# virsh dumpxml instance-00000009
(...)
<nova:vcpus>3</nova:vcpus>
<vcpu placement='static'>3</vcpu>
<vcpupin vcpu='0' cpuset='1'/>
<vcpupin vcpu='1' cpuset='2'/>
<vcpupin vcpu='2' cpuset='3'/>
(...)
<emulatorpin cpuset='1-3'/>
(...)따라서 이러한 CPU는 qemu의 에뮬레이터 스레드로 선점할 수 있으므로 패킷이 손실될 수 있습니다.
에뮬레이터 스레드 고정의 새로운 기능의 현재 진행 상황에 대한 자세한 내용은 버그 1468004 및 OpenStack Change 510897을 참조하십시오.
이 작성 시점에서 초안에서 다음 스레드 정책을 지정했습니다.
Valid THREAD-POLICY values are:

  - ``share``: (default) The emulator threads float across the pCPUs
    associated to the guest. To place a workload's emulator threads on
    a set of isolated physical CPUs, set ``share``` and
    ``[compute]/cpu_shared_set`` configuration option to the set of
    host CPUs that should be used for best-effort CPU resources.

  - ``isolate``: The emulator threads are isolated on a single pCPU.
13.2.3. isolcpus on emulator Thread Scheduling의 영향 정보
isolcpus가 사용되는 경우 CFS 스케줄러가 비활성화되고 모든 에뮬레이터 스레드가 사용 가능한 가장 낮은 색인된 pCPU에서 실행됩니다. 결과적으로 개입 또는 추가 구성이 없으면 인스턴스 중 하나의 vCPU가 에뮬레이터 스레드와의 리소스 경합 위험이 높아집니다.
자세한 내용은 Kernel.org Bugzilla - Bug 116701 에서 확인할 수 있습니다.
다음 알고리즘을 사용하여 에뮬레이터 스레드에서 사용하는 vCPU를 확인합니다.
PCPU=MIN([EMULATORPINSET])
VCPU=REVERSE_CPUSET(PCPU)

REVERSE_CPUSET :=  SELECT pcpu from `virsh dumpxml <instance name> | grep "cpuset=$PCPU"`
예를 들어 이 인스턴스에서 모든 에뮬레이터 스레드와 하위 항목은 기본 에뮬레이터 핀 세트에서 선호도 1-3을 상속합니다.
[root@overcloud-compute-0 ~]# taskset -a -c -p `pgrep -f instance-00000009`
pid 364936's current affinity list: 1-3
pid 364946's current affinity list: 1-3
pid 364952's current affinity list: 1
pid 364953's current affinity list: 2
pid 364954's current affinity list: 3
pid 364956's current affinity list: 1-3
[root@overcloud-compute-0 ~]# ps -Tp `pgrep -f instance-00000009`
    PID    SPID TTY          TIME CMD
 364936  364936 ?        00:00:02 qemu-kvm
 364936  364946 ?        00:00:00 qemu-kvm
 364936  364952 ?        00:00:51 CPU 0/KVM
 364936  364953 ?        00:00:26 CPU 1/KVM
 364936  364954 ?        00:00:30 CPU 2/KVM
 364936  364956 ?        00:00:00 vnc_worker
[root@overcloud-compute-0 ~]# pgrep -f vhost- | xargs -I {} taskset -a -c -p {}
pid 364948's current affinity list: 1-3
pid 364949's current affinity list: 1-3
pid 364950's current affinity list: 1-3
[root@overcloud-compute-0 ~]#
isolcpus와 함께 모든 에뮬레이터 스레드와 vhost-* 스레드는 pCPU1에서 실행되고 다시 예약되지 않습니다.
cat /proc/sched_debug | sed '/^cpu#/,/^runnable/{//!d}' | grep vhost -C3
(...)
cpu#1, 2099.998 MHz
runnable tasks:
            task   PID         tree-key  switches  prio     wait-time             sum-exec        sum-sleep
----------------------------------------------------------------------------------------------------------
      watchdog/1    11        -2.995579    410285     0         0.000000      5025.887998         0.000000 0 /
     migration/1    12         0.000000        79     0         0.000000         3.375060         0.000000 0 /
     ksoftirqd/1    13   5172444.259776        54   120         0.000000         0.570500         0.000000 0 /
     kworker/1:0    14   5188475.472257       370   120         0.000000        14.707114         0.000000 0 /
    kworker/1:0H    15      8360.049510        10   100         0.000000         0.150151         0.000000 0 /
     kworker/1:1  2707   5045807.055876     16370   120         0.000000       793.611916         0.000000 0 /
    kworker/1:1H  2763   5187682.987749     11755   100         0.000000       191.949725         0.000000 0 /
        qemu-kvm 364936      3419.522791     50276   120         0.000000      2476.880384         0.000000 0 /machine.slice/machine-qemu\x2d6\x2dinstance\x2d00000009.scope/emulator
        qemu-kvm 364946      1270.815296       102   120         0.000000        23.204111         0.000000 0 /machine.slice/machine-qemu\x2d6\x2dinstance\x2d00000009.scope/emulator
       CPU 0/KVM 364952     52703.660314     53709   120         0.000000     52715.105472         0.000000 0 /machine.slice/machine-qemu\x2d6\x2dinstance\x2d00000009.scope/vcpu0
      vnc_worker 364956       123.609634         1   120         0.000000         0.016849         0.000000 0 /machine.slice/machine-qemu\x2d6\x2dinstance\x2d00000009.scope/emulator
    vhost-364936 364948      3410.527677      1039   120         0.000000        84.254772         0.000000 0 /machine.slice/machine-qemu\x2d6\x2dinstance\x2d00000009.scope/emulator
    vhost-364936 364949      3407.341502        55   120         0.000000         2.894394         0.000000 0 /machine.slice/machine-qemu\x2d6\x2dinstance\x2d00000009.scope/emulator
    vhost-364936 364950      3410.395220       174   120         0.000000        10.969077         0.000000 0 /machine.slice/machine-qemu\x2d6\x2dinstance\x2d00000009.scope/emulator

cpu#2, 2099.998 MHz
runnable tasks:
            task   PID         tree-key  switches  prio     wait-time             sum-exec        sum-sleep
----------------------------------------------------------------------------------------------------------
      watchdog/2    16        -5.995418    410285     0         0.000000      5197.571153         0.000000 0 /
     migration/2    17         0.000000        79     0         0.000000         3.384688         0.000000 0 /
     ksoftirqd/2    18        -7.031102         3   120         0.000000         0.019079         0.000000 0 /
     kworker/2:0    19         0.119413        39   120         0.000000         0.588589         0.000000 0 /
    kworker/2:0H    20        -1.047613         8   100         0.000000         0.086272         0.000000 0 /
     kworker/2:1  2734   1475469.236026     11322   120         0.000000       241.388582         0.000000 0 /
       CPU 1/KVM 364953     27258.370583     33294   120         0.000000     27269.017017         0.000000 0 /machine.slice/machine-qemu\x2d6\x2dinstance\x2d00000009.scope/vcpu1

cpu#3, 2099.998 MHz
runnable tasks:
            task   PID         tree-key  switches  prio     wait-time             sum-exec        sum-sleep
----------------------------------------------------------------------------------------------------------
      watchdog/3    21        -5.996592    410285     0         0.000000      4970.777439         0.000000 0 /
     migration/3    22         0.000000        79     0         0.000000         3.886799         0.000000 0 /
     ksoftirqd/3    23        -7.035295         3   120         0.000000         0.014677         0.000000 0 /
     kworker/3:0    24        17.758583        38   120         0.000000         0.637152         0.000000 0 /
    kworker/3:0H    25        -1.047727         8   100         0.000000         0.077141         0.000000 0 /
     kworker/3:1 362530    154177.523420        83   120         0.000000         6.544285         0.000000 0 /
       CPU 2/KVM 364954     32456.061889     25966   120         0.000000     32466.719084         0.000000 0 /machine.slice/machine-qemu\x2d6\x2dinstance\x2d00000009.scope/vcpu2
13.2.4. 에뮬레이터 스레드의 최적 위치
이 섹션에서는 에뮬레이터 스레드를 다음 네트워크에 배치하는 방법에 대해 설명합니다.
- Open vSwitch의 인스턴스 및 netdev 데이터 경로 내의 DPDK 네트워킹
- 인스턴스 내의 DPDK 네트워킹, Open vSwitch의 시스템 데이터 경로 및 하이퍼바이저의 커널 공간 네트워킹
- Open vSwitch의 인스턴스 내 커널 네트워킹 및 netdev datapath
13.2.4.1. Open vSwitch의 인스턴스 및 netdev datapath에서 DPDK 네트워킹을 사용하여 에뮬레이터 스레드의 최적 배치
DPDK가 인스턴스 내에서 실행되면 패킷 처리가 전적으로 사용자 공간에서 수행됩니다. vCPU0에서 실행되도록 PMD를 예약하지 마십시오. 이는 OS 및 인터럽트 처리용으로 남아 있어야 하기 때문입니다. 인스턴스 내의 PMD CPU는 활성 루프를 실행하고 CPU의 100%가 필요하므로 선점해서는 안 됩니다. 이러한 vCPU 중 하나가 선점된 경우 패킷 손실이 발생할 수 있습니다. 따라서 emulatorpin cpuset은 1 이상 번호가 지정된 가상 CPU를 처리하는 물리적 CPU와 겹치지 않는 방식으로 구성해야 합니다.
인스턴스 내에서 DPDK 네트워킹을 사용하는 경우 에뮬레이터 스레드의 최적 위치는 vCPU 0을 처리하는 pCPU 또는 가상 CPU를 전혀 처리하지 않는 전용 물리적 CPU입니다.
인스턴스 내의 하이퍼바이저 및 DPDK에서 OVS-DPDK를 사용하는 경우 에뮬레이터 스레드를 vCPU 0에 배치합니다.
13.2.4.2. Open vSwitch의 인스턴스 및 시스템 데이터 경로의 DPDK 네트워킹을 사용하여 에뮬레이터 스레드의 최적 배치
하이퍼바이저에서 커널 공간 네트워킹을 사용하면 하이퍼바이저에서 패킷 처리가 커널 내에서 실행됩니다.
인스턴스 내에서 DPDK 네트워킹을 사용하는 경우 에뮬레이터 스레드의 최적 위치는 vCPU 0을 처리하는 pCPU 또는 가상 CPU를 처리하지 않는 전용 물리적 CPU입니다.
이 시나리오에서는 vNIC 대기열에 대한 패킷 처리가 하이퍼바이저의 vhost-<qemu-kvm PID> 커널 스레드 내에서 실행됩니다. 트래픽이 많은 경우 이러한 커널 스레드는 상당한 CPU 로드를 생성할 수 있습니다. 에뮬레이터 스레드의 최적 위치는 상황에 따라 결정되어야 합니다.
[root@overcloud-compute-0 ~]# ps aux | grep vhost-
root      364948  0.0  0.0      0     0 ?        S    20:32   0:00 [vhost-364936]
root      364949  0.0  0.0      0     0 ?        S    20:32   0:00 [vhost-364936]
root      364950  0.0  0.0      0     0 ?        S    20:32   0:00 [vhost-364936]
13.2.4.3. Open vSwitch의 인스턴스 및 netdev 데이터 경로 내에서 커널 네트워킹을 사용하여 에뮬레이터 스레드 최적의 배치
인스턴스 내 커널 네트워킹에는 다음 두 가지 옵션이 있습니다.
- 예를 들어 인스턴스 내에서 소프트irqs와 같은 인터럽트 배포를 최적화합니다. 이러한 경우 에뮬레이터 스레드에 추가 pCPU를 할당할 필요가 없으며 네트워크 인터럽트를 처리하지 않는 pCPU에 에뮬레이터 스레드를 할당할 수 있습니다.
- 에뮬레이터 스레드에 대해 동일한 NUMA 노드에서 전용 pCPU를 사용합니다.
첫 번째 옵션의 복잡성으로 인해 두 번째 옵션이 권장됩니다.
13.3. 진단
13.3.1. 데모 환경
데모 환경에서는 instance -0000001d 인스턴스 중 하나를 실행합니다. 관련 qemu-kvm 스레드에는 다음 PID가 있습니다.
[root@overcloud-compute-0 ~]# pidof qemu-kvm
73517
13.3.2. emulatorpin의 작동 방식
기본적으로 Red Hat OpenStack Platform 배포에서는 다음 설정을 사용합니다.
virsh dumpxml instance-0000001d
(...)
  <vcpu placement='static'>4</vcpu>
  <cputune>
    <shares>4096</shares>
    <vcpupin vcpu='0' cpuset='34'/>
    <vcpupin vcpu='1' cpuset='14'/>
    <vcpupin vcpu='2' cpuset='10'/>
    <vcpupin vcpu='3' cpuset='30'/>
    <emulatorpin cpuset='10,14,30,34'/>
  </cputune>
(...)
이로 인해 qemu-kvm, vnc_worker 등과 같은 에뮬레이터 스레드의 예기치 않은 할당이 발생합니다.
[root@overcloud-compute-0 ~]# ps -T -p 73517
    PID    SPID TTY          TIME CMD
  73517   73517 ?        00:00:00 qemu-kvm
  73517   73527 ?        00:00:00 qemu-kvm
  73517   73535 ?        00:00:06 CPU 0/KVM
  73517   73536 ?        00:00:02 CPU 1/KVM
  73517   73537 ?        00:00:03 CPU 2/KVM
  73517   73538 ?        00:00:02 CPU 3/KVM
  73517   73540 ?        00:00:00 vnc_worker
[root@overcloud-compute-0 ~]# taskset -apc 73517
pid 73517's current affinity list: 10,14,30,34
pid 73527's current affinity list: 10,14,30,34
pid 73535's current affinity list: 34
pid 73536's current affinity list: 14
pid 73537's current affinity list: 10
pid 73538's current affinity list: 30
pid 73540's current affinity list: 10,14,30,34
[root@overcloud-compute-0 ~]# virsh vcpupin instance-0000001d | awk '$NF~/[0-9]+/ {print $NF}' | sort -n | while read CPU; do sed '/cpu#/,/runnable task/{//!d}' /proc/sched_debug | sed -n "/^cpu#${CPU},/,/^$/p" ; done
cpu#10, 2197.477 MHz
runnable tasks:
task PID tree-key switches prio wait-time sum-exec sum-sleep
----------------------------------------------------------------------------------------------------------
migration/10 64 0.000000 107 0 0.000000 90.232791 0.000000 0 /
ksoftirqd/10 65 -13.045337 3 120 0.000000 0.004679 0.000000 0 /
kworker/10:0 66 -12.892617 40 120 0.000000 0.157359 0.000000 0 /
kworker/10:0H 67 -9.320550 8 100 0.000000 0.015065 0.000000 0 /
kworker/10:1 17996 9695.675528 23 120 0.000000 0.222805 0.000000 0 /
qemu-kvm 73517 1994.534332 27105 120 0.000000 886.203254 0.000000 0 /machine.slice/machine-qemu\x2d1\x2dinstance\x2d0000001d.scope/emulator
qemu-kvm 73527 722.347466 84 120 0.000000 18.236155 0.000000 0 /machine.slice/machine-qemu\x2d1\x2dinstance\x2d0000001d.scope/emulator
CPU 2/KVM 73537 3356.749162 18051 120 0.000000 3370.045619 0.000000 0 /machine.slice/machine-qemu\x2d1\x2dinstance\x2d0000001d.scope/vcpu2
vnc_worker 73540 354.007735 1 120 0.000000 0.047002 0.000000 0 /machine.slice/machine-qemu\x2d1\x2dinstance\x2d0000001d.scope/emulator
worker 74584 1970.499537 5 120 0.000000 0.130143 0.000000 0 /machine.slice/machine-qemu\x2d1\x2dinstance\x2d0000001d.scope/emulator
worker 74585 1970.492700 4 120 0.000000 0.071887 0.000000 0 /machine.slice/machine-qemu\x2d1\x2dinstance\x2d0000001d.scope/emulator
worker 74586 1982.467246 3 120 0.000000 0.033604 0.000000 0 /machine.slice/machine-qemu\x2d1\x2dinstance\x2d0000001d.scope/emulator
worker 74587 1994.520768 1 120 0.000000 0.076039 0.000000 0 /machine.slice/machine-qemu\x2d1\x2dinstance\x2d0000001d.scope/emulator
worker 74588 2006.500153 1 120 0.000000 0.004878 0.000000 0 /machine.slice/machine-qemu\x2d1\x2dinstance\x2d0000001d.scope/emulator
cpu#14, 2197.477 MHz
runnable tasks:
task PID tree-key switches prio wait-time sum-exec sum-sleep
----------------------------------------------------------------------------------------------------------
migration/14 88 0.000000 107 0 0.000000 90.107596 0.000000 0 /
ksoftirqd/14 89 -13.045376 3 120 0.000000 0.004782 0.000000 0 /
kworker/14:0 90 -12.921990 40 120 0.000000 0.128166 0.000000 0 /
kworker/14:0H 91 -9.321186 8 100 0.000000 0.016870 0.000000 0 /
kworker/14:1 17999 6247.571171 5 120 0.000000 0.028576 0.000000 0 /
CPU 1/KVM 73536 2274.381281 6679 120 0.000000 2287.691654 0.000000 0 /machine.slice/machine-qemu\x2d1\x2dinstance\x2d0000001d.scope/vcpu1
cpu#30, 2197.477 MHz
runnable tasks:
task PID tree-key switches prio wait-time sum-exec sum-sleep
----------------------------------------------------------------------------------------------------------
migration/30 180 0.000000 107 0 0.000000 89.206960 0.000000 0 /
ksoftirqd/30 181 -13.045892 3 120 0.000000 0.003828 0.000000 0 /
kworker/30:0 182 -12.929272 40 120 0.000000 0.120754 0.000000 0 /
kworker/30:0H 183 -9.321056 8 100 0.000000 0.018042 0.000000 0 /
kworker/30:1 18012 6234.935501 5 120 0.000000 0.026505 0.000000 0 /
CPU 3/KVM 73538 2474.183301 12595 120 0.000000 2487.479666 0.000000 0 /machine.slice/machine-qemu\x2d1\x2dinstance\x2d0000001d.scope/vcpu3
cpu#34, 2197.477 MHz
runnable tasks:
task PID tree-key switches prio wait-time sum-exec sum-sleep
----------------------------------------------------------------------------------------------------------
migration/34 204 0.000000 107 0 0.000000 89.067908 0.000000 0 /
ksoftirqd/34 205 -13.046824 3 120 0.000000 0.002884 0.000000 0 /
kworker/34:0 206 -12.922407 40 120 0.000000 0.127423 0.000000 0 /
kworker/34:0H 207 -9.320822 8 100 0.000000 0.017381 0.000000 0 /
kworker/34:1 18016 10788.797590 7 120 0.000000 0.042631 0.000000 0 /
CPU 0/KVM 73535 5969.227225 14233 120 0.000000 5983.425363 0.000000 0 /machine.slice/machine-qemu\x2d1\x2dinstance\x2d0000001d.scope/vcpu0에뮬레이터 스레드는 virsh emulatorpin을 사용하여 이동할 수 있습니다.
virsh emulatorpin instance-0000001d 34
CPU가 아닌 모든 스레드의 선호도가 변경됩니다.
[root@overcloud-compute-0 ~]# ps -T -p 73517
    PID    SPID TTY          TIME CMD
  73517   73517 ?        00:00:00 qemu-kvm
  73517   73527 ?        00:00:00 qemu-kvm
  73517   73535 ?        00:00:06 CPU 0/KVM
  73517   73536 ?        00:00:02 CPU 1/KVM
  73517   73537 ?        00:00:03 CPU 2/KVM
  73517   73538 ?        00:00:02 CPU 3/KVM
  73517   73540 ?        00:00:00 vnc_worker
[root@overcloud-compute-0 ~]# taskset -apc 73517
pid 73517's current affinity list: 34
pid 73527's current affinity list: 34
pid 73535's current affinity list: 34
pid 73536's current affinity list: 14
pid 73537's current affinity list: 10
pid 73538's current affinity list: 30
pid 73540's current affinity list: 34
/proc/sched_debug의 기록 데이터의 스위치 수를 기록해 둡니다. 다음 예에서 PID 73517은 이미 cpu#34로 이동했습니다. 마지막 출력 이후 다른 에뮬레이터 작업자가 실행되지 않아 cpu#10에 계속 표시되었습니다.
[root@overcloud-compute-0 ~]# virsh vcpupin instance-0000001d | awk '$NF~/[0-9]+/ {print $NF}' | sort -n | while read CPU; do sed '/cpu#/,/runnable task/{//!d}' /proc/sched_debug | sed -n "/^cpu#${CPU},/,/^$/p" ; done
cpu#10, 2197.477 MHz
runnable tasks:
            task   PID         tree-key  switches  prio     wait-time             sum-exec        sum-sleep
----------------------------------------------------------------------------------------------------------
    migration/10    64         0.000000       107     0         0.000000        90.232791         0.000000 0 /
    ksoftirqd/10    65       -13.045337         3   120         0.000000         0.004679         0.000000 0 /
    kworker/10:0    66       -12.892617        40   120         0.000000         0.157359         0.000000 0 /
   kworker/10:0H    67        -9.320550         8   100         0.000000         0.015065         0.000000 0 /
    kworker/10:1 17996      9747.429082        26   120         0.000000         0.255547         0.000000 0 /
        qemu-kvm 73527       722.347466        84   120         0.000000        18.236155         0.000000 0 /machine.slice/machine-qemu\x2d1\x2dinstance\x2d0000001d.scope/emulator
       CPU 2/KVM 73537      3424.520709     21610   120         0.000000      3437.817166         0.000000 0 /machine.slice/machine-qemu\x2d1\x2dinstance\x2d0000001d.scope/vcpu2
      vnc_worker 73540       354.007735         1   120         0.000000         0.047002         0.000000 0 /machine.slice/machine-qemu\x2d1\x2dinstance\x2d0000001d.scope/emulator

cpu#14, 2197.477 MHz
runnable tasks:
            task   PID         tree-key  switches  prio     wait-time             sum-exec        sum-sleep
----------------------------------------------------------------------------------------------------------
    migration/14    88         0.000000       107     0         0.000000        90.107596         0.000000 0 /
    ksoftirqd/14    89       -13.045376         3   120         0.000000         0.004782         0.000000 0 /
    kworker/14:0    90       -12.921990        40   120         0.000000         0.128166         0.000000 0 /
   kworker/14:0H    91        -9.321186         8   100         0.000000         0.016870         0.000000 0 /
    kworker/14:1 17999      6247.571171         5   120         0.000000         0.028576         0.000000 0 /
       CPU 1/KVM 73536      2283.094453      7028   120         0.000000      2296.404826         0.000000 0 /machine.slice/machine-qemu\x2d1\x2dinstance\x2d0000001d.scope/vcpu1

cpu#30, 2197.477 MHz
runnable tasks:
            task   PID         tree-key  switches  prio     wait-time             sum-exec        sum-sleep
----------------------------------------------------------------------------------------------------------
    migration/30   180         0.000000       107     0         0.000000        89.206960         0.000000 0 /
    ksoftirqd/30   181       -13.045892         3   120         0.000000         0.003828         0.000000 0 /
    kworker/30:0   182       -12.929272        40   120         0.000000         0.120754         0.000000 0 /
   kworker/30:0H   183        -9.321056         8   100         0.000000         0.018042         0.000000 0 /
    kworker/30:1 18012      6234.935501         5   120         0.000000         0.026505         0.000000 0 /
       CPU 3/KVM 73538      2521.828931     14047   120         0.000000      2535.125296         0.000000 0 /machine.slice/machine-qemu\x2d1\x2dinstance\x2d0000001d.scope/vcpu3

cpu#34, 2197.477 MHz
runnable tasks:
            task   PID         tree-key  switches  prio     wait-time             sum-exec        sum-sleep
----------------------------------------------------------------------------------------------------------
    migration/34   204         0.000000       107     0         0.000000        89.067908         0.000000 0 /
    ksoftirqd/34   205       -13.046824         3   120         0.000000         0.002884         0.000000 0 /
    kworker/34:0   206       -12.922407        40   120         0.000000         0.127423         0.000000 0 /
   kworker/34:0H   207        -9.320822         8   100         0.000000         0.017381         0.000000 0 /
    kworker/34:1 18016     10788.797590         7   120         0.000000         0.042631         0.000000 0 /
        qemu-kvm 73517         2.613794     27706   120         0.000000       941.839262         0.000000 0 /machine.slice/machine-qemu\x2d1\x2dinstance\x2d0000001d.scope/emulator
       CPU 0/KVM 73535      5994.533905     15169   120         0.000000      6008.732043         0.000000 0 /machine.slice/machine-qemu\x2d1\x2dinstance\x2d0000001d.scope/vcpu0
스레드 73517이 cpu#34로 이동하는 방법을 참조하십시오. 이제 VNC 세션과 상호 작용하는 경우 /proc/sched_debug에서 cpu#34의 vnc_worker 스레드도 표시하는 것을 확인할 수 있습니다.
[root@overcloud-compute-0 ~]# virsh vcpupin instance-0000001d | awk '$NF~/[0-9]+/ {print $NF}' | sort -n | while read CPU; do sed '/cpu#/,/runnable task/{//!d}' /proc/sched_debug | sed -n "/^cpu#${CPU},/,/^$/p" ; done
cpu#10, 2197.477 MHz
runnable tasks:
            task   PID         tree-key  switches  prio     wait-time             sum-exec        sum-sleep
----------------------------------------------------------------------------------------------------------
    migration/10    64         0.000000       107     0         0.000000        90.232791         0.000000 0 /
    ksoftirqd/10    65       -13.045337         3   120         0.000000         0.004679         0.000000 0 /
    kworker/10:0    66       -12.892617        40   120         0.000000         0.157359         0.000000 0 /
   kworker/10:0H    67        -9.320550         8   100         0.000000         0.015065         0.000000 0 /
    kworker/10:1 17996      9963.300958        27   120         0.000000         0.273007         0.000000 0 /
        qemu-kvm 73527       722.347466        84   120         0.000000        18.236155         0.000000 0 /machine.slice/machine-qemu\x2d1\x2dinstance\x2d0000001d.scope/emulator
       CPU 2/KVM 73537      3563.793234     26162   120         0.000000      3577.089691         0.000000 0 /machine.slice/machine-qemu\x2d1\x2dinstance\x2d0000001d.scope/vcpu2

cpu#14, 2197.477 MHz
runnable tasks:
            task   PID         tree-key  switches  prio     wait-time             sum-exec        sum-sleep
----------------------------------------------------------------------------------------------------------
    migration/14    88         0.000000       107     0         0.000000        90.107596         0.000000 0 /
    ksoftirqd/14    89       -13.045376         3   120         0.000000         0.004782         0.000000 0 /
    kworker/14:0    90       -12.921990        40   120         0.000000         0.128166         0.000000 0 /
   kworker/14:0H    91        -9.321186         8   100         0.000000         0.016870         0.000000 0 /
    kworker/14:1 17999      6247.571171         5   120         0.000000         0.028576         0.000000 0 /
       CPU 1/KVM 73536      2367.789075      9648   120         0.000000      2381.099448         0.000000 0 /machine.slice/machine-qemu\x2d1\x2dinstance\x2d0000001d.scope/vcpu1

cpu#30, 2197.477 MHz
runnable tasks:
            task   PID         tree-key  switches  prio     wait-time             sum-exec        sum-sleep
----------------------------------------------------------------------------------------------------------
    migration/30   180         0.000000       107     0         0.000000        89.206960         0.000000 0 /
    ksoftirqd/30   181       -13.045892         3   120         0.000000         0.003828         0.000000 0 /
    kworker/30:0   182       -12.929272        40   120         0.000000         0.120754         0.000000 0 /
   kworker/30:0H   183        -9.321056         8   100         0.000000         0.018042         0.000000 0 /
    kworker/30:1 18012      6234.935501         5   120         0.000000         0.026505         0.000000 0 /
       CPU 3/KVM 73538      2789.628278     24788   120         0.000000      2802.924643         0.000000 0 /machine.slice/machine-qemu\x2d1\x2dinstance\x2d0000001d.scope/vcpu3

cpu#34, 2197.477 MHz
runnable tasks:
            task   PID         tree-key  switches  prio     wait-time             sum-exec        sum-sleep
----------------------------------------------------------------------------------------------------------
    migration/34   204         0.000000       107     0         0.000000        89.067908         0.000000 0 /
    ksoftirqd/34   205       -13.046824         3   120         0.000000         0.002884         0.000000 0 /
    kworker/34:0   206       -12.922407        40   120         0.000000         0.127423         0.000000 0 /
   kworker/34:0H   207        -9.320822         8   100         0.000000         0.017381         0.000000 0 /
    kworker/34:1 18016     11315.391422        25   120         0.000000         0.196078         0.000000 0 /
        qemu-kvm 73517       471.930276     30975   120         0.000000      1295.543576         0.000000 0 /machine.slice/machine-qemu\x2d1\x2dinstance\x2d0000001d.scope/emulator
       CPU 0/KVM 73535      6160.062172     19201   120         0.000000      6174.260310         0.000000 0 /machine.slice/machine-qemu\x2d1\x2dinstance\x2d0000001d.scope/vcpu0
      vnc_worker 73540       459.653524        38   120         0.000000         7.535037         0.000000 0 /machine.slice/machine-qemu\x2d1\x2dinstance\x2d0000001d.scope/emulator
          worker 78703       449.098251         2   120         0.000000         0.120313         0.000000 0 /machine.slice/machine-qemu\x2d1\x2dinstance\x2d0000001d.scope/emulator
          worker 78704       449.131175         3   120         0.000000         0.066961         0.000000 0 /machine.slice/machine-qemu\x2d1\x2dinstance\x2d0000001d.scope/emulator
          worker 78705       461.100994         4   120         0.000000         0.022897         0.000000 0 /machine.slice/machine-qemu\x2d1\x2dinstance\x2d0000001d.scope/emulator