
Red Hat Training
A Red Hat training course is available for Red Hat OpenStack Platform
第1章 Compute のオートスケールの設定
本ガイドは、システム使用率が過度に高くなった場合に Compute インスタンスを自動的にスケールアウトする方法について説明します。CPU やメモリーの使用率を考慮した事前定義済みのルールを使用することにより、Orchestration (heat) が必要に応じて自動的にインスタンスの追加/削除をするように設定することが可能です。
1.1. アーキテクチャーの概要
1.1.1. Orchestration
オートスケールの背後にあるコアコンポーネントは Orchestration (heat) です。Orchestration では、人間が判読可能な YAML テンプレートを使用してルールを定義することができます。これらのルールは、Telemetry データを評価してから、インスタンスの追加を決定します。アクティビティーが低下した後には、Orchestration が不要なインスタンスを自動的に削除することができます。
1.1.2. Telemetry
Telemetry は、インスタンスおよび物理ホストの CPU、ストレージ、メモリーの使用率に関するデータを収集して、OpenStack 環境のパフォーマンスを監視します。Orchestration テンプレートは、事前定義されたアクションを実行するかどうかを評価する際に、Telemetry データを検証します。
1.1.3. 主要な用語
- スタック: スタックは、1 つのアプリケーションを稼働させるのに必要な全リソースで構成されます。1 つのインスタンスとそのリソースから成る単純なスタックもあれば、複数階層のアプリケーションを構成するリソースの依存関係を伴う複数のインスタンスから成る複雑なスタックもあります。
テンプレート: Heat が実行する一式のタスクを定義する YAML スクリプト。たとえば、機能別に異なるテンプレートを使用するのが望ましいです。
- スタックテンプレート: このテンプレートには、Telemetry が対応する必要のある閾値やオートスケールグループを定義します。
- 環境テンプレート: 使用するフレーバーやイメージ、仮想ネットワークの設定方法、インストールするソフトウェアなどの環境のビルド情報を定義します。
1.2. 例: CPU 使用率に基づいたオートスケール
以下の例では、Orchestration が Telemetry データを検証し、CPU 使用率の増加に対応して、インスタンスの数を自動的に増やします。必要なルールとその後の設定を定義するためにスタックテンプレートと環境テンプレートが作成されます。この例では、既存のリソース (ネットワークなど) を使用しており、実際にお使いの環境のリソース名とは異なる可能性があります。
インスタンスのフレーバー、ネットワーク設定、イメージの種別を記述する環境テンプレートを作成します。
/etc/heat/templates/cirros.yamlに以下の値を入力します。heat_template_version: 2014-10-16 description: A base Cirros 0.3.4 server resources: server: type: OS::Nova::Server properties: block_device_mapping: - device_name: vda delete_on_termination: true volume_id: { get_resource: volume } flavor: m1.nano key_name: admin networks: - port: { get_resource: port } port: type: OS::Neutron::Port properties: network: private security_groups: - all floating_ip: type: OS::Neutron::FloatingIP properties: floating_network: public floating_ip_assoc: type: OS::Neutron::FloatingIPAssociation properties: floatingip_id: { get_resource: floating_ip } port_id: { get_resource: port } volume: type: OS::Cinder::Volume properties: image: 'Cirros 0.3.4' size: 1/root/environment.yamlに Orchestration のリソースを登録します。resource_registry: "OS::Nova::Server::Cirros": "file:///etc/heat/templates/cirros.yaml"監視する CPU の閾値と追加すべきインスタンス数を記述するスタックテンプレートを作成します。また、インスタンスグループも作成して、このテンプレートに参加することが可能なインスタンス数の最小値および最大値を定義します。
/root/example.yamlに以下の値を入力します。heat_template_version: 2014-10-16 description: Example auto scale group, policy and alarm resources: scaleup_group: type: OS::Heat::AutoScalingGroup properties: cooldown: 60 desired_capacity: 1 max_size: 3 min_size: 1 resource: type: OS::Nova::Server::Cirros scaleup_policy: type: OS::Heat::ScalingPolicy properties: adjustment_type: change_in_capacity auto_scaling_group_id: { get_resource: scaleup_group } cooldown: 60 scaling_adjustment: 1 scaledown_policy: type: OS::Heat::ScalingPolicy properties: adjustment_type: change_in_capacity auto_scaling_group_id: { get_resource: scaleup_group } cooldown: 60 scaling_adjustment: -1 cpu_alarm_high: type: OS::Ceilometer::Alarm properties: meter_name: cpu_util statistic: avg period: 60 evaluation_periods: 1 threshold: 50 alarm_actions: - {get_attr: [scaleup_policy, alarm_url]} comparison_operator: gt cpu_alarm_low: type: OS::Ceilometer::Alarm properties: meter_name: cpu_util statistic: avg period: 60 evaluation_periods: 1 threshold: 10 alarm_actions: - {get_attr: [scaledown_policy, alarm_url]} comparison_operator: ltTelemetry のデータ収集の間隔を更新します。デフォルトでは、Telemetry はインスタンスを 10 分ごとにポーリングして、CPU のデータを取得します。以下の例では、
/etc/ceilometer/pipeline.yamlで、この間隔を 60 秒に変更します。- name: cpu_source interval: 60 meters: - "cpu" sinks: - cpu_sink
注記ポーリングの頻度を高くすると、コントロールプレーンに対する負荷が高くなるため、実稼働環境では、60 秒に設定することは、お勧めできません。
OpenStack のサービスをすべて再起動して、更新された Telemetry の設定を適用します。
# openstack-service restart
注記このステップを実行すると、OpenStack デプロイメントは短時間停止します。
Orchestration のスクリプトを実行し、環境をビルドしてインスタンスをデプロイします。
# heat stack-create example -f /root/example.yaml -e /root/environment.yaml
+--------------------------------------+------------+--------------------+----------------------+
| id                                   | stack_name | stack_status       | creation_time        |
+--------------------------------------+------------+--------------------+----------------------+
| 6fca513c-25a1-4849-b7ab-909e37f52eca | example    | CREATE_IN_PROGRESS | 2015-08-31T16:18:02Z |
+--------------------------------------+------------+--------------------+----------------------+
Orchestration はスタックを作成して、
scaleup_groupの定義のmin_sizeの設定通りに、単一の cirros インスタンスを起動します。# nova list +--------------------------------------+-------------------------------------------------------+--------+------------+-------------+--------------------------------------+ | ID | Name | Status | Task State | Power State | Networks | +--------------------------------------+-------------------------------------------------------+--------+------------+-------------+--------------------------------------+ | 3f627c84-06aa-4782-8c12-29409964cc73 | ex-qeki-3azno6me5gvm-pqmr5zd6kuhm-server-gieck7uoyrwc | ACTIVE | - | Running | private=10.10.1.156, 192.168.122.234 | +--------------------------------------+-------------------------------------------------------+--------+------------+-------------+--------------------------------------+
Orchestration は、
cpu_alarm_highおよびcpu_alarm_lowの定義に従って、スケールアップまたはスケールダウンのイベントをトリガーするのに使用する 2 つの CPU アラームも作成します。# ceilometer alarm-list +--------------------------------------+-------------------------------------+-------------------+----------+---------+------------+--------------------------------+------------------+ | Alarm ID | Name | State | Severity | Enabled | Continuous | Alarm condition | Time constraints | +--------------------------------------+-------------------------------------+-------------------+----------+---------+------------+--------------------------------+------------------+ | 04b4f845-f5b6-4c5a-8af0-59e03c22e6fa | example-cpu_alarm_high-rd5kysmlahvx | ok | low | True | True | cpu_util > 50.0 during 1 x 60s | None | | ac81cd81-20b3-45f9-bea4-e51f00499602 | example-cpu_alarm_low-6t65kswutupz | ok | low | True | True | cpu_util < 10.0 during 1 x 60s | None | +--------------------------------------+-------------------------------------+-------------------+----------+---------+------------+--------------------------------+------------------+
1.2.1. インスタンスのオートスケールのテスト
Orchestration は、cpu_alarm_high の閾値に基づいて、インスタンスをオートスケールします。CPU の使用率が 50% を超えると、インスタンスは cpu_alarm_high 定義の threshold: 50 の設定通りにスケールアップされます。
CPU の負荷を生成するには、インスタンスにログインして、dd コマンドを実行します。
$ ssh -i admin.pem cirros@192.168.122.232
$ dd if=/dev/zero of=/dev/null &
$ dd if=/dev/zero of=/dev/null &
$ dd if=/dev/zero of=/dev/null &
dd コマンドを実行した後には、cirros インスタンスの CPU 使用率が 100% となることが予想されます。60 秒後には、Orchestration がグループをオートスケールして、インスタンスが 2 つになっていることを確認できるはずです。
# nova list
+--------------------------------------+-------------------------------------------------------+--------+------------+-------------+--------------------------------------+
| ID                                   | Name                                                  | Status | Task State | Power State | Networks                             |
+--------------------------------------+-------------------------------------------------------+--------+------------+-------------+--------------------------------------+
| 3f627c84-06aa-4782-8c12-29409964cc73 | ex-qeki-3azno6me5gvm-pqmr5zd6kuhm-server-gieck7uoyrwc | ACTIVE | -          | Running     | private=10.10.1.156, 192.168.122.234 |
| 0f69dfbe-4654-474f-9308-1b64de3f5c18 | ex-qeki-qmvor5rkptj7-krq7i66h6n7b-server-b4pk3dzjvbpi | ACTIVE | -          | Running     | private=10.10.1.157, 192.168.122.235 |
+--------------------------------------+-------------------------------------------------------+--------+------------+-------------+--------------------------------------+
その後さらに 60 秒経過すると、Orchestration が再度オートスケールを実行してインスタンスが 3 つになっていることを確認できます。この設定の最大値は 3 なので、その値を上回る数にはスケールされません (scaleup_group 定義の max_size の設定通り)。
# nova list
+--------------------------------------+-------------------------------------------------------+--------+------------+-------------+--------------------------------------+
| ID                                   | Name                                                  | Status | Task State | Power State | Networks                             |
+--------------------------------------+-------------------------------------------------------+--------+------------+-------------+--------------------------------------+
| 3f627c84-06aa-4782-8c12-29409964cc73 | ex-qeki-3azno6me5gvm-pqmr5zd6kuhm-server-gieck7uoyrwc | ACTIVE | -          | Running     | private=10.10.1.156, 192.168.122.234 |
| 0e805e75-aa6f-4375-b057-2c173b68f172 | ex-qeki-gajdwmu2cgm2-vckf4g2gpwis-server-r3smbhtqij76 | ACTIVE | -          | Running     | private=10.10.1.158, 192.168.122.236 |
| 0f69dfbe-4654-474f-9308-1b64de3f5c18 | ex-qeki-qmvor5rkptj7-krq7i66h6n7b-server-b4pk3dzjvbpi | ACTIVE | -          | Running     | private=10.10.1.157, 192.168.122.235 |
+--------------------------------------+-------------------------------------------------------+--------+------------+-------------+--------------------------------------+
1.2.2. インスタンスの自動スケールダウン
Orchestration は、cpu_alarm_low の閾値に基づいて、インスタンスを自動でスケールダウンします。以下の例では、CPU の使用率が 10% 未満になると、インスタンスがスケールダウンされます。実行中の dd プロセスを終了して、Orchestration がインスタンスをスケールダウンするのを確認します。
dd プロセスを停止すると、cpu_alarm_low event がトリガーされて、Orchestration が自動的にスケールダウンして、インスタンスを削除します。
# ceilometer alarm-list
+--------------------------------------+-------------------------------------+-------+----------+---------+------------+--------------------------------+------------------+
| Alarm ID                             | Name                                | State | Severity | Enabled | Continuous | Alarm condition                | Time constraints |
+--------------------------------------+-------------------------------------+-------+----------+---------+------------+--------------------------------+------------------+
| 04b4f845-f5b6-4c5a-8af0-59e03c22e6fa | example-cpu_alarm_high-rd5kysmlahvx | ok    | low      | True    | True       | cpu_util > 50.0 during 1 x 60s | None             |
| ac81cd81-20b3-45f9-bea4-e51f00499602 | example-cpu_alarm_low-6t65kswutupz  | alarm | low      | True    | True       | cpu_util < 10.0 during 1 x 60s | None             |
+--------------------------------------+-------------------------------------+-------+----------+---------+------------+--------------------------------+------------------+
数分後には、scaleup_group の min_size: 1 で許可されている最小のインスタンス数である 1 台のインスタンスに戻ることを予想することができます。
1.3. 例: アプリケーションのオートスケール
前述した機能をアプリケーションのスケールアップにも使用することができます。たとえば、同時に実行されている複数のインスタンスの 1 つでサービスを提供する動的な Web ページなどがあります。このような場合には、neutron で Load Balancing-as-a-Service を提供するように設定して、インスタンス間でトラフィックが均等に分散されるようにすることができます。
以下の例では、Orchestration が再び Telemetry データを検証して、高い CPU 使用率が検出されるとインスタンス数を増やし、指定した値よりも低い値の CPU 使用率が返されるとインスタンス数を減らします。
load-balancer 環境のプロパティーを記述したテンプレートを作成します。
/etc/heat/templates/lb-env.yamlに以下の値を入力します。heat_template_version: 2014-10-16 description: A load-balancer server parameters: image: type: string description: Image used for servers key_name: type: string description: SSH key to connect to the servers flavor: type: string description: flavor used by the servers pool_id: type: string description: Pool to contact user_data: type: string description: Server user_data metadata: type: json network: type: string description: Network used by the server resources: server: type: OS::Nova::Server properties: flavor: {get_param: flavor} image: {get_param: image} key_name: {get_param: key_name} metadata: {get_param: metadata} user_data: {get_param: user_data} networks: - port: { get_resource: port } member: type: OS::Neutron::PoolMember properties: pool_id: {get_param: pool_id} address: {get_attr: [server, first_address]} protocol_port: 80 port: type: OS::Neutron::Port properties: network: {get_param: network} security_groups: - base outputs: server_ip: description: IP Address of the load-balanced server. value: { get_attr: [server, first_address] } lb_member: description: LB member details. value: { get_attr: [member, show] }Web アプリケーションを実行するインスタンス用に別のテンプレートを作成します。以下のテンプレートは、ロードバランサーを作成して、既存のネットワークを使用します。パラメーターは環境に応じて必ず変更し、
/root/lb-webserver-rhel7.yamlのようなファイルにテンプレートを保存してください。heat_template_version: 2014-10-16 description: AutoScaling RHEL 7 Web Application parameters: image: type: string description: Image used for servers default: RHEL 7 key_name: type: string description: SSH key to connect to the servers default: admin flavor: type: string description: flavor used by the web servers default: m2.tiny network: type: string description: Network used by the server default: private subnet_id: type: string description: subnet on which the load balancer will be located default: 9daa6b7d-e647-482a-b387-dd5f855b88ef external_network_id: type: string description: UUID of a Neutron external network default: db17c885-77fa-45e8-8647-dbb132517960 resources: webserver: type: OS::Heat::AutoScalingGroup properties: min_size: 1 max_size: 3 cooldown: 60 desired_capacity: 1 resource: type: file:///etc/heat/templates/lb-env.yaml properties: flavor: {get_param: flavor} image: {get_param: image} key_name: {get_param: key_name} network: {get_param: network} pool_id: {get_resource: pool} metadata: {"metering.stack": {get_param: "OS::stack_id"}} user_data: str_replace: template: | #!/bin/bash -v yum -y install httpd php systemctl enable httpd systemctl start httpd cat <<EOF > /var/www/html/hostname.php <?php echo "Hello, My name is " . php_uname('n'); ?> EOF params: hostip: 192.168.122.70 fqdn: sat6.example.com shortname: sat6 web_server_scaleup_policy: type: OS::Heat::ScalingPolicy properties: adjustment_type: change_in_capacity auto_scaling_group_id: {get_resource: webserver} cooldown: 60 scaling_adjustment: 1 web_server_scaledown_policy: type: OS::Heat::ScalingPolicy properties: adjustment_type: change_in_capacity auto_scaling_group_id: {get_resource: webserver} cooldown: 60 scaling_adjustment: -1 cpu_alarm_high: type: OS::Ceilometer::Alarm properties: description: Scale-up if the average CPU > 95% for 1 minute meter_name: cpu_util statistic: avg period: 60 evaluation_periods: 1 threshold: 95 alarm_actions: - {get_attr: [web_server_scaleup_policy, alarm_url]} matching_metadata: {'metadata.user_metadata.stack': {get_param: "OS::stack_id"}} comparison_operator: gt cpu_alarm_low: type: OS::Ceilometer::Alarm properties: description: Scale-down if the average CPU < 15% for 1 minute meter_name: cpu_util statistic: avg period: 60 evaluation_periods: 1 threshold: 15 alarm_actions: - {get_attr: [web_server_scaledown_policy, alarm_url]} matching_metadata: {'metadata.user_metadata.stack': {get_param: "OS::stack_id"}} comparison_operator: lt monitor: type: OS::Neutron::HealthMonitor properties: type: TCP delay: 5 max_retries: 5 timeout: 5 pool: type: OS::Neutron::Pool properties: protocol: HTTP monitors: [{get_resource: monitor}] subnet_id: {get_param: subnet_id} lb_method: ROUND_ROBIN vip: protocol_port: 80 lb: type: OS::Neutron::LoadBalancer properties: protocol_port: 80 pool_id: {get_resource: pool} lb_floating: type: OS::Neutron::FloatingIP properties: floating_network_id: {get_param: external_network_id} port_id: {get_attr: [pool, vip, port_id]} outputs: scale_up_url: description: > This URL is the webhook to scale up the autoscaling group. You can invoke the scale-up operation by doing an HTTP POST to this URL; no body nor extra headers are needed. value: {get_attr: [web_server_scaleup_policy, alarm_url]} scale_dn_url: description: > This URL is the webhook to scale down the autoscaling group. You can invoke the scale-down operation by doing an HTTP POST to this URL; no body nor extra headers are needed. value: {get_attr: [web_server_scaledown_policy, alarm_url]} pool_ip_address: value: {get_attr: [pool, vip, address]} description: The IP address of the load balancing pool website_url: value: str_replace: template: http://serviceip/hostname.php params: serviceip: { get_attr: [lb_floating, floating_ip_address] } description: > This URL is the "external" URL that can be used to access the website. ceilometer_query: value: str_replace: template: > ceilometer statistics -m cpu_util -q metadata.user_metadata.stack=stackval -p 60 -a avg params: stackval: { get_param: "OS::stack_id" } description: > This is a Ceilometer query for statistics on the cpu_util meter Samples about OS::Nova::Server instances in this stack. The -q parameter selects Samples according to the subject's metadata. When a VM's metadata includes an item of the form metering.X=Y, the corresponding Ceilometer resource has a metadata item of the form user_metadata.X=Y and samples about resources so tagged can be queried with a Ceilometer query term of the form metadata.user_metadata.X=Y. In this case the nested stacks give their VMs metadata that is passed as a nested stack parameter, and this stack passes a metadata of the form metering.stack=Y, where Y is this stack's ID.Telemetry のデータ収集の間隔を更新します。デフォルトでは、Telemetry はインスタンスを 10 分ごとにポーリングして、CPU のデータを取得します。以下の例では、
/etc/ceilometer/pipeline.yamlで、この間隔を 60 秒に変更します。- name: cpu_source interval: 60 meters: - "cpu" sinks: - cpu_sink
注記ポーリングの頻度を高くすると、コントロールプレーンに対する負荷が高くなるため、実稼働環境では、60 秒に設定することは、お勧めできません。
OpenStack のサービスをすべて再起動して、更新された Telemetry の設定を適用します。
# openstack-service restart
注記このステップを実行すると、OpenStack デプロイメントは短時間停止します。
Orchestration のスクリプトを実行します。このスクリプトにより、環境が構築され、テンプレートを使用してインスタンスがデプロイされます。
# heat stack-create webfarm -f /root/lb-webserver-rhel7.yaml
/root/lb-webserver-rhel7.yamlの箇所は、実際のパスとファイル名に変更してください。
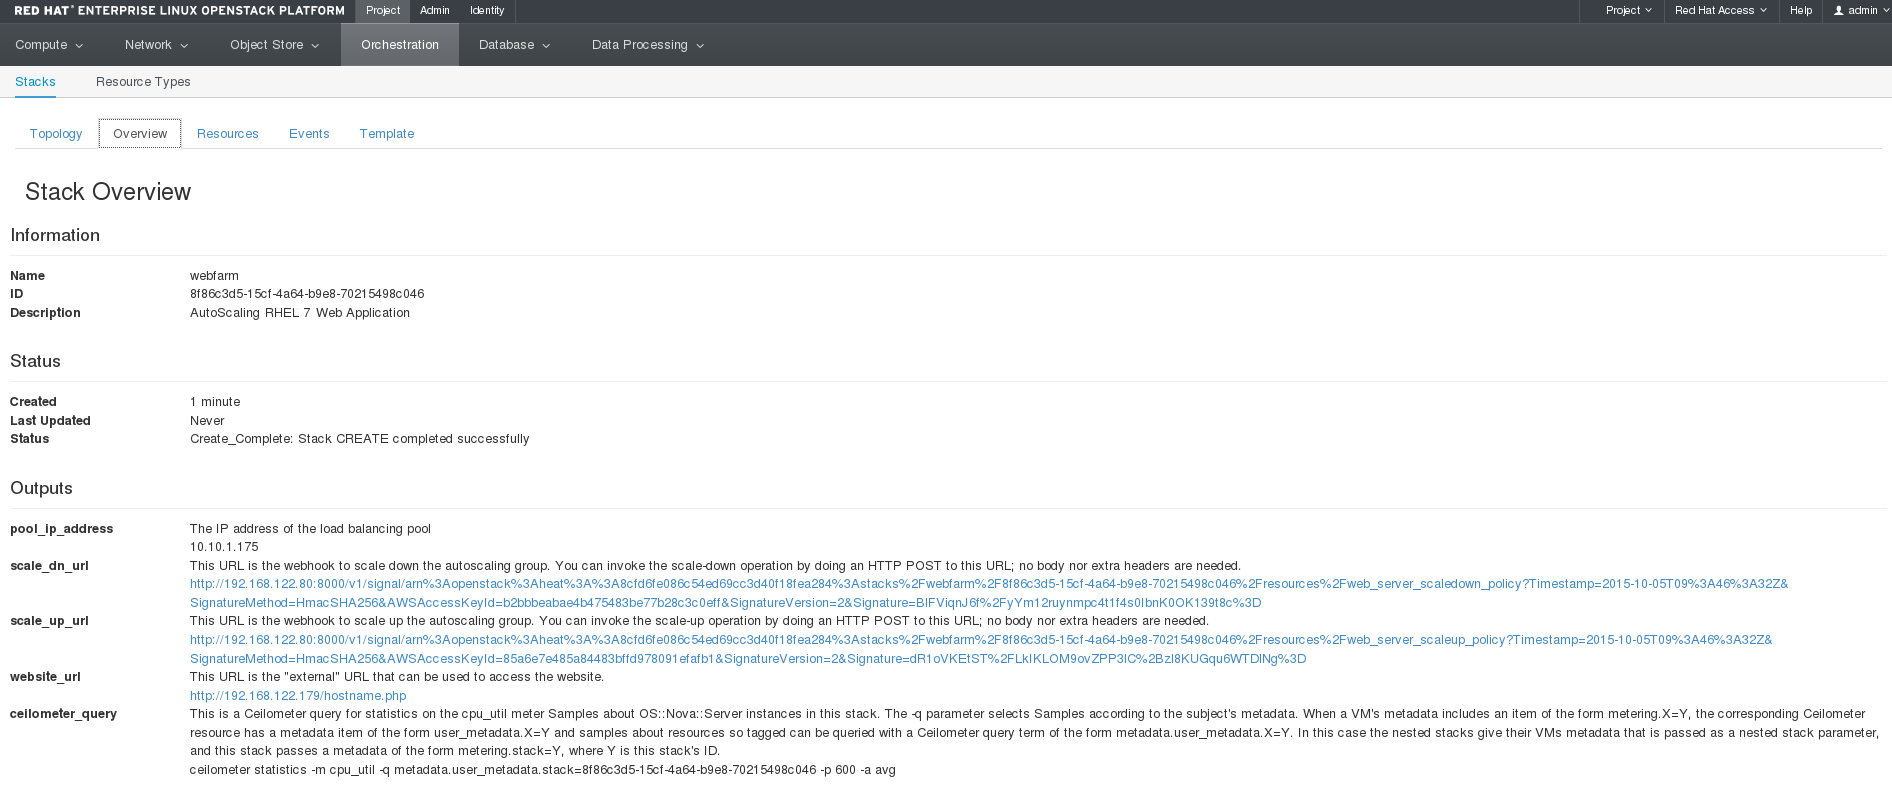
Dashboard の オーケストレーション → スタック → Webfarm で、スタックの作成をモニタリングすることができます。スタックの作成が完了すると、複数の役立つ情報が表示されます。特に以下の情報を確認してください。
- 手動のスケールアップまたはスケールダウンイベントをトリガーするのに使用することができる URL
- Floating IP アドレス。Web サイトの IP アドレスです。
- スタック全体の CPU 負荷を表示するための Telemetry コマンド。スケーリングが想定通りに機能しているかどうかを確認するのに使用することができます。
Dashboard のページは以下のように表示されます。
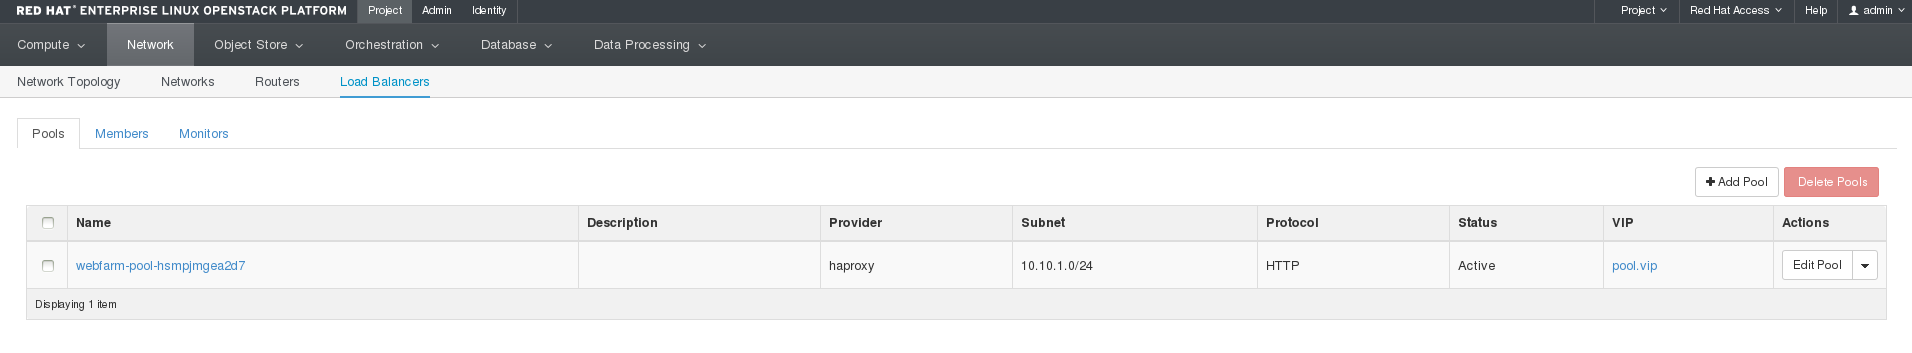
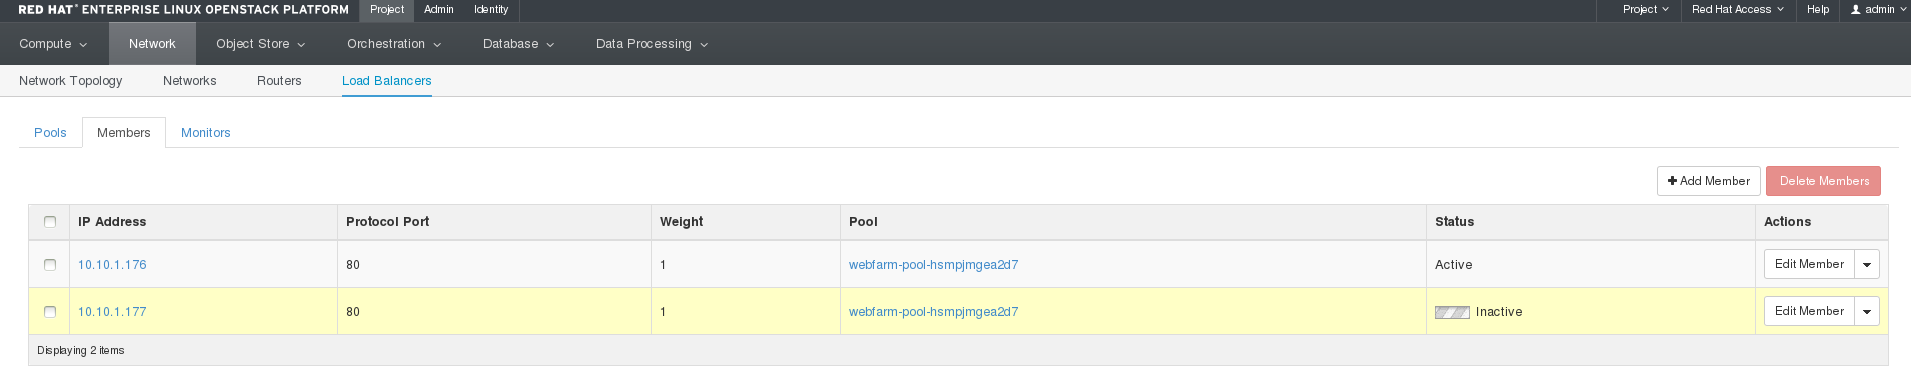
ネットワーク → ロードバランサー を開いて、ロードバランサーを確認します。
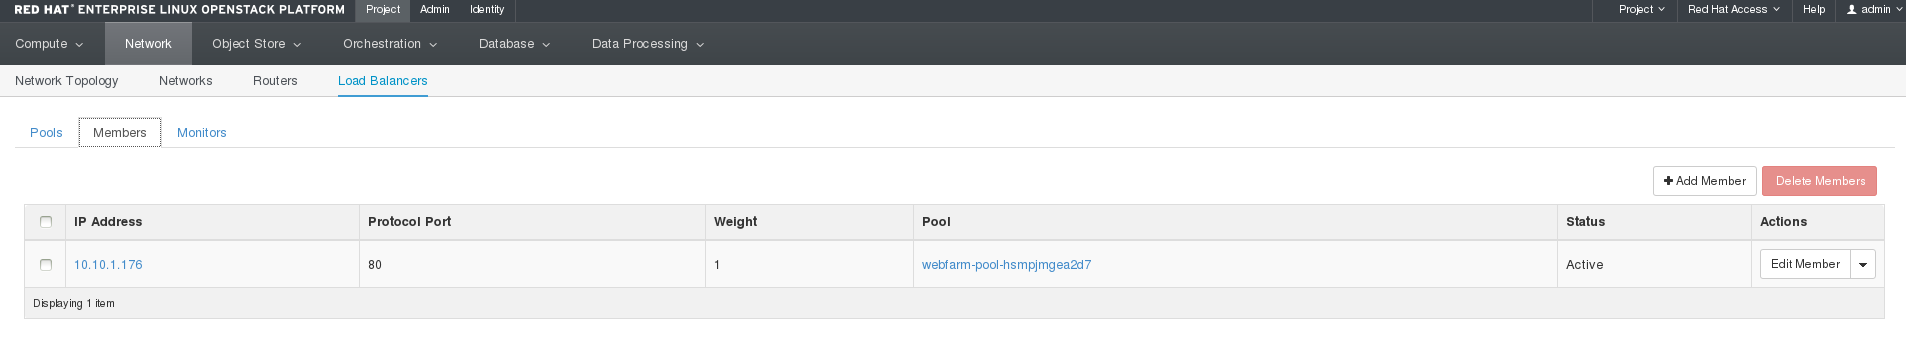
メンバー をクリックします。このページには、ロードバランシングプールのメンバーが表示されます。これらのインスタンスに対して、Web サイトのトラフィックを分散することができます。対応するインスタンスが作成されて、Apache がインストール/設定されるまで、メンバーのステータスは Active にはならない点に注意してください。
Web サーバーの起動時には、インスタンスはロードバランサーのアクティブなメンバーとして表示されます。
http://IP/hostname.php の Web アプリケーションにアクセスできるようになりました。以下のような出力が表示されるはずです。
Hello, My name is we-zrwm-t4ezkpx34gxu-qbg5d7dqbc4j-server-mzdvigk2jugl
Telemetry コマンドを実行して、Dashboard のスタックの概要ページに CPU パフォーマンスデータを表示できるようになりました。以下の例のようなコマンドを実行します。
# ceilometer statistics -m cpu_util -q metadata.user_metadata.stack=8f86c3d5-15cf-4a64-b9e8-70215498c046 -p 60 -a avg
1.3.1. アプリケーションのオートスケールのテスト
アプリケーションのスケーリングを手動でトリガーするには、Dashboard のスタックの概要の画面に表示される REST scale-up URL を使用するか、始めにデプロイしたインスタンス上で resource-intensive コマンドを実行して負荷を生成します。
REST API を使用するには、REST Easy という Firefox アドオン や
curlなど、HTTP POST要求を実行できるツールが必要です。REST Easy を使用する場合には、scale-up URL をコピーしてフォームにペーストします。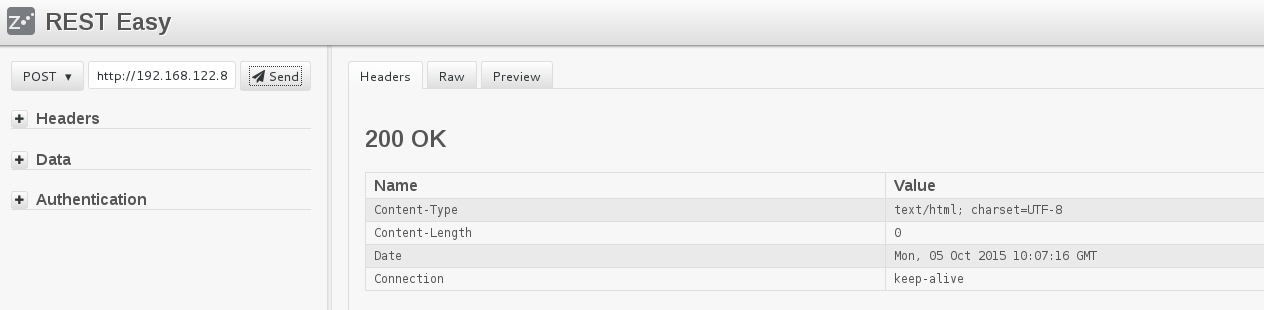
curlを使用する場合には、コマンドラインで URL をパラメーターとして渡します。$ curl -X POST "scale-up URL"負荷を人為的に生成するには、Floating IP をインスタンスに割り当てて、SSH でログインし、CPU の使用率を高くするコマンドを実行して、CPU をビジー状態にします。以下に例を示します。
$ dd if=/dev/zero of=/dev/null &
重要topコマンドなどを使用して、CPU 使用率が 95% 以上かどうかを確認します。CPU 使用率が十分に高くない場合には、ddコマンドを複数回並行して実行するか、他の方法を使用して CPU をビジー状態にしてください。
次回に Telemetry が CPU データをスタックから収集すると、スケールアップイベントがトリガーされ、オーケストレーション → スタック → Webfarm → イベント に表示されます。新規 Web サーバーインスタンスが作成され、ロードバランサーに追加されます。この操作が終了すると、インスタンスがアクティブになり、Web サイトの URL はロードバランサーを介して、スタック内の両方のインスタンスにルーティングされます。
インスタンスを初期化し、Apache をインストール/設定してからアプリケーションをデプロイする必要があるため、作成には数分かかる場合があります。この操作は、HAProxy によってモニタリングされ、ステータスが Active に切り替わる前に、Web サイトがインスタンス上で使用可能であることが確認されます。
新規インスタンスの作成中に、Dashboard では、ロードバランシングプールのメンバーが以下のように表示されます。
追加のインスタンスを作成するかどうかを決定する際には、heat スタック内のインスタンスの CPU 使用率の平均が考慮されます。2 番目のインスタンスは通常の CPU 使用率である可能性が最も高いので、1 番目のインスタンスの負荷が相殺されますが、2 番目のインスタンスもビジー状態となり、1 番目と 2 番目のインスタンスの CPU 使用率が 95% を超えると、もう 1 つ (3 番目) のインスタンスが作成されます。
1.3.2. アプリケーションの自動スケールダウン
この手順は、「インスタンスの自動スケールダウン」と同様に、スタック CPU 使用率の平均が、事前定義された値 (「アプリケーションのオートスケールのテスト」に記載の例では、15%) を下回ると、スケールダウンポリシーがトリガーされます。また、インスタンスがこの方法でスタックから削除された場合には、ロードバランサーからも自動的に削除され、Web サイトのトラフィックは、残りのインスタンス間で分散されます。