
チューニングガイド
RHEL for Real Time でのレイテンシーを最適化する高度なチューニング手順
概要
前書き
第1章 Red Hat Enterprise Linux for Real Time システムのチューニングを開始する前に
Red Hat Enterprise Linux for Real Time カーネルの調整を行うに当たり重要なこと
- お待ちください。リアルタイムチューニングは反復的なプロセスで、いくつかの変数を微調整することはあまりできず、変更が最適であることに気がつくことはありません。システムに最適なチューニングセットを絞り込むためには、数日または数週間かかると思ってください。また、常に長いテストを実行します。チューニングパラメーターの一部を変更してから 5 分のテストの実行は、チューニングのセットの検証に適していません。テストの長さを調整可能にし、数分以上実行してください。テストが数時間実行した複数の異なるチューニングセットに絞り込みを試み、一度に数時間または数日間これらのセットを実行して、最大レイテンシーまたはリソース消費の隅をキャッチします。
- 正確にお願いします。アプリケーションに測定メカニズムを構築し、特定のチューニング変更がどのようにアプリケーションのパフォーマンスに与える影響を正確に測定できるようにします。「マウスの方がスムーズに移動する」という内容は正しくないことがほとんどで、人によって異なります。ハード測定を行い、後で分析するためにそれらを記録します。
- 順序だった手順を心がけるテストの実行間で変数のチューニングに複数の変更を加えがちです。ただし、これを実行することは、テスト結果に影響を及ぼすチューニングを絞り込むことができないことを意味します。テスト間のチューニング変更は、可能な限り小さく実行されるようにします。
- 保守的にまた、チューニング時に大きな変更を行うことを希望していますが、ほとんどの場合、増分変更を行う方が適切です。優先度の値が最小値から最大値に達すると、長期的に考えて結果がよくなることがわかります。
- 賢く利用可能なツールを使用します。Tuna グラフィカルチューニングツールを使用すると、スレッドと割り込み、スレッドの優先度、アプリケーションが使用するプロセッサーを分離できるプロセッサーを簡単に変更できます。
tasksetおよびchrtコマンドラインユーティリティーを使用すると、Tuna の機能のほとんどを行えます。パフォーマンスの問題が発生した場合、ftraceおよびperfユーティリティーはレイテンシーの問題の特定に役立ちます。 - 柔軟性にアプリケーションで値をハードコーディングするのではなく、外部ツールを使用してポリシー、優先度、アフィニティーを変更します。これにより、さまざまな組み合わせを試し、論理を簡素化できます。適切な結果を提供する設定が見つかったら、アプリケーションをアプリケーションに追加したり、アプリケーションの起動時に設定を実装する起動ロジックを設定できます。
Linux では、以下の 3 つの主要なスケジューリングポリシーが使用されます。
SCHED_OTHER(時折SCHED_NORMALと呼ばれる)- これはデフォルトのスレッドポリシーで、カーネルが制御する動的な優先度を持ちます。優先度はスレッドアクティビティーに基づいて変更されます。このポリシーを持つスレッドは、リアルタイム優先度が 0 と見なされます。
SCHED_FIFO(先入先出法)- 優先度が 1 から 99 までのリアルタイムポリシーでは、1 が最低でから 99 が最高になります。
SCHED_FIFOスレッドは常にSCHED_OTHERスレッドよりも優先度が高くなります (たとえば、1の優先度が 1 のSCHED_FIFOスレッドの場合は、任意のSCHED_OTHERスレッドよりも優先度が高くなります)。SCHED_FIFOスレッドとして作成されたスレッドの優先度は固定され、優先度の高いスレッドによってブロックまたはプリエンプションされるまで実行されます。 SCHED_RRラウンドロビン (Round-Robin)SCHED_RRはSCHED_FIFOの変更です。同じ優先度のスレッド、同じ優先度SCHED_RRスレッド間でスケジュールされるラウンドロビンです。このポリシーはほとんど使用されません。
1.1. レイテンシーテストの実行および結果を解釈
1.1.1. 主なステップ
手順1.1 システムをテストし、結果を解釈するには、以下を行います。
- 低レイテンシー操作に必要なチューニング手順については、ベンダーのドキュメントを参照してください。この手順は、システムを System Management Mode (SMM) に変換する System Management Interrupts を減らしたり、削除したりします。システムが SMM を使用している場合は、ファームウェアが実行されており、オペレーティングシステムコードを実行していません。つまり、SMM 内で期限切れになるタイマーは、システムが通常の動作に移行するまで待機する必要があります。これにより、SMI が Linux によってブロックされず、実際に SMI を実行したことがベンダー固有のパフォーマンスカウンターレジスターで確認されるため、説明できないレイテンシーが発生する可能性があります。
警告
ハードウェア障害が発生する可能性があるため、Red Hat は SMI を完全に無効にしないことを強く推奨します。 - RHEL-RT および
rt-testsパッケージがインストールされていることを確認します。この手順では、システムを適切に調整したことを確認します。 hwlatdetectプログラムを実行します。hwlatdetectクロックソースをポーリングして説明のないギャップを探して、ハードウェアが生成したレイテンシーを探します。プログラムは、ハードウェアアーキテクチャーまたは BIOS/EFI ファームウェアにより生じるレイテンシーを探すため、通常、hwlatdetectの実行中にシステムで負荷を実行する必要はありません。hwlatdetectの通常の出力は以下のようになります。#hwlatdetect --duration=60s hwlatdetect: test duration 60 seconds detector: tracer parameters: Latency threshold: 10us Sample window: 1000000us Sample width: 500000us Non-sampling period: 500000us Output File: None Starting test test finished Max Latency: Below threshold Samples recorded: 0 Samples exceeding threshold: 0上記の結果は、ファームウェアからのシステム中断を最小限に抑えるために調整されたシステムです。ただし、以下に示すように、システム中断を最小限に抑えるためにすべてのシステムを調整することはできません。#hwlatdetect --duration=10s hwlatdetect: test duration 10 seconds detector: tracer parameters: Latency threshold: 10us Sample window: 1000000us Sample width: 500000us Non-sampling period: 500000us Output File: None Starting test test finished Max Latency: 18us Samples recorded: 10 Samples exceeding threshold: 10 SMIs during run: 0 ts: 1519674281.220664736, inner:17, outer:15 ts: 1519674282.721666674, inner:18, outer:17 ts: 1519674283.722667966, inner:16, outer:17 ts: 1519674284.723669259, inner:17, outer:18 ts: 1519674285.724670551, inner:16, outer:17 ts: 1519674286.725671843, inner:17, outer:17 ts: 1519674287.726673136, inner:17, outer:16 ts: 1519674288.727674428, inner:16, outer:18 ts: 1519674289.728675721, inner:17, outer:17 ts: 1519674290.729677013, inner:18, outer:17上記の結果はclocksource、システムの読み取りの連続中に 15-18 us の範囲で表示される遅延が 10 個あることを表しています。hwlatdetectは、tracerメカニズムをdetectorとして説明していない遅延の場合に使用していました。以前のバージョンの場合は、ftrace tracerではなくカーネルモジュールを使用していました。parametersは、レイテンシーと検出の実行方法を報告します。デフォルトのレイテンシーしきい値は 10 マイクロ秒 (10 ミリ秒) で、サンプルウィンドウは 1 秒で、サンプリングウィンドウは 0.5 秒でした。そのため、tracerは、指定した期間の各秒の半分で実行されるdetectorスレッドを実行しました。detectorスレッドは、以下の擬似コードを実行するループを実行します。t1 = timestamp() loop: t0 = timestamp() if (t0 - t1) > threshold outer = (t0 - t1) t1 = timestamp if (t1 - t0) > threshold inner = (t1 - t0) if inner or outer: print if t1 > duration: goto out goto loop out:
内部ループ比較は、t0 - t1が指定したしきい値 (10 us デフォルト) を超えないことを確認します。外部のループ比較では、ループの下部と上位のt1 - t0間の時間をチェックします。タイムスタンプレジスタの連続する読み取りの時間は、数十ナノ秒 (通常はレジスター読み取り、比較ジャンプ、条件付きジャンプ) である必要があります。したがって、連続する読み取り間の他の遅延がファームウェアによって導入されるか、システムコンポーネントの接続方法により行われます。注記
innerおよびouterのhwlatdetectorによって用に出力される値は、最善のケースで最大レイテンシーになります。レイテンシーの値は、現在のシステムclocksourceの連続する読み取り (通常はTime Stamp CounterまたはTSCレジスターですが、HPETまたはACPI電源管理クロックの可能性もあります) と、ハードウェアとファームウェアの組み合わせにより生じる連続する読み取り間の遅延の間の差分です。
1.1.2. 負荷によるシステムのリアルタイムパフォーマンスのテスト
rteval ユーティリティーを提供します。rteval は、システムが高負荷の SCHED_OTHER で始まり、オンライン CPU ごとにリアルタイムの応答が測定されます。負荷は、ループと hackbench 合成ベンチマークにおける Linux カーネルツリーの並行 make です。
rteval は、cyclictest 測定プログラムを起動します。このプログラムは、オンラインコアごとに SCHED_FIFO リアルタイムスレッドを開始し、リアルタイムスケジューリングの応答時間を測定します。各測定スレッドはタイムスタンプを取り、間隔でスリープした後、ウェイク後に別のタイムスタンプを取ります。測定されたレイテンシーは、t1 - (t0 + i) です。これは、実際のウェイクアップ時間 t1、最初のタイムスタンプ t0 の理論的なウェイクアップ時間、そしてスリープ間隔 i の相違点です。
rteval 実行の詳細は、システムの起動ログとともに XML ファイルに書き込まれます。次に、rteval-<date>-N.tar.bz2 ファイルが生成されます。N は <date> における第 N 番目の実行のカウンターです。以下と同様、XML ファイルから生成されたレポートが画面に出力されます。
System:
Statistics:
	Samples:           1440463955
	Mean:              4.40624790712us
	Median:            0.0us
	Mode:              4us
	Range:             54us
	Min:               2us
	Max:               56us
	Mean Absolute Dev: 1.0776661507us
	Std.dev:           1.81821060672us

CPU core 0       Priority: 95
Statistics:
	Samples:           36011847
	Mean:              5.46434910711us
	Median:            4us
	Mode:              4us
	Range:             38us
	Min:               2us
	Max:               40us
	Mean Absolute Dev: 2.13785341159us
	Std.dev:           3.50155558554us
# rteval --summarize rteval-<date>-n.tar.bz2第2章 一般的なシステムチューニング
2.1. Tuna インターフェースの使用
2.2. 永続的なチューニングパラメーターの設定
手順2.1 /etc/sysctl.conf ファイルの編集
/proc/sys/ で始まるパラメーターを /etc/sysctl.conf ファイルに含めると、パラメーターが永続化されます。
- 選択したテキストエディターで
/etc/sysctl.confファイルを開きます。 - コマンドから
/proc/sys/プレフィックスを削除し、中央の/文字を.文字に置き換えます。たとえば、コマンドecho 0 > /proc/sys/kernel/hung_task_panicはkernel.hung_task_panicになります。 - 必要なパラメーターで新規エントリーを
/etc/sysctl.confファイルに挿入します。# Enable gettimeofday(2) kernel.hung_task_panic = 0
# sysctl -pを実行して、新しい設定で更新します。~]#
sysctl -p...[output truncated]... kernel.hung_task_panic = 0
手順2.2 /etc/rc.d/rc.local ファイルの編集
警告
/etc/rc.d/rc.local メカニズムは、実稼働環境の起動コードには使用しないでください。SysV Init の起動スクリプトの保持日であり、systemd サービスにより実行されます。順序や依存関係を制御する方法がないため、起動コードのテストにのみ使用してください。
- 手順2.1「
/etc/sysctl.confファイルの編集」 の手順に従ってコマンドを調整します。 - 必要なパラメーターで新規エントリーを
/etc/rc.d/rc.localファイルに挿入します。
2.3. BIOS パラメーターの設定
- 電源管理
- システムクロックの周波数を変更したり、CPU をさまざまなスリープ状態にすることで電力を節約しようとすることは、システムが外部イベントに応答する速度に影響を与える可能性があります。最適な応答時間は、BIOS の電源管理オプションを無効にします。
- エラー検出および修正 (EDAC) 単位
- EDAC ユニットは、Error Correcting Code (ECC) メモリーからシグナルされたエラーを検出して修正するために使用されるデバイスです。通常、EDAC オプションは、ECC チェックなしから、エラーに関するすべてのメモリーノードの定期的なスキャンまであります。EDAC レベルが高いほど、BIOS にかかる時間が長くなり、イベント期限が切れる可能性が高くなります。可能な場合は、EDAC をオフにします。それ以外の場合は、最低の機能レベルに切り替えます。
- System Management Interrupts (SMI)
- SMI は、ハードウェアベンダーによって使用される機能で、システムが正しく動作していることを確認します。SMI 割り込みは通常、実行中のオペレーティングシステムではなく、BIOS のコードにより処理されます。SMI は通常、温度管理、リモートコンソール管理(IPMI)、EDAC チェック、およびその他のハウスキーピングタスクに使用されます。BIOS に SMI オプションが含まれている場合は、ベンダーと関連ドキュメントを確認して、どの程度無効にしても安全なかを確認してください。
警告
SMI を完全に無効にすることは可能ですが、これを行う必要がないことが強く推奨されます。SMI の生成およびサービス機能を削除すると、ハードウェアに致命的な障害が発生する可能性があります。
2.4. 割り込みおよびプロセスバインディング
重要
00000000000000000000000000000001、10 進数 として 1、および 16 進数として 0x00000001 となります。CPU 0 と 1 の両方の CPU マスクは、ビットマスクとして 00000000000000000000000000000011、10 進数として 3、16 進数として 0x00000003 となります。
手順2.3 irqbalance デーモンの無効化
irqbalance デーモンは必要ありません。
irqbalanceデーモンのステータスを確認します。~]#
systemctl status irqbalanceirqbalance.service - irqbalance daemon Loaded: loaded (/usr/lib/systemd/system/irqbalance.service; enabled) Active: active (running) …irqbalanceデーモンが実行している場合は停止します。~]#
systemctl stop irqbalance- システムの起動時に
irqbalanceが再起動しないことを確認します。~]#
systemctl disable irqbalance
手順2.4 IRQ バランスからの CPU の除外
/etc/sysconfig/irqbalance 設定ファイルには、ISRQ balacing サービスによって CPU を考慮から除外できる設定が含まれています。このパラメーターには IRQBALANCE_BANNED_CPUS という名前が付けられ、64 ビットの 16 進数ビットマスクです。マスクの各ビットは CPU コアを表します。
- 希望するテキストエディターで
/etc/sysconfig/irqbalanceを開き、IRQBALANCE_BANNED_CPUSというタイトルが付いたファイルのセクションを見つけます。# IRQBALANCE_BANNED_CPUS # 64 bit bitmask which allows you to indicate which cpu's should # be skipped when reblancing irqs. Cpu numbers which have their # corresponding bits set to one in this mask will not have any # irq's assigned to them on rebalance # #IRQBALANCE_BANNED_CPUS=
- この方法で変数
IRQBALANCE_BANNED_CPUSのコメントを解除し、その値を設定して CPU 8 から 15 を除外します。IRQBALANCE_BANNED_CPUS=0000ff00
- これにより、
irqbalanceプロセスはビットマスクでビットが設定された CPU を無視します。この場合、ビットは 8 ~ 15 になります。 - 最大 64 個の CPU コアを持つシステムを実行している場合は、それぞれ 8 桁の 16 進数の数値をコンマで区切ります。
IRQBALANCE_BANNED_CPUS=00000001,0000ff00
上記のマスクは、CPU 8 から 15、および CPU 33 を IRQ バランシングから除外します。
注記
irqbalance ツールは、IRQBALANCE_BANNED_CPUS が /etc/sysconfig/irqbalance ファイルに設定されていない場合に isolcpus= カーネルパラメーターを介して分離された CPU コア上の IRQ を自動的に回避します。
手順2.5 個々の IRQ への CPU アフィニティーの手動割り当て
/proc/interruptsファイルを参照して、各デバイスが使用している IRQ を確認します。~]#
cat /proc/interruptsこのファイルには IRQ の一覧が含まれています。各行には、ISRQ 番号、各 CPU で発生した割り込みの数と、その後に IRQ タイプと説明が表示されます。CPU0 CPU1 0: 26575949 11 IO-APIC-edge timer 1: 14 7 IO-APIC-edge i8042 ...[output truncated]...- IRQ が 1 つのプロセッサーでのみ実行されるように指示するには、
echoコマンドを使用して CPU マスク(16 進数)を特定の IRQ のsmp_affinityエントリーに書き込みます。この例では、IRQ 番号 142 の割り込みを CPU 0 でのみ実行するよう指示しています。~]#
echo 1 > /proc/irq/142/smp_affinity - この変更は、割り込みが発生した場合にのみ有効になります。設定をテストするには、ディスクアクティビティーを生成し、
/proc/interruptsファイルを変更して変更を確認します。割り込みが発生したと仮定すると、選択した CPU の割り込み数が増加し、他の CPU の番号が変更されていないことがわかります。
手順2.6 taskset ユーティリティーを使用してプロセスの CPU にバインド
taskset ユーティリティーは、タスクのプロセス ID (PID) を使用してアフィニティーを表示または設定します。または、選択した CPU アフィニティーでコマンドを起動するために使用できます。アフィニティーを設定するには taskset は、CPU マスクを 10 進数または 16 進数で表記する必要があります。マスクの引数は、コマンドまたは変更される PID に対してどの CPU コアが有効なかを指定するビットマスクです。
- 現在実行していないプロセスのアフィニティーを設定するには、
tasksetを使用して CPU マスクとプロセスを指定します。こので例は、my_embedded_processは、CPU 3 のみを使用するように指示されています (CPU マスクの 10 進数バージョンを使用)。~]#
taskset 8 /usr/local/bin/my_embedded_process - ビットマスクで複数の CPU を指定することもできます。この例では、
my_embedded_processは、プロセッサー 4、5、6、および 7 で実行するように指示されています (CPU マスクの 16 進数バージョンを使用)。~]#
taskset 0xF0 /usr/local/bin/my_embedded_process - さらに、
-p(--pid) オプションと CPU マスクと、変更するプロセスの PID を使用して、すでに実行しているプロセスの CPU アフィニティーを設定できます。この例では、PID が 7013 のプロセスは CPU 0 でのみ実行されるように指示されています。~]#
taskset -p 1 7013 - 最後に、
-cパラメーターを使用して、CPU マスクの代わりに CPU リストを指定できます。たとえば、CPU 0、4、CPU 7、および CPU 7 から 11 を使用するには、コマンドラインに-c 0,4,7-11が含まれます。ほとんどの場合、この呼び出しは便利です。
重要
詳細は、以下の man ページは本セクションに記載の情報に関連しています。
- chrt(1)
- taskset(1)
- nice(1)
- renice(1)
- Linux スケジューリングスキームの説明の sched_setscheduler(2)。
2.5. ファイルシステムの決定的ヒント
xfs というジャーナリングファイルシステムです。ext2 という、より前のファイルシステムでは、ジャーナリングは使用 されません。組織が特にジャーナリングを必要とする場合を除き、ext2 の使用を検討してください。ほとんどのベンチマーク結果の多くは、ext2 ファイルシステムを使用し、初期チューニングの推奨事項の 1 つを検討します。
atime) の xfs 記録のようなジャーナリングファイルシステム。ext2 の使用がお使いのシステムで最適ではない場合は、xfs で atime を無効にすることを検討してください。atime を無効にするとパフォーマンスが向上し、ファイルシステムジャーナルへの書き込み回数を制限することで電力使用量が減少します。
手順2.7 atime の無効化
- 選択したテキストエディターを使用して
/etc/fstabファイルを開き、ルートマウントポイントのエントリーを見つけます。/dev/mapper/rhel-root / xfs defaults…
- オプションセクションを編集して用語
noatimeおよびnodiratimeを含めます。noatimeは、ファイルの読み込み時にアクセスタイムスタンプが更新されないようにし、nodiratimeはディレクトリーの inode アクセス時間の更新を停止します。/dev/mapper/rhel-root / xfs noatime,nodiratime…
重要
アプリケーションによっては、更新に依存するatimeものもあります。したがって、このオプションは、このようなアプリケーションが使用されていないシステムでのみ妥当です。relatimeマウントオプションを使用するとで、アクセス時間が現在の変更時間よりも前のアクセス時間よりも古い場合にのみ更新されるようにできます。
詳細は、以下の man ページは本セクションに記載の情報に関連しています。
- mkfs.ext2(8)
- mkfs.xfs(8)
- mount(8):
atime、nodiratimeおよびnoatimeの情報
2.6. システムタイムスタンプでのハードウェアクロックの使用
/sys/devices/system/clocksource/clocksource0/available_clocksource ファイルを表示します。
~]# cat /sys/devices/system/clocksource/clocksource0/available_clocksource
tsc hpet acpi_pm
/sys/devices/system/clocksource/clocksource0/current_clocksource ファイルを読み取りて検査できます。
~]# cat /sys/devices/system/clocksource/clocksource0/current_clocksource
tsc
システムメインアプリケーションの最適なクロックは、クロックの既知の問題により使用されないことがあります。すべての問題のあるクロックを実行した後、システムはリアルタイムシステムの最低要件を満たすことができないハードウェアクロックで残すことができます。
/sys/devices/system/clocksource/clocksource0/available_clocksource ファイルに表示された一覧からクロックソースを選択し、クロック名を /sys/devices/system/clocksource/clocksource0/current_clocksource ファイルに書き込みます。たとえば、以下のコマンドは、使用中のクロックソースとして HPET を設定します。
~]# echo hpet > /sys/devices/system/clocksource/clocksource0/current_clocksource注記
すべてのシステムに理想的なシングルクロックはありませんが、一般的に TSC が優先されるクロックソースです。TSC クロックの信頼性を最適化するには、カーネルのブート時に追加のパラメーターを設定します。以下に例を示します。
idle=poll: アイドル状態にならないようにクロックを強制します。processor.max_cstate=1: クロックがより深い C 状態 (バックグラウンド保存モード) に入るのを防ぎ、同期が停止しないようにします。
最新のプロセッサーは、低からの省電力状態 (C-state) にアクティブに移行します。ただし、高い省電力状態から稼働状態に戻ると、リアルタイムアプリケーションで最適よりも多くの時間を消費できます。これらの移行を防ぐために、アプリケーションは Power Management Quality of Service (PM QoS) インターフェースを使用できます。
idle=poll および processor.max_cstate=1 パラメーターの動作をエミュレートできますが、省電力状態のより詳細な制御が可能です。
/dev/cpu_dma_latency ファイルを開くと、PM QoS インターフェースはプロセッサーが深いスリープ状態に入るのを防ぎ、終了すると予期せぬ遅延が生じます。ファイルが閉じられると、システムは省電力状態に戻ります。
/dev/cpu_dma_latencyファイルを開きます。ファイル記述子を低レイテンシー操作の期間中開いたままにします。- 32 ビットの数字を書き込みます。この数は、最大応答時間 (マイクロ秒単位) を表します。可能な限り早く応答時間を設定するには、
0を使用します。/dev/cpu_dma_latencyファイルの例を以下に示します。static int pm_qos_fd = -1; void start_low_latency(void) { s32_t target = 0; if (pm_qos_fd >= 0) return; pm_qos_fd = open("/dev/cpu_dma_latency", O_RDWR); if (pm_qos_fd < 0) { fprintf(stderr, "Failed to open PM QOS file: %s", strerror(errno)); exit(errno); } write(pm_qos_fd, &target, sizeof(target)); } void stop_low_latency(void) { if (pm_qos_fd >= 0) close(pm_qos_fd); }アプリケーションは、まずstart_low_latency()の呼び出しを行い、必要なレイテンシーを区別し、次にstop_low_latency()を呼び出します。
詳細情報や参照文書は、以下の文書が、このセクションの情報に関連しています。
- 『Linux System Programming』 by Robert Love
2.7. 追加のアプリケーションが実行されないようにする
- グラフィカルデスクトップ特にサーバーでは、必要のないグラフィックスは実行しないでください。システムがデフォルトで GUI で起動するように設定されているかどうかを確認するには、以下のコマンドを実行します。
~]#
systemctl get-defaultgraphical.target設定を見た場合は、システムがテキストモードで起動するように再設定します。~]#
systemctl set-default multi-user.target - メール転送エージェント (Sendmail、Postfix などの MTA)チューニングしているシステムで Sendmail をアクティブに使用している場合を除き、無効にしてください。必要な場合は、適切に調整されていることを確認するか、専用のマシンに移動することを検討してください。
重要
Sendmail は、cron などのプログラムで実行されるシステム生成メッセージを送信するために使用されます。これには、logwatch などのロギング関数によって生成されるレポートが含まれます。sendmail が無効になっていると、これらのメッセージは受信できなくなります。 - Remote Procedure Call (RPC)
- Network File System (NFS)
- マウスサービスGnome や KDE などのグラフィカルインターフェースを使用していない場合には、マウスも必要でない可能性があります。ハードウェアを削除し、
gpmをアンインストールします。 - 自動タスクパフォーマンスに影響を与える可能性がある自動
cronまたはatジョブの有無を確認します。
詳細は、以下の man ページは本セクションに記載の情報に関連しています。
- rpc(3)
- nfs(5)
- gpm(8)
2.8. メモリーのヒントのスワップと不足
ページをディスクにスワップアウトすると、どの環境でもレイテンシーが発生する可能性があります。レイテンシーを低くするには、システムに十分なメモリーを使用するため、スワップが必要ありません。アプリケーションおよびシステム用に物理 RAM を常にサイズにします。vmstat を使用して、メモリー使用率を監視し、si (swap in) および so (swap out)フィールドを監視します。可能な限りゼロのままにすることが最適です。
手順2.8 OOM (out of Memory)
/proc/sys/vm/panic_on_oom の OOM 動作を制御するスイッチがあります。1 をカーネルに設定すると、OOM でパニックが生じます。デフォルト設定は、OOM で oom_killer という名前の関数を呼び出すようカーネルに指示する 0 です。通常、oom_killer は不正なプロセスを強制終了し、システムは存続します。
- これを変更する最も簡単な方法は、これを
echoに、新しい値を/proc/sys/vm/panic_on_oomに変更します。~]#
cat /proc/sys/vm/panic_on_oom0 ~]#echo 1 > /proc/sys/vm/panic_on_oom~]#cat /proc/sys/vm/panic_on_oom1注記
OOM で Real time カーネルパニックを行うことが推奨されます。システムが OOM 状態になった場合、その状態は決定しなくなります。 oom_killerスコアを調整することで、プロセスが強制終了される優先順位を設定することもできます。/proc/PID/には、oom_adjとoom_scoreという名前の 2 つのファイルがあります。oom_adjの有効なスコアは、-16 から +15 の範囲です。この値は、プロセスが実行されている時間 (他の要因) を考慮するアルゴリズムを使用してプロセスの「問題」を計算するために使用されます。現在のoom_killerスコアを表示するには、プロセスのoom_scoreを確認 します。oom_killerはスコアが最も高いプロセスを最初に強制終了します。この例では、PID が 12465 のプロセスのoom_scoreの調整を行い、oom_killerが強制終了されにくくします。~]#
cat /proc/12465/oom_score79872 ~]#echo -5 > /proc/12465/oom_adj~]#cat /proc/12465/oom_score78- また、-17 には特殊な値があります。これは、プロセスの
oom_killerを無効にします。以下の例では、oom_scoreはOの値を返します。これは、このプロセスが終了されないことを示しています。~]#
cat /proc/12465/oom_score78 ~]#echo -17 > /proc/12465/oom_adj~]#cat /proc/12465/oom_score0
詳細は、以下の man ページは本セクションに記載の情報に関連しています。
- swapon(2)
- swapon(8)
- vmstat(8)
2.9. ネットワーク決定のヒント
TCP はレイテンシーに大きな影響を及ぼす可能性があります。TCP は、効率性の取得、輻輳を制御し、信頼できる配信を保証するためにレイテンシーを追加します。チューニング時には、以下の点を考慮してください。
- 配信の順番が必要ですか。
- パケットロスに対して保護する必要がありますか。複数のパケットを送信すると遅延が発生する可能性があります。
- TCP を使用する場合は、ソケット
TCP_NODELAY上で使用して Nagle buffering アルゴリズムを無効にすることを検討してください。Nagle アルゴリズムは小さな送信パケットを収集し、すべてを一度に送信し、レイテンシーに悪影響を及ぼす可能性があります。
ネットワークチューニング
- コアの割り込み
- 割り込みの量を減らすには、パケットを収集し、パケットのコレクションに対して単一の割り込みが生成されます。スループットが最優先である大容量のデータを転送するシステムでは、デフォルト値を使用するかコアレシーを増やし、スループットを高め、CPU にアクセスする割り込みの数を減らすことができます。ネットワークへの迅速な応答を必要とするシステムでは、コアレスを削減または無効化することが推奨されます。有効にする
ethtoolコマンドに-C(--coalesce) オプションを指定します。 - 輻輳
- 多くの場合、I/O スイッチは、フルバッファーの結果としてネットワークデータがビルドされるバックプレッシングの対象になることがあります。
ethtoolコマンドに-A(--pause)オプションを指定して、pause パラメーターを変更し、ネットワークの輻輳を回避します。 - Infiniband (IB)
- InfiniBand は多くの場合、帯域幅を高め、サービスやフェイルオーバーの品質を提供するために使用される通信アーキテクチャーのタイプです。Remote Direct Memory Access (RDMA) 機能によるレイテンシーを改善するためにも使用できます。
- ネットワークプロトコルの統計
- ネットワークトラフィックを監視するには、
netstatコマンドに-s(--statistics) オプションを使用します。
詳細は、以下の man ページは本セクションに記載の情報に関連しています。
- ethtool(8)
- netstat(8)
2.10. syslog Tips の調整
syslog ネットワークを介して任意の数のプログラムからログメッセージを転送できます。多くの場合、これはより大きく、保留中のトランザクションである可能性が高くなります。トランザクションのサイズが非常に大きい場合は、I/O 増加が発生する可能性があります。これを防ぐには、間隔を合理的に小さく維持します。
手順2.9 システムロギングに syslogd を使用する。
syslogd) は、複数の異なるプログラムからメッセージを収集するために使用されます。また、カーネルロギングデーモン klogd からカーネルが報告する情報を収集します。通常、syslogd によりローカルファイルにログが記録されますが、リモートロギングサーバーにネットワーク経由でログを記録するように設定することもできます。
- リモートロギングを有効にするには、まずログを受信するマシンを設定する必要があります。詳細はhttps://access.redhat.com/solutions/54363を参照してください。
- リモートロギングサーバーでリモートロギングサポートを有効にすると、ログを送信する各システムは、そのログをローカルファイルシステムに書き込むのではなく、その syslog 出力をサーバーに送信するように設定する必要があります。これを行うには、各クライアントシステムの
/etc/rsyslog.confファイルを編集します。このファイルで定義されたさまざまなロギングルールについて、ローカルログファイルをリモートロギングサーバーのアドレスに置き換えることができます。# Log all kernel messages to remote logging host. kern.* @my.remote.logging.server
上記の例では、クライアントシステムがすべてのカーネルメッセージを@my.remote.logging.serverでリモートマシンにログ記録します。 - ワイルドカード行を
/etc/rsyslog.confファイルに追加することで、ローカルで生成されるすべてのシステムメッセージをログに記録するようにsyslogdを設定することもできます。# Log all messages to a remote logging server: *.* @my.remote.logging.server
重要
syslogd に含まれていないことに注意してください。したがって、Red Hat Enterprise Linux for Real Time システムのリモートロギングは、組織がリモートでログに記録する必要があるメッセージのみに制限することを推奨します。たとえば、カーネルの警告、認証要求などです。他のメッセージはローカルでログに記録されます。
詳細は、以下の man ページは本セクションに記載の情報に関連しています。
- syslog(3)
- rsyslog.conf(5)
- rsyslogd(8)
2.11. PC カードデーモン
pcscd デーモンは、PC および SC スマートカードリーダーへの接続を管理するために使用されます。通常 pcscd は優先度が低いタスクですが、多くの場合、他のデーモンよりも多くの CPU を使用することができます。この新たな背景の根本的な影響により、リアルタイムタスクやその他の決定論的な影響が高まる可能性があります。
手順2.10 pcscd デーモンの無効化
pcscdデーモンのステータスを確認します。~]#
systemctl status pcscdpcscd.service - PC/SC Smart Card Daemon Loaded: loaded (/usr/lib/systemd/system/pcscd.service; static) Active: active (running) …pcscdデーモンが実行している場合は停止します。~]#
systemctl stop pcscd- システムの起動時に
pcscdが再起動しないことを確認します。~]#
systemctl disable pcscd
2.12. TCP パフォーマンスの急増減
sysctl コマンドは TCP 関連のエントリーの値を制御し、/proc/sys/net/ipv4/tcp_timestamps にあるタイムスタンプカーネルパラメーターを設定します。
- 次のコマンドを実行してタイムスタンプをオフにします。
~]#
sysctl -w net.ipv4.tcp_timestamps=0net.ipv4.tcp_timestamps = 0 - 以下のコマンドを使用してタイムスタンプをオンにします。
~]#
sysctl -w net.ipv4.tcp_timestamps=1net.ipv4.tcp_timestamps = 1 - 以下のコマンドで現在の値を出力します。
~]#
sysctl net.ipv4.tcp_timestampsnet.ipv4.tcp_timestamps = 1値は、タイムスタンプが有効である1ことを示します。値0はオフであることを示します。
2.13. システムのパーティション設定
lscpu および tuna ユーティリティーは、システムの CPU トポロジーを判断するために使用されます。Tuna GUI を使用すると、CPU を動的に分離し、スレッドをある CPU から別の CPU に移動して、パフォーマンスへの影響を測定することができます。
~]# yum install tuned-profiles-realtimetuned real-time プロファイルを提供します。2 つの設定ファイルにより、プロファイルの動作が制御されます。
/etc/tuned/realtime-variables.conf/usr/lib/tuned/realtime/tuned.conf
realtime-variables.conf ファイルは、分離される CPU コアのグループを指定します。システムから CPU コアのグループを分離するには、以下の例のように isolated_cores オプションを使用します。
# Examples:
# isolated_cores=2,4-7
# isolated_cores=2-23
#
isolated_cores=1-3,5,9-14
isolated_cores 変数が設定されたら、tuned-adm コマンドでプロファイルをアクティベートします。
~]# tuned-adm profile realtimebootloader プラグインを使用します。このプラグインを有効にすると、Linux カーネルコマンドラインに以下のブートパラメーターが追加されます。
- isolcpus
realtime-variables.confファイルに一覧表示される CPU を指定します。- nohz
- アイドル状態の CPU でタイマーティックをオフにし、デフォルトで
offに設定します。 - nohz_full
- CPU に実行可能なタスクが 1 つしかない場合は、CPU でタイマーティックをオフにします。
nohzをonに設定する必要があります。 - intel_pstate=disable
- Intel のアイドルドライバーが電源状態および CPU 周波数を管理しないようにする
- nosoftlockup
- カーネルがユーザースレッドのソフトロックアップを検出しないようにする
isolcpus=1-3,5,9-14 nohz=on nohz_full=1-3,5,9-14 intel_pstate=disable nosoftlockup
tuned.conf の [script] セクションで指定された script.sh シェルスクリプトを実行します。スクリプトは、sysfs 仮想ファイルシステムの以下のエントリーを調整します。
/sys/bus/workqueue/devices/writeback/cpumask/sys/devices/system/machinecheck/machinecheck*/ignore_ce
workqueue エントリーは分離された CPU マスクの逆に設定し、2 番目のエントリーはマシンのチェック例外を無効にします。
/etc/sysctl.conf ファイルに以下の変数も設定します。
kernel.hung_task_timeout_secs = 600
kernel.nmi_watchdog = 0
kernel.sched_rt_runtime_us = 1000000
vm.stat_interval = 10
tuna インターフェースを使用して、分離された CPU 番号上の非バインドスレッドを分離された CPU から移行します。
/usr/lib/tuned/realtime/script.sh 行うには、デフォルトをコピーして変更し、tuned.conf JSON ファイルを変更したスクリプトを参照します。
2.14. CPU パフォーマンスの急増減
skew_tick は、レイテンシーが重要なアプリケーションが実行されている大規模なシステムに対して、ジッターをスムーズに行うのに役立ちます。リアルタイム Linux システムでレイテンシーが急増する一般的なソースは、Linux カーネルタイマーティックハンドラーの共通のロックに複数の CPU が競合する場合です。競合に対する通常のロックは xtime_lock で、タイムキーピングシステムで使用される、および RCU (Read-Copy-Update) 構造ロックです。
skew_tick=1 boot パラメーターを使用すると、これらのカーネルロックの競合が減ります。このパラメーターにより、CPU ごとのティックは、開始時間は「スキュー (skewed)」により同時に発生しません。CPU タイマーごとの開始時間を短縮すると、ロックの競合の可能性が低くなり、割り込み応答時間が短縮されます。
第3章 リアルタイム固有のチューニング
重要
3.1. スケジューラーの優先順位の設定
警告
表3.1 優先順位マップ
| 優先度 | スレッド | 詳細 |
|---|---|---|
1 | 優先度が低いカーネルスレッド | 優先度 1 は通常、SCHED_OTHER を上になるタスクに対して予約されます。 |
2 - 49 | 利用可能 | 一般的なアプリケーションの優先順位に使用される範囲 |
50 | デフォルトの hard-IRQ 値 | |
51 - 98 | 優先度の高いスレッド | この範囲は、定期的に実行され、応答時間が短くなければならないスレッドに使用します。中断が不足するため、CPU にバインドされたスレッドにはこの範囲を使用しないでください。 |
99 | watchdogs および移行 | 最も優先度が高いシステムスレッド |
手順3.1 systemd の使用による優先順位の設定
- 優先度は、
0(最も低い優先度) から99(最も高い優先度) までの一連のレベルを使用して設定されます。systemdサービスマネージャーは、カーネル起動後のスレッドのデフォルト優先度を変更するために使用できます。実行中のスレッドのスケジューリングの優先度を表示するには、tuna ユーティリティーを使用します。~]#
tuna --show_threadsthread ctxt_switches pid SCHED_ rtpri affinity voluntary nonvoluntary cmd 2 OTHER 0 0xfff 451 3 kthreadd 3 FIFO 1 0 46395 2 ksoftirqd/0 5 OTHER 0 0 11 1 kworker/0:0H 7 FIFO 99 0 9 1 posixcputmr/0 ...[output truncated]...
3.1.1. ブートプロセス中のサービスの優先度の変更
systemd ブートプロセス中に起動されるサービスのリアルタイム優先度を設定できるようにします。
- CPUSchedulingPolicy=
- 実行したプロセスの CPU スケジューリングポリシーを設定します。Linux で利用可能なスケジューリングクラスの 1 つを取ります。
- その他
- バッチ
- idle
- fifo
- rr
- CPUSchedulingPriority=
- 実行したプロセスの CPU スケジューリングの優先度を設定します。利用可能な優先度の範囲は、選択した CPU スケジューリングポリシーにより異なります。リアルタイムスケジューリングポリシーでは、1 (最も低い優先度) から 99 (最も高い優先度) の整数を使用できます。
例3.1 mcelog サービスの優先度の変更
mcelog サービスを使用します。mcelog サービスの優先度を変更するには、以下を実行します。
- 以下のように、
/etc/systemd/system/mcelog.system.d/priority.confで、補助mcelogサービス設定ディレクトリーファイルを作成します。# cat <<-EOF > /etc/systemd/system/mcelog.system.d/priority.conf
- 以下を挿入します。
[SERVICE]
CPUSchedulingPolicy=fifo
CPUSchedulingPriority=20
EOF
systemdスクリプト設定を再読み込みします。# systemctl daemon-reload
mcelogサービスを再起動します。# systemctl restart mcelog
- 以下の
systemdで設定したmcelog優先度を表示します。$ tuna -t mcelog -P
このコマンドの出力は、以下のようになります。thread ctxt_switches pid SCHED_ rtpri affinity voluntary nonvoluntary cmd 826 FIFO 20 0,1,2,3 13 0 mcelog
systemd ユニット設定ディレクティブ の変更の詳細は、システム管理者のガイドの「 既存のユニットファイルの変更の章を参照してください。
3.1.2. サービスの CPU 使用率の設定
systemd では、実行できる CPU サービスを指定できるようになります。
例3.2 mcelog サービスの CPU 使用率の設定
mcelog サービスが CPU 0 および 1 で実行されるように制限します。
- 以下のように、
/etc/systemd/system/mcelog.system.d/affinity.confで、補助mcelogサービス設定ディレクトリーファイルを作成します。# cat <<-EOF > /etc/systemd/system/mcelog.system.d/affinity.conf
- 以下を挿入します。
[SERVICE]
CPUAffinity=0,1
EOF
systemdスクリプト設定を再読み込みします。# systemctl daemon-reload
mcelogサービスを再起動します。# systemctl restart mcelog
mcelogサービスが以下に制限される CPU を表示します。$ tuna -t mcelog -P
このコマンドの出力は、以下のようになります。thread ctxt_switches pid SCHED_ rtpri affinity voluntary nonvoluntary cmd 12954 FIFO 20 0,1 2 1 mcelog
systemd ユニット設定ディレクティブ の変更の詳細は、システム管理者のガイドの既存のユニットファイルの変更の章を参照してください。
3.2. Red Hat Enterprise Linux for Real Time カーネルとの kdump と kexec の使用
kexec というメカニズムを使用します。この 2 番目のカーネルは、多くの場合クラッシュカーネルと呼ばれ、非常に少ないメモリーでブートし、ダンプイメージをキャプチャーします。
kdump カーネルを予約領域に読み込みます。カーネルパニックまたはその他の致命的なエラーが発生した場合、kexec は BIOS を経由せずに kdump カーネルで起動するために使用されます。システムは、標準の kdump ブートカーネルが予約するメモリー領域に制限されているカーネルに再起動し、このカーネルはシステムメモリーのコピーまたはイメージを設定ファイルで定義したストレージメカニズムに書き込みます。kexec は BIOS を通過し ないため、元のブートのメモリーは保持され、クラッシュダンプはより詳細になります。これが実行されると、カーネルが再起動し、マシンがリセットされ、ブートカーネルがバックアップされます。
rt-setup-kdump ツールを使用して GRUB コマンドラインを変更します。3 つ目は、system-config-kdump というグラフィカルなシステム設定ツールを使用して、詳細な kdump 設定を作成し、有効にします。
必要な kdump パッケージのインストール
このrt-setup-kdumpツールは、rt-setup パッケージに含まれます。kexec-tools および system-config-kdump も必要です。~]#
yum install rt-setup kexec-tools system-config-kdumprt-setup-kdumpで基本的な kdump カーネルの作成rt-setup-kdumpツールをrootとして実行します。~]#
rt-setup-kdump --grubこの--grubパラメーターは、GRUB 設定に記載されているすべてのリアルタイムカーネルエントリーに必要な変更を追加します。- システムを再起動して、予約メモリー容量を設定します。その後、kdump init スクリプトを有効にして kdump サービスを起動します。
~]#
systemctl enable kdump~]#systemctl start kdump
kdump で
system-config-kdumpを有効化- → から システムツールを選択するか、シェルプロンプトで以下のコマンドを使用します。
~]#
system-config-kdump - カーネルダンプ設定画面 が表示されます。曲線で、 というラベルの付いたボタンをクリックします。Red Hat Enterprise Linux for Real Time カーネルは、kdump カーネルに対応するために必要なメモリー量を自動的に算出する
crashkernel=autoパラメーターをサポートします。RAM が 4GB 未満の Red Hat Enterprise Linux 7 システムでは、crashkernel=autoは、kdump カーネル用にメモリーを予約しません。この場合は、必要なメモリー量を手動で設定する必要があります。基本設定 タブの 新しい kdump メモリー フィールドに必要な値を入力してこれを実行できます。
注記
kdump カーネルにメモリーを割り当てる別の方法として、GRUB 設定にcrashkernel=<value>パラメーターを手動で設定する方法があります。 - ターゲット設定 タブをクリックし、ダンプファイルの場所を指定します。これはローカルのファイルシステムにファイルとして保存するか、デバイスに直接書き込むか、または NFS (Network File System) や SSH (Secure Shell) などのプロトコルを使ってネットワーク経由で送信することができます。
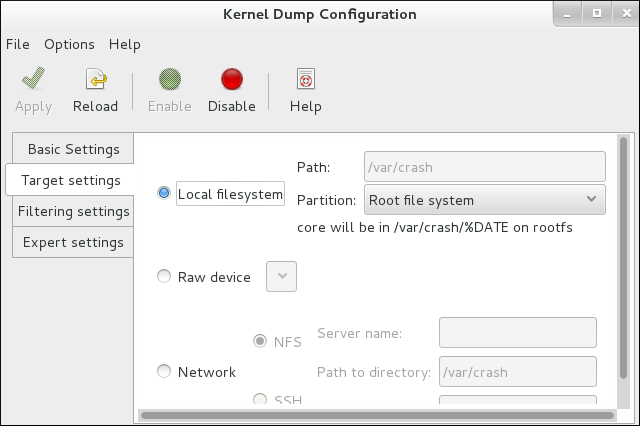 設定を保存するには、ツールバーの ボタンをクリックします。
 - システムを再起動して、kdump が適切に起動できるようにします。kdump が正常に機能していることを確認する場合は、
sysrqを使用してパニックをシミュレートしてください。~]#
echo c > /proc/sysrq-triggerこれにより、カーネルパニックが発生し、システムが kdump カーネルで起動します。システムをバックアップしたら、指定した場所でログファイルを確認できます。
注記
/etc/sysconfig/kdump ファイルを編集して、KDUMP_COMMANDLINE_APPEND を reset_devices=1 変数に追加します。
重要
irq 9: nobody cared (try booting with the "irqpoll" option) handlers:
[<ffffffff811660a0>] (acpi_irq+0x0/0x1b)
turning off IO-APIC fast mode.
acpi=noirqの行を kdump カーネルに追加します。この行は、この問題の影響を受けないマシンでブートの問題を引き起こす可能性があるため、このエラーが発生した場合にのみ追加します。
詳細は、以下の man ページは本セクションに記載の情報に関連しています。
- kexec(8)
/etc/kdump.conf
3.3. Opteron CPU での TSC タイマーの同期
gettimeofday スキューの影響を受けやすくなります。このスキューは cpufreq、Time Stamp Counter (TSC) の両方が使用されている場合に発生します。Red Hat Enterprise Linux for Real Time は、すべてのプロセッサーが同じ頻度に同時に変更することで、このスキューを防ぐ方法を提供します。そのため、1 つのプロセッサーの TSC は、別のプロセッサーの TSC とは異なる速度で増加することはありません。
手順3.2 TSC タイマー同期の有効化
- 希望するテキストエディターで
/etc/default/grubファイルを開き、パラメーターGRUB_CMDLINE_LINUXをclocksource=tsc powernow-k8.tscsync=1変数に追加します。これにより、TSC の使用が強制され、同時にコアプロセッサーの周波数遷移が有効になります。GRUB_CMDLINE_LINUX="rd.md=0 rd.lvm=0 rd.dm=0 $([ -x /usr/sbin/rhcrashkernel-param ] && /usr/sbin/rhcrashkernel-param || :) rd.luks=0 vconsole.keymap=us rhgb quiet clocksource=tsc powernow-k8.tscsync=1"
- 変更を有効にするには、システムを再起動する必要があります。
詳細は、以下の man ページは本セクションに記載の情報に関連しています。
- gettimeofday(2)
3.4. Infiniband
注記
3.5. RoCEE および高パフォーマンスのネットワーク
注記
3.6. 非非統合メモリーアクセス
taskset ユーティリティーを使用してプロセスの CPU にバインド」 で説明したように、taskset ユーティリティーは CPU のアフィニティーでのみ機能し、メモリーノードなどの他の NUMA リソースについては認識しません。NUMA と組み合わせてプロセスバインディングを実行する場合は、taskset の代わりに numactl コマンドを使用します。
詳細は、以下の man ページは本セクションに記載の情報に関連しています。
- numactl(8)
3.7. TCP の遅延 ACK タイムアウトの削減
- クイック ACK
- このモードは TCP 接続の開始時に使用され、輻輳ウインドウがすぐに拡張できるようにします。
- acknowledgment (ACK) のタイムアウト間隔 (ATO) が、最低限のタイムアウト値
tcp_ato_minに設定されています。 - デフォルトの TCP ACK タイムアウト値を変更するには、必要な値をミリ秒単位で
/proc/sys/net/ipv4/tcp_ato_minファイルに書き込みます。~]#
echo 4 > /proc/sys/net/ipv4/tcp_ato_min
- ACK の遅延
- 接続が確立されると TCP は、複数の受信パケットの ACK を単一のパケットで送信できるこのモードを想定します。
- ATO はタイマーを再起動またはリセットするように
tcp_delack_minに設定されます。 - デフォルトの TCP Delayed ACK 値を変更するには、必要な値をミリ秒単位で
/proc/sys/net/ipv4/tcp_delack_minファイルに書き込みます。~]#
echo 4 > /proc/sys/net/ipv4/tcp_delack_min
tcp_ato_min と tcp_delack_min のタイムアウトの両方が 4 ミリ秒になりました。
注記
3.8. debugfs の使用
debugfs ファイルシステムは、ユーザーがデバッグし、情報を利用できるようにするために特別に設計されています。ftrace および trace-cmd で使用するためにマウントする必要があります。/sys/kernel/debug/ ディレクトリー下の Red Hat Enterprise Linux 7 に自動的にマウントされます。
debugfs がマウントされていることを確認できます。
~]# mount | grep ^debugfs3.9. ftrace ユーティリティーを使用したレイテンシーの追跡
ftrace です。これは、開発者がユーザー空間外で発生するレイテンシーおよびパフォーマンスの問題を分析し、デバッグするのに使用されます。この ftrace ユーティリティーには、さまざまな方法でユーティリティーを使用できるさまざまなオプションがあります。これは、コンテキストスイッチの追跡、優先順位の高いタスクでのウェイクアップにかかる時間の測定、割り込みが無効になっている期間の測定、特定の期間中に実行されたカーネル関数の一覧の表示に使用できます。
ftrace ユーティリティーは、Red Hat Enterprise Linux for Real Time カーネルの trace バリアントがインストールされ、使用中の場合に設定できます。
手順3.3 ftrace ユーティリティーの使用
/sys/kernel/debug/tracing/ディレクトリーには、available_tracersという名前のファイルがあります。このファイルには、ftraceに使用できるすべてのトレーサーが含まれます。利用可能なトレーサーの一覧を表示するには、catコマンドを使用してファイルの内容を表示します。~]#
cat /sys/kernel/debug/tracing/available_tracersfunction_graph wakeup_rt wakeup preemptirqsoff preemptoff irqsoff function nopftraceのユーザーインターフェースは、debugfsにある一連のファイルです。ftraceファイルは/sys/kernel/debug/tracing/ディレクトリーにも存在します。以下を入力します。~]#
cd /sys/kernel/debug/tracingトレースを有効にするとシステムのパフォーマンスに影響を及ぼすことができるため、このディレクトリーのファイルを変更することができるのはrootユーザーのみです。ftrace ファイルこのディレクトリー内のメインファイルは、以下のとおりです。
trace- ftrace トレースの出力を表示するファイル。これは、このファイルが読み込まれ、イベント読み取りを消費しないため、トレースを停止するため、実際にはトレースのスナップショットです。これは、ユーザーがトレースを無効にしてこのファイルを読み取ると、読み取り時に毎回同じ内容を報告します。
trace_pipe- 「trace」と似ていますが、トレースをライブで読み込むために使用されます。プロデューサー/コンシューマートレースで、各読み取りが読み取られるイベントを消費します。ただし、これにより、トレースが読み取られることなく、アクティブなトレースを確認することができます。
available_tracers- カーネルにコンパイルされた ftrace トレーサーの一覧。
current_tracer- ftrace トレーサーを有効または無効にします。
events- トレースするイベントが含まれ、イベントを有効または無効にするのに使用できるディレクトリーと、イベントのフィルターの設定を行うことができます。
tracing_on- ftrace バッファーへの録画を無効および有効にします。
tracing_onファイル経由でトレースを無効にしても、カーネル内で実際のトレースは無効になりません。バッファーへの書き込みのみを無効にします。トレースを実行する作業は継続されますが、データはどこにも移動しません。
トレーサーカーネルの設定方法によっては、指定のカーネルですべてのトレーサーが利用できるとは限りません。Red Hat Enterprise Linux for Real Time カーネルの場合、トレースカーネルとデバッグカーネルは、実稼働用のカーネルとは異なるトレーサーを持ちます。これは、トレーサーの一部にトレーサーがカーネルに設定され、アクティブではない場合に大きなオーバーヘッドが発生するためです。このトレーサーは、トレースおよびデバッグカーネルに対してのみ有効になります。
function- 最も広く適用されるトレーサーの 1 つ。カーネル内の関数呼び出しを追跡します。トレースされた関数の数によっては、認識可能なオーバーヘッドが発生する可能性があります。アクティブでない場合にオーバーヘッドがほとんど作成されます。
function_graphfunction_graphトレーサーは、結果を視覚的に表示するように設計されています。このトレーサーは、関数の終了を追跡し、カーネル内の関数呼び出しのフローを表示します。このトレーサーは、有効なときにfunctionトレーサーよりも多くのオーバーヘッドがありますが、無効なときには同じオーバーヘッドが少ないことに注意してください。wakeup- すべての CPU でアクティビティーが発生することを報告する完全な CPU トレーサー。リアルタイムタスクであるかに関わらず、システム内で最も優先度の高いタスクを起動するのにかかる時間を記録します。非リアルタイムタスクを起動するのにかかる最大時間の記録では、リアルタイムタスクを起動するのにかかる時間が非表示になります。
wakeup_rt- すべての CPU でアクティビティーが発生することを報告する完全な CPU トレーサー。現在の最も高い優先度タスクから、ウェイクアップ時間まで経過時間を記録します。リアルタイムタスクの時間を記録します。
preemptirqsoff- プリエンプションまたは割り込みを無効にするエリアを追跡し、プリエンプションまたは割り込みが無効となった最大時間を記録します。
preemptoffpreemptirqsoffトレーサーと同様ですが、プリエンプションが無効となった最大間隔のみを追跡します。irqsoffpreemptirqsoffトレーサーと似ていますが、割り込みが無効になっている最大間隔のみを追跡します。nop- デフォルトのトレーサー。トレース機能自体は提供しませんが、イベントがトレーサーに干渉する可能性があるため、
nopトレーサーはイベントの追跡に具体的な目的に使用されます。
- トレーシングセッションを手動で開始するには、最初に
available_tracersにある一覧から使用するトレーサーを選択し、echoコマンドを使用してトレーサーの名前を/sys/kernel/debug/tracing/current_tracerに挿入します。~]#
echo preemptoff > /sys/kernel/debug/tracing/current_tracer functionおよびfunction_graphトレースが有効になっているかどうかを確認するには、catコマンドを使用して/sys/kernel/debug/tracing/options/function-traceファイルを表示します。値が1の場合は、これが有効であることを示し、0は無効であることを示します。~]#
cat /sys/kernel/debug/tracing/options/function-trace1デフォルトではfunctionとfunction_graphトレースは有効になっています。この機能を有効または無効にするには、/sys/kernel/debug/tracing/options/function-traceファイルechoに適切な値を設定します。~]#
echo 0 > /sys/kernel/debug/tracing/options/function-trace~]#echo 1 > /sys/kernel/debug/tracing/options/function-trace重要
echoコマンドを使用する場合は、値と>文字の間に空白文字を配置するようにしてください。0>, 1>, and 2>(空白文字なし) を使用するシェルプロンプトでは、標準入力、標準出力、および標準エラーを参照します。誤ってそれらを使用すると、トレースが予期せぬ出力になる可能性があります。このfunction-traceオプションは、wakeup_rt、preemptirqsoffなどによるトレースレイテンシーにより、関数トレースが有効になるため便利です。これは、オーバーヘッドを誇張することがあります。/debugfs/tracing/ディレクトリー内のさまざまなファイルの値を変更して、トレーサーの詳細とパラメーターを調整します。以下に例を示します。irqsoff、preemptoff、preempirqsoff、および wakeup トレーサーは、レイテンシーを継続的に監視します。tracing_max_latencyで記録されたものよりもレイテンシーが大きい場合は、レイテンシーのトレースが記録され、tracing_max_latencyが新しい最大時間に更新されます。これtracing_max_latencyにより、最後にリセットされた後、常に記録されたレイテンシーが最も高いレベルが表示されます。最大レイテンシーをファイルにリセットするには、echo0をtracing_max_latencyファイルに切り替えます。指定の量を超えるレイテンシーのみを見るには、echoでマイクロ秒単位で表示します。~]#
echo 0 > /sys/kernel/debug/tracing/tracing_max_latencyトレースのしきい値を設定すると、最大レイテンシー設定が上書きされます。しきい値より大きいレイテンシーが記録されると、最大レイテンシーに関係なく記録されます。トレースファイルを確認すると、最後に記録されたレイテンシーのみが表示されます。しきい値を設定するには、記録される必要があるレイテンシーを上回るマイクロ秒をechoします。~]#
echo 200 > /sys/kernel/debug/tracing/tracing_thresh- トレースログを表示します。
~]#
cat /sys/kernel/debug/tracing/trace - トレースログを保存するには、別のファイルにコピーします。
~]#
cat /sys/kernel/debug/tracing/trace > /tmp/lat_trace_log - 関数トレースは、
/sys/kernel/debug/tracing/set_ftrace_filterファイルの設定を変更してフィルターできます。ファイルにフィルターが指定されていない場合、すべての関数がトレースされます。現在のフィルターを表示するには、catを使用します。~]#
cat /sys/kernel/debug/tracing/set_ftrace_filter - フィルターを変更するには、追跡する関数の名前を
echoします。このフィルターは、検索用語の先頭または末尾に*ワイルドカードを使用できます。*ワイルドカードは、単語の先頭 と 最後の両方で使用できます。たとえば、*irq*は、名前のirqに含まれるすべての関数を選択します。ただし、ワイルドカードは単語内で使用できません。検索用語とワイルドカード文字を二重引用符で囲むと、シェルが検索を現在の作業ディレクトリーに拡張しないようにします。フィルターの例を以下に示します。schedule関数のみを追跡します。~]#
echo schedule > /sys/kernel/debug/tracing/set_ftrace_filterlockで終わるすべての関数を追跡します。~]#
echo "*lock" > /sys/kernel/debug/tracing/set_ftrace_filterspin_で始まるすべての関数を追跡します。~]#
echo "spin_*" > /sys/kernel/debug/tracing/set_ftrace_filter- 名前に
cpuのある関数すべてを追跡します。~]#
echo "*cpu*" > /sys/kernel/debug/tracing/set_ftrace_filter
注記
echoコマンドとともに単一の>を使用する場合は、ファイル内の既存の値が上書きされます。ファイルに値を追加する場合は、代わりに>>を使用します。
3.10. レイテンシートレースの使用 trace-cmd
trace-cmd は、ftrace へのフロントエンドツールです。/sys/kernel/debug/tracing/ ディレクトリーへの書き込みを必要とせずに、以前に説明した ftrace 対話を有効にすることができます。これは、特別なトレースカーネルバリアントなしでインストールでき、インストール時にはオーバーヘッドは追加されません。
trace-cmdツールをインストールするには、rootで以下のコマンドを入力します。~]#
yum install trace-cmd- ユーティリティーを起動するには、
trace-cmdシェルプロンプトで、以下の構文を使用して必要なオプションを入力します。~]#
trace-cmd commandコマンドの例を以下に示します。~]#
trace-cmd record -p function myappmyapp の実行中に、カーネル内で実行中の録画機能を有効にして開始します。これは、myapp に無関係なタスクであっても、すべての CPU およびすべてのタスクの関数を記録します。~]#
trace-cmd report結果を表示します。~]#
trace-cmd record -p function -l 'sched*' myappmyapp の実行中に、schedで開始する関数のみを記録します。~]#
trace-cmd start -e irqすべての IRQ イベントを有効にします。~]#
trace-cmd start -p wakeup_rtwakeup_rtトレーサーを起動します。~]#
trace-cmd start -p preemptirqsoff -dpreemptirqsoffトレーサーを起動しますが、これにより関数トレースが無効になります。Red Hat Enterprise Linux 7 の trace-cmd のバージョンは、このfunction-traceオプションを使用する代わりにftrace_enabledをオフにします。trace-cmd start -p functionで再度有効にできます。~]#
trace-cmd start -p nopシステムの変更を trace-cmd 開始する前に、システムを復元します。これは、trace-cmd の使用後に debugfs ファイルシステムを使用する場合、システムが再起動されたかどうかに関係なく重要です。
注記
コマンドおよびオプションの完全なリストは、man ページの trace-cmd(1) を参照してください。すべての個々のコマンドには、独自の man ページ trace-cmd-コマンド もあります。イベントトレースおよび関数トレーサーの詳細は、付録A イベントトレース および 付録B Ftrace の詳細説明 を参照してください。 - この例では、
trace-cmdユーティリティーは単一のトレースポイントを追跡します。~]#
trace-cmd record -e sched_wakeup ls /bin
3.11. sched_nr_migrate を使用した SCHED_OTHER タスク移行の制限。
SCHED_OTHER タスクが他の多数のタスクを起動すると、すべて同じ CPU 上で実行されます。移行タスクまたは softirq は、これらのタスクのバランスを調整し、アイドル状態の CPU 上で実行できるようにします。sched_nr_migrate オプションは、一度に移動するタスク数を指定するように設定できます。リアルタイムタスクの移行方法は異なります。ただし、softirq がタスクを移動すると、割り込みを無効にするために必要な実行キューのスピンロックがロックされます。移動が必要なタスクが多数ある場合は、割り込みが無効になっているときに発生するため、タイマーイベントやウェイクアップは同時に行われません。これにより、sched_nr_migrate が大きい値に設定されると、リアルタイムタスクに深刻なレイテンシーが生じることがあります。
手順3.4 変数の値の sched_nr_migrate 調整
- この
sched_nr_migrate変数を増やすと、リアルタイムのレイテンシーを犠牲にして、タスクが多数発生するSCHED_OTHERスレッドのパフォーマンスが向上します。SCHED_OTHERタスクパフォーマンスを犠牲にしてリアルタイムのタスクレイテンシーを低くするには、値を低くする必要があります。デフォルト値は 8 です。 sched_nr_migrate変数の値を調整するには、/proc/sys/kernel/sched_nr_migrateに直接値をechoしてください。~]#
echo 2 > /proc/sys/kernel/sched_nr_migrate
3.12. リアルタイムのスロットリング
Red Hat Enterprise Linux for Real Time の 2 つのリアルタイムスケジューリングポリシーには、主要な特性が 1 つあります。これらは、優先度の高いスレッドによってプリエンプティブされるか、スリープまたは I/O を実行することによって「待機」するまで、実行される特性です。SCHED_RR の場合、同等の SCHED_RR 優先度の別のスレッドを実行できるように、スレッドがオペレーティングシステムによってプリエンプティブされる可能性があります。このようないずれの場合も、POSIX 仕様では、優先度の低いスレッドが CPU 時間を取得できるようにするポリシーを定義するプロビジョニングはありません。
SCHED_FIFO スレッドにより単調化されると、ハウスキーピングタスクを実行できず、最終的にシステム全体が不安定になり、クラッシュする可能性があります。
SCHED_FIFO 優先度のスレッド (デフォルト: 50) として実行されます。cpu-hog スレッドが割り込みハンドラースレッドよりも大きいか、SCHED_FIFO または SCHED_RR ポリシーが高いと、割り込みハンドラーの実行を防ぎ、割り込みによるシグナルを受けるデータを待つプログラムが不足し、失敗します。
Red Hat Enterprise Linux for Real Time には、システム管理者がリアルタイムタスクで使用できる帯域幅を割り当てる安全なメカニズムが含まれています。この安全なメカニズムは real-time scheduler throttling として知られ、/proc ファイルシステムの 2 つのパラメーターとして制御されます。
/proc/sys/kernel/sched_rt_period_us- CPU 帯域幅の 100% と見なされる μ (マイクロ秒) の期間を定義します。デフォルト値は、1,000,000 μs (1 秒)です。期間の値の変更は、期間が長すぎるか、または小さすぎると、非常に大きな影響を及ぼす必要があります。
/proc/sys/kernel/sched_rt_runtime_us- すべてのリアルタイムタスクで利用可能な合計帯域幅。デフォルト値は 950,000 μs (0.95 秒)、つまり CPU 帯域幅の 95% です。値を -1 に設定すると、リアルタイムタスクで CPU 時刻が 100% になる可能性があることを意味します。これは、リアルタイムタスクが良好で、無制限のポーリングループなどの明確な注意がない場合にのみ適切です。
SCHED_OTHER および同様のスケジュールポリシーで実行されるタスク) に割り当てられます。1 つのリアルタイムタスクが CPU タイムスロットの 95% を占有している場合、その CPU 上の残りのリアルタイムタスクは実行されないことに注意してください。CPU 時間の残りの 5% は、リアルタイム以外のタスクでのみ使用されます。
RT_RUNTIME_GREED 機能
RT_RUNTIME_GREED を有効化します。
# echo RT_RUNTIME_GREED > /sys/kernel/debug/sched_features
NO_RT_RUNTIME_SHARE ロジックを無効にします。
# echo NO_RT_RUNTIME_SHARE > /sys/kernel/debug/sched_features
kernel-rt-doc パッケージで利用可能なカーネルのドキュメントから、以下を行います。
/usr/share/doc/kernel-rt-doc-3.10.0/Documentation/scheduler/sched-rt-group.txt
3.13. tuned-profiles-realtime を使用した CPU の分離
- ユーザー空間スレッドをすべて削除
- バインドされていないカーネルスレッドの削除 (バインドされたカーネルスレッドは特定の CPU に関連付けられ、移動できない)
- システム内の各割り込み要求(IRQ)番号 N の
/proc/irq/N/smp_affinityプロパティーを変更して割り込みを削除します。
isolated_cores=cpulist 設定オプションを使用して、これらの操作を自動化する方法を説明します。
分離する CPU の選択
- スレッドがキャッシュを共有して相互に通信する必要があるマルチスレッドアプリケーションがある場合、同じ NUMA ノードまたは物理ソケットでスレッドを保持する必要がある場合があります。
- 関連のない複数の real-time アプリケーションを実行すると、NUMA ノードまたはソケットごとに CPU を分離することができます。
lstopo-no-graphics や numactl を含む CPU に関する情報を取得するのに役立つコマンドを提供します。
- 物理パッケージで利用可能な CPU のレイアウトを表示するには、以下の
lstopo-no-graphics --no-io --no-legend --of txtコマンドを使用します。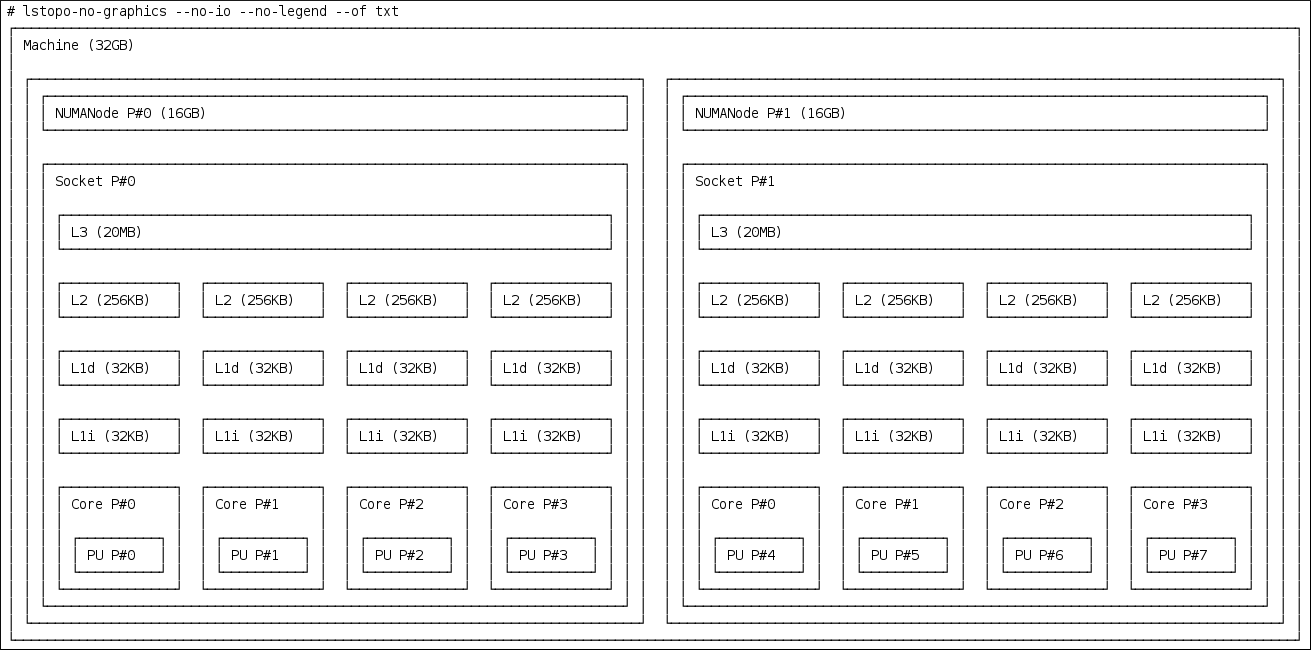
図3.1
lstopo-no-graphicsを使用した CPU のレイアウトの表示上記のコマンドは、利用可能なコアとソケットの数と NUMA ノードの論理距離を表示するため、マルチスレッドアプリケーションに役立ちます。また、この hwloc-gui パッケージは、グラフィカル出力を生成するlstopoコマンドを提供します。 - ノード間の距離など、CPU の詳細は、以下の
numactl --hardwareコマンドを使用します。~]#
numactl --hardwareavailable: 2 nodes (0-1) node 0 cpus: 0 1 2 3 node 0 size: 16159 MB node 0 free: 6323 MB node 1 cpus: 4 5 6 7 node 1 size: 16384 MB node 1 free: 10289 MB node distances: node 0 1 0: 10 21 1: 21 10
hwloc(7) のman ページを参照してください。
tuned の isolated_cores オプションを使用した CPU の分離
isolcpus=cpulist で boot パラメーターを指定することです。RedHat EnterpriseLinux for Real Time に推奨される方法は、tuned デーモンとその tuned-profiles-realtime パッケージを使用することです。
isolcpus ブートパラメーターを指定するには、以下の手順に従います。
- tuned パッケージと tuned-profiles-realtime パッケージをインストールします。
~]#
yum install tuned tuned-profiles-realtime - ファイル
/etc/tuned/realtime-variables.confで、isolated_cores=cpulistの設定オプションを設定します。ここで、cpulist は分離する CPU の一覧になります。この一覧はコンマで区切られ、CPU 番号または範囲を 1 つ含めることができます。以下に例を示します。isolated_cores=0-3,5,7
上記の行では、CPU 0、1、1、2、3、5、および 7 を分離します。例3.3 通信スレッドでの CPU の分離
8 コアを持つ 2 つのソケットシステムでは、NUMA ノードのゼロにはコア 0-3 と NUMA ノード 1 のコア 4-8 があり、マルチスレッドアプリケーション用に 2 つのコアを割り当てる場合は、以下の行を追加します。isolated_cores=4,5
tuned-profiles-realtimeプロファイルを有効にすると、isolcpus=4,5パラメーターがブートコマンドラインに追加されます。これにより、ユーザー空間スレッドが CPU 4 および 5 に割り当てられなくなります。例3.4 通信していないスレッドでの CPU の分離
関係のないアプリケーションの別の NUMA ノードから CPU を選択する場合は、以下を指定できます。isolated_cores=0,4
これにより、ユーザー空間スレッドが CPU 0 および 4 に割り当てられるのを防ぎます。 tuned-admユーティリティーを使用してtunedプロファイルをアクティベートしてから再起動します。~]# tuned-adm profile realtime ~]# reboot
- リブート時に、ブートコマンドラインで
isolcpusパラメーターを検索して、選択した CPU が分離されていることを確認します。~]$
cat /proc/cmdline | grep isolcpusBOOT_IMAGE=/vmlinuz-3.10.0-394.rt56.276.el7.x86_64 root=/dev/mapper/rhel_foo-root ro crashkernel=auto rd.lvm.lv=rhel_foo/root rd.lvm.lv=rhel_foo/swap console=ttyS0,115200n81 isolcpus=0,4
nohz および nohz_full パラメーターを使用した CPU の分離
nohz および nohz_full カーネルブートパラメーターを有効にするには、realtime-virtual-host、realtime-virtual-guestまたは cpu-partitioning のいずれかのプロファイルを使用する必要があります。
- nohz=on
- 特定の CPU セットのタイマーアクティビティーを減らすために使用できます。この
nohzパラメーターは、主にアイドル状態の CPU におけるタイマー割り込みを減らすために使用されます。これにより、アイドル状態の CPU を低電力モードで実行させることにより、バッテリーのライフサイクルが容易になります。リアルタイムの応答時間には直接有効ではありませんが、nohzパラメーターは直接リアルタイムの応答時間を下回るのではなく、リアルタイムパフォーマンスに悪影響を及ぼす次のパラメーターをアクティブにする必要があります。 - nohz_full=cpulist
- この
nohz_fullパラメーターは、タイマーティックに関して CPU の一覧を異なる方法で処理するために使用されます。CPU が nohz_full CPU として一覧表示され、CPU に実行可能なタスクが 1 つしかない場合、カーネルはその CPU へのタイマーティックの送信を停止するため、アプリケーションの実行に費やす時間が少なくなり、割り込みとコンテキストの切り替えに費やされた時間が短縮されます。
3.14. RCU コールバックのオフロード
rcu_nocbs および rcu_nocb_poll カーネルパラメーターを使用してオフロードできます。
- RCU コールバックを実行する候補から 1 つ以上の CPU を削除するには、
rcu_nocbsカーネルパラメーターの CPU の一覧を指定します。以下に例を示します。rcu_nocbs=1,4-6
またはrcu_nocbs=3
2 つ目の例では、CPU 3 が no-callback CPU であることをカーネルに指示します。つまり、RCU コールバックは CPU 3 に固定されたrcuc/$CPUスレッドでは実行されませんが、rcuo/$CPUスレッドでは、ハウスキーピング CPU に移動して、RCU コールバックジョブの実行から CPU 3 を解放できます。RCU コールバックスレッドをハウスキーピング CPU に移動するには、tuna -t rcu* -c X -mコマンドを使用します。X はハウスキーピング CPU を示します。たとえば、CPU 0 がハウスキーピング CPU のシステムでは、以下のコマンドを使用してすべての RCU コールバックスレッドを CPU 0 に移動できます。~]#
tuna -t rcu* -c 0 -mこれは、CPU 0 以外のすべての CPU が RCU の動作に依存します。 - RCU オフロードスレッドは別の CPU で RCU コールバックを実行できますが、各 CPU は対応する RCU オフロードスレッドを実行します。RCU オフロードスレッドを発生させる責任から各 CPU を利用するには、
rcu_nocb_pollカーネルパラメーターを設定します。rcu_nocb_poll
rcu_nocb_pollが設定されている場合は、RCU オフロードスレッドがタイマーによって定期的に発生し、実行するコールバックがあるかどうかを確認します。
rcu_nocbs=cpulistを使用して、すべての RCU オフロードスレッドをハウスキーピング CPU に移動できます。- 各 CPU を RCU オフロードスレッドを解除する役割から解放するために
rcu_nocb_pollを設定。
第4章 アプリケーションのチューニングとデプロイメント
注記
独自の Red Hat Enterprise Linux for Real Time アプリケーションの開発に関する詳細をお読みいただくには、RTW の記事をお読みください。
4.1. リアルタイムアプリケーションでのシグナル処理
詳細は、以下のリンクは本セクションに記載の情報に関連しています。
4.2. sched_yield および他の同期メカニズムの使用
sched_yield システムコールは、他のスレッドを実行できるスレッドによって使用されます。多くの場合、スレッド sched_yield は実行キューの最後に移動し、再スケジュールに長時間かかるか、CPU でビジーループを作成するためにすぐにスケジュールを変更することができます。スケジューラーは、実際に実行したい他のスレッドがあるかどうかを判別できます。RT タスクでは sched_yield を使用しないでください。
詳細は、以下の man ページは本セクションに記載の情報に関連しています。
- pthread.h(P)
- sched_yield(2)
- sched_yield(3p)
4.3. mutex オプション
手順4.1 標準のミューテックス作成
注記
- 標準属性で
pthread_mutex_tオブジェクトを初期化すると、プライベートで再帰的ではない不正処理および非優先度の継承 mutex が作成されます。 - pthreads の下で、ミューテックスは以下の文字列で初期化できます。
pthread_mutex_t my_mutex;

pthread_mutex_init(&my_mutex, NULL);
- この場合、アプリケーションは pthreads API および Red Hat Enterprise Linux for Real Time カーネルが提供する利点はありません。アプリケーションの書き込みまたはポート時に考慮する必要のある mutex オプションは複数あります。
手順4.2 高度なミューテックスオプション
pthread_mutexattr_t オブジェクトを作成する必要があります。このオブジェクトは、futex の定義済み属性を保存します。
重要
- mutex オブジェクトを作成します。
pthread_mutex_t my_mutex;

pthread_mutexattr_t my_mutex_attr;

pthread_mutexattr_init(&my_mutex_attr);
- 共有およびプライベートのミューテックス:共有ミューテックスはプロセス間で使用できますが、オーバーヘッドを大きくすることができます。
pthread_mutexattr_setpshared(&my_mutex_attr, PTHREAD_PROCESS_SHARED);
- リアルタイム優先度の継承:優先度の反転の問題は、優先度継承を使用して回避できます。
pthread_mutexattr_setprotocol(&my_mutex_attr, PTHREAD_PRIO_INHERIT);
- 強固なミューテックス:所有者が終了すると堅牢なミューテックスが解放されますが、オーバーヘッドのコストも高くなります。この文字列の
_NPでは、このオプションが非 POSIX であるか、移植できないかを示します。pthread_mutexattr_setrobust_np(&my_mutex_attr, PTHREAD_MUTEX_ROBUST_NP);
- mutex の初期化:属性が設定されたら、これらのプロパティーを使用して mutex を初期化します。
pthread_mutex_init(&my_mutex, &my_mutex_attr);
- attributes オブジェクトをクリーンアップします。mutex を作成したら、属性オブジェクトを保持して同じタイプのミューテックスを初期化したり、クリーンアップしたりできます。mutex はいずれの場合も影響を受けません。属性オブジェクトをクリーンアップするには、
_destroyコマンドを使用します。pthread_mutexattr_destroy(&my_mutex_attr);
mutex は通常のpthread_mutexとして通りに動作し、ロック、ロック解除、破棄が通常通りに可能になります。
詳細は、以下の man ページは本セクションに記載の情報に関連しています。
- futex(7)
- pthread_mutex_destroy(P)
pthread_mutex_tおよびpthread_mutex_initの詳細 - pthread_mutexattr_setprotocol(3p)
pthread_mutexattr_setprotocolおよびpthread_mutexattr_getprotocolの詳細 - pthread_mutexattr_setprioceiling(3p)
pthread_mutexattr_setprioceilingおよびpthread_mutexattr_getprioceilingの詳細
4.4. TCP_NODELAY および小さいバッファー書き込み
手順4.3 TCP_NODELAY および TCP_CORK を使用したネットワークレイテンシーの改善
- 送信されるすべてのパケットでレイテンシーが短いアプリケーションでは、
TCP_NODELAYが有効なソケットで実行する必要があります。これは、sockets API を使用してsetsockoptコマンドで有効にできます。# int one = 1; # setsockopt(descriptor, SOL_TCP, TCP_NODELAY, &one, sizeof(one));
- これを効果的に使用するには、アプリケーションは、小規模で論理的に関連するバッファー書き込みを実行しないようにする必要があります。
TCP_NODELAYが有効であるため、これらの小さい書き込みにより、TCP はこの複数のバッファーを個別のパケットとして送信するため、全体的なパフォーマンスが低下する可能性があります。アプリケーションに論理的に関連し、1 つのパケットとして送信された複数のバッファーがある場合は、メモリーに連続するパケットを構築し、TCP_NODELAYで設定したソケット上の TCP に論理パケットを送信することが可能です。I/O ベクトルを作成し、TCP_NODELAYで設定したソケットでwritevを使用してカーネルに渡します。 - 別の方法としては
TCP_CORKを使用する方法があります。これは 、アプリケーションがコークを削除するのを TCP に指示してからパケットを送信するよう指示します。このコマンドにより、受信するバッファーが既存のバッファーに追加されます。これにより、アプリケーションはカーネル領域にパケットを構築できます。これは、レイヤーの抽象化を提供する異なるライブラリーを使用する場合は必要です。TCP_CORKを有効にするには、setsockoptソケット API を使用して1値に設定します (これは「ソケットの修正」と呼ばれます)。# int one = 1; # setsockopt(descriptor, SOL_TCP, TCP_CORK, &one, sizeof(one));
- アプリケーションの各種コンポーネントで論理パケットがカーネルにビルドされたら、コードを削除するように TCP に指示します。TCP は、アプリケーションからのパケットをこれ以上待たずに、累積された論理パケットをすぐに送信します。
# int zero = 0;

# setsockopt(descriptor, SOL_TCP, TCP_CORK, &zero, sizeof(zero));
詳細は、以下の man ページは本セクションに記載の情報に関連しています。
- tcp(7)
- setsockopt(3p)
- setsockopt(2)
4.5. リアルタイムスケジューラーの優先度の設定
systemd を使用するには、手順3.1「systemd の使用による優先順位の設定」 を参照してください。この例では、一部のカーネルスレッドに非常に高い優先順位が付与されている可能性があります。これは、デフォルトの優先度が Real Time Specification for Java (RTSJ) の要件と適切に統合されるようにします。RTSJ には 10 から 89 までの優先度の範囲が必要です。
一般的には、root ユーザーのみが優先順位やスケジューリングの情報を変更できます。非特権ユーザーがこれらの設定を調整できるようにする必要がある場合は、ユーザーを realtime グループに追加する方法が最適です。
重要
/etc/security/limits.conf ファイルを編集してユーザー権限を変更することもできます。これにより重複が発生する可能性があり、通常のユーザーにシステムが使用できなくなる可能性があります。このファイルを編集する場合は、必ず変更を 行う 前にコピーを作成してください。
4.6. 動的ライブラリーの読み込み
LD_BIND_NOW 変数に動的リンカー/ローダーを設定することにより ld.so、アプリケーションの起動時にロードするよう指示されます。
LD_BIND_NOW 変数を 1 の値でエクスポートし、FIFO のスケジューラーポリシーと 1 の優先度でプログラムを実行します。
#!/bin/sh

LD_BIND_NOW=1
export LD_BIND_NOW

chrt --fifo 1 /opt/myapp/myapp-server &
詳細は、以下の man ページは本セクションに記載の情報に関連しています。
- ld.so(8)
4.7. アプリケーションのタイムスタンプに _COARSE POSIX クロックを使用
clock_gettime() 関数とともに POSIX クロックで可能な限り低いクロック読み取りを作成することで、パフォーマンスの向上を向上できます。
POSIX クロックは、タイムソースを実装して表すための標準です。POSIX クロックは、システムの他のアプリケーションに影響を及ぼさずに、各アプリケーションで選択できます。これは、「システムタイムスタンプでのハードウェアクロックの使用」 で説明されているハードウェアクロックとは対照的です。これは、カーネルにより選択され、システム全体で実装されます。
clock_gettime() です。これは <time.h> で定義されています。clock_gettime() は、カーネルに、システムコールの形式で対応するものを持ちます。ユーザープロセスが clock_gettime() を呼び出す際に 、対応する C ライブラリー (glibc) が要求された操作を実行する sys_clock_gettime() システムコールを呼び出し、その結果をユーザープログラムに返します。
CLOCK_MONOTONIC_COARSE および CLOCK_REALTIME_COARSE POSIX クロックのサポートが VDSO ライブラリー機能の形式で作成されました。
_COARSE クロックバリアントのいずれかを使用して clock_gettime() で行われる時間読み取りは、カーネルの介入を必要とせず、ユーザー空間で完全に実行されるため、パフォーマンスが大幅に向上します。クロックの時間読み取り _COARSE の解像度はミリ秒 (ミリ秒) です。つまり、1ms 未満の時間間隔は記録されません。POSIX クロックの _COARSE バリアントは、ミリ秒間のクロック解像度に対応できるすべてのアプリケーションに適しています。また、読み取りコストが高いハードウェアクロックを使用するシステムでは、より明確になります。
注記
_COARSE 接頭辞のありなしで比較するには、Red Hat Enterprise Linux for Real Time Reference guide for Red Hat Enterprise Linux for Real Time を参照してください。
例4.1 clock_gettime での _COARSE クロックバリアントの使用
#include <time.h>

main()
{
	int rc;
	long i;
	struct timespec ts;

	for(i=0; i<10000000; i++) {
		rc = clock_gettime(CLOCK_MONOTONIC_COARSE, &ts);
	}
}
clock_gettime() の戻りコードの検証または rc 変数の値の確認を行うか、ts 構造の内容が信頼されるようにすることで、上記の例を改善できます。clock_gettime() man ページは、より信頼できるアプリケーションを作成するのに役立つより多くの情報を提供します。
重要
clock_gettime() 関数を使用するプログラムは、gcc コマンドライン '-lrt' に追加して rt ライブラリーにリンクする必要があります。
~]$ gcc clock_timing.c -o clock_timing -lrt
詳細は、以下の man ページと書籍は本セクションに記載の情報に関連しています。
- clock_gettime()
- 『Linux System Programming』 by Robert Love
- 『Understanding The Linux Kernel』 by Daniel P. Bovet and Marco Cesati
4.8. perf について
perf_events インターフェースに基づいています。
root でコマンドを実行して perf パッケージをインストールします。
~]# yum install perfperf help COMMAND を参照してください。
例4.2 perf オプションの例
]# perf

 usage: perf [--version] [--help] COMMAND [ARGS]

 The most commonly used perf commands are:
   annotate        Read perf.data (created by perf record) and display annotated code
   archive         Create archive with object files with build-ids found in perf.data file
   bench           General framework for benchmark suites
   buildid-cache   Manage build-id cache.
   buildid-list    List the buildids in a perf.data file
   diff            Read two perf.data files and display the differential profile
   evlist          List the event names in a perf.data file
   inject          Filter to augment the events stream with additional information
   kmem            Tool to trace/measure kernel memory(slab) properties
   kvm             Tool to trace/measure kvm guest os
   list            List all symbolic event types
   lock            Analyze lock events
   record          Run a command and record its profile into perf.data
   report          Read perf.data (created by perf record) and display the profile
   sched           Tool to trace/measure scheduler properties (latencies)
   script          Read perf.data (created by perf record) and display trace output
   stat            Run a command and gather performance counter statistics
   test            Runs sanity tests.
   timechart       Tool to visualize total system behavior during a workload
   top             System profiling tool.
   trace           strace inspired tool
   probe           Define new dynamic tracepoints

See 'pert help COMMAND' for more information on a specific command.
例4.3 perf レコード
~]# perf record -a
^C[ perf record: Woken up 1 times to write data ]
[ perf record: Captured and wrote 0.725 MB perf.data (~31655 samples) ]
-a で示され、数秒後にプロセスが終了しています。その結果は、0.725 MB のデータを収集し、以下の結果ファイルを作成していることが示されています。
~]# ls
perf.data
例4.4 perf レポートおよびアーカイブ機能の例
record 機能からのデータは、perf report コマンドを使用して直接調査できるようになりました。サンプルが異なるシステムで分析する場合は、perf archive コマンドを使用します。~/.debug/ キャッシュなどの解析システムに、DSO (バイナリーやライブラリーなど) がすでに存在する場合や、両方のシステムに同じバイナリーセットがある場合など、これは常に必要になるわけではありません。
~]# perf archivereport のデータを準備します。
~]# tar xvf perf.data.tar.bz2 -C ~/.debugreport を実行して tarball を分析します。
~]# perf report[kernel.kallsyms] 表記のマークが付けられます。カーネルモジュールでカーネルサンプルを実行すると、[module]、[ext4] のマークが付けられます。ユーザー空間のプロセスでは、プロセスにリンクした共有ライブラリーが結果に表示される可能性があります。
[.] はユーザースペースを示し、[k] はカーネル領域を示します。経験のある perf 開発者に適したデータなど、詳細を確認することができます。
例4.5 perf list および stat 機能の例
stat 機能を使用してコンテキストスイッチの数を表示する方法を示しています。
~]# perf stat -e context-switches -a sleep 5
Performance counter stats for 'sleep 5':

            15,619 context-switches

       5.002060064 seconds time elapsed
~]# for i in {1..100}; do touch /tmp/$i; sleep 1; donestat 機能を実行します。
~]# perf stat -e ext4:ext4_request_inode -a sleep 5
 Performance counter stats for 'sleep 5':

                 5 ext4:ext4_request_inode

       5.002253620 seconds time elapsed
list 機能のオプションの選択を示しています。
List of pre-defined events (to be used in -e):
  cpu-cycles OR cycles                               [Hardware event]
  stalled-cycles-frontend OR idle-cycles-frontend    [Hardware event]
  stalled-cycles-backend OR idle-cycles-backend      [Hardware event]
  instructions                                       [Hardware event]
  cache-references                                   [Hardware event]
  cache-misses                                       [Hardware event]
  branch-instructions OR branches                    [Hardware event]
  branch-misses                                      [Hardware event]
  bus-cycles                                         [Hardware event]

  cpu-clock                                          [Software event]
  task-clock                                         [Software event]
  page-faults OR faults                              [Software event]
  minor-faults                                       [Software event]
  major-faults                                       [Software event]
  context-switches OR cs                             [Software event]
  cpu-migrations OR migrations                       [Software event]
  alignment-faults                                   [Software event]
  emulation-faults                                   [Software event]
  ...[output truncated]...
重要
第5章 詳細情報
5.1. バグの報告
バグレポートを作成する前に、以下の手順に従って、問題発生場所を診断します。これにより、問題解決に大きくサポートします。
- 最新バージョンの Red Hat Enterprise Linux 7 カーネルがあることを確認してから、GRUB メニューから起動します。問題を標準カーネルで再現してみてください。問題が解決しない場合は、Red Hat Enterprise Linux 7 にバグを報告してください。
- 標準カーネルの使用時に問題が発生しなかった場合は、Red Hat Enterprise Linux for Real Time 固有の機能拡張 Red Hat がベースライン (3.10.0) カーネルに適用したバグにより、バグにより変更が加えられる可能性があります。
バグが Red Hat Enterprise Linux for Real Time に固有であると判断した場合は、以下の手順に従ってバグレポートを入力します。
- Bugzilla アカウントがまだない場合には作成します。
- Enter A New Bug Report をクリックします。必要な場合はログインします。
Red Hat分類を選択します。Red Hat Enterprise Linux 7製品を選択します。- カーネルの問題である場合は、コンポーネントとして
kernel-rtを入力します。それ以外の場合は、trace-cmdなどの影響を受けるユーザー空間コンポーネントの名前を入力します。 - 問題を詳細に説明して、バグ情報の入力を継続します。問題の説明を入力する際には、標準の Red Hat Enterprise Linux 7 カーネルで問題を再現できるかどうかの詳細情報が含まれるようにします。
付録A イベントトレース
付録B Ftrace の詳細説明
ftrace - Linux kernel internal tracer
Introduction
------------
Ftrace is an internal tracer for the Linux kernel. It is designed to
follow the processing of what happens within the kernel as that is
normally a black box. It allows the user to trace kernel functions
that are called in real time, as well as to see various events like
tasks scheduling, interrupts, disk activity and other services that
the kernel provides.
Ftrace was intorduced to Linux in the 2.6.27 kernel, and has increased
in functionality ever since. It is not meant to trace what is happening
inside user applications, but can be used to trace within system calls
that user applications make.
The Debug File System
---------------------
The user interface for ftrace is a series of files within the debug
file system that is usually mounted at /sys/kernel/debug. The ftrace
files are in the tracing directory that can be accessed at
/sys/kernel/debug/tracing.
Note, there is also a user interface tool called trace-cmd. See later
in this document for more information about that tool.
In order to mount the debug filesystem, perform the following:
mount -t debugfs nodev /sys/kernel/debug
Then you can change directory into the ftrace tracing location:
cd /sys/kernel/debug/tracing
Note, all these files can only be modified by root user, as enabling
tracing can have an impact on the performance of the system.
Ftrace files
------------
The main files within this directory are:
trace - the file that shows the output of a ftrace trace. This is
really a snapshot of the trace in time, as it stops tracing as
this file is read, and it does not consume the events read.
That is, if the user disabled tracing and read this file, it
will always report the same thing every time its read.
Also, to clear the trace buffer, simply write into this file.
># echo > trace
This will erase the entire contents of the trace buffer.
trace_pipe - like "trace" but is used to read the trace live. It is
a producer / consumer trace, where each read will consume the
event that is read. But this can be used to see an active trace
without stopping the trace as it is read.
available_tracers - a list of ftrace tracers that have been compiled
into the kernel.
current_tracer - enables or disables a ftrace tracer
events - a directory that contains events to trace and can be used
to enable or disable events as well as set filters for the events
tracing_on - disable and enable recording to the ftrace buffer.
Note, disabling tracing via the tracing_on file does not disable
the actual tracing that is happening inside the kernel. It only
disables writing to the buffer. The work to do the trace still
happens, but the data does not go anywhere.
There are several other files, but we will get to them as they come
up with functionalities of the tracers.
Tracers and Events
------------------
Tracers have specific functionality within the kernel, where as events
are just some kind of data that is recorded into the ftrace buffer.
To understand this more, we need to take a look at the tracers themselves
and the events as well.
nop
---
The default tracer is called "nop". It is just a nop tracer, and does not
provide any tracing facility itself. But, as events may interleave into
any tracer, the "nop" tracer is what is used if you are only interested
in tracing events.
When the "nop" tracer is active and the trace buffer is empty, the "trace"
file shows the following:
># cat trace
# tracer: nop
#
# entries-in-buffer/entries-written: 0/0 #P:8
#
# _-------=> irqs-off
# / _------=> need-resched
# |/ _-----=> need-resched_lazy
# ||/ _----=> hardirq/softirq
# |||/ _---=> preempt-depth
# ||||/ _--=> preempt-lazy-depth
# ||||| / _-=> migrate-disable
# |||||| / delay
# TASK-PID CPU# ||||||| TIMESTAMP FUNCTION
# | | | ||||||| | |
It starts with what tracer is active and then gives a default header.
Now to enable an event, you must write an ASCII '1' into the "enable"
file for the particular event.
># echo 1 > events/sched/sched_switch/enable
># cat trace
# tracer: nop
#
# entries-in-buffer/entries-written: 463/463 #P:8
#
# _-------=> irqs-off
# / _------=> need-resched
# |/ _-----=> need-resched_lazy
# ||/ _----=> hardirq/softirq
# |||/ _---=> preempt-depth
# ||||/ _--=> preempt-lazy-depth
# ||||| / _-=> migrate-disable
# |||||| / delay
# TASK-PID CPU# ||||||| TIMESTAMP FUNCTION
# | | | ||||||| | |
bash-1367 [007] d...... 11927.750484: sched_switch: prev_comm=bash prev_pid=1367 prev_prio=120 prev_state=S ==> next_comm=kworker/7:1 next_pid=121 next_prio=120
kworker/7:1-121 [007] d...... 11927.750514: sched_switch: prev_comm=kworker/7:1 prev_pid=121 prev_prio=120 prev_state=S ==> next_comm=swapper/7 next_pid=0 next_prio=120
<idle>-0 [000] d...... 11927.750531: sched_switch: prev_comm=swapper/0 prev_pid=0 prev_prio=120 prev_state=R ==> next_comm=sshd next_pid=1365 next_prio=120
<idle>-0 [007] d...... 11927.750555: sched_switch: prev_comm=swapper/7 prev_pid=0 prev_prio=120 prev_state=R ==> next_comm=kworker/7:1 next_pid=121 next_prio=120
kworker/7:1-121 [007] d...... 11927.750575: sched_switch: prev_comm=kworker/7:1 prev_pid=121 prev_prio=120 prev_state=S ==> next_comm=swapper/7 next_pid=0 next_prio=120
sshd-1365 [000] d...... 11927.750673: sched_switch: prev_comm=sshd prev_pid=1365 prev_prio=120 prev_state=S ==> next_comm=swapper/0 next_pid=0 next_prio=120
<idle>-0 [001] d...... 11927.752568: sched_switch: prev_comm=swapper/1 prev_pid=0 prev_prio=120 prev_state=R ==> next_comm=kworker/1:1 next_pid=57 next_prio=120
<idle>-0 [002] d...... 11927.752589: sched_switch: prev_comm=swapper/2 prev_pid=0 prev_prio=120 prev_state=R ==> next_comm=rcu_sched next_pid=10 next_prio=120
kworker/1:1-57 [001] d...... 11927.752590: sched_switch: prev_comm=kworker/1:1 prev_pid=57 prev_prio=120 prev_state=S ==> next_comm=swapper/1 next_pid=0 next_prio=120
rcu_sched-10 [002] d...... 11927.752610: sched_switch: prev_comm=rcu_sched prev_pid=10 prev_prio=120 prev_state=S ==> next_comm=swapper/2 next_pid=0 next_prio=120
<idle>-0 [007] d...... 11927.753548: sched_switch: prev_comm=swapper/7 prev_pid=0 prev_prio=120 prev_state=R ==> next_comm=rcu_sched next_pid=10 next_prio=120
rcu_sched-10 [007] d...... 11927.753568: sched_switch: prev_comm=rcu_sched prev_pid=10 prev_prio=120 prev_state=S ==> next_comm=swapper/7 next_pid=0 next_prio=120
<idle>-0 [007] d...... 11927.755538: sched_switch: prev_comm=swapper/7 prev_pid=0 prev_prio=120 prev_state=R ==> next_comm=kworker/7:1 next_pid=121 next_prio=120
As you can see there is quite a lot of information that is displayed
by simply enabling the sched_switch event.
Events
------
The events are broken up into "systems". Each system of events has its
own directory under the "events" directory located in the ftrace "tracing"
directory in the debug file system.
># ls -F events
block/ header_event lock/ printk/ skb/ vsyscall/
compaction/ header_page mce/ random/ sock/ workqueue/
drm/ i915/ migrate/ raw_syscalls/ sunrpc/ writeback/
enable irq/ module/ rcu/ syscalls/
ext4/ jbd2/ napi/ rpm/ task/
ftrace/ kmem/ net/ sched/ timer/
hda/ kvm/ oom/ scsi/ udp/
hda_intel/ kvmmmu/ power/ signal/ vmscan/
Each of these directories represent a system or group of events. Notice that
there's three files in this directory:
enable
header_event
header_page
The only one you should be concerned about is the "enable" file, as that
will enable all events when an ASCII '1' is written into it and disable
all events when an ASCII '0' is written into it.
The header_event and header_page provides information necessary for
the trace-cmd tool.
Each of these directories shows the events that are within that system:
># ls -F events/sched
enable sched_process_exit/ sched_stat_sleep/
filter sched_process_fork/ sched_stat_wait/
sched_kthread_stop/ sched_process_free/ sched_switch/
sched_kthread_stop_ret/ sched_process_wait/ sched_wait_task/
sched_migrate_task/ sched_stat_blocked/ sched_wakeup/
sched_pi_setprio/ sched_stat_iowait/ sched_wakeup_new/
sched_process_exec/ sched_stat_runtime/
Each directory here represents a single event. Notice that there's two
files in the system directory:
enable
filter
The "enable" file here can enable or disable all events within the system
when an ASCII '1' or '0', respectively, is written to this file.
The "filter" file will be described shortly.
Within the individual event directories exist control files:
># ls -F events/sched/sched_wakeup/
enable filter format id
We already used the "enable" file. Now to explain the other files.
The "format" file shows the fields that are written when the event
is enabled, as well as the fields that can be used for the filter.
The "id" file is used by the perf tool and is not something that needs
to be delt with here.
># cat events/sched/sched_wakeup/format
name: sched_wakeup
ID: 249
format:
field:unsigned short common_type; offset:0; size:2; signed:0;
field:unsigned char common_flags; offset:2; size:1; signed:0;
field:unsigned char common_preempt_count; offset:3; size:1; signed:0;
field:int common_pid; offset:4; size:4; signed:1;
field:unsigned short common_migrate_disable; offset:8; size:2; signed:0;
field:unsigned short common_padding; offset:10; size:2; signed:0;
field:char comm[16]; offset:16; size:16; signed:1;
fieldid_t pid; offset:32; size:4; signed:1;
field:int prio; offset:36; size:4; signed:1;
field:int success; offset:40; size:4; signed:1;
field:int target_cpu; offset:44; size:4; signed:1;
print fmt: "comm=%s pid=%d prio=%d success=%d target_cpu=%03d", REC->comm, REC->pid, REC->prio, REC->success, REC->target_cpu
This file is also used by perf and trace-cmd to tell how to read the
raw binary output from the tracing buffers for the event. But what you
need to know is the field names, as they are used by the filtering.
The first set of fields before the blank line are the common fields that
exist for all events. The specific fields for the event come after the
blank line and here it starts with "comm".
Filtering events
----------------
There are times when you may not want to trace all events, but only
events where one of the event's fields contains a certain value.
The "filter" file allows for this.
The filter provides the following predicates:
For numerical fields:
==, !=, <, <=, >, >=
For string fields:
==, !=, ~
Logical && and || as well as parenthesis are also acceptable.
The syntax is
<filter> = FIELD <pred-num> | FIELD <pred-string> |
'(' <filter> ')' | <filter> '&&' <filter> | <filter> '||' <filter>
<pred-num> = <num-op> <number>
<pred-string> = <string-op> <string>
<num-op> = '==' | '!=' | '<' | '<=' | '>' | '>='
<string-op> = '==' | '!=' | '~'
<number> = <digits> | '0x'<hex-number>
<digits> = [0-9] | <digits><digits>
<hex-number> = [0-9] | [a-f] | [A-F] | <hex-number><hex-number>
<string> = '"' VALUE '"'
The glob expression '~' is a very simple glob. it can only be:
<glob> = VALUE | '*' VALUE | VALUE '*' | '*' VALUE '*'
That is, anything more complex will not be valid. Such as:
VALUE '*' VALUE
What the glob does is to match a string with wild cards at the beginning
or end or both, of a value:
comm ~ "kwork*"
Example:
To trace all schedule switches to a real time task:
># echo 'next_prio < 100' > events/sched/sched_switch/filter
># cat events/sched/sched_switch/filter
next_prio < 100
># cat trace
# tracer: nop
#
# entries-in-buffer/entries-written: 11/11 #P:8
#
# _-------=> irqs-off
# / _------=> need-resched
# |/ _-----=> need-resched_lazy
# ||/ _----=> hardirq/softirq
# |||/ _---=> preempt-depth
# ||||/ _--=> preempt-lazy-depth
# ||||| / _-=> migrate-disable
# |||||| / delay
# TASK-PID CPU# ||||||| TIMESTAMP FUNCTION
# | | | ||||||| | |
<idle>-0 [001] d...... 14331.192687: sched_switch: prev_comm=swapper/1 prev_pid=0 prev_prio=120 prev_state=R ==> next_comm=rtkit-daemon next_pid=992 next_prio=0
<idle>-0 [001] d...... 14333.737030: sched_switch: prev_comm=swapper/1 prev_pid=0 prev_prio=120 prev_state=R ==> next_comm=watchdog/1 next_pid=12 next_prio=0
<idle>-0 [000] d...... 14333.738023: sched_switch: prev_comm=swapper/0 prev_pid=0 prev_prio=120 prev_state=R ==> next_comm=watchdog/0 next_pid=11 next_prio=0
<idle>-0 [002] d...... 14333.751985: sched_switch: prev_comm=swapper/2 prev_pid=0 prev_prio=120 prev_state=R ==> next_comm=watchdog/2 next_pid=17 next_prio=0
<idle>-0 [003] d...... 14333.765947: sched_switch: prev_comm=swapper/3 prev_pid=0 prev_prio=120 prev_state=R ==> next_comm=watchdog/3 next_pid=22 next_prio=0
<idle>-0 [004] d...... 14333.779933: sched_switch: prev_comm=swapper/4 prev_pid=0 prev_prio=120 prev_state=R ==> next_comm=watchdog/4 next_pid=27 next_prio=0
<idle>-0 [005] d...... 14333.794114: sched_switch: prev_comm=swapper/5 prev_pid=0 prev_prio=120 prev_state=R ==> next_comm=watchdog/5 next_pid=32 next_prio=0
Task priorities
---------------
This is a good time to explain task priorities, as the tracer reports them
differently than the way user processes see priorities. A task has priority
policies that are SCHED_OTHER, SCHED_FIFO and SCHED_RR. By default
tasks are assigned SCHED_OTHER which runs under the kernels Completely
Fail Scheduler (CFS), where as SCHED_FIFO and SCHED_RR runs under
the real-time scheduler. The real-time scheduler has 99 different priorities
ranging from 1 - 99, where 99 is the highest priority and 1 is the lowest.
This is set by sched_setscheduler(2).
If you noticed above, to show real time tasks, the filter used
"next_prio < 100". Ftrace reports the internal kernel version of priorities
for tasks and not the priority that a task sees. This can be a little
confusing. For user real-time priorities of 1 through 99 are mapped
internally as 98 to 0, where 0 is the highest priority and 98 is the lowest
of the real time priorities. All non real-time tasks show a priority of 120,
as CFS does not use the priority to determine which tasks to run, although
it does use a nice value, but that's not represented by the prio field
reported in the traces.
Tracers
-------
Depending on how the kernel was configured, not all tracers may be available
for a given kernel.For the Red Hat Enterprise Linux for Real Time kernels, the trace and debug kernels have
different tracers than the production kernel does. This is because some
of the tracers have a noticeable overhead when the tracer is configured
into the kernel but not active. Those tracers are only enabled for
the trace and debug kernels.
To see what tracers are available for the kernel, cat out the contents
of "available_tracers":
># cat available_tracers
function_graph wakeup_rt wakeup preemptirqsoff preemptoff irqsoff function nop
The "nop" tracer has already been discussed and is available in all
kernels.
The "function" tracer
---------------------
The most popular tracer aside from the "nop" tracer is the "function"
tracer. This tracer traces the function calls within the kernel.
Depending on how many functions are tracer or which specific functions,
it can cause a very noticeable overhead when tracing is active.
Note, due to a clever trick with code modification, the function tracer
induces very little overhead when not active. This is because the
hooks in the function calls to be traced are converted into nops on
boot, and are only converted back to hooks into the tracer when activated.
># echo function > current_tracer
># cat trace
# tracer: function
#
# entries-in-buffer/entries-written: 319338/253106705 #P:8
#
# _-------=> irqs-off
# / _------=> need-resched
# |/ _-----=> need-resched_lazy
# ||/ _----=> hardirq/softirq
# |||/ _---=> preempt-depth
# ||||/ _--=> preempt-lazy-depth
# ||||| / _-=> migrate-disable
# |||||| / delay
# TASK-PID CPU# ||||||| TIMESTAMP FUNCTION
# | | | ||||||| | |
kworker/5:1-58 [005] ....... 32462.200700: smp_call_function_single <-cpufreq_get_measured_perf
kworker/5:1-58 [005] d...... 32462.200700: read_measured_perf_ctrs <-smp_call_function_single
kworker/5:1-58 [005] ....... 32462.200701: cpufreq_cpu_put <-__cpufreq_driver_getavg
kworker/5:1-58 [005] ....... 32462.200702: module_put <-cpufreq_cpu_put
kworker/5:1-58 [005] ....... 32462.200702: od_check_cpu <-dbs_check_cpu
kworker/5:1-58 [005] ....... 32462.200702: usecs_to_jiffies <-od_dbs_timer
kworker/5:1-58 [005] ....... 32462.200703: schedule_delayed_work_on <-od_dbs_timer
kworker/5:1-58 [005] ....... 32462.200703: queue_delayed_work_on <-schedule_delayed_work_on
kworker/5:1-58 [005] d...... 32462.200704: __queue_delayed_work <-queue_delayed_work_on
kworker/5:1-58 [005] d...... 32462.200704: get_work_gcwq <-__queue_delayed_work
kworker/5:1-58 [005] d...... 32462.200704: get_cwq <-__queue_delayed_work
kworker/5:1-58 [005] d...... 32462.200705: add_timer_on <-__queue_delayed_work
kworker/5:1-58 [005] d...... 32462.200705: _raw_spin_lock_irqsave <-add_timer_on
kworker/5:1-58 [005] d...... 32462.200705: internal_add_timer <-add_timer_on
Filtering on functions
----------------------
As tracing all functions can be induce a substantial overhead, as well
as adding a lot of noise to the trace (you may not be interested in every
function call), ftrace provides a way to limit what functions can be
traced. There are two files for this purpose:
set_ftrace_filter
set_ftrace_notrace
For a list of functions that can be traced, as well as added to these files:
available_filter_functions
By writing a name of a function into the "set_ftrace_filter" file, the
function tracer will only trace that function.
># echo schedule_delayed_work > set_ftrace_filter
># cat set_ftrace_filter
schedule_delayed_work
># cat trace
# tracer: function
#
# entries-in-buffer/entries-written: 8/8 #P:8
#
# _-------=> irqs-off
# / _------=> need-resched
# |/ _-----=> need-resched_lazy
# ||/ _----=> hardirq/softirq
# |||/ _---=> preempt-depth
# ||||/ _--=> preempt-lazy-depth
# ||||| / _-=> migrate-disable
# |||||| / delay
# TASK-PID CPU# ||||||| TIMESTAMP FUNCTION
# | | | ||||||| | |
kworker/0:2-1586 [000] ....... 32820.361913: schedule_delayed_work <-vmstat_update
kworker/2:1-62 [002] ....... 32820.370891: schedule_delayed_work <-vmstat_update
kworker/3:2-5004 [003] ....... 32820.373881: schedule_delayed_work <-vmstat_update
kworker/0:2-1586 [000] ....... 32820.448658: schedule_delayed_work <-do_cache_clean
kworker/4:1-61 [004] ....... 32820.537541: schedule_delayed_work <-vmstat_update
kworker/4:1-61 [004] ....... 32820.537546: schedule_delayed_work <-sync_cmos_clock
kworker/7:1-121 [007] ....... 32820.897372: schedule_delayed_work <-vmstat_update
kworker/1:1-57 [001] ....... 32820.898361: schedule_delayed_work <-vmstat_update
Note, modifications to these files follows shell concatenation rules:
># cat set_ftrace_filter
schedule_delayed_work
># echo do_IRQ > set_ftrace_filter
># cat set_ftrace_filter
do_IRQ
Notice that writing with '>' into set_ftrace_filter cleared what was
currently in the file and replaced it with the new contents. Just
writing into the file will clear it:
># cat set_ftrace_filter
do_IRQ
># echo > set_ftrace_filter
># cat set_ftrace_filter
#### all functions enabled ####
To append to the list, use the shell append operation '>>':
># cat set_ftrace_filter
do_IRQ
># echo schedule_delayed_work >> set_ftrace_filter
># cat set_ftrace_filter
schedule_delayed_work
do_IRQ
Note, the order of functions displayed has nothing to do with how they
were added. Their order is dependent upon how the functions are layed
out in the kernel internal function list table.
Globs
-----
Functions can be added to these files with the same type of glob
expressions described in the event filtering section. The format is
identical:
<glob> = VALUE | '*' VALUE | VALUE '*' | '*' VALUE '*'
If you want to trace all functions that start with "sched":
># echo 'sched*' > set_ftrace_filter
># cat set_ftrace_filter
schedule_delayed_work_on
schedule_delayed_work
schedule_work_on
schedule_work
schedule_on_each_cpu
sched_feat_open
sched_feat_show
[...]
># echo function > current_tracer
># cat trace
# tracer: function
#
# entries-in-buffer/entries-written: 1270/1270 #P:8
#
# _-------=> irqs-off
# / _------=> need-resched
# |/ _-----=> need-resched_lazy
# ||/ _----=> hardirq/softirq
# |||/ _---=> preempt-depth
# ||||/ _--=> preempt-lazy-depth
# ||||| / _-=> migrate-disable
# |||||| / delay
# TASK-PID CPU# ||||||| TIMESTAMP FUNCTION
# | | | ||||||| | |
bash-1367 [001] ....... 34240.654888: schedule_work <-tty_flip_buffer_push
bash-1367 [001] .N..... 34240.654902: schedule <-sysret_careful
kworker/1:1-57 [001] ....... 34240.654921: schedule <-worker_thread
<idle>-0 [000] .N..... 34240.654949: schedule <-cpu_idle
bash-1367 [001] ....... 34240.655069: schedule_work <-tty_flip_buffer_push
bash-1367 [001] .N..... 34240.655079: schedule <-sysret_careful
sshd-1365 [000] ....... 34240.655087: schedule_timeout <-wait_for_common
sshd-1365 [000] ....... 34240.655088: schedule <-schedule_timeout
set_ftrace_notrace
------------------
There are cases were you may want to trace everything except for various
functions that you don't care about. Perhaps there's functions that cause
too much noise in the trace, for example, perhaps locks are showing
up in the trace and you don't care about them:
># echo '*lock*' > set_ftrace_notrace
># cat set_ftrace_notrace
update_persistent_clock
read_persistent_clock
set_task_blockstep
user_enable_block_step
read_hv_clock
__acpi_acquire_global_lock
__acpi_release_global_lock
cpu_hotplug_driver_lock
cpu_hotplug_driver_unlock
[...]
But notice that you also included functions that have "clock" and "block"
in their names. To remove them but still keep the "lock" functions, use
the '!' symbol:
># echo '!*clock*' >> set_ftrace_notrace
># echo '!*block*' >> set_ftrace_notrace
># cat set_ftrace_notrace
__acpi_acquire_global_lock
__acpi_release_global_lock
cpu_hotplug_driver_lock
cpu_hotplug_driver_unlock
lock_vector_lock
unlock_vector_lock
console_lock
console_trylock
console_unlock
is_console_locked
kmsg_dump_get_line_nolock
[...]
But remember to use '>>' instead of '>', as that will clear out all
functions in the file.
Latency tracers
---------------
As stated, the difference between events and tracers, is that events
just enable recording some specific information within the kernel.
Traces have a bit more impact. Function tracing, in essence, also
just records information, but it requires a bit more work than enabling
a static tracepoint (event). Also, to limit what function tracing can
trace, requires writing into control files for the function tracer.
Another type of tracer is the latency tracers. These record a snapshot
of the trace when the latency is greater than the previously recorded
latency. There are two types of latency tracers, one kind records the
length of time when activities within the kernel are disabled, and the
other records the time it takes from when a task is woken from sleep
to the time it gets scheduled.
tracing_max_latency
-------------------
A latency tracer will just keep track of a snapshot of a trace when a new
max latency is hit. To see the current max latency time, cat the contents
of the file "tracing_max_latency". This file can also be used to set
the max time. Either to reset it back to zero or some lesser number to
trigger new snapshots of latencies, or to set it to a greater number to
not record anything unless a latency has exceeded some given time.
The unit of time that "tracing_max_latency" uses (as well as all other
tracing files, unless otherwise specified) is microseconds.
irqsoff tracer
--------------
A common use of the tracing facility is to see how long interrupts have
been disabled for. When interrupts are disabled, the system cannot
respond to external events, which can include a packet coming in on the
network card, or perhaps a task on another CPU woke up a task on the current
CPU and sent an interprocessor interrupt (IPI) to tell the current CPU
to run the new task. With interrupts disabled, the current CPU will
ignore all external events, which is a source of latencies. This is why
monitorying how long interrupts are disabled can show why the system
did not react in a proper time that was expected.
The irqsoff tracer traces the time interrupts are disabled to the time
they are enabled again. If the time interrupts were disabled is larger
than the time specified by "tracing_max_latency" has, then it will
save the current trace off to a "snapshot" buffer, reset the current
buffer and continue tracing looking for the next time interrupts
are off for a long time.
Here's an example of how to use irqsoff tracer:
># echo 0 > tracing_max_latency
># echo irqsoff > current_tracer
># sleep 10
># cat trace
# tracer: irqsoff
#
# irqsoff latency trace v1.1.5 on 3.8.13-test-mrg-rt9+
# --------------------------------------------------------------------
# latency: 523 us, #1301/1301, CPU#2 | (Mreempt VP:0, KP:0, SP:0 HP:0 #P:8)
# -----------------
# | task: swapper/2-0 (uid:0 nice:0 policy:0 rt_prio:0)
# -----------------
# => started at: cpu_idle
# => ended at: cpu_idle
#
#
# _--------=> CPU#
# / _-------=> irqs-off
# | / _------=> need-resched
# || / _-----=> need-resched_lazy
# ||| / _----=> hardirq/softirq
# |||| / _---=> preempt-depth
# ||||| / _--=> preempt-lazy-depth
# |||||| / _-=> migrate-disable
# ||||||| / delay
# cmd pid |||||||| time | caller
# \ / |||||||| \ | /
<idle>-0 2dN..1.. 0us : tick_nohz_idle_exit <-cpu_idle
<idle>-0 2dN..1.. 1us : menu_hrtimer_cancel <-tick_nohz_idle_exit
<idle>-0 2dN..1.. 1us : ktime_get <-tick_nohz_idle_exit
<idle>-0 2dN..1.. 1us : tick_do_update_jiffies64 <-tick_nohz_idle_exit
<idle>-0 2dN..1.. 2us : update_cpu_load_nohz <-tick_nohz_idle_exit
<idle>-0 2dN..1.. 2us : _raw_spin_lock <-update_cpu_load_nohz
<idle>-0 2dN..1.. 3us : add_preempt_count <-_raw_spin_lock
<idle>-0 2dN..2.. 3us : __update_cpu_load <-update_cpu_load_nohz
<idle>-0 2dN..2.. 4us : sub_preempt_count <-update_cpu_load_nohz
<idle>-0 2dN..1.. 4us : calc_load_exit_idle <-tick_nohz_idle_exit
<idle>-0 2dN..1.. 5us : touch_softlockup_watchdog <-tick_nohz_idle_exit
<idle>-0 2dN..1.. 5us : hrtimer_cancel <-tick_nohz_idle_exit
[...]
<idle>-0 2dN..1.. 521us : account_idle_time <-irqtime_account_process_tick.isra.2
<idle>-0 2dN..1.. 521us : irqtime_account_process_tick.isra.2 <-account_idle_ticks
<idle>-0 2dN..1.. 521us : nsecs_to_jiffies64 <-irqtime_account_process_tick.isra.2
<idle>-0 2dN..1.. 522us : nsecs_to_jiffies64 <-irqtime_account_process_tick.isra.2
<idle>-0 2dN..1.. 522us : account_idle_time <-irqtime_account_process_tick.isra.2
<idle>-0 2dN..1.. 522us : irqtime_account_process_tick.isra.2 <-account_idle_ticks
<idle>-0 2dN..1.. 522us : nsecs_to_jiffies64 <-irqtime_account_process_tick.isra.2
<idle>-0 2dN..1.. 523us : nsecs_to_jiffies64 <-irqtime_account_process_tick.isra.2
<idle>-0 2dN..1.. 523us : account_idle_time <-irqtime_account_process_tick.isra.2
<idle>-0 2dN..1.. 523us : tick_nohz_idle_exit <-cpu_idle
<idle>-0 2dN..1.. 524us+: trace_hardirqs_on <-cpu_idle
<idle>-0 2dN..1.. 537us : <stack trace>
=> tick_nohz_idle_exit
=> cpu_idle
=> start_secondary
By default, the irqsoff tracer enables function tracing to show what functions
are being called while interrupts were disabled. But as you can see, it
can produce a lot of output (the total line count of the above trace
was 1,327 lines. Most of that was cut to not waste space in this document).
The problem with the function tracer is that it incurs a substantial overhead
and exagerates the actual latency.
The reported latency above is 523 microseconds. The trace ends at 537
microseconds, but that's because it took 14 microseconds to produce the
stack trace.
The end of the trace does a stack dump to show where the latency occurred.
The above happened in tick_nohz_idle_exit(), and even though we can blame
the function tracer for exagerating the latency, this trace shows
that using NO HZ idle can have issues with a real time system. When a
system with NO HZ set is idle, the timer tick is stopped. When the system
resumes from idle, the timer must catch up to the current time and executes
all the ticks it missed in the loop. This is done with interrupts disabled.
Looking at the latency field "2dN..1.." you can see that this loop
ran on CPU 2, had interrupts disabled "d". The scheduler needed to run
"N" (for NEED_RESCHED). Preemption was disabled, as the preempt_count
counter was set to "1".
Ideally, when coming out of NO HZ, the accounting could be done in a single
step, but as that is tricky to get right, the current method is to just
run the current code in a loop as if the timer went off each time.
No function tracing
-------------------
As function tracing can exaggerate the latency, you can either
limit what functions are traced via the "set_ftrace_filter" and
"set_ftrace_notrace" files as described above in the function tracing
section. But you can also disable tracing totally via the tracing
option function-trace.
># echo 0 > /sys/kernel/debug/tracing/options/function-trace
This disables function tracing by all the ftrace tracers. Including
the function tracer, which would make it rather pointless because
the function tracer would act just like the "nop" tracer.
># echo 0 > options/function-trace
># echo 0 > tracing_max_latency
># echo irqsoff > current_tracer
># sleep 10
># cat trace
# tracer: irqsoff
#
# irqsoff latency trace v1.1.5 on 3.8.13-test-mrg-rt9+
# --------------------------------------------------------------------
# latency: 80 us, #4/4, CPU#6 | (M:preempt VP:0, KP:0, SP:0 HP:0 #P:8)
# -----------------
# | task: swapper/6-0 (uid:0 nice:0 policy:0 rt_prio:0)
# -----------------
# => started at: cpu_idle
# => ended at: cpu_idle
#
#
# _--------=> CPU#
# / _-------=> irqs-off
# | / _------=> need-resched
# || / _-----=> need-resched_lazy
# ||| / _----=> hardirq/softirq
# |||| / _---=> preempt-depth
# ||||| / _--=> preempt-lazy-depth
# |||||| / _-=> migrate-disable
# ||||||| / delay
# cmd pid |||||||| time | caller
# \ / |||||||| \ | /
<idle>-0 6dN..1.. 0us+: tick_nohz_idle_exit <-cpu_idle
<idle>-0 6dN..1.. 81us : tick_nohz_idle_exit <-cpu_idle
<idle>-0 6dN..1.. 81us+: trace_hardirqs_on <-cpu_idle
<idle>-0 6dN..1.. 87us : <stack trace>
=> tick_nohz_idle_exit
=> cpu_idle
=> start_secondary
This time the latency is much more compact and accurate (80 microseconds
is still a lot, but much lower than 523). Here the backtrace is much more
important as its now the only real information to know where the latency
occurred.
preemptoff tracer
-----------------
There are points in the kernel that disables preemption but not interrupts.
That is, an interrupt can still interrupt the current process but that
process cannot be scheduled out for a higher priority process.
This tracer records the time that preemption is disabed via the
kernel internal "preempt_disable()" function.
># echo 0 > /sys/kernel/debug/tracing/options/function-trace
># echo 0 > tracing_max_latency
># echo preemptoff > current_tracer
># sleep 10
># cat trace
# tracer: preemptoff
#
# preemptoff latency trace v1.1.5 on 3.8.13-test-mrg-rt9+
# --------------------------------------------------------------------
# latency: 65 us, #4/4, CPU#6 | (M:preempt VP:0, KP:0, SP:0 HP:0 #P:8)
# -----------------
# | task: swapper/6-0 (uid:0 nice:0 policy:0 rt_prio:0)
# -----------------
# => started at: cpuidle_enter
# => ended at: start_secondary
#
#
# _--------=> CPU#
# / _-------=> irqs-off
# | / _------=> need-resched
# || / _-----=> need-resched_lazy
# ||| / _----=> hardirq/softirq
# |||| / _---=> preempt-depth
# ||||| / _--=> preempt-lazy-depth
# |||||| / _-=> migrate-disable
# ||||||| / delay
# cmd pid |||||||| time | caller
# \ / |||||||| \ | /
<idle>-0 6d...1.. 1us+: intel_idle <-cpuidle_enter
<idle>-0 6.N..1.. 65us : cpu_idle <-start_secondary
<idle>-0 6.N..1.. 66us+: trace_preempt_on <-start_secondary
<idle>-0 6.N..1.. 71us : <stack trace>
=> sub_preempt_count
=> cpu_idle
=> start_secondary
There's not much interesting in this trace except that preemption was
disabled for 65 microseconds.
preemptirqsoff tracer
---------------------
Knowing when interrupts are disabled or how long preemption is disabled
via the preempt_disable() kernel interface is not as interesting as
knowing how long true preemption is disabled. That is, if we have the
following scenario:
A) preempt_disable()
[...]
B) irqs_disable()
[...]
C) preempt_enable();
[...]
D) irqs_enable();
"irqsoff" tracer will give you the time from B to D
"preemptoff" tracer will give you the time from A to C.
But the current task cannot be preempted from A to D which is what we
really care about. When a task cannot be preempted, a new task can
no execute when it is woken up if it is to run on the same CPU as the
task that has true preemption disabled (either interrupts disabled or
preemption disabled). The "preemptirqsoff" tracer will handle this.
"preemptirqsoff" tracer will give you the time from A to D
># echo 1 > /sys/kernel/debug/tracing/options/function-trace
># echo 0 > tracing_max_latency
># echo preemptirqsoff > current_tracer
># sleep 10
># cat trace
# tracer: preemptirqsoff
#
# preemptirqsoff latency trace v1.1.5 on 3.8.13-test-mrg-rt9+
# --------------------------------------------------------------------
# latency: 377 us, #1289/1289, CPU#1 | (M:preempt VP:0, KP:0, SP:0 HP:0 #P:8)
# -----------------
# | task: swapper/1-0 (uid:0 nice:0 policy:0 rt_prio:0)
# -----------------
# => started at: cpuidle_enter
# => ended at: start_secondary
#
#
# _--------=> CPU#
# / _-------=> irqs-off
# | / _------=> need-resched
# || / _-----=> need-resched_lazy
# ||| / _----=> hardirq/softirq
# |||| / _---=> preempt-depth
# ||||| / _--=> preempt-lazy-depth
# |||||| / _-=> migrate-disable
# ||||||| / delay
# cmd pid |||||||| time | caller
# \ / |||||||| \ | /
<idle>-0 1d...1.. 0us : intel_idle <-cpuidle_enter
<idle>-0 1d...1.. 1us : ktime_get <-cpuidle_wrap_enter
<idle>-0 1d...1.. 2us : smp_reschedule_interrupt <-reschedule_interrupt
<idle>-0 1d...1.. 3us : scheduler_ipi <-smp_reschedule_interrupt
<idle>-0 1d...1.. 3us : irq_enter <-scheduler_ipi
<idle>-0 1d...1.. 4us : rcu_irq_enter <-irq_enter
<idle>-0 1d...1.. 4us : rcu_eqs_exit_common.isra.45 <-rcu_irq_enter
<idle>-0 1d...1.. 5us : tick_check_idle <-irq_enter
<idle>-0 1d...1.. 5us : tick_check_oneshot_broadcast <-tick_check_idle
<idle>-0 1d...1.. 5us : ktime_get <-tick_check_idle
<idle>-0 1d...1.. 6us : tick_nohz_stop_idle <-tick_check_idle
<idle>-0 1d...1.. 6us : update_ts_time_stats <-tick_nohz_stop_idle
<idle>-0 1d...1.. 7us : nr_iowait_cpu <-update_ts_time_stats
<idle>-0 1d...1.. 7us : touch_softlockup_watchdog <-sched_clock_idle_wakeup_event
<idle>-0 1d...1.. 7us : tick_do_update_jiffies64 <-tick_check_idle
<idle>-0 1d...1.. 8us : touch_softlockup_watchdog <-tick_check_idle
<idle>-0 1d...1.. 8us : irqtime_account_irq <-irq_enter
<idle>-0 1d...1.. 9us : in_serving_softirq <-irqtime_account_irq
<idle>-0 1d...1.. 9us : add_preempt_count <-irq_enter
<idle>-0 1d..h1.. 9us : sched_ttwu_pending <-scheduler_ipi
<idle>-0 1d..h1.. 10us : _raw_spin_lock <-sched_ttwu_pending
<idle>-0 1d..h1.. 10us : add_preempt_count <-_raw_spin_lock
<idle>-0 1d..h2.. 11us : sub_preempt_count <-sched_ttwu_pending
<idle>-0 1d..h1.. 11us : raise_softirq_irqoff <-scheduler_ipi
<idle>-0 1d..h1.. 12us : do_raise_softirq_irqoff <-raise_softirq_irqoff
<idle>-0 1d..h1.. 12us : irq_exit <-scheduler_ipi
<idle>-0 1d..h1.. 12us : irqtime_account_irq <-irq_exit
<idle>-0 1d..h1.. 13us : sub_preempt_count <-irq_exit
<idle>-0 1d...2.. 13us : wakeup_softirqd <-irq_exit
<idle>-0 1d...2.. 14us : wake_up_process <-wakeup_softirqd
<idle>-0 1d...2.. 14us : try_to_wake_up <-wake_up_process
[...]
<idle>-0 1d...4.. 18us : dequeue_rt_stack <-enqueue_task_rt
<idle>-0 1d...4.. 19us : cpupri_set <-enqueue_task_rt
<idle>-0 1d...4.. 20us : update_rt_migration <-enqueue_task_rt
<idle>-0 1d...4.. 20us : ttwu_do_wakeup <-ttwu_do_activate.constprop.90
<idle>-0 1d...4.. 20us : check_preempt_curr <-ttwu_do_wakeup
<idle>-0 1d...4.. 21us : resched_task <-check_preempt_curr
<idle>-0 1dN..4.. 21us : task_woken_rt <-ttwu_do_wakeup
<idle>-0 1dN..4.. 22us : sub_preempt_count <-try_to_wake_up
<idle>-0 1dN..3.. 22us : ttwu_stat <-try_to_wake_up
<idle>-0 1dN..3.. 23us : _raw_spin_unlock_irqrestore <-try_to_wake_up
<idle>-0 1dN..3.. 23us : sub_preempt_count <-_raw_spin_unlock_irqrestore
[...]
<idle>-0 1dN..1.. 376us : nsecs_to_jiffies64 <-irqtime_account_process_tick.isra.2
<idle>-0 1dN..1.. 376us : nsecs_to_jiffies64 <-irqtime_account_process_tick.isra.2
<idle>-0 1dN..1.. 376us : account_idle_time <-irqtime_account_process_tick.isra.2
<idle>-0 1dN..1.. 377us : irqtime_account_process_tick.isra.2 <-account_idle_ticks
<idle>-0 1dN..1.. 377us : nsecs_to_jiffies64 <-irqtime_account_process_tick.isra.2
<idle>-0 1dN..1.. 377us : nsecs_to_jiffies64 <-irqtime_account_process_tick.isra.2
<idle>-0 1dN..1.. 377us : account_idle_time <-irqtime_account_process_tick.isra.2
<idle>-0 1.N..1.. 378us : cpu_idle <-start_secondary
<idle>-0 1.N..1.. 378us+: trace_preempt_on <-start_secondary
<idle>-0 1.N..1.. 391us : <stack trace>
=> sub_preempt_count
=> cpu_idle
=> start_secondary
The above is a much more interesting trace. Although we enabled function
tracing again, it allows us to see more of what is happening during
the trace.
The trace starts out at intel_idle() which on the box the trace was run on
is the idle function. Idle function usually disable preemption and
sometimes interrupts when the system is put to sleep, although an
interrupt will wake up the processor, the interrupt will not be serviced
until the processor re-enables interrupts again.
As interrupts and preemption is disabled across a full idle, the tracer
must account for this, as it is pretty useless to trace how long the
CPU has been idle. Thus, immediately exiting the idle state, the
latency tracers are re-enabled. This is where the start of the trace
occurred.
Then we can see that an interrupt is triggered after interrupts were
enabled (schedule_ipi). An interprocessor interrupt happened to wake up
a process that is on the current CPU.
Next the irq_enter() is called. This tells the system (including the
tracing system) that the kernel is now int interrupt mode. Notice that
'h' is not set until after "add_preempt_count" is called. That's because
the irq accounting is shared with the preempt_count code. A lot has happened
before that got set, as NO HZ and RCU must perform activities immediately
when coming out of idle via an interrupt.
A softirq was raised while in the interrupt and as the Red Hat Enterprise Linux for Real Time kernel runs
soft interrupts as threads, the corresponding softirq was woken up
on exiting the interrupt (irq_exit).
This wakeup also triggered the NEED_RESCHED flag "N" to be set, to let
the system know that the kernel needs to call schedule as soon as
preemption is re-enabled.
Finally the NO HZ accounting ran again with interrupts and preemption
disabled. Finally, interrupts were enabled and so was the preemption.
wakeup tracer
-------------
The previous tracers ("irqsoff", "preemptoff", and "preemptirqsoff")
were single CPU tracers. That is, they only reported the activities
on a single CPU, as interrupts only occurred there.
Both "wakeup" and "wakeup_rt" tracers are full CPU tracers. That is,
they report the activities of what happens across all CPUs. This is
because a task may be woken from one CPU but get scheduled on another
CPU.
The "wakeup" tracer is not that interresting from a real-time perspective,
as it records the time it takes to wake up the highest priority task
in the system even if that task does not happen to be a real time task.
Non real-time tasks may be delayed due scheduling balacing, and not
immediately scheduled for throughput reasons. Real-time tasks are scheduled
immediately after they are woken. Recording the max time it takes to
wake up a non real-time task will hide the times it takes to wake up
a real-time task. Because of this, we will focus on the "wakeup_rt" tracer
instead.
wakeup_rt tracer
----------------
The "wakeup" tracer records the time it takes from the current highest
priority task to wake up to the time it is scheduled. Because non real-time
tasks may take much longer to wake up than a real-time task, and that
the latency tracers only record the longest time, "wakeup" tracer is not
that suitable for seeing how long a real-time task takes to be scheduled
from the time it is woken. For that, we use the "wakeup_rt" tracer.
The "wakeup_rt" tracer only records the time for real-time tasks and
ignores the time for non real-time tasks.
># echo 0 > tracing_max_latency
># echo preemptirqsoff > current_tracer
># sleep 10
># cat trace
# tracer: wakeup_rt
#
# wakeup_rt latency trace v1.1.5 on 3.8.13-test-mrg-rt9+
# --------------------------------------------------------------------
# latency: 385 us, #1339/1339, CPU#7 | (M:preempt VP:0, KP:0, SP:0 HP:0 #P:8)
# -----------------
# | task: ksoftirqd/7-51 (uid:0 nice:0 policy:1 rt_prio:1)
# -----------------
#
# _--------=> CPU#
# / _-------=> irqs-off
# | / _------=> need-resched
# || / _-----=> need-resched_lazy
# ||| / _----=> hardirq/softirq
# |||| / _---=> preempt-depth
# ||||| / _--=> preempt-lazy-depth
# |||||| / _-=> migrate-disable
# ||||||| / delay
# cmd pid |||||||| time | caller
# \ / |||||||| \ | /
<idle>-0 7d...5.. 0us : 0:120:R + [007] 51: 98:R ksoftirqd/7
<idle>-0 7d...5.. 2us : ttwu_do_activate.constprop.90 <-try_to_wake_up
<idle>-0 7d...4.. 2us : check_preempt_curr <-ttwu_do_wakeup
<idle>-0 7d...4.. 3us : resched_task <-check_preempt_curr
<idle>-0 7dN..4.. 3us : task_woken_rt <-ttwu_do_wakeup
<idle>-0 7dN..4.. 4us : sub_preempt_count <-try_to_wake_up
<idle>-0 7dN..3.. 4us : ttwu_stat <-try_to_wake_up
<idle>-0 7dN..3.. 4us : _raw_spin_unlock_irqrestore <-try_to_wake_up
<idle>-0 7dN..3.. 5us : sub_preempt_count <-_raw_spin_unlock_irqrestore
<idle>-0 7dN..2.. 5us : idle_cpu <-irq_exit
<idle>-0 7dN..2.. 5us : rcu_irq_exit <-irq_exit
<idle>-0 7dN..2.. 6us : rcu_eqs_enter_common.isra.47 <-rcu_irq_exit
[...]
<idle>-0 7dN..1.. 53us : nsecs_to_jiffies64 <-irqtime_account_process_tick.isra.2
<idle>-0 7dN..1.. 53us : nsecs_to_jiffies64 <-irqtime_account_process_tick.isra.2
<idle>-0 7dN..1.. 54us : account_idle_time <-irqtime_account_process_tick.isra.2
<idle>-0 7dN..1.. 54us : irqtime_account_process_tick.isra.2 <-account_idle_ticks
<idle>-0 7dN..1.. 54us : nsecs_to_jiffies64 <-irqtime_account_process_tick.isra.2
<idle>-0 7dN..1.. 54us : nsecs_to_jiffies64 <-irqtime_account_process_tick.isra.2
<idle>-0 7dN..1.. 55us : account_idle_time <-irqtime_account_process_tick.isra.2
<idle>-0 7dN..1.. 55us : irqtime_account_process_tick.isra.2 <-account_idle_ticks
<idle>-0 7dN..1.. 55us : nsecs_to_jiffies64 <-irqtime_account_process_tick.isra.2
<idle>-0 7dN..1.. 55us : nsecs_to_jiffies64 <-irqtime_account_process_tick.isra.2
<idle>-0 7dN..1.. 56us : account_idle_time <-irqtime_account_process_tick.isra.2
<idle>-0 7dN..1.. 56us : irqtime_account_process_tick.isra.2 <-account_idle_ticks
<idle>-0 7dN..1.. 56us : nsecs_to_jiffies64 <-irqtime_account_process_tick.isra.2
<idle>-0 7dN..1.. 56us : nsecs_to_jiffies64 <-irqtime_account_process_tick.isra.2
<idle>-0 7dN..1.. 57us : account_idle_time <-irqtime_account_process_tick.isra.2
<idle>-0 7dN..1.. 57us : irqtime_account_process_tick.isra.2 <-account_idle_ticks
[...]
<idle>-0 7dN.h1.. 377us : tick_program_event <-hrtimer_interrupt
<idle>-0 7dN.h1.. 378us : clockevents_program_event <-tick_program_event
<idle>-0 7dN.h1.. 378us : ktime_get <-clockevents_program_event
<idle>-0 7dN.h1.. 378us : lapic_next_deadline <-clockevents_program_event
<idle>-0 7dN.h1.. 379us : irq_exit <-smp_apic_timer_interrupt
<idle>-0 7dN.h1.. 379us : irqtime_account_irq <-irq_exit
<idle>-0 7dN.h1.. 379us : sub_preempt_count <-irq_exit
<idle>-0 7dN..2.. 379us : wakeup_softirqd <-irq_exit
<idle>-0 7dN..2.. 380us : idle_cpu <-irq_exit
<idle>-0 7dN..2.. 380us : rcu_irq_exit <-irq_exit
<idle>-0 7dN..2.. 380us : sub_preempt_count <-irq_exit
<idle>-0 7.N..1.. 381us : sub_preempt_count <-cpu_idle
<idle>-0 7.N..... 381us : __schedule <-preempt_schedule
<idle>-0 7.N..... 382us : add_preempt_count <-__schedule
<idle>-0 7.N..1.. 382us : rcu_note_context_switch <-__schedule
<idle>-0 7.N..1.. 382us : _raw_spin_lock_irq <-__schedule
<idle>-0 7dN..1.. 382us : add_preempt_count <-_raw_spin_lock_irq
<idle>-0 7dN..2.. 383us : update_rq_clock <-__schedule
<idle>-0 7dN..2.. 383us : put_prev_task_idle <-__schedule
<idle>-0 7dN..2.. 383us : pick_next_task_stop <-__schedule
<idle>-0 7dN..2.. 384us : pick_next_task_rt <-__schedule
<idle>-0 7dN..2.. 384us : dequeue_pushable_task <-pick_next_task_rt
<idle>-0 7d...3.. 385us : __schedule <-preempt_schedule
<idle>-0 7d...3.. 385us : 0:120:R ==> [007] 51: 98:R ksoftirqd/7
And once again we can see that NO HZ affects the wake up time of a
real time task (this case it was ksoftirqd).
Notice the first traced item:
0:120:R + [007] 51: 98:R ksoftirqd/7
This is in the format of:
<pid>:<prio>:<process-state> + [<CPU#>] <pid>:<prio>:<process-state>
The first pid, prio and process-state is for the task performing the
wake up. Again, the prio is the internal kernel prio, where 120 is for
SCHED_OTHER. The "+" represents a wake up is happening. The CPU# the
CPU waking task in currently assigned to (and being woken up on).
The second set of pid, prio and process-state is for the task being
woken up. The prio of 98 is internal to the kernel, and to get the real
real-time priority for the task you must subtract it from 99.
(99 - 98 = real-time priority of 1 - low priority)
The process-state should be always in the "R" (running) state, and
can be ignored. The original location to record the trace when waking
up was before the task was actually woken. Due to changes in the wake
up code, the trace hook had to be moved to after the wake up, which
means the task being woken up will have already been set to running
and the trace will reflect that.
The last line of the trace:
0:120:R ==> [007] 51: 98:R ksoftirqd/7
Represents the scheduling of a task.
<pid>:<prio>:<process-state> ==> [CPU#] <pid>:<prio><process-state>
The first set of pid, prio and process-state belongs to the task that
is being scheduled out. The second set is for the task that is being
scheduled in. The "==>" represents a task scheduling switch, and the
CPU# should always match the current CPU that is on (7 in this case).
The first process-state here is of more importance than that of the
wake up trace. If the previous task is in the running state (as it is
in this case), that means it has been preempted (still wants to run
but must yield for the new task).
Using events in tracers
-----------------------
With the "wakeup_rt" tracer, as with all tracers, function tracing can
exaggerate the latency times. But disabling the function tracing for
"wakeup_rt" is not very useful.
># echo 0 > /sys/kernel/debug/tracing/options/function-trace
># echo 0 > tracing_max_latency
># echo wakeup_rt > current_tracer
># sleep 10
># cat trace
# tracer: wakeup_rt
#
# wakeup_rt latency trace v1.1.5 on 3.8.13-test-mrg-rt9+
# --------------------------------------------------------------------
# latency: 64 us, #18446744073709512109/18446744073709512109, CPU#5 | (M:preempt VP:0, KP:0, SP:0 HP:0 #P:8)
# -----------------
# | task: irq/43-em1-878 (uid:0 nice:0 policy:1 rt_prio:50)
# -----------------
#
# _--------=> CPU#
# / _-------=> irqs-off
# | / _------=> need-resched
# || / _-----=> need-resched_lazy
# ||| / _----=> hardirq/softirq
# |||| / _---=> preempt-depth
# ||||| / _--=> preempt-lazy-depth
# |||||| / _-=> migrate-disable
# ||||||| / delay
# cmd pid |||||||| time | caller
# \ / |||||||| \ | /
<idle>-0 0d..h4.. 0us : 0:120:R + [005] 878: 49:R irq/43-em1
<idle>-0 0d..h4.. 2us+: ttwu_do_activate.constprop.90 <-try_to_wake_up
<idle>-0 5d...3.. 63us : __schedule <-preempt_schedule
<idle>-0 5d...3.. 64us : 0:120:R ==> [005] 878: 49:R irq/43-em1
The irq thread was woken up by a task on CPU 0, and it scheduled on
CPU 5.
As function tracing causes a large overhead, with the wakeup tracers, you
can still get information by using events, and events are sparse enough
to not cause much overhead even when enabled.
># echo 0 > /sys/kernel/debug/tracing/options/function-trace
># echo 1 > events/enable
># echo 0 > tracing_max_latency
># echo wakeup_rt > current_tracer
># sleep 10
># cat trace
# tracer: wakeup_rt
#
# wakeup_rt latency trace v1.1.5 on 3.8.13-test-mrg-rt9+
# --------------------------------------------------------------------
# latency: 67 us, #15/15, CPU#1 | (M:preempt VP:0, KP:0, SP:0 HP:0 #P:8)
# -----------------
# | task: irq/43-em1-878 (uid:0 nice:0 policy:1 rt_prio:50)
# -----------------
#
# _--------=> CPU#
# / _-------=> irqs-off
# | / _------=> need-resched
# || / _-----=> need-resched_lazy
# ||| / _----=> hardirq/softirq
# |||| / _---=> preempt-depth
# ||||| / _--=> preempt-lazy-depth
# |||||| / _-=> migrate-disable
# ||||||| / delay
# cmd pid |||||||| time | caller
# \ / |||||||| \ | /
<idle>-0 0d..h4.. 0us : 0:120:R + [001] 878: 49:R irq/43-em1
<idle>-0 0d..h4.. 1us : ttwu_do_activate.constprop.90 <-try_to_wake_up
<idle>-0 0d..h4.. 1us+: sched_wakeup: comm=irq/43-em1 pid=878 prio=49 success=1 target_cpu=001
<idle>-0 0....2.. 5us : power_end: cpu_id=0
<idle>-0 0....2.. 6us+: cpu_idle: state=4294967295 cpu_id=0
<idle>-0 0d...2.. 9us : power_start: type=1 state=3 cpu_id=0
<idle>-0 0d...2.. 10us+: cpu_idle: state=3 cpu_id=0
<idle>-0 1.N..2.. 25us+: power_end: cpu_id=1
<idle>-0 1.N..2.. 27us+: cpu_idle: state=4294967295 cpu_id=1
<idle>-0 1dN..3.. 30us : hrtimer_cancel: hrtimer=ffff88011ea4cf40
<idle>-0 1dN..3.. 31us+: hrtimer_start: hrtimer=ffff88011ea4cf40 function=tick_sched_timer expires=9670689000000 softexpires=9670689000000
<idle>-0 1.N..2.. 64us : rcu_utilization: Start context switch
<idle>-0 1.N..2.. 65us+: rcu_utilization: End context switch
<idle>-0 1d...3.. 66us : __schedule <-preempt_schedule
<idle>-0 1d...3.. 67us : 0:120:R ==> [001] 878: 49:R irq/43-em1
The above trace is much more accurate to a real latency, but this time
we get a lot more information. The task being woken up in on CPU 1, and
the first time we see CPU 1 is at the 25 microsecond time. The "power_end"
trace point shows that the CPU is coming out of a deep power state, which
explains why the time took so long. The high resolution timer has been
reinitialized, and we can assume from our other traces that the NO HZ
code is running again to catch up on the tick, although no trace points
currently represent that. This process took 33 microseconds, where we
see RCU handling a context switch, and eventually the schedule takes place.
function_graph
--------------
The "function" tracer is extremely informative, albeit invasive, but
it is a bit difficult for a human to read.
<idle>-0 [000] ....1.. 10698.878897: sub_preempt_count <-__schedule
less-3062 [006] ....... 10698.878897: add_preempt_count <-migrate_disable
cat-3061 [007] d...... 10698.878897: add_preempt_count <-_raw_spin_lock
<idle>-0 [000] ....... 10698.878897: add_preempt_count <-cpu_idle
less-3062 [006] ....11. 10698.878897: pin_current_cpu <-migrate_disable
<idle>-0 [000] ....1.. 10698.878898: tick_nohz_idle_enter <-cpu_idle
cat-3061 [007] d...1.. 10698.878898: sub_preempt_count <-__raw_spin_unlock
less-3062 [006] ....111 10698.878898: sub_preempt_count <-migrate_disable
<idle>-0 [000] ....1.. 10698.878898: set_cpu_sd_state_idle <-tick_nohz_idle_enter
cat-3061 [007] ....... 10698.878898: free_delayed <-__slab_alloc.isra.60
less-3062 [006] .....11 10698.878898: migrate_disable <-get_page_from_freelist
less-3062 [006] .....11 10698.878898: add_preempt_count <-migrate_disable
<idle>-0 [000] d...1.. 10698.878898: __tick_nohz_idle_enter <-tick_nohz_idle_enter
less-3062 [006] ....112 10698.878898: sub_preempt_count <-migrate_disable
<idle>-0 [000] d...1.. 10698.878898: ktime_get <-__tick_nohz_idle_enter
cat-3061 [007] ....... 10698.878898: __rt_mutex_init <-tracing_open
The "function_graph" tracer is a bit more easy on the eyes, and lets
the developer follow the code in much more detail.
># echo function_graph > current_tracer
># cat trace
# tracer: function_graph
#
# CPU DURATION FUNCTION CALLS
# | | | | | | |
5) 0.125 us | source_load();
5) 0.137 us | idle_cpu();
5) 0.105 us | source_load();
5) 0.110 us | idle_cpu();
5) 0.132 us | source_load();
5) 0.134 us | idle_cpu();
5) 0.127 us | source_load();
5) 0.144 us | idle_cpu();
5) 0.132 us | source_load();
5) 0.112 us | idle_cpu();
5) 0.120 us | source_load();
5) 0.130 us | idle_cpu();
5) + 20.812 us | } /* find_busiest_group */
5) + 21.905 us | } /* load_balance */
5) 0.099 us | msecs_to_jiffies();
5) 0.120 us | __rcu_read_unlock();
5) | _raw_spin_lock() {
5) 0.115 us | add_preempt_count();
5) 1.115 us | }
5) + 46.645 us | } /* idle_balance */
5) | put_prev_task_rt() {
5) | update_curr_rt() {
5) | cpuacct_charge() {
5) 0.110 us | __rcu_read_lock();
5) 0.110 us | __rcu_read_unlock();
5) 2.111 us | }
5) 0.100 us | sched_avg_update();
5) | _raw_spin_lock() {
5) 0.116 us | add_preempt_count();
5) 1.151 us | }
5) 0.122 us | balance_runtime();
5) 0.110 us | sub_preempt_count();
5) 8.165 us | }
5) 9.152 us | }
5) 0.148 us | pick_next_task_fair();
5) 0.112 us | pick_next_task_stop();
5) 0.117 us | pick_next_task_rt();
5) 0.123 us | pick_next_task_fair();
5) 0.138 us | pick_next_task_idle();
------------------------------------------
5) ksoftir-39 => <idle>-0
------------------------------------------
5) | finish_task_switch() {
5) | _raw_spin_unlock_irq() {
5) 0.260 us | sub_preempt_count();
5) 1.289 us | }
5) 2.309 us | }
5) 0.132 us | sub_preempt_count();
5) ! 151.784 us | } /* __schedule */
5) 0.272 us | } /* sub_preempt_count */
The "function" tracer only traces the start of the function where as the
"function_graph" tracer also traces the exit of the function, allowing
to show a flow of function calls in the kernel. As one function calls
the next function, it is indented in the trace and C code curly brackets
are placed around them. When there's a leaf function (a function that
does not call any other function, or any function that happens to be
traced), it is simply finished with a ";".
This tracer has a different format than the other tracers, to help
ease the reading of the trace. The first number "5)" represents the
CPU that the trace happened on. The second number is the time the
function took to execute. Note, this time also include the overhead
of the "function_graph" tracer itself, so for functions that have
several other functions traced within it, its time will be rather
exaggerated. For leaf functions, the time is rather accurate.
When a schedule switch is detected (does not require the sched_switch
event enabled, as all traces record the pid), it shows up as separately
displayed.
------------------------------------------
5) ksoftir-39 => <idle>-0
------------------------------------------
The name is cropped to 7 characters (from "ksoftirqd" to "ksoftir").
Follow a function
-----------------
Because the "function_graph" tracer records both the start and exit
of a function, several more features are possible. One of these features
is to graph only a specific function. That is, to see what a specific
function calls and ignore all other functions.
For example, if you are interested in what the sys_read() function
calls, you can use the "set_graph_function" file in the tracing
debug file system.
># echo sys_read > set_graph_function
># echo function_graph > current_tracer
># sleep 10
># cat trace
# tracer: function_graph
#
# CPU DURATION FUNCTION CALLS
# | | | | | | |
0) | sys_read() {
0) 0.126 us | fget_light();
0) | vfs_read() {
0) | rw_verify_area() {
0) | security_file_permission() {
0) 0.077 us | cap_file_permission();
0) 0.076 us | __fsnotify_parent();
0) 0.100 us | fsnotify();
0) 2.001 us | }
0) 2.608 us | }
0) | tty_read() {
0) 0.070 us | tty_paranoia_check();
0) | tty_ldisc_ref_wait() {
0) | tty_ldisc_try() {
0) | _raw_spin_lock_irqsave() {
0) 0.130 us | add_preempt_count();
0) 0.759 us | }
0) | _raw_spin_unlock_irqrestore() {
0) 0.132 us | sub_preempt_count();
0) 0.774 us | }
0) 2.576 us | }
0) 3.161 us | }
0) | n_tty_read() {
0) | _mutex_lock_interruptible() {
0) 0.087 us | rt_mutex_lock_interruptible();
0) 0.694 us | }
0) | add_wait_queue() {
0) | migrate_disable() {
0) 0.100 us | add_preempt_count();
0) 0.073 us | pin_current_cpu();
0) 0.085 us | sub_preempt_count();
0) 1.829 us | }
0) 0.060 us | rt_spin_lock();
0) 0.065 us | rt_spin_unlock();
0) | migrate_enable() {
0) 0.077 us | add_preempt_count();
0) 0.070 us | unpin_current_cpu();
0) 0.077 us | sub_preempt_count();
0) 1.847 us | }
0) 5.899 us | }
The above shows the flow of functions called by sys_read().
To reset the "set_graph_function" simply write into that file like
the "set_ftrace_filter" file is done.
># echo > set_graph_function
Time a function
---------------
As the "function_graph" tracer is associated to the "function" tracer
it is also affected by the "set_ftrace_filter", "set_ftrace_notrace"
as well as the sysctl feature "kernel.ftrace_enabled".
As mentioned previously, only the leaf functions contain the most accurate
times of execution. By filtering on a specific function, you can see
the time it takes to execute a single function.
># echo do_IRQ > set_ftrace_filter
># echo function_graph > current_tracer
># sleep 10
># cat trace
# tracer: function_graph
#
# CPU DURATION FUNCTION CALLS
# | | | | | | |
4) ==========> |
4) 6.486 us | do_IRQ();
0) ==========> |
0) 3.801 us | do_IRQ();
4) ==========> |
4) 3.221 us | do_IRQ();
0) ==========> |
0) + 11.153 us | do_IRQ();
0) ==========> |
0) + 10.968 us | do_IRQ();
6) ==========> |
6) 9.280 us | do_IRQ();
0) ==========> |
0) 9.467 us | do_IRQ();
0) ==========> |
0) + 11.238 us | do_IRQ();
The "==========>" show when an interrupt entered. The "<==========" is
missing because it is associated with the exit part of the trace.
As "do_IRQ" is a leaf function here, the exit arrow was folded into
the function and does not appear in the trace.
Events in function graph tracer
-------------------------------
As explained previously, events can be enabled with all tracers.
But with the "function_graph" tracer, they are displayed a little
differently.
># echo 1 > events/irq/enable
># echo do_IRQ > set_ftrace_filter
># echo function_graph > current_tracer
># sleep 10
># cat trace
# tracer: function_graph
#
# CPU DURATION FUNCTION CALLS
# | | | | | | |
5) ==========> |
5) | do_IRQ() {
5) | /* irq_handler_entry: irq=43 name=em1 */
5) | /* irq_handler_exit: irq=43 ret=handled */
5) + 15.721 us | }
5) <========== |
3) | /* softirq_raise: vec=3 [action=NET_RX] */
3) | /* softirq_entry: vec=3 [action=NET_RX] */
3) | /* softirq_exit: vec=3 [action=NET_RX] */
0) ==========> |
0) | do_IRQ() {
0) | /* irq_handler_entry: irq=43 name=em1 */
0) | /* irq_handler_exit: irq=43 ret=handled */
0) 8.915 us | }
0) <========== |
3) | /* softirq_raise: vec=3 [action=NET_RX] */
3) | /* softirq_entry: vec=3 [action=NET_RX] */
3) | /* softirq_exit: vec=3 [action=NET_RX] */
0) | /* softirq_raise: vec=1 [action=TIMER] */
0) | /* softirq_raise: vec=9 [action=RCU] */
------------------------------------------
0) <idle>-0 => ksoftir-3
------------------------------------------
0) | /* softirq_entry: vec=1 [action=TIMER] */
0) | /* softirq_exit: vec=1 [action=TIMER] */
0) | /* softirq_entry: vec=9 [action=RCU] */
0) | /* softirq_exit: vec=9 [action=RCU] */
------------------------------------------
0) ksoftir-3 => <idle>-0
------------------------------------------
Keeping with the C formatting, events in the "function_graph" tracer
appear as comments. Recording the interrupt events gives more detail
to what interrupts are occurring when "do_IRQ()" is called. As the
"do_IRQ()" exit trace is not folded, the "<==========" appears to
display that the interrupt is over.
Annotations
-----------
In the traces, including the "function_graph" tracer, you may see
annotations around the times. "+" and "!". A "+" appears when the
time between events is greater than 10 microseconds, and a "!" appears
when that time is greater than 100 microseconds. You can see this in the
above tracers:
<idle>-0 0d..h4.. 2us+: ttwu_do_activate.constprop.90 <-try_to_wake_up
<idle>-0 5d...3.. 63us : __schedule <-preempt_schedule
5) + 20.812 us | } /* find_busiest_group */
5) + 21.905 us | } /* load_balance */
5) ! 151.784 us | } /* __schedule */
Buffer size
-----------
When tracing functions, you will almost always use events. This is because
the amount of functions being traced will quickly fill the ring buffer
faster than anything can read from it. The amount lost can be minimized
with filtering the trace as well as increasing the size of the buffer.
The size of the buffer is controlled by the "buffer_size_kb" file.
As the name suggests, the size is in kilobytes. When you first boot up,
as tracing is used by only a small minority of users, the trace buffer
is compressed. The first time you use any of the tracing features,
the tracing buffer will automatically increase to a decent size.
># cat buffer_size_kb
7 (expanded: 1408)
Note, for efficiency reasons, the buffer is split into multiple buffers
per CPU. The size displayed by "buffer_size_kb" is the size of each
CPU buffer. To see the total size of all buffers look at
"buffer_total_size_kb"
># cat buffer_total_size_kb
56 (expanded: 11264)
After running any trace, the buffer will expand to the size that is
denoted by the "expanded" value.
># echo 1 > events/enable
># cat buffer_size_kb
1408
To change the size of the buffer, simply echo in a number.
># echo 10000 > buffer_size_kb
># cat buffer_size_kb
10000
Note, if you change the size before using any tracer, the buffers
will go to that size, and the expanded value will then be ignored.
Buffer size per CPU
-------------------
If there's a case you care about activity on one CPU more than another
CPU, and you need to save memory, you can change the sizes of the
ring buffers per CPU. These files exist in a "per_cpu/cpuX/" directory.
># cat per_cpu/cpu1/buffer_size_kb
10000
># echo 100 > per_cpu/cpu1/buffer_size_kb
># cat per_cpu/cpu1/buffer_size_kb
100
When the per CPU buffers differ in size, the top level buffer_size_kb
will display an "X".
># cat buffer_size_kb
X
But the total size will still display the amount allocated.
># cat buffer_total_size_kb
70100
Trace Marker
------------
It is sometimes useful to synchronize actions in userspace with events
within the kernel. The "trace_marker" allows userspace to write into
the ftrace buffer.
># echo hello world > trace_marker
># cat trace
# tracer: nop
#
# entries-in-buffer/entries-written: 1/1 #P:8
#
# _-------=> irqs-off
# / _------=> need-resched
# |/ _-----=> need-resched_lazy
# ||/ _----=> hardirq/softirq
# |||/ _---=> preempt-depth
# ||||/ _--=> preempt-lazy-depth
# ||||| / _-=> migrate-disable
# |||||| / delay
# TASK-PID CPU# ||||||| TIMESTAMP FUNCTION
# | | | ||||||| | |
bash-1086 [001] .....11 21351.346541: tracing_mark_write: hello world
Writing into the kernel is very light weight. User programs can take
advantage of this with the following C code:
static int trace_fd = -1;
void trace_write(const char *fmt, ...)
{
va_list ap;
char buf[256];
int n;
if (trace_fd < 0)
return;
va_start(ap, fmt);
n = vsnprintf(buf, 256, fmt, ap);
va_end(ap);
write(trace_fd, buf, n);
}
[...]
trace_fd = open("trace_marker", WR_ONLY);
and later use the "trace_write()" function to record into the ftrace
buffer.
trace_write("record this event\n");
tracer options
--------------
There are several options that can affect the formating of the trace
output as well as how the tracers behave. Some trace options only exist
for a given tracer and their control file appears only when the tracer
is activated.
The trace option control files exist in the "options" directory.
># ls options
annotate graph-time print-parent sym-userobj
bin hex raw test_nop_accept
block irq-info record-cmd test_nop_refuse
branch latency-format sleep-time trace_printk
context-info markers stacktrace userstacktrace
disable_on_free overwrite sym-addr verbose
ftrace_preempt printk-msg-only sym-offset
The "function_graph" tracer adds several of its own.
># echo function_graph > current_tracer
># ls options
annotate funcgraph-cpu irq-info sleep-time
bin funcgraph-duration latency-format stacktrace
block funcgraph-irqs markers sym-addr
branch funcgraph-overhead overwrite sym-offset
context-info funcgraph-overrun printk-msg-only sym-userobj
disable_on_free funcgraph-proc print-parent trace_printk
ftrace_preempt graph-time raw userstacktrace
funcgraph-abstime hex record-cmd verbose
annotate - It is sometimes confusing when the CPU buffers are full
and one CPU buffer had a lot of events recently, thus
a shorter time frame, were another CPU may have only had
a few events, which lets it have older events. When
the trace is reported, it shows the oldest events first,
and it may look like only one CPU ran (the one with the
oldest events). When the annotate option is set, it will
display when a new CPU buffer started:
<idle>-0 [005] d...1.. 910.328077: cpuidle_wrap_enter <-cpuidle_enter_tk
<idle>-0 [005] d...1.. 910.328077: ktime_get <-cpuidle_wrap_enter
<idle>-0 [005] d...1.. 910.328078: intel_idle <-cpuidle_enter
<idle>-0 [005] d...1.. 910.328078: leave_mm <-intel_idle
##### CPU 7 buffer started ####
<idle>-0 [007] d...1.. 910.360866: tick_do_update_jiffies64 <-tick_check_idle
<idle>-0 [007] d...1.. 910.360866: _raw_spin_lock <-tick_do_update_jiffies64
<idle>-0 [007] d...1.. 910.360866: add_preempt_count <-_raw_spin_lock
bin - This will print out the formats in raw binary.
block - When set, reading trace_pipe will not block when polled.
context-info - Show only the event data. Hides the comm, PID,
timestamp, CPU, and other useful data.
disable_on_free - When the free_buffer is closed, tracing will
stop (tracing_on set to 0).
ftrace_preempt - Normally the function tracer disables interrupts as
the recursion protection will hide interrupts from being
traced if the interrupt happened while another function
was being traced. If this option is enabled, then it
will not disable interrupts but will only disable
preemption. But note, if an interrupt were to arrive
when another function is being traced, all functions
within that interrupt will not be traced, as function
tracing is temporarily disablde for recursion protection.
graph-time - When running function graph tracer, to include the
time to call nested functions. When this is not set,
the time reported for the function will only include
the time the function itself executed for, not the time
for functions that it called.
hex - Similar to raw, but the numbers will be in a hexadecimal
format.
irq-info - Shows the interrupt, preempt count, need resched data.
When disabled, the trace looks like:
# tracer: function
#
# entries-in-buffer/entries-written: 319494/4972382 #P:8
#
# TASK-PID CPU# TIMESTAMP FUNCTION
# | | | | |
<idle>-0 [004] 983.062800: lock_hrtimer_base.isra.25 <-__hrtimer_start_range_ns
<idle>-0 [004] 983.062801: _raw_spin_lock_irqsave <-lock_hrtimer_base.isra.25
<idle>-0 [004] 983.062801: add_preempt_count <-_raw_spin_lock_irqsave
<idle>-0 [004] 983.062801: __remove_hrtimer <-__hrtimer_start_range_ns
<idle>-0 [004] 983.062801: hrtimer_force_reprogram <-__remove_hrtimer
latency-format - This option changes the trace. When
it is enabled, the trace displays
additional information about the
latencies, as described in "Latency
trace format".
markers - When set, the trace_marker is writable (only by root).
When disabled, the trace_marker will error with EINVAL
on write.
overwrite - This controls what happens when the trace buffer is
full. If "1" (default), the oldest events are
discarded and overwritten. If "0", then the newest
events are discarded.
(see per_cpu/cpu0/stats for overrun and dropped)
printk-msg-only - When set, trace_printk()s will only show the format
and not their parameters (if trace_bprintk() or
trace_bputs() was used to save the trace_printk()).
print-parent - On function traces, display the calling (parent)
function as well as the function being traced.
print-parent:
bash-1423 [006] 1755.774709: msecs_to_jiffies <-idle_balance
noprint-parent:
bash-1423 [006] 1755.774709: msecs_to_jiffies
raw - This will display raw numbers. This option is best for
use with user applications that can translate the raw
numbers better than having it done in the kernel.
record-cmd - When any event or tracer is enabled, a hook is enabled
in the sched_switch trace point to fill comm cache
with mapped pids and comms. But this may cause some
overhead, and if you only care about pids, and not the
name of the task, disabling this option can lower the
impact of tracing.
sleep-time - When running function graph tracer, to include
the time a task schedules out in its function.
When enabled, it will account time the task has been
scheduled out as part of the function call.
stacktrace - This is one of the options that changes the trace
itself. When a trace is recorded, so is the stack
of functions. This allows for back traces of
trace sites.
sym-addr - this will also display the function address as well
as the function name.
sym-offset - Display not only the function name, but also the
offset in the function. For example, instead of
seeing just "ktime_get", you will see
"ktime_get+0xb/0x20".
sym-offset:
bash-1423 [006] 1755.774709: msecs_to_jiffies+0x0/0x20
sym-addr:
bash-1423 [006] 1755.774709: msecs_to_jiffies <ffffffff8106b5f0>
sym-userobj - when user stacktrace are enabled, look up which
object the address belongs to, and print a
relative address. This is especially useful when
ASLR is on, otherwise you don't get a chance to
resolve the address to object/file/line after
the app is no longer running
The lookup is performed when you read
trace,trace_pipe. Example:
a.out-1623 [000] 40874.465068: /root/a.out[+0x480] <-/root/a.out[+0x494] <- /root/a.out[+0x4a8] <- /lib/libc-2.7.so[+0x1e1a6]
trace_printk - Can disable trace_printk() from writing into the buffer.
userstacktrace - This option changes the trace. It records a
stacktrace of the current userspace thread at each event.
verbose - This deals with the trace file when the
latency-format option is enabled.
bash 4000 1 0 00000000 00010a95 [58127d26] 1720.415ms \
(+0.000ms): simple_strtoul (strict_strtoul)
This has been quite an in depth look at how to use ftrace via the
debug file system. But it can be quite daunting to handle all these
different files. Luckily, there's a tool that can do most of this
work for you. It's called "trace-cmd".
Using trace-cmd
---------------
trace-cmd is a tool that interacts with the ftrace tracing facility.
It reads and writes to the same files that are described above as
well as reading the files that can transfer the binary data of
the kernel tracing buffers in an efficient manner to be read later.
The tool is very simple and easy to use.
There are several man pages for trace-cmd. First look at
man trace-cmd
to find out more information on the other commands. All of trace-cmd's
commands also have their own man pages in the format of:
man trace-cmd-<command>
For example, the "record" command's man page is under trace-cmd-record.
This document will describe all the options for each command, but
instead will briefly discuss how to use trace-cmd and describe most of
its commands.
trace-cmd record and report
---------------------------
To use ftrace tracers and events you must first have to start tracing
by either echoing a name of a tracer into the "current_tracer" file
or by echoing "1" into one of the event "enable" files.
For trace-cmd, the record option starts the tracing and will also save
the traced data into a file. Let's start with an example:
># cd ~
># trace-cmd record -p function
plugin 'function'
Hit Ctrl^C to stop recording
(^C)
Kernel buffer statistics:
Note: "entries" are the entries left in the kernel ring buffer and are not
recorded in the trace data. They should all be zero.
CPU: 0
entries: 0
overrun: 38650181
commit overrun: 0
bytes: 3060
oldest event ts: 15634.891771
now ts: 15634.953219
dropped events: 0
CPU: 1
entries: 0
overrun: 38523960
commit overrun: 0
bytes: 1368
oldest event ts: 15634.891771
now ts: 15634.953938
dropped events: 0
CPU: 2
entries: 0
overrun: 41461508
commit overrun: 0
bytes: 1872
oldest event ts: 15634.891773
now ts: 15634.954630
dropped events: 0
CPU: 3
entries: 0
overrun: 38246206
commit overrun: 0
bytes: 36
oldest event ts: 15634.891785
now ts: 15634.955263
dropped events: 0
CPU: 4
entries: 0
overrun: 32730902
commit overrun: 0
bytes: 432
oldest event ts: 15634.891716
now ts: 15634.955952
dropped events: 0
CPU: 5
entries: 0
overrun: 33264601
commit overrun: 0
bytes: 2952
oldest event ts: 15634.891769
now ts: 15634.956630
dropped events: 0
CPU: 6
entries: 0
overrun: 30974204
commit overrun: 0
bytes: 2484
oldest event ts: 15634.891772
now ts: 15634.957249
dropped events: 0
CPU: 7
entries: 0
overrun: 32374274
commit overrun: 0
bytes: 3564
oldest event ts: 15634.891652
now ts: 15634.957938
dropped events: 0
CPU0 data recorded at offset=0x302000
146325504 bytes in size
CPU1 data recorded at offset=0x8e8e000
148217856 bytes in size
CPU2 data recorded at offset=0x11be8000
148066304 bytes in size
CPU3 data recorded at offset=0x1a91d000
146219008 bytes in size
CPU4 data recorded at offset=0x2348f000
145940480 bytes in size
CPU5 data recorded at offset=0x2bfbd000
145403904 bytes in size
CPU6 data recorded at offset=0x34a68000
141570048 bytes in size
CPU7 data recorded at offset=0x3d16b000
147513344 bytes in size
The "-p" is for ftrace tracers (use to be known as 'plugins' and the name
is kept for historical reasons). In this case we started the
"function" tracer. Since we did not add a command to execute, by
default, trace-cmd will just start the tracing and record the data
and wait for the user to hit Ctrl^C to stop.
When the trace stops, it prints out status of each of the kernel's
per cpu trace buffers. The are:
entries: - Which is the number of entries still in the kernel buffer.
Ideally this should be zero, as trace-cmd would consume them
all and put them into the data file.
overrun: - As tracing can be much faster than the saving of data,
events can be lost due to overwriting of the old events
that were not consumed yet when the buffer filled up.
This is the number of events that were lost.
The "function" tracer can fill up the buffer extremely fast
it is not uncommon to lose millions of events when
tracing functions for any length of time.
commit overrun: - This should always be zero, and if it is not, then
the buffer size is way too small or something went wrong
with the tracer.
bytes: - The number of bytes consumed (not read as pages). This is
more a status for developers of the tracing utitily.
oldest event ts: - The timestamp for the oldest event still in the ring
buffer. Unless it gets overwritten, it will be the timestamp
of the next event read.
now ts: The current timestamp used by the tracing facility.
dropped events: - If the buffer has overwrite mode disabled (from the
trace options), then this will show the number of events that
were lost due to not being able to write to the buffer because
it was full. This is similar to the overrun field except that
those are events that made it into the buffer but were overwritten.
By default, the file used to record the trace is called "trace.dat".
You can override the output file with the -o option.
To read the trace.dat file, simply run the trace-cmd report command:
># trace-cmd report
version = 6
cpus=8
trace-cmd-3735 [003] 15618.722889: function: __hrtimer_start_range_ns
trace-cmd-3734 [002] 15618.722889: function: _mutex_unlock
<idle>-0 [000] 15618.722889: function: cpuidle_wrap_enter
trace-cmd-3735 [003] 15618.722890: function: lock_hrtimer_base.isra.25
trace-cmd-3734 [002] 15618.722890: function: rt_mutex_unlock
<idle>-0 [000] 15618.722890: function: ktime_get
trace-cmd-3735 [003] 15618.722890: function: _raw_spin_lock_irqsave
trace-cmd-3735 [003] 15618.722891: function: add_preempt_count
trace-cmd-3734 [002] 15618.722891: function: __fsnotify_parent
<idle>-0 [000] 15618.722891: function: intel_idle
trace-cmd-3735 [003] 15618.722891: function: idle_cpu
trace-cmd-3734 [002] 15618.722891: function: fsnotify
<idle>-0 [000] 15618.722891: function: leave_mm
trace-cmd-3735 [003] 15618.722891: function: ktime_get
trace-cmd-3734 [002] 15618.722891: function: __srcu_read_lock
<idle>-0 [000] 15618.722891: function: __phys_addr
trace-cmd-3734 [002] 15618.722891: function: add_preempt_count
trace-cmd-3735 [003] 15618.722891: function: enqueue_hrtimer
trace-cmd-3735 [003] 15618.722892: function: _raw_spin_unlock_irqrestore
trace-cmd-3734 [002] 15618.722892: function: sub_preempt_count
trace-cmd-3735 [003] 15618.722892: function: sub_preempt_count
trace-cmd-3734 [002] 15618.722892: function: __srcu_read_unlock
trace-cmd-3735 [003] 15618.722892: function: schedule
trace-cmd-3734 [002] 15618.722892: function: add_preempt_count
trace-cmd-3735 [003] 15618.722893: function: __schedule
trace-cmd-3734 [002] 15618.722893: function: sub_preempt_count
trace-cmd-3735 [003] 15618.722893: function: add_preempt_count
trace-cmd-3735 [003] 15618.722893: function: rcu_note_context_switch
trace-cmd-3734 [002] 15618.722893: function: __audit_syscall_exit
trace-cmd-3735 [003] 15618.722893: function: _raw_spin_lock_irq
trace-cmd-3735 [003] 15618.722894: function: add_preempt_count
trace-cmd-3734 [002] 15618.722894: function: path_put
trace-cmd-3735 [003] 15618.722894: function: deactivate_task
trace-cmd-3734 [002] 15618.722894: function: dput
trace-cmd-3735 [003] 15618.722894: function: dequeue_task
trace-cmd-3734 [002] 15618.722894: function: mntput
trace-cmd-3735 [003] 15618.722894: function: update_rq_clock
trace-cmd-3734 [002] 15618.722894: function: unroll_tree_refs
To filter out a CPU, use the --cpu option.
># trace-cmd report --cpu 1
version = 6
cpus=8
<idle>-0 [001] 15618.723287: function: ktime_get
<idle>-0 [001] 15618.723288: function: smp_apic_timer_interrupt
<idle>-0 [001] 15618.723289: function: irq_enter
<idle>-0 [001] 15618.723289: function: rcu_irq_enter
<idle>-0 [001] 15618.723289: function: rcu_eqs_exit_common.isra.45
<idle>-0 [001] 15618.723289: function: tick_check_idle
<idle>-0 [001] 15618.723290: function: tick_check_oneshot_broadcast
<idle>-0 [001] 15618.723290: function: ktime_get
<idle>-0 [001] 15618.723290: function: tick_nohz_stop_idle
<idle>-0 [001] 15618.723290: function: update_ts_time_stats
<idle>-0 [001] 15618.723290: function: nr_iowait_cpu
<idle>-0 [001] 15618.723291: function: touch_softlockup_watchdog
<idle>-0 [001] 15618.723291: function: tick_do_update_jiffies64
<idle>-0 [001] 15618.723291: function: touch_softlockup_watchdog
<idle>-0 [001] 15618.723291: function: irqtime_account_irq
<idle>-0 [001] 15618.723292: function: in_serving_softirq
<idle>-0 [001] 15618.723292: function: add_preempt_count
<idle>-0 [001] 15618.723292: function: exit_idle
<idle>-0 [001] 15618.723292: function: atomic_notifier_call_chain
<idle>-0 [001] 15618.723293: function: __atomic_notifier_call_chain
<idle>-0 [001] 15618.723293: function: __rcu_read_lock
Notice how the functions are indented similar to the function_graph
tracer. This is because trace-cmd can post process the trace data
with more complex algorithms than are acceptable to implement in the
kernel. It uses the parent function to follow which function is called
by other functions and be able to deduce a call graph.
To disable the indentation, use the -O report option.
># trace-cmd report --cpu 1 -O indent=0
version = 6
cpus=8
<idle>-0 [001] 15618.723287: function: ktime_get
<idle>-0 [001] 15618.723288: function: smp_apic_timer_interrupt
<idle>-0 [001] 15618.723289: function: irq_enter
<idle>-0 [001] 15618.723289: function: rcu_irq_enter
<idle>-0 [001] 15618.723289: function: rcu_eqs_exit_common.isra.45
<idle>-0 [001] 15618.723289: function: tick_check_idle
<idle>-0 [001] 15618.723290: function: tick_check_oneshot_broadcast
<idle>-0 [001] 15618.723290: function: ktime_get
<idle>-0 [001] 15618.723290: function: tick_nohz_stop_idle
<idle>-0 [001] 15618.723290: function: update_ts_time_stats
<idle>-0 [001] 15618.723290: function: nr_iowait_cpu
<idle>-0 [001] 15618.723291: function: touch_softlockup_watchdog
<idle>-0 [001] 15618.723291: function: tick_do_update_jiffies64
<idle>-0 [001] 15618.723291: function: touch_softlockup_watchdog
To add back the parent:
># trace-cmd report --cpu 1 -O indent=0 -O parent=1
version = 6
cpus=8
<idle>-0 [001] 15618.723287: function: ktime_get <-- cpuidle_wrap_enter
<idle>-0 [001] 15618.723288: function: smp_apic_timer_interrupt <-- apic_timer_interrupt
<idle>-0 [001] 15618.723289: function: irq_enter <-- smp_apic_timer_interrupt
<idle>-0 [001] 15618.723289: function: rcu_irq_enter <-- irq_enter
<idle>-0 [001] 15618.723289: function: rcu_eqs_exit_common.isra.45 <-- rcu_irq_enter
<idle>-0 [001] 15618.723289: function: tick_check_idle <-- irq_enter
<idle>-0 [001] 15618.723290: function: tick_check_oneshot_broadcast <-- tick_check_idle
<idle>-0 [001] 15618.723290: function: ktime_get <-- tick_check_idle
<idle>-0 [001] 15618.723290: function: tick_nohz_stop_idle <-- tick_check_idle
<idle>-0 [001] 15618.723290: function: update_ts_time_stats <-- tick_nohz_stop_idle
<idle>-0 [001] 15618.723290: function: nr_iowait_cpu <-- update_ts_time_stats
<idle>-0 [001] 15618.723291: function: touch_softlockup_watchdog <-- sched_clock_idle_wakeup_event
<idle>-0 [001] 15618.723291: function: tick_do_update_jiffies64 <-- tick_check_idle
<idle>-0 [001] 15618.723291: function: touch_softlockup_watchdog <-- tick_check_idle
<idle>-0 [001] 15618.723291: function: irqtime_account_irq <-- irq_enter
<idle>-0 [001] 15618.723292: function: in_serving_softirq <-- irqtime_account_irq
<idle>-0 [001] 15618.723292: function: add_preempt_count <-- irq_enter
<idle>-0 [001] 15618.723292: function: exit_idle <-- smp_apic_timer_interrupt
<idle>-0 [001] 15618.723292: function: atomic_notifier_call_chain <-- exit_idle
<idle>-0 [001] 15618.723293: function: __atomic_notifier_call_chain <-- atomic_notifier_call_chain
Now the trace looks similar to the debug file system output.
Use the "-e" option to record events:
># trace-cmd record -e sched_switch
/sys/kernel/debug/tracing/events/sched_switch/filter
/sys/kernel/debug/tracing/events/*/sched_switch/filter
Hit Ctrl^C to stop recording
(^C)
[...]
># trace-cmd report
version = 6
cpus=8
<idle>-0 [006] 21642.751755: sched_switch: swapper/6:0 [120] R ==> trace-cmd:4876 [120]
<idle>-0 [002] 21642.751776: sched_switch: swapper/2:0 [120] R ==> sshd:1208 [120]
trace-cmd-4875 [005] 21642.751782: sched_switch: trace-cmd:4875 [120] D ==> swapper/5:0 [120]
trace-cmd-4869 [001] 21642.751792: sched_switch: trace-cmd:4869 [120] S ==> swapper/1:0 [120]
trace-cmd-4873 [003] 21642.751819: sched_switch: trace-cmd:4873 [120] S ==> swapper/3:0 [120]
<idle>-0 [005] 21642.751835: sched_switch: swapper/5:0 [120] R ==> trace-cmd:4875 [120]
trace-cmd-4877 [007] 21642.751847: sched_switch: trace-cmd:4877 [120] D ==> swapper/7:0 [120]
sshd-1208 [002] 21642.751875: sched_switch: sshd:1208 [120] S ==> swapper/2:0 [120]
<idle>-0 [007] 21642.751880: sched_switch: swapper/7:0 [120] R ==> trace-cmd:4877 [120]
trace-cmd-4874 [004] 21642.751885: sched_switch: trace-cmd:4874 [120] S ==> swapper/4:0 [120]
<idle>-0 [001] 21642.751902: sched_switch: swapper/1:0 [120] R ==> irq/43-em1:865 [49]
trace-cmd-4876 [006] 21642.751903: sched_switch: trace-cmd:4876 [120] D ==> swapper/6:0 [120]
<idle>-0 [006] 21642.751926: sched_switch: swapper/6:0 [120] R ==> trace-cmd:4876 [120]
irq/43-em1-865 [001] 21642.751927: sched_switch: irq/43-em1:865 [49] S ==> swapper/1:0 [120]
trace-cmd-4875 [005] 21642.752029: sched_switch: trace-cmd:4875 [120] S ==> swapper/5:0 [120]
Notice that only the "sched_switch" name was used. trace-cmd will
search for a match of "-e"'s option for trace event systems, or single
trace events themselves. To trace all interrupt events:
># trace-cmd record -e irq sleep 10
/sys/kernel/debug/tracing/events/irq/filter
/sys/kernel/debug/tracing/events/*/irq/filter
[...]
Notice that when a command is passed to trace-cmd, it will just run that
command and exit the trace when complete.
># trace-cmd report
version = 6
cpus=8
<idle>-0 [002] 21767.342089: softirq_raise: vec=9 [action=RCU]
sleep-4917 [007] 21767.342089: softirq_raise: vec=9 [action=RCU]
<idle>-0 [006] 21767.342089: softirq_raise: vec=9 [action=RCU]
ksoftirqd/0-3 [000] 21767.342096: softirq_entry: vec=1 [action=TIMER]
ksoftirqd/4-33 [004] 21767.342096: softirq_entry: vec=1 [action=TIMER]
ksoftirqd/3-27 [003] 21767.342097: softirq_entry: vec=1 [action=TIMER]
ksoftirqd/7-51 [007] 21767.342097: softirq_entry: vec=1 [action=TIMER]
ksoftirqd/4-33 [004] 21767.342097: softirq_exit: vec=1 [action=TIMER]
To get the status information of events similar to what the debug
file system provides, add the "-l" (think "latency") option to the report.
># trace-cmd report -l
version = 6
cpus=8
<idle>-0 3d.h20 21767.341545: softirq_raise: vec=8 [action=HRTIMER]
ksoftirq-27 3...11 21767.341552: softirq_entry: vec=8 [action=HRTIMER]
ksoftirq-27 3...11 21767.341554: softirq_exit: vec=8 [action=HRTIMER]
<idle>-0 4d.h20 21767.342085: softirq_raise: vec=7 [action=SCHED]
<idle>-0 0d.h20 21767.342086: softirq_raise: vec=7 [action=SCHED]
<idle>-0 3d.h20 21767.342086: softirq_raise: vec=7 [action=SCHED]
sleep-4917 7d.h10 21767.342086: softirq_raise: vec=7 [action=SCHED]
<idle>-0 6d.h20 21767.342087: softirq_raise: vec=7 [action=SCHED]
<idle>-0 2d.h20 21767.342087: softirq_raise: vec=1 [action=TIMER]
<idle>-0 1d.h20 21767.342087: softirq_raise: vec=1 [action=TIMER]
Tracing all events
------------------
As mentioned above, the "-e" option to trace-cmd record is to choose
what event should be traced. You can specify either an individual event,
or a trace system:
># trace-cmd record -e irq
The above enables all tracepoints within the "irq" system.
># trace-cmd record -e irq_handler_enter
># trace-cmd record -e irq:irq_handler_enter
The commands above are equivalent and will enable the tracepoint
event "irq_handler_enter".
But then there is the case where you want to trace all events.
To do this, use the keyword "all".
># trace-cmd record -e all
This will enable all events.
Tracing tracers and events
--------------------------
As events can be enabled within any tracer, it makes sense that trace-cmd
would allow this as well. This is indeed the case. You may use both
the "-p" and the "-e" options at the same time.
># trace-cmd record -p function_graph -e all
[...]
># trace-cmd report
version = 6
cpus=8
trace-cmd-1698 [002] 2724.485397: funcgraph_entry: | kmem_cache_alloc() {
trace-cmd-1699 [007] 2724.485397: funcgraph_entry: 0.073 us | find_vma();
trace-cmd-1696 [000] 2724.485397: funcgraph_entry: | lg_local_lock() {
trace-cmd-1698 [002] 2724.485397: funcgraph_entry: 0.033 us | add_preempt_count();
trace-cmd-1696 [000] 2724.485397: funcgraph_entry: | migrate_disable() {
trace-cmd-1699 [007] 2724.485398: funcgraph_entry: | handle_mm_fault() {
trace-cmd-1696 [000] 2724.485398: funcgraph_entry: 0.027 us | add_preempt_count();
trace-cmd-1698 [002] 2724.485398: funcgraph_entry: 0.034 us | sub_preempt_count();
trace-cmd-1699 [007] 2724.485398: funcgraph_entry: | __mem_cgroup_count_vm_event() {
trace-cmd-1696 [000] 2724.485398: funcgraph_entry: 0.031 us | pin_current_cpu();
trace-cmd-1699 [007] 2724.485398: funcgraph_entry: 0.029 us | __rcu_read_lock();
trace-cmd-1698 [002] 2724.485398: kmem_cache_alloc: (return_to_handler+0x0) call_site=ffffffff81662345 ptr=0xffff880114e260f0 bytes_req=240 bytes_alloc=240 gfp_flags=G
FP_KERNEL
trace-cmd-1696 [000] 2724.485398: funcgraph_entry: 0.034 us | sub_preempt_count();
trace-cmd-1699 [007] 2724.485398: funcgraph_entry: 0.028 us | __rcu_read_unlock();
trace-cmd-1698 [002] 2724.485398: funcgraph_exit: 0.758 us | }
trace-cmd-1698 [002] 2724.485398: funcgraph_entry: 0.029 us | __rt_mutex_init();
trace-cmd-1696 [000] 2724.485398: funcgraph_exit: 0.727 us | }
trace-cmd-1699 [007] 2724.485398: funcgraph_exit: 0.466 us | }
Notice here that trace-cmd report does not disply the function graph
tracer any different than any other trace, like the "trace" file does.
Function filtering
------------------
The "set_ftrace_filter" and "set_ftrace_notrace" is very useful in
filtering out functions that you do not care about. These can be done
with trace-cmd as well.
The "-l" and "-n" are used the same as "set_ftrace_filter" and
"set_ftrace_notrace" respectively. Think of "limit functions" for
"-l" as the "-f" is used for event filtering.
To add more than one function to the list, either used the glob expressions
described previously, or use multiple "-l" or "-n" options.
># trace-cmd record -p function -l "sched*" -n "*stat*"
The above traces all functions that start with "sched" except those that
have "stat" in their names.
Event filtering
---------------
To filter events the same way as writing to the "filter" file inside
the "events" directory (see "Filtering events" above), use the "-f"
option. This option must follow the event that it will filter.
># trace-cmd record -e sched_switch -f "prev_prio < 100" \
-e sched_wakeup -f 'comm == "bash"'
Graph a function
----------------
To perform a graph of a specific function using "function_graph" tracer,
trace-cmd provides the "-g" option.
># trace-cmd record -p function_graph -g sys_read ls /
[...]
># trace-cmd report
version = 6
CPU 3 is empty
CPU 4 is empty
CPU 5 is empty
cpus=8
trace-cmd-2183 [006] 4689.643252: funcgraph_entry: | sys_read() {
trace-cmd-2183 [006] 4689.643253: funcgraph_entry: 0.147 us | fget_light();
trace-cmd-2183 [006] 4689.643254: funcgraph_entry: | vfs_read() {
trace-cmd-2183 [006] 4689.643254: funcgraph_entry: | rw_verify_area() {
trace-cmd-2183 [006] 4689.643255: funcgraph_entry: | security_file_permission() {
trace-cmd-2183 [006] 4689.643255: funcgraph_entry: 0.068 us | cap_file_permission();
trace-cmd-2183 [006] 4689.643256: funcgraph_entry: 0.064 us | __fsnotify_parent();
trace-cmd-2183 [006] 4689.643256: funcgraph_entry: 0.095 us | fsnotify();
trace-cmd-2183 [006] 4689.643257: funcgraph_exit: 1.792 us | }
trace-cmd-2183 [006] 4689.643257: funcgraph_exit: 2.328 us | }
trace-cmd-2183 [006] 4689.643257: funcgraph_entry: | seq_read() {
trace-cmd-2183 [006] 4689.643257: funcgraph_entry: | _mutex_lock() {
trace-cmd-2183 [006] 4689.643258: funcgraph_entry: 0.062 us | rt_mutex_lock();
trace-cmd-2183 [006] 4689.643258: funcgraph_exit: 0.584 us | }
trace-cmd-2183 [006] 4689.643259: funcgraph_entry: | m_start() {
trace-cmd-2183 [006] 4689.643259: funcgraph_entry: | rt_down_read() {
trace-cmd-2183 [006] 4689.643259: funcgraph_entry: | rt_mutex_lock() {
Modify trace buffer size via trace-cmd
--------------------------------------
The trace-cmd record "-b" option lets you change the size of the
ftrace buffer before recording the trace. Note, currently trace-cmd
does not support per-cpu resize. The size is what is entered into
"buffer_size_kb" at the top level.
># trace-cmd record -b 10000 -p function
trace-cmd start, stop and extract
---------------------------------
The trace-cmd start command takes almost all the options as the trace-cmd
record command does. The difference between the two is that "start"
will only enable ftrace, it will not do any recording. It is equivalent
to enabling ftrace via the debug file system.
># trace-cmd start -p function -e all
># cat /sys/kernel/debug/tracing/trace
# tracer: function
#
# entries-in-buffer/entries-written: 1544167/2039168 #P:8
#
# _-------=> irqs-off
# / _------=> need-resched
# |/ _-----=> need-resched_lazy
# ||/ _----=> hardirq/softirq
# |||/ _---=> preempt-depth
# ||||/ _--=> preempt-lazy-depth
# ||||| / _-=> migrate-disable
# |||||| / delay
# TASK-PID CPU# ||||||| TIMESTAMP FUNCTION
# | | | ||||||| | |
trace-cmd-2390 [003] ....... 5946.816132: _mutex_unlock <-rb_simple_write
trace-cmd-2390 [003] ....... 5946.816133: rt_mutex_unlock <-_mutex_unlock
trace-cmd-2390 [003] ....... 5946.816134: __fsnotify_parent <-vfs_write
trace-cmd-2390 [003] ....... 5946.816134: fsnotify <-vfs_write
trace-cmd-2390 [003] ....... 5946.816135: __srcu_read_lock <-fsnotify
trace-cmd-2390 [003] ....... 5946.816135: add_preempt_count <-__srcu_read_lock
trace-cmd-2390 [003] ....1.. 5946.816135: sub_preempt_count <-__srcu_read_lock
trace-cmd-2390 [003] ....... 5946.816135: __srcu_read_unlock <-fsnotify
trace-cmd-2390 [003] ....... 5946.816136: add_preempt_count <-__srcu_read_unlock
trace-cmd-2390 [003] ....1.. 5946.816136: sub_preempt_count <-__srcu_read_unlock
trace-cmd-2390 [003] ....... 5946.816137: syscall_trace_leave <-int_check_syscall_exit_work
trace-cmd-2390 [003] ....... 5946.816137: __audit_syscall_exit <-syscall_trace_leave
trace-cmd-2390 [003] ....... 5946.816137: path_put <-__audit_syscall_exit
trace-cmd-2390 [003] ....... 5946.816137: dput <-path_put
trace-cmd-2390 [003] ....... 5946.816138: mntput <-path_put
trace-cmd-2390 [003] ....... 5946.816138: unroll_tree_refs <-__audit_syscall_exit
trace-cmd-2390 [003] ....... 5946.816138: kfree <-__audit_syscall_exit
trace-cmd-2390 [003] ....1.. 5946.816139: kfree: call_site=ffffffff810eaff0 ptr= (null)
trace-cmd-2390 [003] ....1.. 5946.816139: sys_exit: NR 1 = 1
trace-cmd-2390 [003] d...... 5946.816140: sys_write -> 0x1
trace-cmd-2390 [003] d...... 5946.816151: do_page_fault <-page_fault
trace-cmd-2390 [003] d...... 5946.816151: __do_page_fault <-do_page_fault
trace-cmd-2390 [003] ....... 5946.816152: rt_down_read_trylock <-__do_page_fault
trace-cmd-2390 [003] ....... 5946.816152: rt_mutex_trylock <-rt_down_read_trylock
Running trace-cmd stop is exactly the same as echoing "0" into the
"tracing_on" file in the debug file system. This only stops writing to
the trace buffers, it does not stop all the tracing mechanisms inside
the kernel and still adds some overhead to the system.
># cat /sys/kernel/debug/tracing/tracing_on
1
># trace-cmd stop
># cat /sys/kernel/debug/tracing/tracing_on
0
Finally, if you want to create a "trace.dat" file from the ftrace
kernel buffers you use the "extract" command. The tracing could
have started with the "start" command or by manually modifying the
ftrace debug file system files. This is useful if you found a trace
and want to save it off where you can send it to other people, and
also have the full features of the trace-cmd "report" command.
># trace-cmd extract
># trace-cmd report
version = 6
cpus=8
CPU:6 [2544372 EVENTS DROPPED]
ksoftirqd/6-45 [006] 6192.717580: function: rcu_note_context_switch
ksoftirqd/6-45 [006] 6192.717580: rcu_utilization: ffffffff819e743b
ksoftirqd/6-45 [006] 6192.717580: rcu_utilization: ffffffff819e7450
ksoftirqd/6-45 [006] 6192.717581: function: add_preempt_count
ksoftirqd/6-45 [006] 6192.717581: function: kthread_should_stop
ksoftirqd/6-45 [006] 6192.717581: function: kthread_should_park
ksoftirqd/6-45 [006] 6192.717581: function: ksoftirqd_should_run
ksoftirqd/6-45 [006] 6192.717582: function: sub_preempt_count
ksoftirqd/6-45 [006] 6192.717582: function: schedule
ksoftirqd/6-45 [006] 6192.717582: function: __schedule
ksoftirqd/6-45 [006] 6192.717582: function: add_preempt_count
ksoftirqd/6-45 [006] 6192.717582: function: rcu_note_context_switch
ksoftirqd/6-45 [006] 6192.717583: rcu_utilization: ffffffff819e743b
ksoftirqd/6-45 [006] 6192.717583: rcu_utilization: ffffffff819e7450
ksoftirqd/6-45 [006] 6192.717583: function: _raw_spin_lock_irq
ksoftirqd/6-45 [006] 6192.717583: function: add_preempt_count
ksoftirqd/6-45 [006] 6192.717584: function: deactivate_task
ksoftirqd/6-45 [006] 6192.717584: function: dequeue_task
ksoftirqd/6-45 [006] 6192.717584: function: update_rq_clock
The "extract" command takes a "-o" option to save the trace in a different
name like the "record" command does. By default it just saves it into
a file called "trace.dat".
Resetting the trace
-------------------
As mentioned, the "stop" command does not lower the overhead of ftrace.
It simply disables writing to the ftrace buffer. There's two ways of
resetting ftrace with trace-cmd.
The first way is with the "reset" command.
># trace-cmd reset
This disables practically everything in ftrace. It also sets the
"tracing_on" file to "0". It also erases everything inside the buffers,
so make sure to do your "extract" before running the "reset" command.
The "reset" command also takes a "-b" option that lets you resize the
buffer as well. This is useful to free the allocated buffers when you
are finished tracing.
># trace-cmd reset -b 0
># cat /sys/kernel/debug/tracing/buffer_total_size_kb
8
The problem with the "reset" command is that it may make it hard to
use the debug file system tracing files directly. It may disable various
parts of tracing that may give unexpected results when trying to use
the files directly. If you plan to use ftrace's files directly after
using trace-cmd, the trick is to start the "nop" tracer.
># trace-cmd start -p nop
This sets up ftrace to run the "nop" tracer, which does no tracing and
has no overhead when enabled, and disables all events, and clears out
the "trace" file. After running this command, the system should be
set up to use the ftrace files directly as they are expected.
Using trace-cmd over the network
--------------------------------
If the target system to trace is limited on disk space, or perhaps
the disk usage is what is being traced, it can be prudent to record
the trace via another median than to the hard drive. The "listen"
command sets up a way for trace-cmd to record over the network.
[Server]
>$ mkdir traces
>$ cd traces
>$ trace-cmd listen -p 55577
Notice that the prompt above is "$". This denotes that the listen command
does not need to be root if the listening port is not a privileged port.
[Target]
># trace-cmd record -e all -N Server:55577 ls /
[Server]
connected!
Connected with Target:50671
cpus=8
pagesize=4096
version = 6
CPU0 data recorded at offset=0x3a7000
0 bytes in size
CPU1 data recorded at offset=0x3a7000
8192 bytes in size
CPU2 data recorded at offset=0x3a9000
8192 bytes in size
CPU3 data recorded at offset=0x3ab000
8192 bytes in size
CPU4 data recorded at offset=0x3ad000
8192 bytes in size
CPU5 data recorded at offset=0x3af000
8192 bytes in size
CPU6 data recorded at offset=0x3b1000
4096 bytes in size
CPU7 data recorded at offset=0x3b2000
8192 bytes in size
connected!
(^C)
>$ ls
trace.Target:50671.dat
>$ trace-cmd report trace.Target:50671.dat
version = 6
CPU 0 is empty
cpus=8
<...>-2976 [007] 8865.266143: mm_page_alloc: page=0xffffea00007e8740 pfn=8292160 order=0 migratetype=0 gfp_flags=GFP_KERNEL|GFP_REPEAT|GFP_ZERO|GFP_NOTRACK
<...>-2976 [007] 8865.266145: kmalloc: (pte_lock_init+0x2c) call_site=ffffffff8116d78c ptr=0xffff880111e40d00 bytes_req=48 bytes_alloc=64 gfp_flags=GFP_KERNEL
<...>-2976 [007] 8865.266152: mm_page_alloc: page=0xffffea00034a50c0 pfn=55201984 order=0 migratetype=0 gfp_flags=GFP_KERNEL|GFP_REPEAT|GFP_ZERO|GFP_NOTRACK
<...>-2976 [007] 8865.266153: kmalloc: (pte_lock_init+0x2c) call_site=ffffffff8116d78c ptr=0xffff880111e40e40 bytes_req=48 bytes_alloc=64 gfp_flags=GFP_KERNEL
<...>-2976 [007] 8865.266155: mm_page_alloc: page=0xffffea000307d380 pfn=50844544 order=0 migratetype=2 gfp_flags=GFP_HIGHUSER_MOVABLE
<...>-2976 [007] 8865.266167: mm_page_alloc: page=0xffffea000323f900 pfn=52689152 order=0 migratetype=2 gfp_flags=GFP_HIGHUSER_MOVABLE
<...>-2976 [007] 8865.266171: mm_page_alloc: page=0xffffea00032cda80 pfn=53271168 order=0 migratetype=2 gfp_flags=GFP_HIGHUSER_MOVABLE
<...>-2976 [007] 8865.266192: hrtimer_cancel: hrtimer=0xffff88011ebccf40
<idle>-0 [006] 8865.266193: hrtimer_cancel: hrtimer=0xffff88011eb8cf40
<...>-2976 [007] 8865.266193: hrtimer_expire_entry: hrtimer=0xffff88011ebccf40 now=8905356001470 function=tick_sched_timer/0x0
<idle>-0 [006] 8865.266194: hrtimer_expire_entry: hrtimer=0xffff88011eb8cf40 now=8905356002620 function=tick_sched_timer/0x0
<...>-2976 [007] 8865.266196: sched_stat_runtime: comm=trace-cmd pid=2976 runtime=228684 [ns] vruntime=2941412131 [ns]
<idle>-0 [006] 8865.266197: softirq_raise: vec=1 [action=TIMER]
<idle>-0 [006] 8865.266197: rcu_utilization: ffffffff819e740d
<...>-2976 [007] 8865.266198: softirq_raise: vec=1 [action=TIMER]
<idle>-0 [006] 8865.266198: softirq_raise: vec=9 [action=RCU]
<...>-2976 [007] 8865.266199: rcu_utilization: ffffffff819e740d
By default, the data is transfered via UDP. This is very efficient but
it is possible to lose data and not know it. If you are worried about
a full connection, then use the TCP protocol. The "-t" option
on the "record" command forces trace-cmd to send the data over a TCP
connection instead of a UDP one.
Summary
-------
This document just highlighted the most common features of ftrace and
trace-cmd. For more in depth look at what trace-cmd can do, read
the man pages:
trace-cmd
trace-cmd-record
trace-cmd-report
trace-cmd-start
trace-cmd-stop
trace-cmd-extract
trace-cmd-reset
trace-cmd-listen
trace-cmd-split
trace-cmd-restore
trace-cmd-list
trace-cmd-stack
付録C 改訂履歴
| 改訂履歴 | |||
|---|---|---|---|
| 改訂 1-6 | Tue Aug 6 2019 | ||
| |||
| 改訂 1-5 | Fri Oct 19 2018 | ||
| |||
| 改訂 1-4 | Mon Mar 26 2018 | ||
| |||
| 改訂 1-3 | Tue Jul 25 2017 | ||
| |||
| 改訂 1-2 | Mon Nov 3 2016 | ||
| |||
| 改訂 1-1 | Fri Nov 06 2015 | ||
| |||
| 改訂 1-0 | Fri Feb 13 2015 | ||
| |||