
Red Hat Training
A Red Hat training course is available for RHEL 8
Chapter 6. Setting up PCP
Performance Co-Pilot (PCP) is a suite of tools, services, and libraries for monitoring, visualizing, storing, and analyzing system-level performance measurements.
6.1. Overview of PCP
You can add performance metrics using Python, Perl, C++, and C interfaces. Analysis tools can use the Python, C++, C client APIs directly, and rich web applications can explore all available performance data using a JSON interface.
You can analyze data patterns by comparing live results with archived data.
Features of PCP:
- Light-weight distributed architecture, which is useful during the centralized analysis of complex systems.
- It allows the monitoring and management of real-time data.
- It allows logging and retrieval of historical data.
PCP has the following components:
-
The Performance Metric Collector Daemon (
pmcd) collects performance data from the installed Performance Metric Domain Agents (pmda). PMDAs can be individually loaded or unloaded on the system and are controlled by the PMCD on the same host. -
Various client tools, such as
pminfoorpmstat, can retrieve, display, archive, and process this data on the same host or over the network. -
The
pcppackage provides the command-line tools and underlying functionality. -
The
pcp-guipackage provides the graphical application. Install thepcp-guipackage by executing theyum install pcp-guicommand. For more information, see Visually tracing PCP log archives with the PCP Charts application.
Additional resources
-
pcp(1)man page -
/usr/share/doc/pcp-doc/directory - System services and tools distributed with PCP
- Index of Performance Co-Pilot (PCP) articles, solutions, tutorials, and white papers fromon Red Hat Customer Portal
- Side-by-side comparison of PCP tools with legacy tools Red Hat Knowledgebase article
- PCP upstream documentation
6.2. Installing and enabling PCP
To begin using PCP, install all the required packages and enable the PCP monitoring services.
This procedure describes how to install PCP using the pcp package. If you want to automate the PCP installation, install it using the pcp-zeroconf package. For more information about installing PCP by using pcp-zeroconf, see Setting up PCP with pcp-zeroconf.
Procedure
Install the
pcppackage:# yum install pcp
Enable and start the
pmcdservice on the host machine:# systemctl enable pmcd # systemctl start pmcd
Verification steps
Verify if the
pmcdprocess is running on the host:# pcp Performance Co-Pilot configuration on workstation: platform: Linux workstation 4.18.0-80.el8.x86_64 #1 SMP Wed Mar 13 12:02:46 UTC 2019 x86_64 hardware: 12 cpus, 2 disks, 1 node, 36023MB RAM timezone: CEST-2 services: pmcd pmcd: Version 4.3.0-1, 8 agents pmda: root pmcd proc xfs linux mmv kvm jbd2
Additional resources
-
pmcd(1)man page - System services and tools distributed with PCP
6.3. Deploying a minimal PCP setup
The minimal PCP setup collects performance statistics on Red Hat Enterprise Linux. The setup involves adding the minimum number of packages on a production system needed to gather data for further analysis.
You can analyze the resulting tar.gz file and the archive of the pmlogger output using various PCP tools and compare them with other sources of performance information.
Prerequisites
- PCP is installed. For more information, see Installing and enabling PCP.
Procedure
Update the
pmloggerconfiguration:# pmlogconf -r /var/lib/pcp/config/pmlogger/config.default
Start the
pmcdandpmloggerservices:# systemctl start pmcd.service # systemctl start pmlogger.service
- Execute the required operations to record the performance data.
Stop the
pmcdandpmloggerservices:# systemctl stop pmcd.service # systemctl stop pmlogger.service
Save the output and save it to a
tar.gzfile named based on the host name and the current date and time:# cd /var/log/pcp/pmlogger/ # tar -czf $(hostname).$(date +%F-%Hh%M).pcp.tar.gz $(hostname)
Extract this file and analyze the data using PCP tools.
Additional resources
-
pmlogconf(1),pmlogger(1), andpmcd(1)man pages - System services and tools distributed with PCP
6.4. System services and tools distributed with PCP
Performance Co-Pilot (PCP) includes various system services and tools you can use for measuring performance. The basic package pcp includes the system services and basic tools. Additional tools are provided with the pcp-system-tools, pcp-gui, and pcp-devel packages.
Roles of system services distributed with PCP
pmcd- The Performance Metric Collector Daemon (PMCD).
pmie- The Performance Metrics Inference Engine.
pmlogger- The performance metrics logger.
pmproxy- The realtime and historical performance metrics proxy, time series query and REST API service.
Tools distributed with base PCP package
pcp- Displays the current status of a Performance Co-Pilot installation.
pcp-vmstat- Provides a high-level system performance overview every 5 seconds. Displays information about processes, memory, paging, block IO, traps, and CPU activity.
pmconfig- Displays the values of configuration parameters.
pmdiff- Compares the average values for every metric in either one or two archives, in a given time window, for changes that are likely to be of interest when searching for performance regressions.
pmdumplog- Displays control, metadata, index, and state information from a Performance Co-Pilot archive file.
pmfind- Finds PCP services on the network.
pmie- An inference engine that periodically evaluates a set of arithmetic, logical, and rule expressions. The metrics are collected either from a live system, or from a Performance Co-Pilot archive file.
pmieconf-
Displays or sets configurable
pmievariables. pmiectl-
Manages non-primary instances of
pmie. pminfo- Displays information about performance metrics. The metrics are collected either from a live system, or from a Performance Co-Pilot archive file.
pmlc-
Interactively configures active
pmloggerinstances. pmlogcheck- Identifies invalid data in a Performance Co-Pilot archive file.
pmlogconf-
Creates and modifies a
pmloggerconfiguration file. pmlogctl-
Manages non-primary instances of
pmlogger. pmloglabel- Verifies, modifies, or repairs the label of a Performance Co-Pilot archive file.
pmlogsummary- Calculates statistical information about performance metrics stored in a Performance Co-Pilot archive file.
pmprobe- Determines the availability of performance metrics.
pmsocks- Allows access to a Performance Co-Pilot hosts through a firewall.
pmstat- Periodically displays a brief summary of system performance.
pmstore- Modifies the values of performance metrics.
pmtrace- Provides a command line interface to the trace PMDA.
pmval- Displays the current value of a performance metric.
Tools distributed with the separately installed pcp-system-tools package
pcp-atop- Shows the system-level occupation of the most critical hardware resources from the performance point of view: CPU, memory, disk, and network.
pcp-atopsar-
Generates a system-level activity report over a variety of system resource utilization. The report is generated from a raw logfile previously recorded using
pmloggeror the-woption ofpcp-atop. pcp-dmcache- Displays information about configured Device Mapper Cache targets, such as: device IOPs, cache and metadata device utilization, as well as hit and miss rates and ratios for both reads and writes for each cache device.
pcp-dstat-
Displays metrics of one system at a time. To display metrics of multiple systems, use
--hostoption. pcp-free- Reports on free and used memory in a system.
pcp-htop-
Displays all processes running on a system along with their command line arguments in a manner similar to the
topcommand, but allows you to scroll vertically and horizontally as well as interact using a mouse. You can also view processes in a tree format and select and act on multiple processes at once. pcp-ipcs- Displays information about the inter-process communication (IPC) facilities that the calling process has read access for.
pcp-mpstat- Reports CPU and interrupt-related statistics.
pcp-numastat- Displays NUMA allocation statistics from the kernel memory allocator.
pcp-pidstat- Displays information about individual tasks or processes running on the system, such as CPU percentage, memory and stack usage, scheduling, and priority. Reports live data for the local host by default.
pcp-shping-
Samples and reports on the shell-ping service metrics exported by the
pmdashpingPerformance Metrics Domain Agent (PMDA). pcp-ss-
Displays socket statistics collected by the
pmdasocketsPMDA. pcp-tapestat- Reports I/O statistics for tape devices.
pcp-uptime- Displays how long the system has been running, how many users are currently logged on, and the system load averages for the past 1, 5, and 15 minutes.
pcp-verify- Inspects various aspects of a Performance Co-Pilot collector installation and reports on whether it is configured correctly for certain modes of operation.
pmiostat-
Reports I/O statistics for SCSI devices (by default) or device-mapper devices (with the
-xdevice-mapper option). pmrep- Reports on selected, easily customizable, performance metrics values.
Tools distributed with the separately installed pcp-gui package
pmchart- Plots performance metrics values available through the facilities of the Performance Co-Pilot.
pmdumptext- Outputs the values of performance metrics collected live or from a Performance Co-Pilot archive.
Tools distributed with the separately installed pcp-devel package
pmclient- Displays high-level system performance metrics by using the Performance Metrics Application Programming Interface (PMAPI).
pmdbg- Displays available Performance Co-Pilot debug control flags and their values.
pmerr- Displays available Performance Co-Pilot error codes and their corresponding error messages.
6.5. PCP deployment architectures
Performance Co-Pilot (PCP) supports multiple deployment architectures, based on the scale of the PCP deployment, and offers many options to accomplish advanced setups.
Available scaling deployment setup variants based on the recommended deployment set up by Red Hat, sizing factors, and configuration options include:
Since the PCP version 5.3.0 is unavailable in Red Hat Enterprise Linux 8.4 and the prior minor versions of Red Hat Enterprise Linux 8, Red Hat recommends localhost and pmlogger farm architectures.
For more information about known memory leaks in pmproxy in PCP versions before 5.3.0, see Memory leaks in pmproxy in PCP.
LocalhostEach service runs locally on the monitored machine. When you start a service without any configuration changes, this is the default deployment. Scaling beyond the individual node is not possible in this case.
By default, the deployment setup for Redis is standalone, localhost. However, Redis can optionally perform in a highly-available and highly scalable clustered fashion, where data is shared across multiple hosts. Another viable option is to deploy a Redis cluster in the cloud, or to utilize a managed Redis cluster from a cloud vendor.
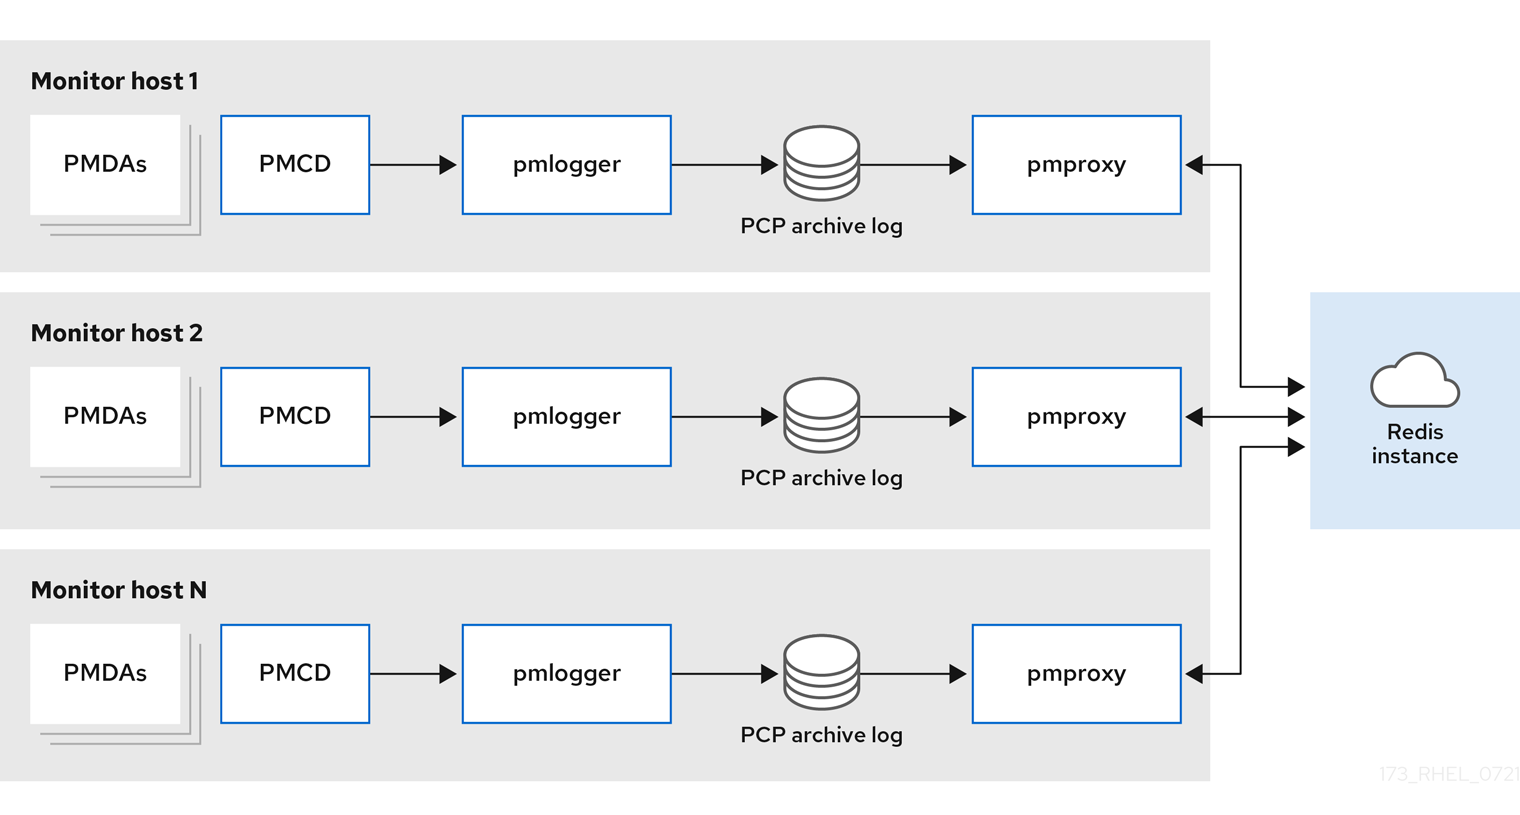
DecentralizedThe only difference between localhost and decentralized setup is the centralized Redis service. In this model, the host executes
pmloggerservice on each monitored host and retrieves metrics from a localpmcdinstance. A localpmproxyservice then exports the performance metrics to a central Redis instance.Figure 6.1. Decentralized logging
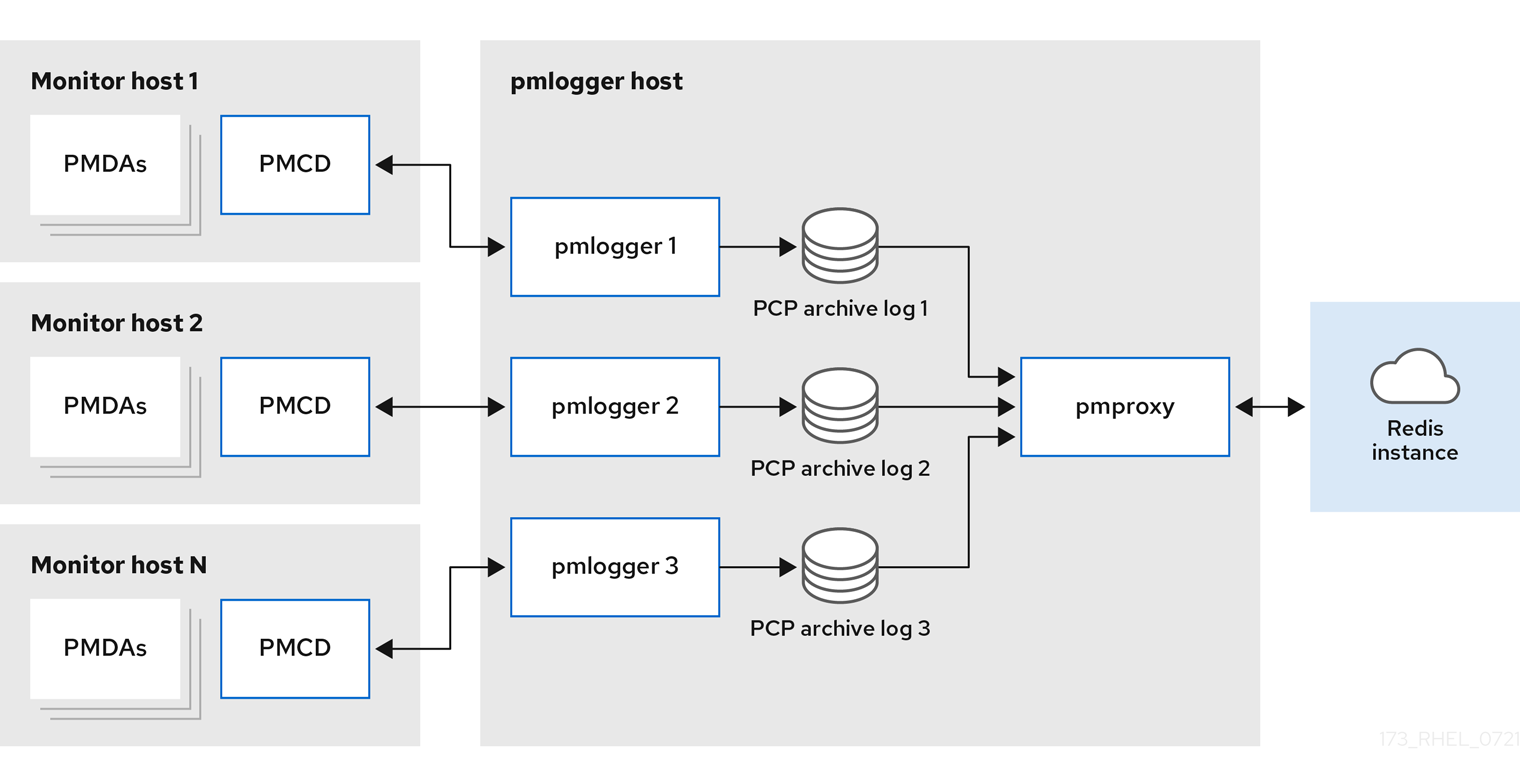
Centralized logging - pmlogger farmWhen the resource usage on the monitored hosts is constrained, another deployment option is a
pmloggerfarm, which is also known as centralized logging. In this setup, a single logger host executes multiplepmloggerprocesses, and each is configured to retrieve performance metrics from a different remotepmcdhost. The centralized logger host is also configured to execute thepmproxyservice, which discovers the resulting PCP archives logs and loads the metric data into a Redis instance.Figure 6.2. Centralized logging - pmlogger farm
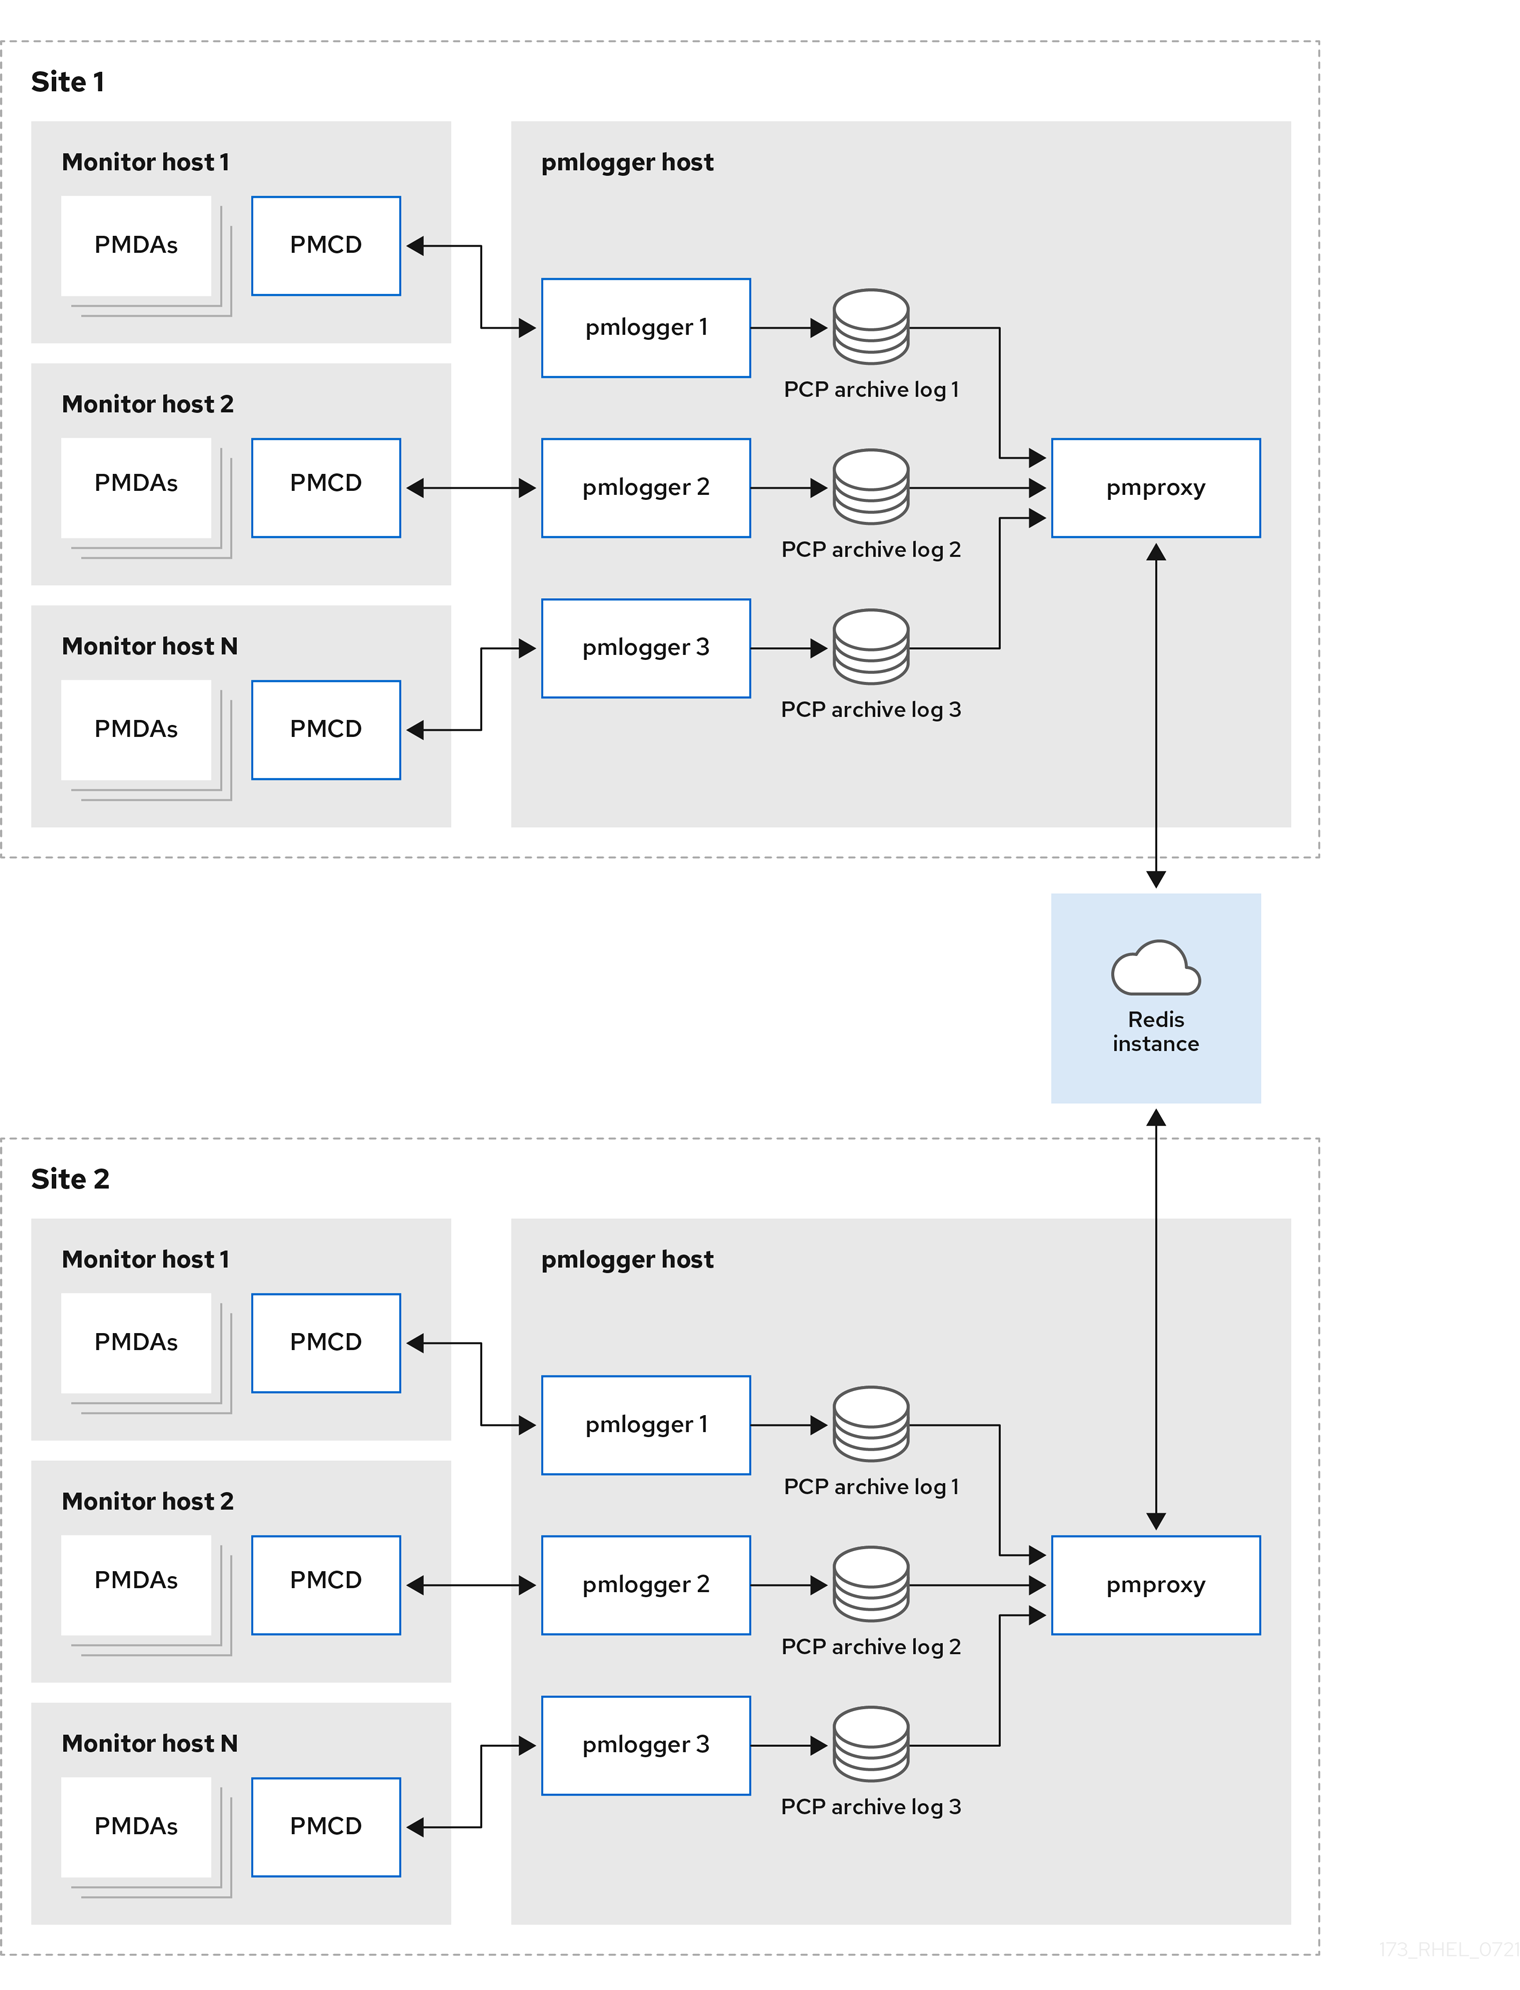
Federated - multiple pmlogger farmsFor large scale deployments, Red Hat recommends to deploy multiple
pmloggerfarms in a federated fashion. For example, onepmloggerfarm per rack or data center. Eachpmloggerfarm loads the metrics into a central Redis instance.Figure 6.3. Federated - multiple pmlogger farms
By default, the deployment setup for Redis is standalone, localhost. However, Redis can optionally perform in a highly-available and highly scalable clustered fashion, where data is shared across multiple hosts. Another viable option is to deploy a Redis cluster in the cloud, or to utilize a managed Redis cluster from a cloud vendor.
Additional resources
-
pcp(1),pmlogger(1),pmproxy(1), andpmcd(1)man pages - Recommended deployment architecture
6.6. Recommended deployment architecture
The following table describes the recommended deployment architectures based on the number of monitored hosts.
Table 6.1. Recommended deployment architecture
| Number of hosts (N) | 1-10 | 10-100 | 100-1000 |
|---|---|---|---|
|
| N | N | N |
|
| 1 to N | N/10 to N | N/100 to N |
|
| 1 to N | 1 to N | N/100 to N |
| Redis servers | 1 to N | 1 to N/10 | N/100 to N/10 |
| Redis cluster | No | Maybe | Yes |
| Recommended deployment setup | Localhost, Decentralized, or Centralized logging | Decentralized, Centralized logging, or Federated | Decentralized or Federated |
6.7. Sizing factors
The following are the sizing factors required for scaling:
Remote system size-
The number of CPUs, disks, network interfaces, and other hardware resources affects the amount of data collected by each
pmloggeron the centralized logging host. Logged Metrics-
The number and types of logged metrics play an important role. In particular, the
per-process proc.*metrics require a large amount of disk space, for example, with the standardpcp-zeroconfsetup, 10s logging interval, 11 MB without proc metrics versus 155 MB with proc metrics - a factor of 10 times more. Additionally, the number of instances for each metric, for example the number of CPUs, block devices, and network interfaces also impacts the required storage capacity. Logging Interval-
The interval how often metrics are logged, affects the storage requirements. The expected daily PCP archive file sizes are written to the
pmlogger.logfile for eachpmloggerinstance. These values are uncompressed estimates. Since PCP archives compress very well, approximately 10:1, the actual long term disk space requirements can be determined for a particular site. pmlogrewrite-
After every PCP upgrade, the
pmlogrewritetool is executed and rewrites old archives if there were changes in the metric metadata from the previous version and the new version of PCP. This process duration scales linear with the number of archives stored.
Additional resources
-
pmlogrewrite(1)andpmlogger(1)man pages
6.8. Configuration options for PCP scaling
The following are the configuration options, which are required for scaling:
sysctl and rlimit settings-
When archive discovery is enabled,
pmproxyrequires four descriptors for everypmloggerthat it is monitoring or log-tailing, along with the additional file descriptors for the service logs andpmproxyclient sockets, if any. Eachpmloggerprocess uses about 20 file descriptors for the remotepmcdsocket, archive files, service logs, and others. In total, this can exceed the default 1024 soft limit on a system running around 200pmloggerprocesses. Thepmproxyservice inpcp-5.3.0and later automatically increases the soft limit to the hard limit. On earlier versions of PCP, tuning is required if a high number ofpmloggerprocesses are to be deployed, and this can be accomplished by increasing the soft or hard limits forpmlogger. For more information, see How to set limits (ulimit) for services run by systemd. Local Archives-
The
pmloggerservice stores metrics of local and remotepmcdsin the/var/log/pcp/pmlogger/directory. To control the logging interval of the local system, update the/etc/pcp/pmlogger/control.d/configfilefile and add-t Xin the arguments, where X is the logging interval in seconds. To configure which metrics should be logged, executepmlogconf /var/lib/pcp/config/pmlogger/config.clienthostname. This command deploys a configuration file with a default set of metrics, which can optionally be further customized. To specify retention settings, that is when to purge old PCP archives, update the/etc/sysconfig/pmlogger_timersfile and specifyPMLOGGER_DAILY_PARAMS="-E -k X", where X is the amount of days to keep PCP archives. RedisThe
pmproxyservice sends logged metrics frompmloggerto a Redis instance. The following are the available two options to specify the retention settings in the/etc/pcp/pmproxy/pmproxy.confconfiguration file:-
stream.expirespecifies the duration when stale metrics should be removed, that is metrics which were not updated in a specified amount of time in seconds. -
stream.maxlenspecifies the maximum number of metric values for one metric per host. This setting should be the retention time divided by the logging interval, for example 20160 for 14 days of retention and 60s logging interval (60*60*24*14/60)
-
Additional resources
-
pmproxy(1),pmlogger(1), andsysctl(8)man pages
6.9. Example: Analyzing the centralized logging deployment
The following results were gathered on a centralized logging setup, also known as pmlogger farm deployment, with a default pcp-zeroconf 5.3.0 installation, where each remote host is an identical container instance running pmcd on a server with 64 CPU cores, 376 GB RAM, and one disk attached.
The logging interval is 10s, proc metrics of remote nodes are not included, and the memory values refer to the Resident Set Size (RSS) value.
Table 6.2. Detailed utilization statistics for 10s logging interval
| Number of Hosts | 10 | 50 |
|---|---|---|
| PCP Archives Storage per Day | 91 MB | 522 MB |
|
| 160 MB | 580 MB |
|
| 2 MB | 9 MB |
|
| 1.4 GB | 6.3 GB |
| Redis Memory per Day | 2.6 GB | 12 GB |
Table 6.3. Used resources depending on monitored hosts for 60s logging interval
| Number of Hosts | 10 | 50 | 100 |
|---|---|---|---|
| PCP Archives Storage per Day | 20 MB | 120 MB | 271 MB |
|
| 104 MB | 524 MB | 1049 MB |
|
| 0.38 MB | 1.75 MB | 3.48 MB |
|
| 2.67 GB | 5.5GB | 9 GB |
| Redis Memory per Day | 0.54 GB | 2.65 GB | 5.3 GB |
The pmproxy queues Redis requests and employs Redis pipelining to speed up Redis queries. This can result in high memory usage. For troubleshooting this issue, see Troubleshooting high memory usage.
6.10. Example: Analyzing the federated setup deployment
The following results were observed on a federated setup, also known as multiple pmlogger farms, consisting of three centralized logging (pmlogger farm) setups, where each pmlogger farm was monitoring 100 remote hosts, that is 300 hosts in total.
This setup of the pmlogger farms is identical to the configuration mentioned in the
Example: Analyzing the centralized logging deployment for 60s logging interval, except that the Redis servers were operating in cluster mode.
Table 6.4. Used resources depending on federated hosts for 60s logging interval
| PCP Archives Storage per Day | pmlogger Memory | Network per Day (In/Out) | pmproxy Memory | Redis Memory per Day |
|---|---|---|---|---|
| 277 MB | 1058 MB | 15.6 MB / 12.3 MB | 6-8 GB | 5.5 GB |
Here, all values are per host. The network bandwidth is higher due to the inter-node communication of the Redis cluster.
6.11. Troubleshooting high memory usage
The following scenarios can result in high memory usage:
-
The
pmproxyprocess is busy processing new PCP archives and does not have spare CPU cycles to process Redis requests and responses. - The Redis node or cluster is overloaded and cannot process incoming requests on time.
The pmproxy service daemon uses Redis streams and supports the configuration parameters, which are PCP tuning parameters and affects Redis memory usage and key retention. The /etc/pcp/pmproxy/pmproxy.conf file lists the available configuration options for pmproxy and the associated APIs.
The following procedure describes how to troubleshoot high memory usage issue.
Prerequisites
Install the
pcp-pmda-redispackage:# yum install pcp-pmda-redis
Install the redis PMDA:
# cd /var/lib/pcp/pmdas/redis && ./Install
Procedure
To troubleshoot high memory usage, execute the following command and observe the
inflightcolumn:$ pmrep :pmproxy backlog inflight reqs/s resp/s wait req err resp err changed throttled byte count count/s count/s s/s count/s count/s count/s count/s 14:59:08 0 0 N/A N/A N/A N/A N/A N/A N/A 14:59:09 0 0 2268.9 2268.9 28 0 0 2.0 4.0 14:59:10 0 0 0.0 0.0 0 0 0 0.0 0.0 14:59:11 0 0 0.0 0.0 0 0 0 0.0 0.0This column shows how many Redis requests are in-flight, which means they are queued or sent, and no reply was received so far.
A high number indicates one of the following conditions:
-
The
pmproxyprocess is busy processing new PCP archives and does not have spare CPU cycles to process Redis requests and responses. - The Redis node or cluster is overloaded and cannot process incoming requests on time.
-
The
To troubleshoot the high memory usage issue, reduce the number of
pmloggerprocesses for this farm, and add another pmlogger farm. Use the federated - multiple pmlogger farms setup.If the Redis node is using 100% CPU for an extended amount of time, move it to a host with better performance or use a clustered Redis setup instead.
To view the
pmproxy.redis.*metrics, use the following command:$ pminfo -ftd pmproxy.redis pmproxy.redis.responses.wait [wait time for responses] Data Type: 64-bit unsigned int InDom: PM_INDOM_NULL 0xffffffff Semantics: counter Units: microsec value 546028367374 pmproxy.redis.responses.error [number of error responses] Data Type: 64-bit unsigned int InDom: PM_INDOM_NULL 0xffffffff Semantics: counter Units: count value 1164 [...] pmproxy.redis.requests.inflight.bytes [bytes allocated for inflight requests] Data Type: 64-bit int InDom: PM_INDOM_NULL 0xffffffff Semantics: discrete Units: byte value 0 pmproxy.redis.requests.inflight.total [inflight requests] Data Type: 64-bit unsigned int InDom: PM_INDOM_NULL 0xffffffff Semantics: discrete Units: count value 0 [...]To view how many Redis requests are inflight, see the
pmproxy.redis.requests.inflight.totalmetric andpmproxy.redis.requests.inflight.bytesmetric to view how many bytes are occupied by all current inflight Redis requests.In general, the redis request queue would be zero but can build up based on the usage of large pmlogger farms, which limits scalability and can cause high latency for
pmproxyclients.Use the
pminfocommand to view information about performance metrics. For example, to view theredis.*metrics, use the following command:$ pminfo -ftd redis redis.redis_build_id [Build ID] Data Type: string InDom: 24.0 0x6000000 Semantics: discrete Units: count inst [0 or "localhost:6379"] value "87e335e57cffa755" redis.total_commands_processed [Total number of commands processed by the server] Data Type: 64-bit unsigned int InDom: 24.0 0x6000000 Semantics: counter Units: count inst [0 or "localhost:6379"] value 595627069 [...] redis.used_memory_peak [Peak memory consumed by Redis (in bytes)] Data Type: 32-bit unsigned int InDom: 24.0 0x6000000 Semantics: instant Units: count inst [0 or "localhost:6379"] value 572234920 [...]To view the peak memory usage, see the
redis.used_memory_peakmetric.
Additional resources
-
pmdaredis(1),pmproxy(1), andpminfo(1)man pages - PCP deployment architectures