
Red Hat Training
A Red Hat training course is available for RHEL 8
Chapter 31. Configuring an operating system to optimize CPU utilization
You can configure the operating system to optimize CPU utilization across their workloads.
31.1. Tools for monitoring and diagnosing processor issues
The following are the tools available in Red Hat Enterprise Linux 8 to monitor and diagnose processor-related performance issues:
-
turbostattool prints counter results at specified intervals to help administrators identify unexpected behavior in servers, such as excessive power usage, failure to enter deep sleep states, or system management interrupts (SMIs) being created unnecessarily. -
numactlutility provides a number of options to manage processor and memory affinity. Thenumactlpackage includes thelibnumalibrary which offers a simple programming interface to the NUMA policy supported by the kernel, and can be used for more fine-grained tuning than thenumactlapplication. -
numastattool displays per-NUMA node memory statistics for the operating system and its processes, and shows administrators whether the process memory is spread throughout a system or is centralized on specific nodes. This tool is provided by thenumactlpackage. -
numadis an automatic NUMA affinity management daemon. It monitors NUMA topology and resource usage within a system in order to dynamically improve NUMA resource allocation and management. -
/proc/interruptsfile displays the interrupt request (IRQ) number, the number of similar interrupt requests handled by each processor in the system, the type of interrupt sent, and a comma-separated list of devices that respond to the listed interrupt request. pqosutility is available in theintel-cmt-catpackage. It monitors CPU cache and memory bandwidth on recent Intel processors. It monitors:- The instructions per cycle (IPC).
- The count of last level cache MISSES.
- The size in kilobytes that the program executing in a given CPU occupies in the LLC.
- The bandwidth to local memory (MBL).
- The bandwidth to remote memory (MBR).
-
x86_energy_perf_policytool allows administrators to define the relative importance of performance and energy efficiency. This information can then be used to influence processors that support this feature when they select options that trade off between performance and energy efficiency. -
tasksettool is provided by theutil-linuxpackage. It allows administrators to retrieve and set the processor affinity of a running process, or launch a process with a specified processor affinity.
Additional resources
-
turbostat(8),numactl(8),numastat(8),numa(7),numad(8),pqos(8),x86_energy_perf_policy(8), andtaskset(1)man pages
31.2. Types of system topology
In modern computing, the idea of a CPU is a misleading one, as most modern systems have multiple processors. The topology of the system is the way these processors are connected to each other and to other system resources. This can affect system and application performance, and the tuning considerations for a system.
The following are the two primary types of topology used in modern computing:
Symmetric Multi-Processor (SMP) topology- SMP topology allows all processors to access memory in the same amount of time. However, because shared and equal memory access inherently forces serialized memory accesses from all the CPUs, SMP system scaling constraints are now generally viewed as unacceptable. For this reason, practically all modern server systems are NUMA machines.
Non-Uniform Memory Access (NUMA) topologyNUMA topology was developed more recently than SMP topology. In a NUMA system, multiple processors are physically grouped on a socket. Each socket has a dedicated area of memory and processors that have local access to that memory, these are referred to collectively as a node. Processors on the same node have high speed access to that node’s memory bank, and slower access to memory banks not on their node.
Therefore, there is a performance penalty when accessing non-local memory. Thus, performance sensitive applications on a system with NUMA topology should access memory that is on the same node as the processor executing the application, and should avoid accessing remote memory wherever possible.
Multi-threaded applications that are sensitive to performance may benefit from being configured to execute on a specific NUMA node rather than a specific processor. Whether this is suitable depends on your system and the requirements of your application. If multiple application threads access the same cached data, then configuring those threads to execute on the same processor may be suitable. However, if multiple threads that access and cache different data execute on the same processor, each thread may evict cached data accessed by a previous thread. This means that each thread 'misses' the cache and wastes execution time fetching data from memory and replacing it in the cache. Use the
perftool to check for an excessive number of cache misses.
31.2.1. Displaying system topologies
There are a number of commands that help understand the topology of a system. This procedure describes how to determine the system topology.
Procedure
To display an overview of your system topology:
$ numactl --hardware
available: 4 nodes (0-3)
node 0 cpus: 0 4 8 12 16 20 24 28 32 36
node 0 size: 65415 MB
node 0 free: 43971 MB
[...]
To gather the information about the CPU architecture, such as the number of CPUs, threads, cores, sockets, and NUMA nodes:
$ lscpu
Architecture:          x86_64
CPU op-mode(s):        32-bit, 64-bit
Byte Order:            Little Endian
CPU(s):                40
On-line CPU(s) list:   0-39
Thread(s) per core:    1
Core(s) per socket:    10
Socket(s):             4
NUMA node(s):          4
Vendor ID:             GenuineIntel
CPU family:            6
Model:                 47
Model name:            Intel(R) Xeon(R) CPU E7- 4870  @ 2.40GHz
Stepping:              2
CPU MHz:               2394.204
BogoMIPS:              4787.85
Virtualization:        VT-x
L1d cache:             32K
L1i cache:             32K
L2 cache:              256K
L3 cache:              30720K
NUMA node0 CPU(s):     0,4,8,12,16,20,24,28,32,36
NUMA node1 CPU(s):     2,6,10,14,18,22,26,30,34,38
NUMA node2 CPU(s):     1,5,9,13,17,21,25,29,33,37
NUMA node3 CPU(s):     3,7,11,15,19,23,27,31,35,39
To view a graphical representation of your system:
# yum install hwloc-gui
# lstopo
Figure 31.1. The
lstopooutput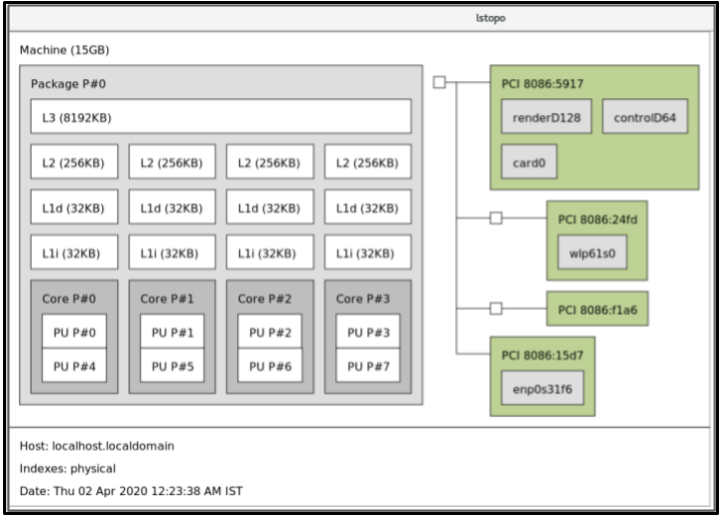
To view the detailed textual output:
# yum install hwloc
# lstopo-no-graphics
Machine (15GB)
  Package L#0 + L3 L#0 (8192KB)
    L2 L#0 (256KB) + L1d L#0 (32KB) + L1i L#0 (32KB) + Core L#0
        PU L#0 (P#0)
        PU L#1 (P#4)
       HostBridge L#0
    PCI 8086:5917
        GPU L#0 "renderD128"
        GPU L#1 "controlD64"
        GPU L#2 "card0"
    PCIBridge
        PCI 8086:24fd
          Net L#3 "wlp61s0"
    PCIBridge
        PCI 8086:f1a6
    PCI 8086:15d7
        Net L#4 "enp0s31f6"
Additional resources
-
numactl(8),lscpu(1), andlstopo(1)man pages
31.3. Configuring kernel tick time
By default, Red Hat Enterprise Linux 8 uses a tickless kernel, which does not interrupt idle CPUs in order to reduce power usage and allow new processors to take advantage of deep sleep states.
Red Hat Enterprise Linux 8 also offers a dynamic tickless option, which is useful for latency-sensitive workloads, such as high performance computing or realtime computing. By default, the dynamic tickless option is disabled. Red Hat recommends using the cpu-partitioning TuneD profile to enable the dynamic tickless option for cores specified as isolated_cores.
This procedure describes how to manually persistently enable dynamic tickless behavior.
Procedure
To enable dynamic tickless behavior in certain cores, specify those cores on the kernel command line with the
nohz_fullparameter. On a 16 core system, enable thenohz_full=1-15kernel option:# grubby --update-kernel=ALL --args="nohz_full=1-15"
This enables dynamic tickless behavior on cores
1through15, moving all timekeeping to the only unspecified core (core0).When the system boots, manually move the
rcuthreads to the non-latency-sensitive core, in this case core0:# for i in `pgrep rcu[^c]` ; do taskset -pc 0 $i ; done
-
Optional: Use the
isolcpusparameter on the kernel command line to isolate certain cores from user-space tasks. Optional: Set the CPU affinity for the kernel’s
write-back bdi-flushthreads to the housekeeping core:echo 1 > /sys/bus/workqueue/devices/writeback/cpumask
Verification steps
Once the system is rebooted, verify if
dynticksare enabled:# journalctl -xe | grep dynticks Mar 15 18:34:54 rhel-server kernel: NO_HZ: Full dynticks CPUs: 1-15.
Verify that the dynamic tickless configuration is working correctly:
# perf stat -C 1 -e irq_vectors:local_timer_entry taskset -c 1 sleep 3
This command measures ticks on CPU 1 while telling CPU 1 to sleep for 3 seconds.
The default kernel timer configuration shows around 3100 ticks on a regular CPU:
# perf stat -C 0 -e irq_vectors:local_timer_entry taskset -c 0 sleep 3

 Performance counter stats for 'CPU(s) 0':

             3,107      irq_vectors:local_timer_entry

       3.001342790 seconds time elapsed
With the dynamic tickless kernel configured, you should see around 4 ticks instead:
# perf stat -C 1 -e irq_vectors:local_timer_entry taskset -c 1 sleep 3

 Performance counter stats for 'CPU(s) 1':

                 4      irq_vectors:local_timer_entry

       3.001544078 seconds time elapsed
Additional resources
31.4. Overview of an interrupt request
An interrupt request or IRQ is a signal for immediate attention sent from a piece of hardware to a processor. Each device in a system is assigned one or more IRQ numbers which allow it to send unique interrupts. When interrupts are enabled, a processor that receives an interrupt request immediately pauses execution of the current application thread in order to address the interrupt request.
Because interrupt halts normal operation, high interrupt rates can severely degrade system performance. It is possible to reduce the amount of time taken by interrupts by configuring interrupt affinity or by sending a number of lower priority interrupts in a batch (coalescing a number of interrupts).
Interrupt requests have an associated affinity property, smp_affinity, which defines the processors that handle the interrupt request. To improve application performance, assign interrupt affinity and process affinity to the same processor, or processors on the same core. This allows the specified interrupt and application threads to share cache lines.
On systems that support interrupt steering, modifying the smp_affinity property of an interrupt request sets up the hardware so that the decision to service an interrupt with a particular processor is made at the hardware level with no intervention from the kernel.
31.4.1. Balancing interrupts manually
If your BIOS exports its NUMA topology, the irqbalance service can automatically serve interrupt requests on the node that is local to the hardware requesting service.
Procedure
- Check which devices correspond to the interrupt requests that you want to configure.
Find the hardware specification for your platform. Check if the chipset on your system supports distributing interrupts.
- If it does, you can configure interrupt delivery as described in the following steps. Additionally, check which algorithm your chipset uses to balance interrupts. Some BIOSes have options to configure interrupt delivery.
- If it does not, your chipset always routes all interrupts to a single, static CPU. You cannot configure which CPU is used.
Check which Advanced Programmable Interrupt Controller (APIC) mode is in use on your system:
$ journalctl --dmesg | grep APIC
Here,
-
If your system uses a mode other than
flat, you can see a line similar toSetting APIC routing to physical flat. If you can see no such message, your system uses
flatmode.If your system uses
x2apicmode, you can disable it by adding thenox2apicoption to the kernel command line in thebootloaderconfiguration.Only non-physical flat mode (
flat) supports distributing interrupts to multiple CPUs. This mode is available only for systems that have up to8CPUs.
-
If your system uses a mode other than
-
Calculate the
smp_affinity mask. For more information about how to calculate thesmp_affinity mask, see Setting the smp_affinity mask.
Additional resources
-
journalctl(1)andtaskset(1)man pages
31.4.2. Setting the smp_affinity mask
The smp_affinity value is stored as a hexadecimal bit mask representing all processors in the system. Each bit configures a different CPU. The least significant bit is CPU 0.
The default value of the mask is f, which means that an interrupt request can be handled on any processor in the system. Setting this value to 1 means that only processor 0 can handle the interrupt.
Procedure
In binary, use the value 1 for CPUs that handle the interrupts. For example, to set CPU 0 and CPU 7 to handle interrupts, use
0000000010000001as the binary code:Table 31.1. Binary Bits for CPUs
CPU
15
14
13
12
11
10
9
8
7
6
5
4
3
2
1
0
Binary
0
0
0
0
0
0
0
0
1
0
0
0
0
0
0
1
Convert the binary code to hexadecimal:
For example, to convert the binary code using Python:
>>> hex(int('0000000010000001', 2))

'0x81'
On systems with more than 32 processors, you must delimit the
smp_affinityvalues for discrete 32 bit groups. For example, if you want only the first 32 processors of a 64 processor system to service an interrupt request, use0xffffffff,00000000.The interrupt affinity value for a particular interrupt request is stored in the associated
/proc/irq/irq_number/smp_affinityfile. Set thesmp_affinitymask in this file:# echo mask > /proc/irq/irq_number/smp_affinity
Additional resources
-
journalctl(1),irqbalance(1), andtaskset(1)man pages