Chapter 4. Troubleshooting
This chapter contains logging and support information to assist with troubleshooting your Red Hat OpenStack Platform deployment.
4.1. Support
If client commands fail or you run into other issues, contact Red Hat Technical Support with a description of what happened, the full console output, all log files referenced in the console output, and an sosreport from the node that is (or might be) in trouble. For example, if you encounter a problem on the compute level, run sosreport on the Nova node, or if it is a networking issue, run the utility on the Neutron node. For general deployment issues, it is best to run sosreport on the cloud controller.
For information about the sosreport command (sos package), refer to What is a sosreport and how to create one in Red Hat Enterprise Linux 4.6 and later.
Check also the /var/log/messages file for any hints.
4.2. Troubleshoot Identity Client (keystone) Connectivity Problems
When the Identity client (keystone) is unable to contact the Identity service it returns an error:
Unable to communicate with identity service: [Errno 113] No route to host. (HTTP 400)
To debug the issue check for these common causes:
- Identity service is down
Identity Service now runs within httpd.service. On the system hosting the Identity service, check the service status:
# systemctl status httpd.service
If the service is not active then log in as the root user and start it.
# systemctl start httpd.service
- Firewall is not configured properly
-
The firewall might not be configured to allow TCP traffic on ports
5000and35357. If so, see Managing the Overcloud Firewall in the Advanced Overcloud Customization guide for instructions on checking your firewall settings and defining custom rules. - Service Endpoints not defined correctly
On the system hosting the Identity service check that the endpoints are defined correctly.
Obtain the administration token:
# grep admin_token /etc/keystone/keystone.conf
admin_token = 91f0866234a64fc299db8f26f8729488
Determine the correct administration endpoint for the Identity service:
http://IP:35357/VERSION
Replace IP with the IP address or host name of the system hosting the Identity service. Replace VERSION with the API version (
v2.0, orv3) that is in use.Unset any pre-defined Identity service related environment variables:
# unset OS_USERNAME OS_TENANT_NAME OS_PASSWORD OS_AUTH_URL
Use the administration token and endpoint to authenticate with the Identity service. Confirm that the Identity service endpoint is correct. For example:
# openstack endpoint list --os-token=91f0556234a64fc299db8f26f8729488 --os-url=https://osp.lab.local:35357/v3/ --os-identity-api-version 3
Verify that the listed
publicurl,internalurl, andadminurlfor the Identity service are correct. In particular ensure that the IP addresses and port numbers listed within each endpoint are correct and reachable over the network.If these values are incorrect, add the correct endpoint and remove any incorrect endpoints using the
endpoint deleteaction of theopenstackcommand. For example:# openstack endpoint delete 2d32fa6feecc49aab5de538bdf7aa018 --os-token=91f0866234a64fc299db8f26f8729488 --os-url=https://osp.lab.local:35357/v3/ --os-identity-api-version 3
Replace TOKEN and ENDPOINT with the values identified previously. Replace ID with the identity of the endpoint to remove as listed by the
endpoint-listaction.
4.3. Troubleshoot OpenStack Networking Issues
This section discusses the different commands you can use and procedures you can follow to troubleshoot the OpenStack Networking service issues.
- Debugging Networking Device
-
Use the
ip acommand to display all the physical and virtual devices. -
Use the
ovs-vsctl showcommand to display the interfaces and bridges in a virtual switch. -
Use the
ovs-dpctl showcommand to show datapaths on the switch.
-
Use the
- Tracking Networking Packets
Use the
tcpdumpcommand to see where packets are not getting through.# tcpdump -n -i INTERFACE -e -w FILENAME
Replace INTERFACE with the name of the network interface to see where the packets are not getting through. The interface name can be the name of the bridge or host Ethernet device.
The
-eflag ensures that the link-level header is dumped (in which thevlantag will appear).The
-wflag is optional. You can use it only if you want to write the output to a file. If not, the output is written to the standard output (stdout).For more information about
tcpdump, refer to its manual page by runningman tcpdump.
- Debugging Network Namespaces
-
Use the
ip netns listcommand to list all known network namespaces. Use the
ip netns execcommand to show routing tables inside specific namespaces.# ip netns exec NAMESPACE_ID bash # route -nStart the
ip netns execcommand in a bash shell so that subsequent commands can be invoked without theip netns execcommand.
-
Use the
4.4. Troubleshoot Networks and Routes Tab Display Issues in the Dashboard
The Networks and Routers tabs only appear in the dashboard when the environment is configured to use OpenStack Networking. In particular note that by default the PackStack utility currently deploys Nova Networking and as such in environments deployed in this manner the tab will not be visible.
If OpenStack Networking is deployed in the environment but the tabs still do not appear ensure that the service endpoints are defined correctly in the Identity service, that the firewall is allowing access to the endpoints, and that the services are running.
4.5. Troubleshoot Instance Launching Errors in the Dashboard
When using the dashboard to launch instances if the operation fails, a generic ERROR message is displayed. Determining the actual cause of the failure requires the use of the command line tools.
Use the nova list command to locate the unique identifier of the instance. Then use this identifier as an argument to the nova show command. One of the items returned will be the error condition. The most common value is NoValidHost.
This error indicates that no valid host was found with enough available resources to host the instance. To work around this issue, consider choosing a smaller instance size or increasing the overcommit allowances for your environment.
To host a given instance, the compute node must have not only available CPU and RAM resources but also enough disk space for the ephemeral storage associated with the instance.
4.6. Troubleshoot Keystone v3 Dashboard Authentication
django_openstack_auth is a pluggable Django authentication back end, that works with Django’s contrib.auth framework, to authenticate a user against the OpenStack Identity service API. Django_openstack_auth uses the token object to encapsulate user and Keystone related information. The dashboard uses the token object to rebuild the Django user object.
The token object currently stores:
- Keystone token
- User information
- Scope
- Roles
- Service catalog
The dashboard uses Django’s sessions framework for handling user session data. The following is a list of numerous session back ends available, which are controlled through the SESSION_ENGINE setting in your local_settings.py file:
- Local Memory Cache
- Memcached
- Database
- Cached Database
- Cookies
In some cases, particularly when a signed cookie session back end is used and, when having many or all services enabled all at once, the size of cookies can reach its limit and the dashboard can fail to log in. One of the reasons for the growth of cookie size is the service catalog. As more services are registered, the bigger the size of the service catalog would be.
In such scenarios, to improve the session token management, include the following configuration settings for logging in to the dashboard, especially when using Keystone v3 authentication.
In /usr/share/openstack-dashboard/openstack_dashboard/settings.py add the following configuration:
DATABASES =
{
  default:
  {
    ENGINE: django.db.backends.mysql,
    NAME: horizondb,
    USER: User Name,
    PASSWORD: Password,
    HOST: localhost,
   }
}
In the same file, change SESSION_ENGINE to:
SESSION_ENGINE = 'django.contrib.sessions.backends.cached_db'
Connect to the database service using the mysql command, replacing USER with the user name by which to connect. The USER must be a root user (or at least as a user with the correct permission: create db).
# mysql -u USER -p
Create the Horizon database.
mysql > create database horizondb;
Exit the mysql client.
mysql > exit
Change to the openstack_dashboard directory and sync the database using:
# cd /usr/share/openstack-dashboard/openstack_dashboard
$ ./manage.py syncdb
You do not need to create a superuser, so answer n to the question.
Restart Apache http server. For Red Hat Enterprise Linux:
# systemctl restart httpd
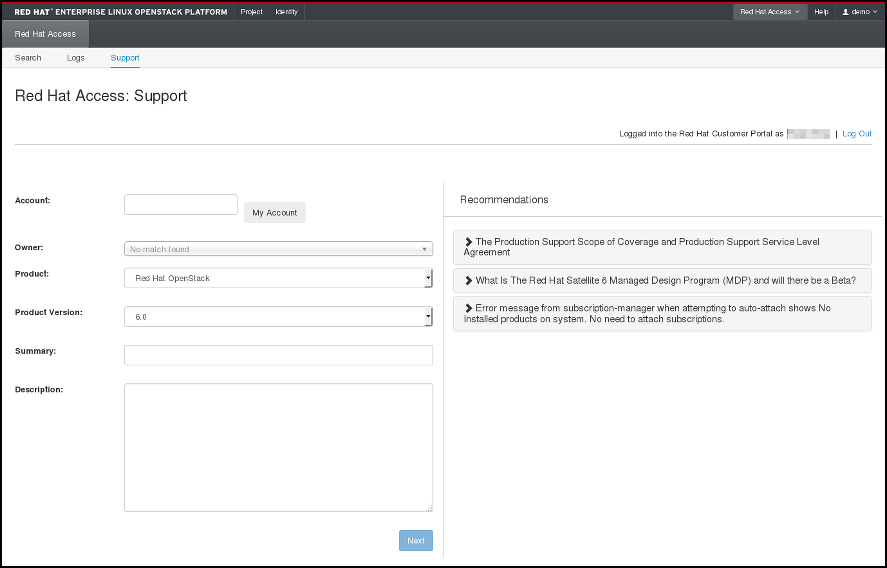
4.6.1. OpenStack Dashboard - Red Hat Access Tab
The Red Hat Access tab, which is part of the OpenStack dashboard, allows you to search for and read articles or solutions from the Red Hat Customer Portal, view logs from your instances and diagnose them, and work with your customer support cases.
Figure 4.1. Red Hat Access Tab.

You must be logged in to the Red Hat Customer Portal in the browser in order to be able to use the functions provided by the Red Hat Access tab.
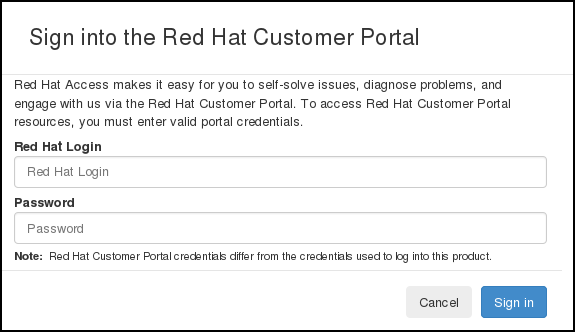
If you are not logged in, you can do so now:
- Click Log In.
- Enter your Red Hat login.
- Enter your Red Hat password.
- Click Sign in.
This is how the form looks:
Figure 4.2. Logging in to the Red Hat Customer Portal.
If you do not log in now, you will be prompted for your Red Hat login and password when you use one of the functions that require authentication.
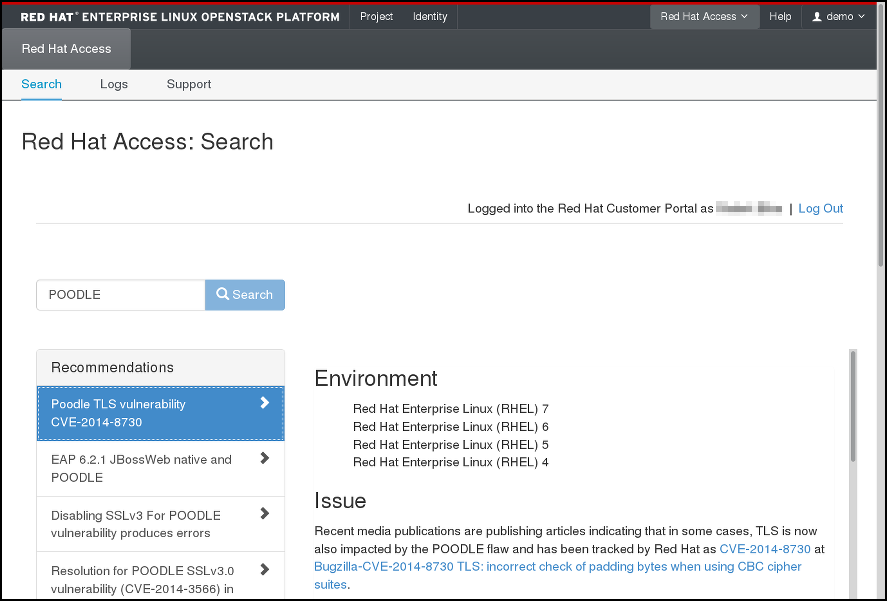
4.6.1.1. Search
You can search for articles and solutions from Red Hat Customer Portal by entering one or more search keywords. The titles of the relevant articles and solutions will then be displayed. Click on a title to view the given article or solution:
Figure 4.3. Example of Search Results on the Red Hat Access Tab.
4.6.1.2. Logs
Here you can read logs from your OpenStack instances:
Figure 4.4. Instance Logs on the Red Hat Access Tab.
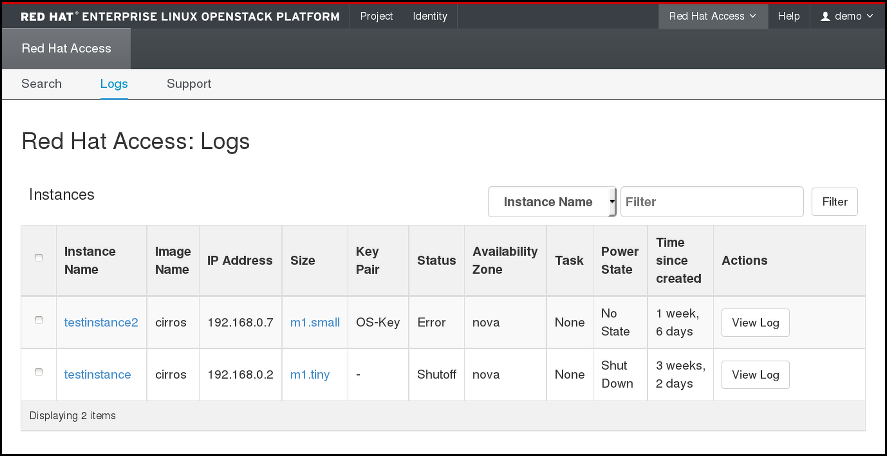
Find the instance of your choice in the table. If you have many instances, you can filter them by name, status, image ID, or flavor ID. Click View Log in the Actions column for the instance to check.
When an instance log is displayed, you can click Red Hat Diagnose to get recommendations regarding its contents:
Figure 4.5. Instance Logs on the Red Hat Access Tab.
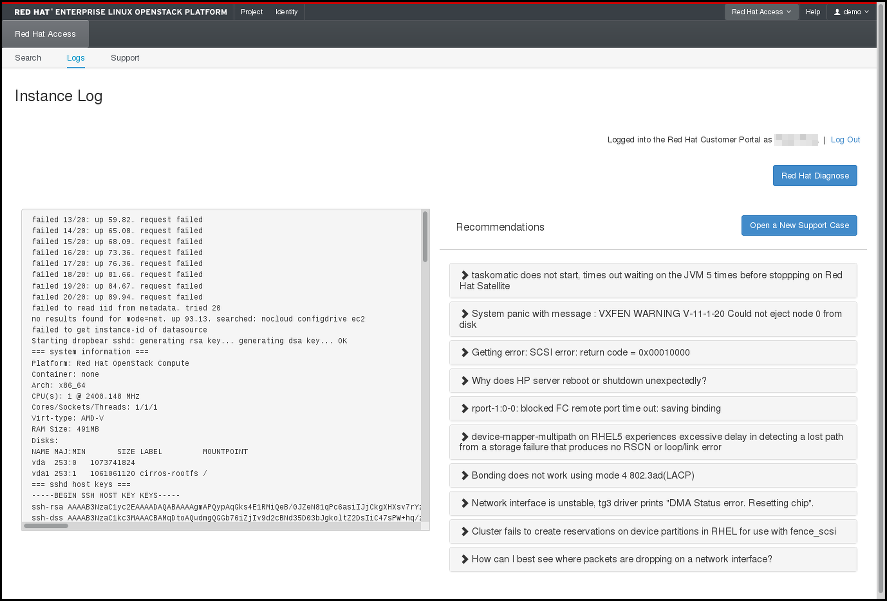
If none of the recommendations are useful or a genuine problem has been logged, click Open a New Support Case to report the problem to Red Hat Support.
4.6.1.3. Support
The last option in the Red Hat Access Tab allows you to search for your support cases at the Red Hat Customer Portal:
Figure 4.6. Search for Support Cases.

You can also open a new support case by clicking the appropriate button and filling out the form on the following page:
Figure 4.7. Open a New Support Case.