
Chapter 3. Analyzing Logs
Use the Discover page to interactively explore the data collected from Red Hat Virtualization. Each set of results that is collected is referred to as a document. Documents are collected from the following log files:
- engine.log contains all Red Hat Virtualization Manager UI crashes, Active Directory lookups, database issues, and other events.
- vdsm.log is the log file for VDSM, the Manager’s agent on the virtualization host(s), and contains host-related events.
3.1. Graphic User Interface Elements
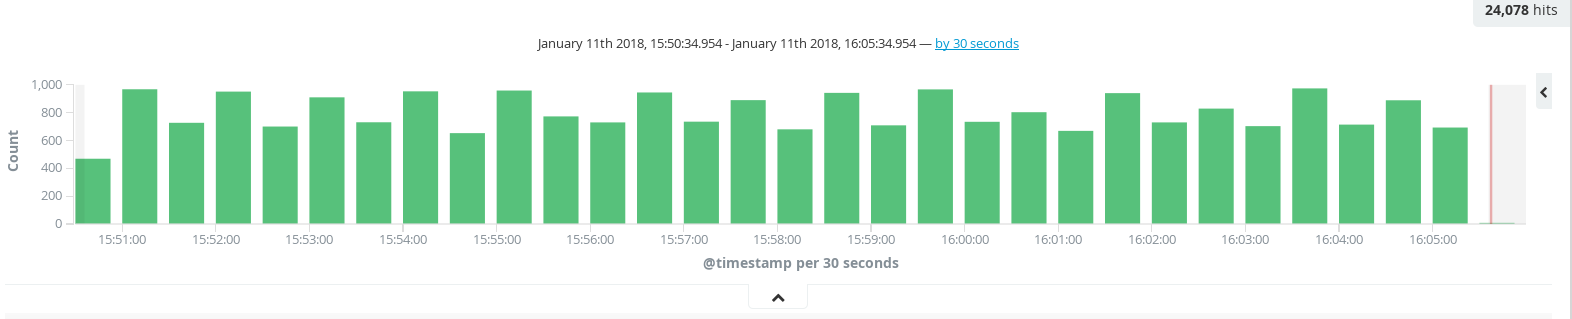
The distribution of documents over time is displayed in a histogram at the top of the page. By default the information is grouped into 30 second intervals, but this can be changed by clicking the time drop-down list that appears above the histogram.
Figure 3.1. Histogram
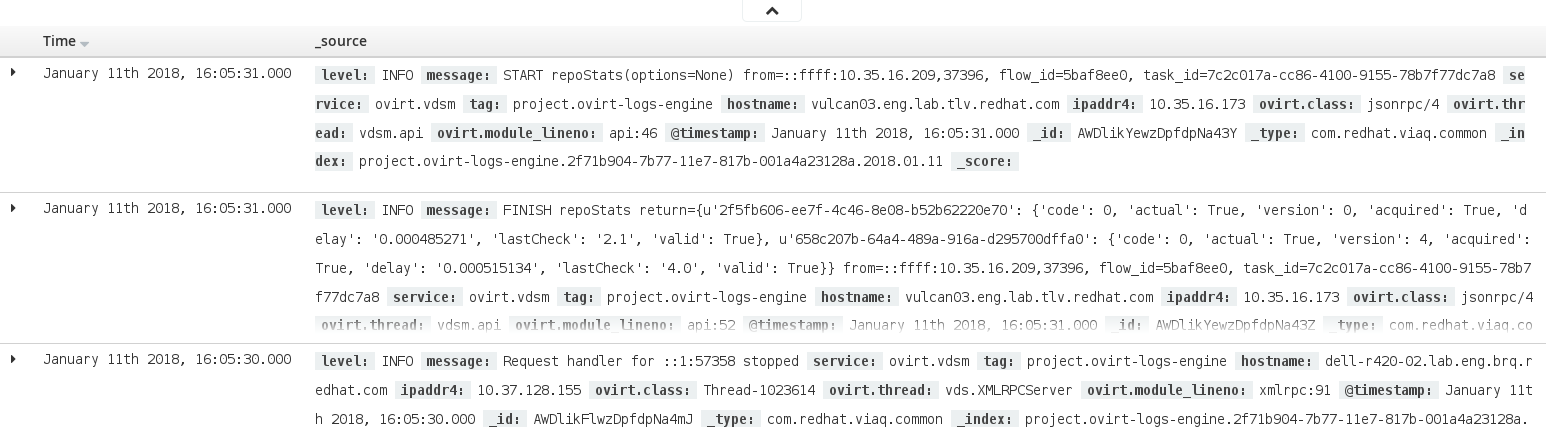
The bottom of the page displays the documents in a table, sorted according to time.
Figure 3.2. Documents Table
3.2. Using the Discover Page
From the Discover page you can:
3.2.1. Setting the Time Filter
By default, data from the last 15 minutes is displayed. There are several ways to change the time filter:
-
Click the time filter
 and either select a predefined time filter or define a time range from the Relative or Absolute menus.
- Define a filter directly from the histogram by clicking a bar or click and drag over several bars. For more information, see Setting the Time Filter in the Kibana documentation.
3.2.2. Searching Your Data
Use the search field at the top of the page to filter the results according to a specific value. For example, to display results containing the word "login", type *login* in the search field. For more information about searches, see Searching Your Data in the Kibana documentation.
3.2.3. Filtering By Field
Filtering log data by field enables you to focus on the specific error that interests you.
To filter the log data by field:
Click the name of the field you want to filter on from the Available Fields pane. This displays the top five values for that field. To the right of each value, there are two magnifying glass buttons, one for adding a regular (positive) filter, and one for adding a negative filter.
Table 3.1. Available Fields
Available Field Description _id
The unique ID of the document.
_index
The ID of the index to which the document belongs. The index with the project.ovirt-logs prefix is the only relevant index in the Discover page.
hostname
For the engine.log this is the hostname of the Manager. For the vdsm.log this is hostname of the host.
level
The log record’s severity: TRACE, DEBUG, INFO, WARN, ERROR, FATAL.
message
The body of the document’s message.
ovirt.class
The name of a Java class that produced this log.
ovirt.correlationid
For the engine.log only. This ID is used to correlate the multiple parts of a single task performed by the Manager.
ovirt.thread
The name of a Java thread inside which the log record was produced.
tag
Predefined sets of metadata that can be used to filter the data.
@timestamp
The time that the record was issued.
_score
N/A
_type
N/A
ipaddr4
The machine’s IP address.
ovirt.cluster_name
For the vdsm.log only. The name of the cluster to which the host belongs.
ovirt.engine_fqdn
The Manager’s FQDN.
ovirt.module_lineno
The file and line number within the file that ran the command defined in ovirt.class.
pipeline_metadata.collector.inputname
N/A
pipeline_metadata.collector.ipaddr4
N/A
pipeline_metadata.collector.ipaddr6
N/A
pipeline_metadata.collector.name
N/A
pipeline_metadata.collector.received_at
N/A
pipeline_metadata.collector.version
N/A
service
The log file from which the document was extracted.
-
To add a positive filter, click the Positive Filter button
 . This filters out results that do not contain that value in the field.
To add a negative filter, click the Negative Filter button
 . This excludes results that contain that value in the field.
For more information about working with filters, see Working with Filters in the Kibana documentation.
3.2.4. Visualizing Log Data
You can visualize and aggregate log data in the Visualization page by selecting a specific field from within the Discover page.
To visualize log data:
- Click the name of the field you want to visualize from the Available Fields pane (see Section 3.2.3, “Filtering By Field”).
Click the Visualize button that appears beneath the top five values.
You are transferred to the Visualize page where you can view the filtered value in a graphical format.
3.2.5. Customizing the Documents Table
You can customize the way that the data is displayed in the Documents table by adding fields to the table as columns and changing the display order.
To add fields to the table as columns:
- Hover over the name of the field you want to add to the documents table from the Available Fields pane (see Section 3.2.3, “Filtering By Field”).
- Click add. The field is added to the table.
-
Optionally click the Sort by arrow
 that appears next to the column title to sort the results by that column.