
Managing and monitoring business processes in Business Central
Abstract
Preface
As a process administrator, you can use Business Central in Red Hat Process Automation Manager to manage and monitor process instances and tasks running on a number of projects. From Business Central you can start a new process instance, verify the state of all process instances, and abort processes. You can view the list of jobs and tasks associated with your processes, as well as understand and communicate any process errors.
Prerequisites
- Red Hat JBoss Enterprise Application Platform 7.2 is installed. For more information, see Red Hat JBoss Enterprise Application Platform 7.2 Installation Guide.
- Red Hat Process Automation Manager is installed. For more information, see Planning a Red Hat Process Automation Manager installation.
-
Red Hat Process Automation Manager is running and you can log in to Business Central with the
process-adminrole. For more information, see Planning a Red Hat Process Automation Manager installation.
Chapter 1. Process monitoring
Red Hat Process Automation Manager provides real-time monitoring for your business processes and includes the following capabilities:
- Business managers can monitor processes in real time.
- Customers can monitor the current status of their requests.
- Administrators can easily monitor any errors related to process execution.
Chapter 2. Process definitions and process instances in Business Central
After you have created, configured, and deployed your project that includes your business processes, you can view the list of all the process definitions in Menu → Manage → Process Definitions. You can refresh the list of deployed process definitions at any time by clicking the refresh button in the upper-right corner.
The process definition list shows all the available process definitions that are deployed into the platform. Click on any of the process definitions listed to show the corresponding process definition details. This displays information about the process definition, such as if there is a sub-process associated with it, or how many users and groups exist in the process definition. The Diagram tab in the process definition details page contains the BPMN2-based diagram of the process definition.
Within each selected process definition, you can start a new process instance for the process definition by clicking the New Process Instance button in the upper-right corner. Process instances that you start from the available process definitions are listed in Menu → Manage → Process Instances.
You can also define the default pagination option for all users under the Manage drop-down menu (Process Definition, Process Instances, Tasks, Execution Errors, and Jobs) and in Menu → Track → Task Inbox.
2.1. Starting a process instance from the process definitions page
You can start a process instance in Menu → Manage → Process Definitions. This is useful for environments where you are working with several projects or process definitions at the same time.
Prerequisites
- A project with a process definition has been deployed in Business Central.
Procedure
- In Business Central, go to Menu → Manage → Process Definitions.
- Select the process definition for which you want to start a new process instance from the list. The details page of the definition opens.
- Click the New Process Instance button in the upper-right corner to start a new process instance.
- Provide any required information for the process instance.
- Click Submit to create the process instance.
- View the new process instance in Menu → Manage → Process Instances.
2.2. Starting a process instance from the process instances page
You can create new process instances or view the list of all the running process instances in Menu → Manage → Process Instances.
Prerequisites
- A project with a process definition has been deployed in Business Central.
Procedure
- In Business Central, go to Menu → Manage → Process Instances.
- Click the New Process Instance button in the upper-right corner and select the process definition for which you want to start a new process instance from the drop-down list.
- Provide any information required to start a new process instance.
Click Start to create the process instance.
The new process instance appears in the Manage Process Instances list.
2.3. Process instance details
You can view all process instances under Menu → Manage → Process Instances. Each row in the Manage Process Instances list represents a process instance from a particular process definition. Each execution is differentiated from all the others by the internal state of the information that the process is manipulating
Figure 2.1. Features in the Manage Process Instances page
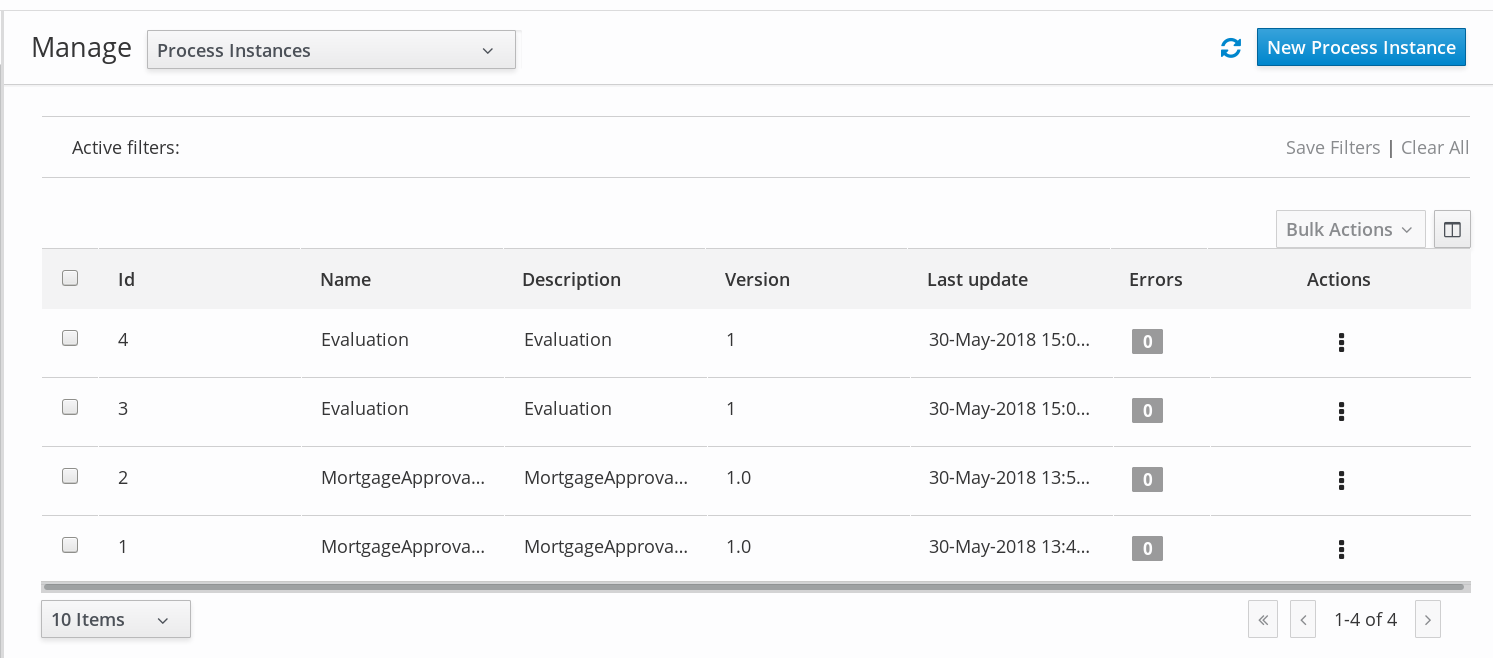
In order to view this information, you can click on any one of the process instances and view the corresponding details.
The process instance page provides several tabs with runtime information related to the process:
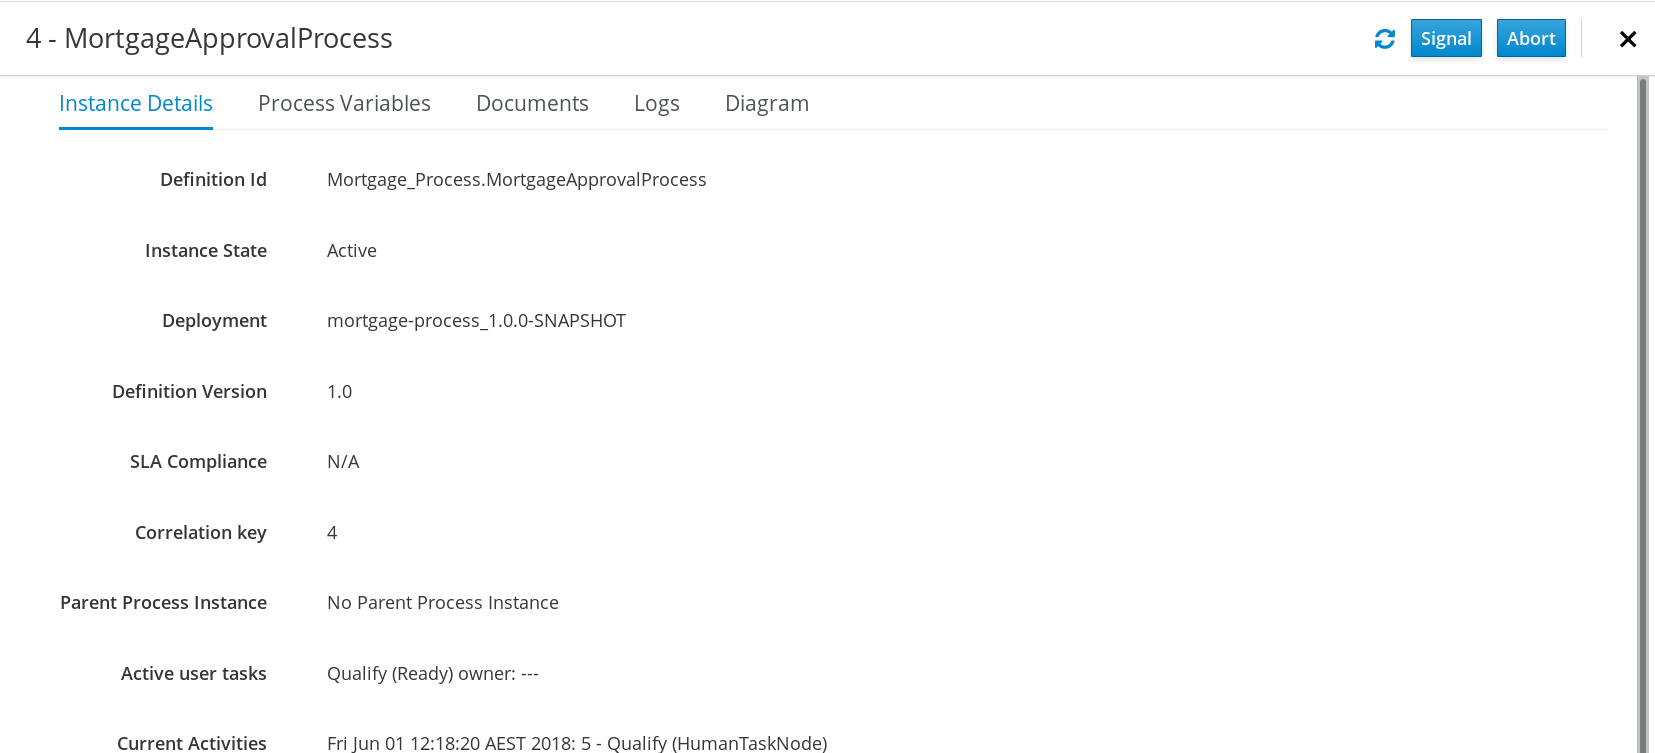
- The Instance Details tab: This gives you a quick overview about what is going on inside the process. It displays the current state of the instance and the current activity that is being executed.
- The Process Variables tab: This displays all of the process variables that are being manipulated by the instance, with the exception of the variables that contain documents. Additionally, you can edit the process variable value and view its history.
- The Documents tab: This displays process documents if the process contains a variable of the type org.jbpm.Document. This enables easy access, download, and manipulation of the attached documents.
- The Logs tab: This displays process instance logs for the respective end users. For more information, see Interacting with processes and tasks.
- The Diagram tab: This tracks the progress of the process instance through the BPMN2 diagram. The node or nodes of the process flow that are in progress are highlighted in red.
For information on user credentials and conditions to be met to access Intelligent Process Server run time data, see Planning a Red Hat Process Automation Manager installation.
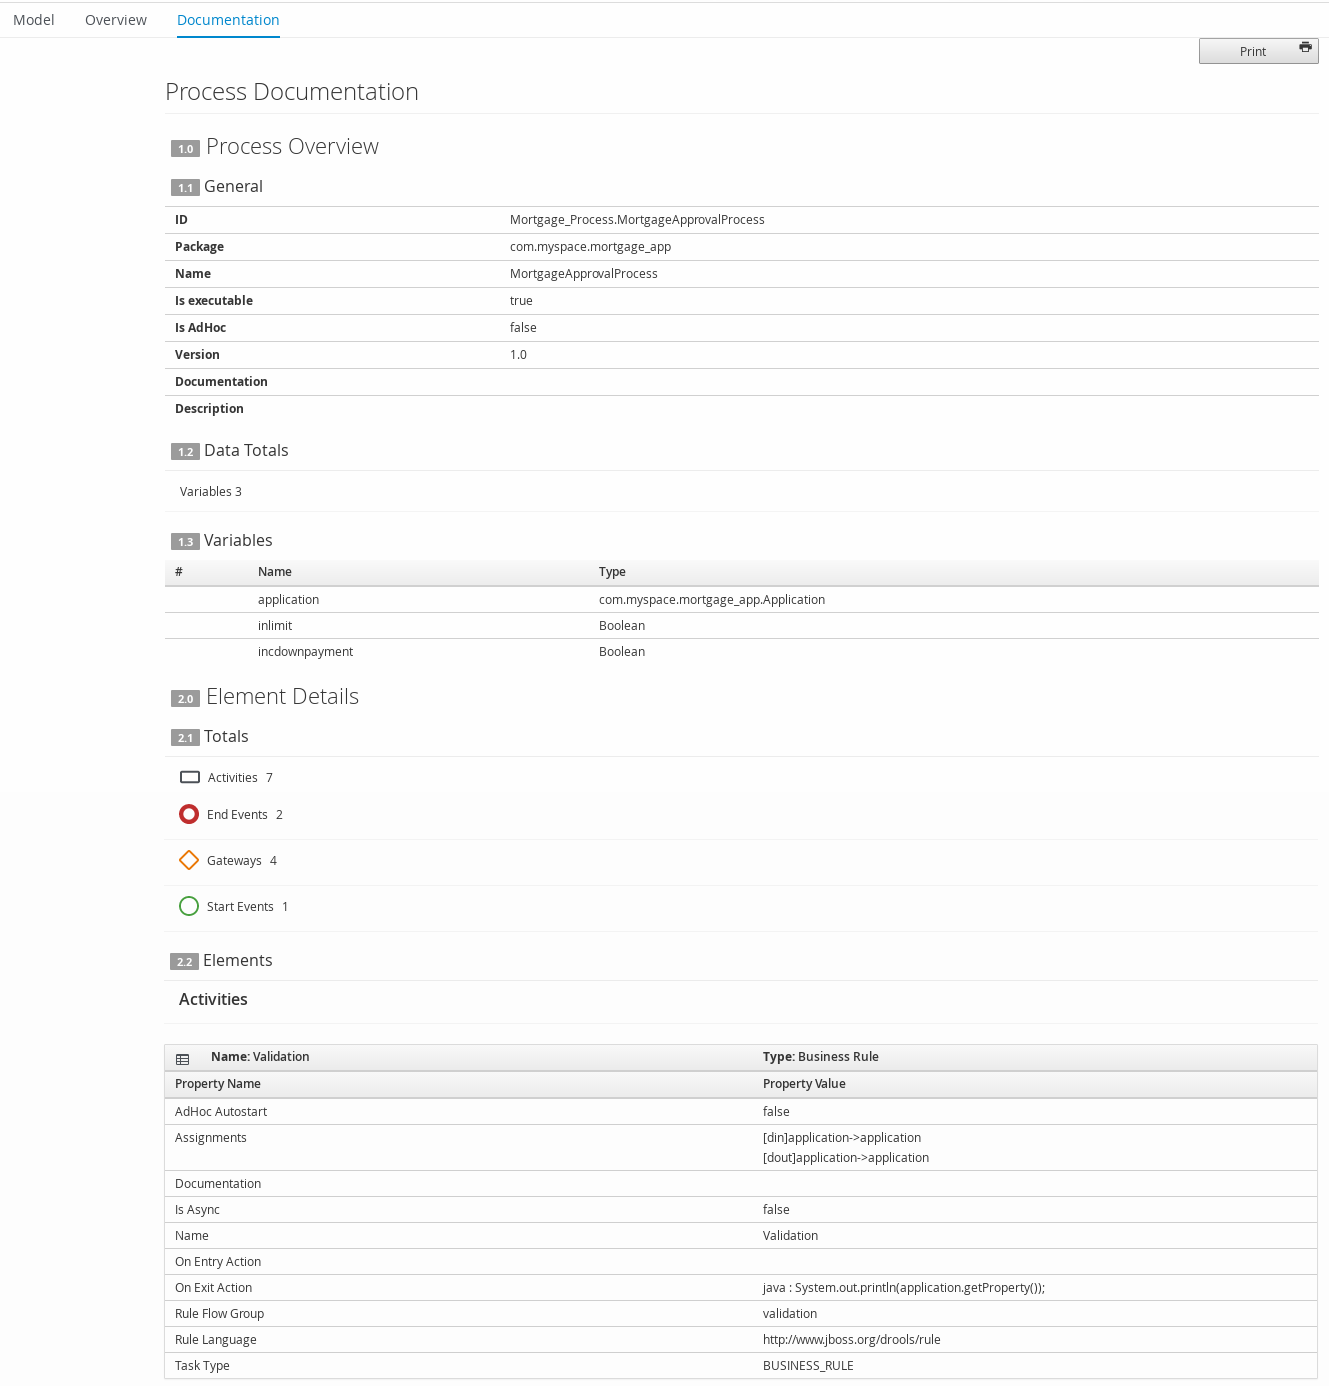
2.4. Generating process documentation in Business Central
In the process designer in Business Central, you can view and print a report of a given process definition. The process documentation summarizes the components, data, and visual flow of the process in a format (PDF) that you can print and share more easily.
Procedure
- In Business Central, navigate to a project that contains a business process and select the process.
In the process designer, click the Documentation tab to view the summary of the process file, and click Print in the top-right corner of the window to print the PDF report.
Figure 2.2. Generate process documentation
Chapter 3. Process instance filtering
For process instances in Menu → Manage → Process Instances, you can use the Filters and Advanced Filters panels to sort process instances as needed.
Figure 3.1. Filtering Process Instances - Default View
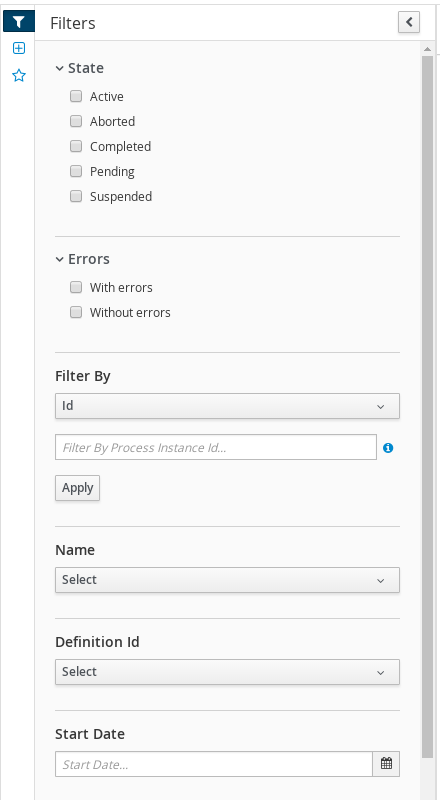
You can filter process instances by the following attributes in the Filters panel:
- Id
Filter by process instance ID.
Input:
Numeric- Initiator
Filter by the user ID of the process instance initiator.
The user ID is a unique value, and depends on the ID management system.
Input:
String- Correlation key
Filter by correlation key.
Input:
String- Description
Filter by process instance description.
Input:
String- State
Filter by different states. You can select more than one status to display results that meet any of the selected states. Removing the status filter displays all processes, regardless of status.
The following filter states are available:
- Active
- Aborted
- Completed
- Pending
- Suspended
- Errors
- Filter by process instances with or without errors.
- Name
- Filter by project name.
- Date and time filtering
- Start Date
- When the process was started.
- Last Update
- When the process was updated or modified.
Each of these filters have the following quick filter options:
- Last Hour
- Today
- Last 24 Hours
- Last 7 Days
- Last 30 Days
Custom
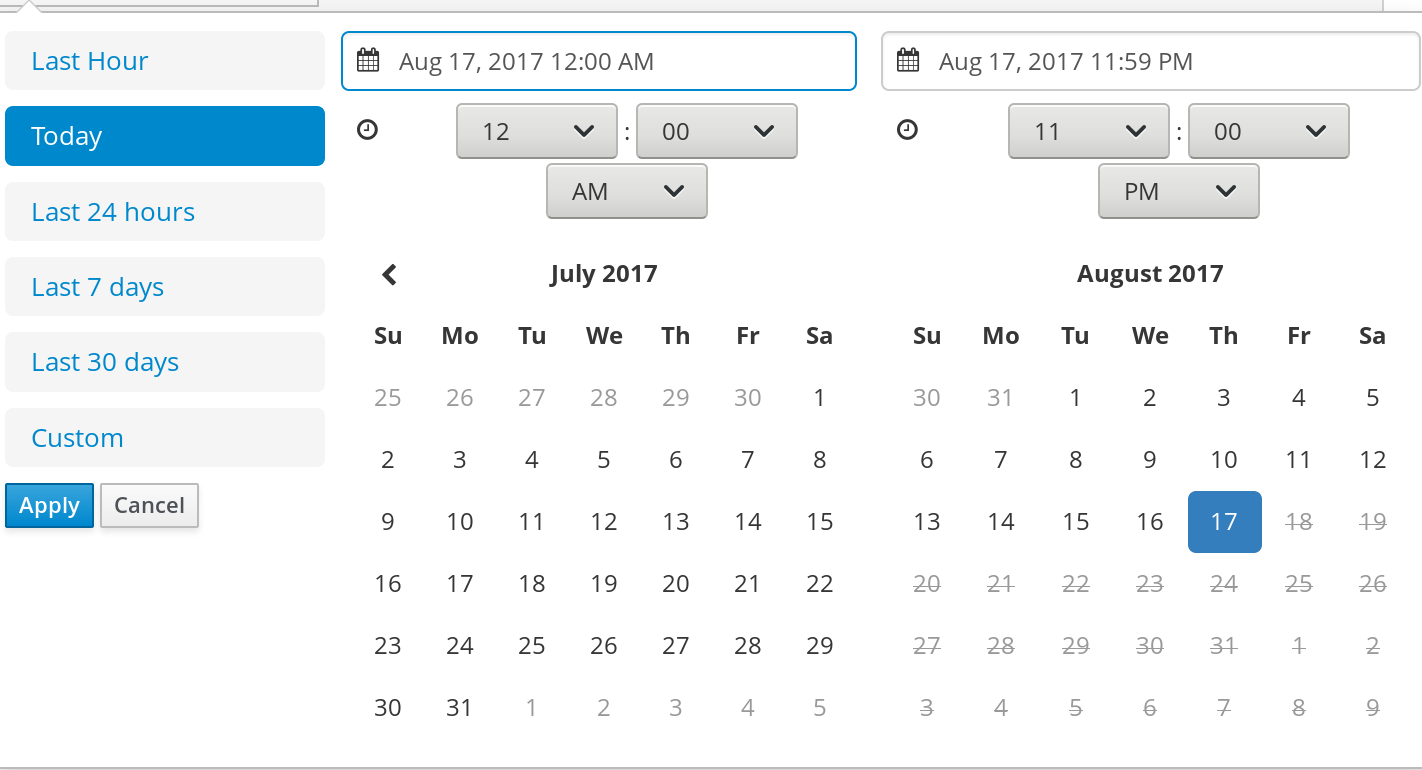
Selecting Custom date and time filtering opens a calendar tool for selecting a date and time range.
Figure 3.2. Process Instances Search by Date Range
3.1. Filtering process instances based on business data
You can add process variables as columns in the process instance list in order to enable flexible filtering of process instances based on business data.
Procedure
- In Business Central, go to Menu → Manage → Process Instances.
- In the Manage Process Instances page, click the advanced filters icon on the left to open the list of process instance Advanced Filters options.
- In the Advanced Filters panel, enter the name and description of the filter, and click Add New.
- From the list of filter values, select processId and equalsTo.
Provide a valid
processIdvalue and click Ok.A new filter is created and immediately applied to the process instances list. The filter is also saved in the Saved Filters list. You can access saved filters by clicking the star icon on the left side of the Manage Process Instances page.
3.2. Creating a custom process instance list
You can view the list of all the running process instances in Menu → Manage → Process Instances in Business Central. From this page, you can manage the instances during run time and monitor their execution. You can customize which columns are displayed, the number of rows displayed per page, and filter the results. You can also create a custom process instance list.
Prerequisites
- A project with a process definition has been deployed in Business Central.
Procedure
- In Business Central, go to Menu → Manage → Process Instances.
- In the Manage Process Instances page, click the advanced filters icon on the left to open the list of process instance Advanced Filters options.
- In the Advanced Filters panel, enter the name and description of the filter that you want to use for your custom process instance list, and click Add New.
From the list of filter values, select the parameters and values to configure the custom process instance list, and click Ok.
A new filter is created and immediately applied to the process instances list. The filter is also saved in the Saved Filters list. You can access saved filters by clicking the star icon on the left side of the Manage Process Instances page.
3.3. Aborting a process instance using Business Central
If a process instance becomes obsolete, you can abort the process instance in Business Central.
Procedure
- In Business Central, go to Menu → Manage → Process Instances to view the list of available process instances.
- Select the process instance you want to abort from the list.
- In the process details page, click the Abort button in the upper-right corner.
3.4. Signaling process instances from Business Central
You can signal a process instance from Business Central.
Prerequisite
- A project with a process definition has been deployed in Business Central.
Procedure
- In Business Central, go to Menu → Manage → Process Instances.
-
Locate the required process instance, click the
 button and select Signal from the drop-down menu.
Fill the following fields:
Signal Name: Corresponds to the
SignalReforMessageRefattributes of the signal. This field is required.NoteYou can also send a
Messageevent to the process by adding theMessage-prefix in front of theMessageRefvalue.- Signal Data: Corresponds to data accompanying the signal. This field is optional.
When using the Business Central user interface, you can only signal Signal intermediate catch events.
3.5. Asynchronous signal events
When several process instances from different process definitions are waiting for the same signal, they are executed sequentially in the same thread. But, if one of those process instances throws a runtime exception, all the other process instances are affected and usually result in a rolled back transaction. To avoid this situation, Red Hat Process Automation Manager supports using asynchronous signals events for:
- Throwing intermediate signal events
- End events
3.5.1. Configuring asynchronous signals for intermediate events
Intermediate events drive the flow of a business process. Intermediate events are used to either catch or throw an event during the execution of the business process. An intermediate event handles a particular situation that occurs during process execution. A throwing signal intermediate event produces a signal object based on the defined properties.
You can configure an asynchronous signal for intermediate events in Business Central.
Prerequisites
- You have created a project in Business Central and it contains at least one business process asset.
- A project with a process definition has been deployed in Business Central.
Procedure
- Open a business process asset.
- In the process designer canvas, drag and drop the Intermediate Signal from the left toolbar.
- Click the Properties icon on the upper-right side of the screen to open the Properties panel.
- Expand the Data Assignments section.
- Click the box under the Assignments sub-section. The Task Data I/O dialog box opens.
- Click Add next to Data Inputs and Assignments.
- Enter a name of the throw event as async in the Name field.
- Leave the Data Type and Source fields blank.
- Click OK.
It will automatically set the executor service on each session. This ensures that each process instance is signaled in a different transaction.
3.5.2. Configuring asynchronous signals for end events
End events indicate the completion of a business process. All end events, with the exception of the none and terminate end events, are throw events. A throwing signal end event is used to finish a process or subprocess flow. When the execution flow enters the element, the execution flow finishes and produces a signal identified by its SignalRef property.
You can configure an asynchronous signal for end events in Business Central.
Prerequisites
- You have created a project in Business Central and it contains at least one business process asset.
- A project with a process definition has been deployed in Business Central.
Procedure
- Open a business process asset.
- In the process designer canvas, drag and drop the End Signal from the left toolbar.
- Click the Properties icon on the upper-right side of the screen to open the Properties panel.
- Expand the Data Assignments section.
- Click the box under the Assignments sub-section. The Task Data I/O dialog box opens.
- Click Add next to Data Inputs and Assignments.
- Enter a name of the throw event as async in the Name field.
- Leave the Data Type and Source fields blank.
- Click OK.
It will automatically set the executor service on each session. This ensures that each process instance is signaled in a different transaction.
Chapter 4. Task management
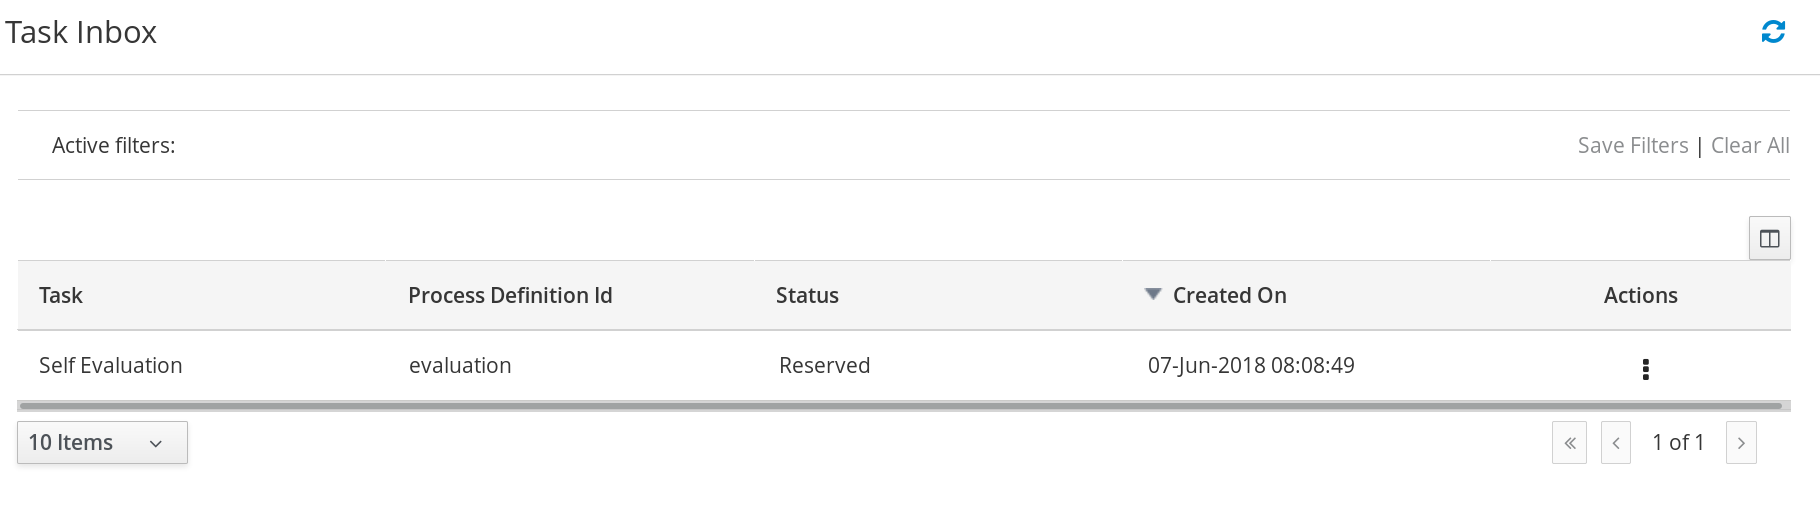
Tasks that are assigned to the current user appear in Menu → Track → Task Inbox in Business Central. You can click on a task to open and begin working on it.
A user task can be assigned to a particular user, multiple users, or to a group. If assigned to multiple users or a group it appears in the task lists of all assigned users and any of the possible actors can claim the task. When a task is assigned to another user it no longer appears in your Task Inbox.
Business administrators can view and manage all user tasks from the Tasks page in Business Central, located under Menu → Manage → Tasks. Users with the admin or process-admin role can access the Tasks page but do not have access rights to view and manage tasks by default.
To manage all the tasks, a user must be specified as a process administrator by defining any of the following conditions:
-
User is specified as
task admin user. The default value isAdministrator. -
User belongs to the task administrators group. The default value is
Administrators.
You can configure the user and user group assignment with the org.jbpm.ht.admin.user and org.jbpm.ht.admin.group system properties.
You can open, view, and modify the details of a task, such as the due date, the priority, or the task description, by clicking a task in the list. The following tabs are available in the task page:
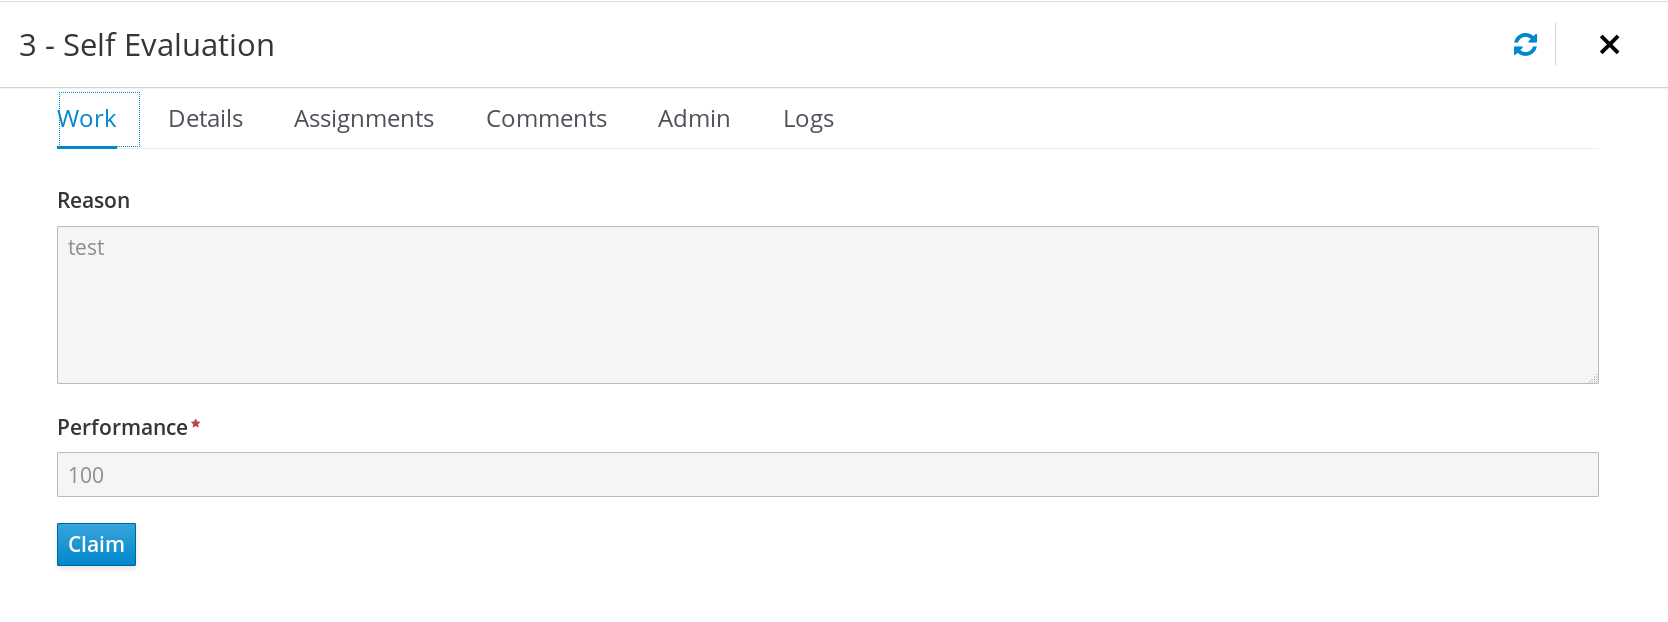
- Work: Displays basic details about the task and the task owner. You can click the Claim button to claim the task. To undo the claim process, click the Release button.
- Details: Displays information such as task description, status, and due date.
- Assignments: Displays the current owner of the task and enables you to delegate the task to another person or group.
- Comments: Displays comments added by task user(s). You can delete an existing comment and add a new comment.
- Logs: Displays task logs containing task life cycle events (such as task started, claimed, completed), updates made to task fields (such as task due date and priority).
You can filter the tasks based on the filter parameters available by clicking the filters icon on the left side of the page. For more information about filtering, see Section 4.1, “Task filtering”.
In addition to these, you can create custom filters to filter tasks based on the query parameters you define. For more information about custom tasks filters, see Section 4.2, “Creating custom task filters”.
4.1. Task filtering
For tasks in Menu → Manage → Tasks and in Menu → Track → Task Inbox, you can use the Filters and Advanced Filters panels to sort tasks as needed.
Figure 4.1. Filtering Tasks - Default View
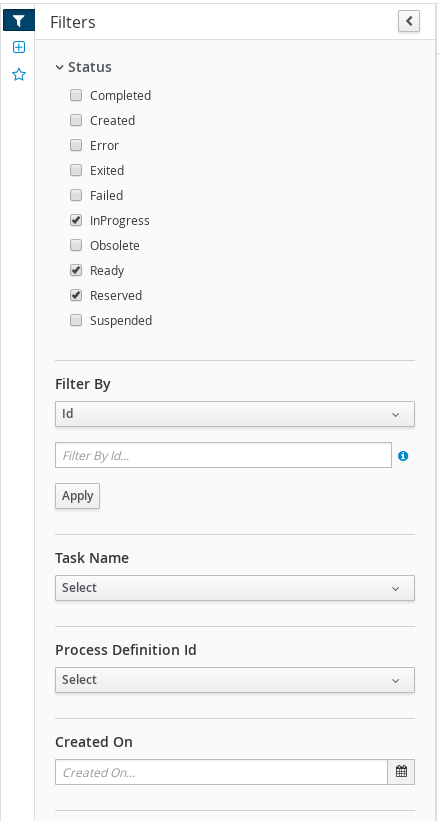
The Manage Tasks page is only available to administrators and process administrators.
You can filter tasks by the following attributes in the Filters panel:
- Id
Filter by process instance ID.
Input:
Numeric- Task
Filter by task name.
Input:
String- Correlation key
Filter by correlation key.
Input:
String- Actual Owner
Filter by the task owner.
The actual owner refers to the user responsible for executing the task. The search is based on user ID, which is a unique value and depends on the ID management system.
Input:
String- Process Instance Description
Filter by process instance description.
Input:
String- Status
Filter by task status. You can select more than one status to display results that meet any of the selected states. Removing the status filter displays all processes, regardless of status.
The following filter states are available:
- Completed
- Created
- Error
- Exited
- Failed
- InProgress
- Obsolete
- Ready
- Reserved
- Suspended
- Process Name
- Filter by process name.
- Created On
Filtering by date or time.
This filter has the following quick filter options:
- Last Hour
- Today
- Last 24 Hours
- Last 7 Days
- Last 30 Days
Custom
Selecting Custom date and time filtering opens a calendar tool for selecting a date and time range.
Figure 4.2. Search by Date
4.2. Creating custom task filters
You can create a custom task filter based on a provided query in Menu → Manage → Tasks, or in Menu → Track → Task Inbox for tasks assigned to the current user.
Procedure
- In Business Central, go to Menu → Manage → Tasks
- In the Manage Tasks page, click the advanced filters icon on the left to open the list of Advanced Filters options.
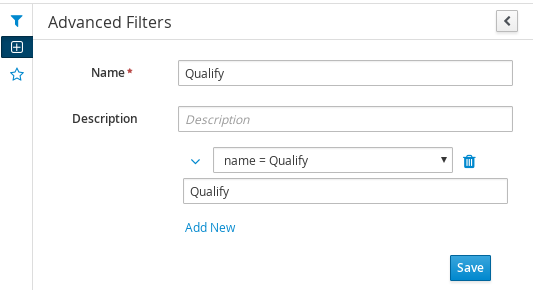
- In the Advanced Filters panel, enter the name and description of the filter, and click Add New.
In the Select column drop-down menu, choose name.
The content of the drop-down menu changes to
name != value1.- Click on the drop-down menu again and choose equals to.
Rewrite the value of the text field to the name of the task you want to filter. Note that the name must match the value defined in the associated business process:
Click Ok to save the custom task filter.
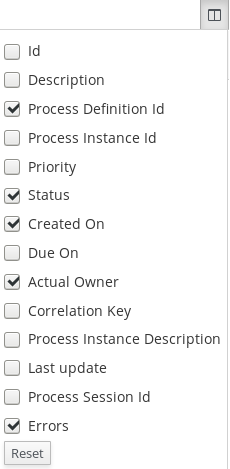
After you apply the filter with a specified restriction, the set of configurable columns is based on the specific custom task filter and contains the following column options:
4.3. Managing service tasks in Business Central
Service tasks (work items) are tasks that you can customize and reuse across multiple business processes or across all projects in Business Central. Red Hat Process Automation Manager provides a set of service tasks within the service task repository in Business Central. You can enable or disable the default service tasks and upload custom service tasks into Business Central to implement the tasks in the relevant processes.
Procedure
In Business Central, select the Admin icon in the top-right corner of the screen and select Service Tasks Administration.
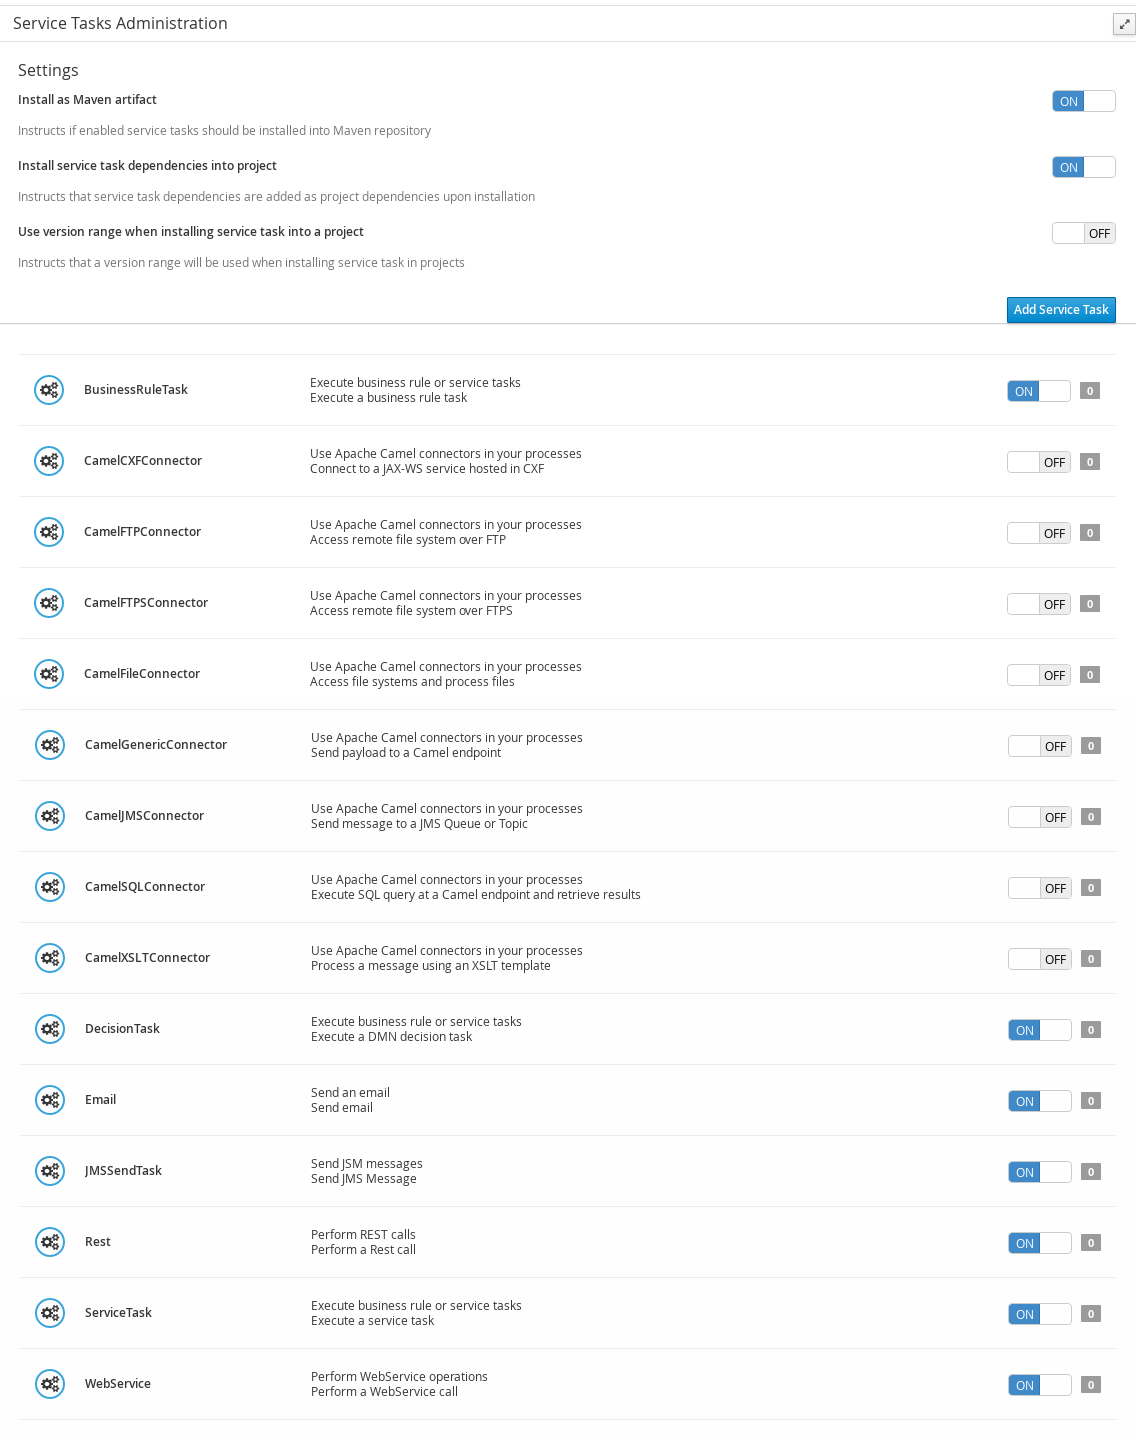
This page lists the service task installation settings and available service tasks for processes in projects throughout Business Central. The service tasks that you enable on this page become available in the project-level settings where you can then install each service task to be used in processes. The way in which the service tasks are installed in a project is determined by the global settings that you enable or disable under Settings on this Service Tasks Administration page.
Under Settings, enable or disable each setting to determine how the available service tasks will be implemented when a user installs them at the project level.
The following service task settings are available:
- Install as Maven artifact: Uploads the service task JAR file to the Maven repository that is configured with Business Central, if the file is not already present.
-
Install service task dependencies into project: Adds any service task dependencies to the
pom.xmlfile of the project where the task is installed. -
Use version range when installing service task into project: Uses a version range instead of a fixed version of a service task that is added as a project dependency. Example:
[7.16,)instead of7.16.0.Final
Enable or disable (set to ON or OFF) any available service tasks as needed. Service tasks that you enable will be displayed in project-level settings for all projects in Business Central.
Figure 4.3. Enable service tasks and service task settings
-
To add a custom service task, click Add Service Task, browse to the relevant JAR file, and click the Upload icon. The JAR file must contain work item handler implementations annotated with
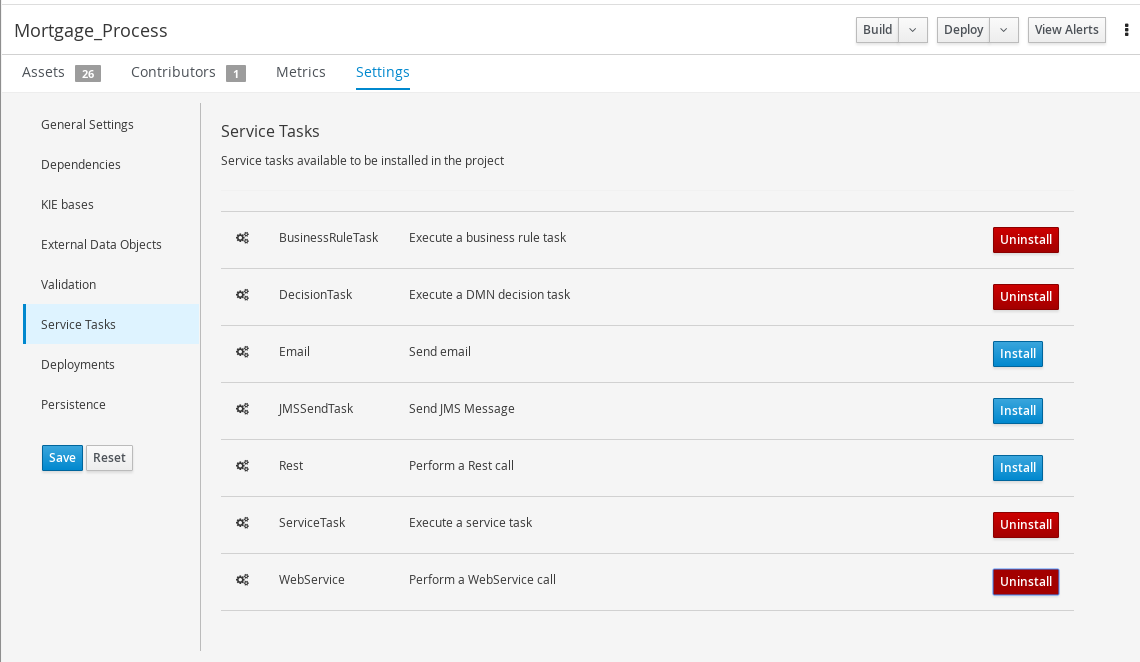
@Wid. - After you configure all required service tasks, navigate to a project in Business Central and go to project Settings → Service Tasks to view the available service tasks that you enabled.
- For each service task, click Install to make the task available to the processes in that project or click Uninstall to exclude the task from the processes in the project.
If you are prompted for additional information when you install a service task, enter also the required parameters for the service task and click Install again.
The required parameters for the service task depend on the type of task. For example, rule and decision tasks require artifact GAV information (Group ID, Artifact ID, Version), email tasks require host and port access information, and REST tasks require API credentials. Other service tasks might not require any additional parameters.
Figure 4.4. Install service tasks for use in processes
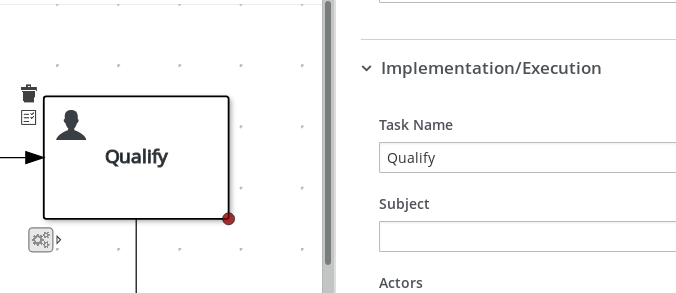
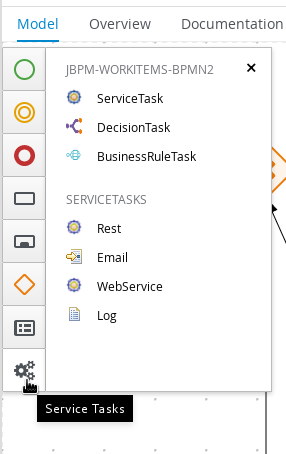
Return to the project page, select or add a business process in the project, and in the process designer palette, select the Service Tasks option to view the available service tasks that you enabled and installed:
Figure 4.5. Access installed service tasks in process designer
Chapter 5. Execution error management
When an execution error occurs for a business process, the process stops and reverts to the most recent stable state (the closest safe point) and continues its execution. If an error of any kind is not handled by the process the entire transaction rolls back, leaving the process instance in the previous wait state. Any trace of this is only visible in the logs, and usually displayed to the caller who sent the request to the process engine.
Users with process administrator (process-admin) or administrator (admin) roles are able to access error messages in Business Central. Execution error messaging provides the following primary benefits:
- Better traceability
- Visibility in case of critical processes
- Reporting and analytics based on error situations
- External system error handling and compensation
Configurable error handling is responsible for receiving any technical errors thrown throughout the process engine execution (including task service). The following technical exceptions apply:
-
Anything that extends
java.lang.Throwable - Process level error handling and any other exceptions not previously handled
There are several components that make up the error handling mechanism and allow a pluggable approach to extend its capabilities.
The process engine entry point for error handling is the ExecutionErrorManager. This is integrated with RuntimeManager, which is then responsible for providing it to the underlying KieSession and TaskService.
From an API point of view, ExecutionErrorManager provides access to the following components:
-
ExecutionErrorHandler: The primary mechanism for error handling -
ExecutionErrorStorage: Pluggable storage for execution error information
5.1. Viewing process execution errors in Business Central
You can view process errors in two locations in Business Central:
- Menu → Manage → Process Instances
- Menu → Manage → Execution Errors
In the Manage Process Instances page, the Errors column displays the number of errors, if any, for the current process instance.
Prerequisites
- An error has occurred while running a process in Business Central.
Procedure
- In Business Central, go to Menu → Manage → Process Instances and hover over the number shown in the Errors column.
Click the number of errors shown in the Errors column to navigate to the Manage Execution Errors page.
The Manage Execution Errors page shows a list of errors for all process instances.
5.2. Managing execution errors
By definition, every process error that is detected and stored is unacknowledged and must be handled by someone or something (in case of automatic error recovery). Errors are filtered on the basis of whether or not they have been acknowledged. Acknowledging an error saves the user information and time stamp for traceability. You can access the Error Management view at any time.
Procedure
- In Business Central, go to Menu → Manage → Execution Errors.
- Select an error from the list to open the Details tab. This displays information about the error or errors.
Click the Acknowledge button to acknowledge and clear the error. You can view the error later by selecting Yes on the Acknowledged filter in the Manage Execution Errors page.
If the error was related to a task, a Go to Task button is displayed.
Click the Go to Task button, if applicable, to view the associated job information in the Manage Tasks page.
In the Manage Tasks page, you can restart, reschedule, or retry the corresponding task.
5.3. Error filtering
For execution errors in Menu → Manage → Execution Errors, you can use the Filters and Advanced Filters panels to sort errors as needed.
Figure 5.1. Filtering Errors - Default View
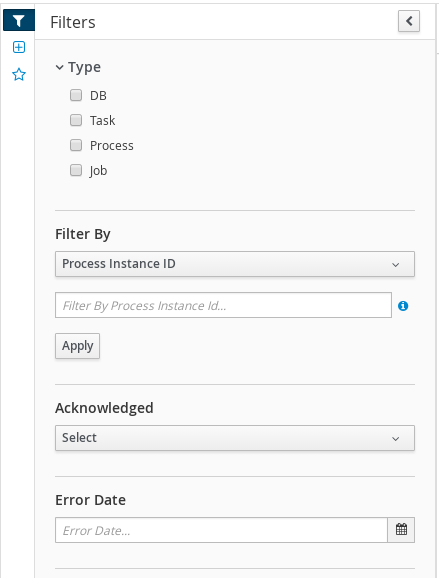
You can filter execution errors by the following attributes in the Filters panel:
- Type
Filter by errors by type. You can select multiple type filters. Removing the status filter displays all processes, regardless of status.
The following filter states are available:
- DB
- Task
- Process
- Job
- Process Instance Id
Filter by process instance ID.
Input:
Numeric- Job Id
Filter by job ID. The job id is created automatically when the job is created.
Input:
Numeric- Id
Filter by process instance ID.
Input:
Numeric- Acknowledged
- Filter errors that have been or have not been acknowledged.
- Error Date
Filtering by the date or time that the error occurred.
This filter has the following quick filter options:
- Last Hour
- Today
- Last 24 Hours
- Last 7 Days
- Last 30 Days
Custom
Selecting Custom date and time filtering opens a calendar tool for selecting a date and time range.
Figure 5.2. Search by Date
Appendix A. Versioning information
Documentation last updated on Wednesday, May 8, 2019.