
Chapter 4. Configuring Red Hat OpenStack Platform director for Service Telemetry Framework
To collect metrics, events, or both, and to send them to the Service Telemetry Framework (STF) storage domain, you must configure the Red Hat OpenStack Platform (RHOSP) overcloud to enable data collection and transport.
STF can support both single and multiple clouds. The default configuration in RHOSP and STF set up for a single cloud installation.
- For a single RHOSP overcloud deployment with default configuration, see Section 4.1, “Deploying Red Hat OpenStack Platform overcloud for Service Telemetry Framework using director”.
- To plan your RHOSP installation and configuration STF for multiple clouds, see Section 4.3, “Configuring multiple clouds”.
As part of an RHOSP overcloud deployment, you might need to configure additional features in your environment:
- To disable the data collector services, see Section 4.2, “Disabling Red Hat OpenStack Platform services used with Service Telemetry Framework”.
4.1. Deploying Red Hat OpenStack Platform overcloud for Service Telemetry Framework using director
As part of the Red Hat OpenStack Platform (RHOSP) overcloud deployment using director, you must configure the data collectors and the data transport to Service Telemetry Framework (STF).
Procedure
Additional resources
- For more information about deploying an OpenStack cloud using director, see Director Installation and Usage.
- To collect data through AMQ Interconnect, see the amqp1 plug-in.
4.1.1. Getting CA certificate from Service Telemetry Framework for overcloud configuration
To connect your Red Hat OpenStack Platform (RHOSP) overcloud to Service Telemetry Framework (STF), retrieve the CA certificate of AMQ Interconnect that runs within STF and use the certificate in RHOSP configuration.
Procedure
View a list of available certificates in STF:
$ oc get secrets
Retrieve and note the content of the
default-interconnect-selfsignedSecret:$ oc get secret/default-interconnect-selfsigned -o jsonpath='{.data.ca\.crt}' | base64 -d
4.1.2. Retrieving the AMQ Interconnect route address
When you configure the Red Hat OpenStack Platform (RHOSP) overcloud for Service Telemetry Framework (STF), you must provide the AMQ Interconnect route address in the STF connection file.
Procedure
- Log in to your Red Hat OpenShift Container Platform environment where STF is hosted.
Change to the
service-telemetryproject:$ oc project service-telemetry
Retrieve the AMQ Interconnect route address:
$ oc get routes -ogo-template='{{ range .items }}{{printf "%s\n" .spec.host }}{{ end }}' | grep "\-5671"
default-interconnect-5671-service-telemetry.apps.infra.watch
4.1.3. Creating the base configuration for STF
To configure the base parameters to provide a compatible data collection and transport for Service Telemetry Framework (STF), you must create a file that defines the default data collection values.
Procedure
-
Log in to the undercloud host as the
stackuser. Create a configuration file called
enable-stf.yamlin the/home/stackdirectory.ImportantSetting
EventPipelinePublishersandPipelinePublishersto empty lists results in no event or metric data passing to RHOSP telemetry components, such as Gnocchi or Panko. If you need to send data to additional pipelines, the Ceilometer polling interval of30seconds, that you specify inExtraConfig, might overwhelm the RHOSP telemetry components. You must increase the interval to a larger value, such as300, which results in less telemetry resolution in STF.
enable-stf.yaml
parameter_defaults:
    # only send to STF, not other publishers
    EventPipelinePublishers: []
    PipelinePublishers: []

    # manage the polling and pipeline configuration files for Ceilometer agents
    ManagePolling: true
    ManagePipeline: true

    # enable Ceilometer metrics and events
    CeilometerQdrPublishMetrics: true
    CeilometerQdrPublishEvents: true

    # enable collection of API status
    CollectdEnableSensubility: true
    CollectdSensubilityTransport: amqp1

    # enable collection of containerized service metrics
    CollectdEnableLibpodstats: true

    # set collectd overrides for higher telemetry resolution and extra plugins
    # to load
    CollectdConnectionType: amqp1
    CollectdAmqpInterval: 5
    CollectdDefaultPollingInterval: 5
    CollectdExtraPlugins:
    - vmem

    # set standard prefixes for where metrics and events are published to QDR
    MetricsQdrAddresses:
    - prefix: 'collectd'
      distribution: multicast
    - prefix: 'anycast/ceilometer'
      distribution: multicast

    ExtraConfig:
        ceilometer::agent::polling::polling_interval: 30
        ceilometer::agent::polling::polling_meters:
        - cpu
        - disk.*
        - ip.*
        - image.*
        - memory
        - memory.*
        - network.services.vpn.*
        - network.services.firewall.*
        - perf.*
        - port
        - port.*
        - switch
        - switch.*
        - storage.*
        - volume.*

        # to avoid filling the memory buffers if disconnected from the message bus
        # note: this may need an adjustment if there are many metrics to be sent.
        collectd::plugin::amqp1::send_queue_limit: 5000

        # receive extra information about virtual memory
        collectd::plugin::vmem::verbose: true

        # provide name and uuid in addition to hostname for better correlation
        # to ceilometer data
        collectd::plugin::virt::hostname_format: "name uuid hostname"

        # provide the human-friendly name of the virtual instance
        collectd::plugin::virt::plugin_instance_format: metadata

        # set memcached collectd plugin to report its metrics by hostname
        # rather than host IP, ensuring metrics in the dashboard remain uniform
        collectd::plugin::memcached::instances:
          local:
            host: "%{hiera('fqdn_canonical')}"
            port: 11211
4.1.4. Configuring the STF connection for the overcloud
To configure the Service Telemetry Framework (STF) connection, you must create a file that contains the connection configuration of the AMQ Interconnect for the overcloud to the STF deployment. Enable the collection of events and storage of the events in STF and deploy the overcloud. The default configuration is for a single cloud instance with the default message bus topics. For configuration of multiple cloud deployments, see Section 4.3, “Configuring multiple clouds”.
Prerequisites
- Retrieve the CA certificate from the AMQ Interconnect deployed by STF. For more information, see Section 4.1.1, “Getting CA certificate from Service Telemetry Framework for overcloud configuration”.
- Retrieve the AMQ Interconnect route address. For more information, see Section 4.1.2, “Retrieving the AMQ Interconnect route address”.
Procedure
-
Log in to the undercloud host as the
stackuser. -
Create a configuration file called
stf-connectors.yamlin the/home/stackdirectory. In the
stf-connectors.yamlfile, configure theMetricsQdrConnectorsaddress to connect the AMQ Interconnect on the overcloud to the STF deployment. You configure the topic addresses for Sensubility, Ceilometer, and collectd in this file to match the defaults in STF. For more information about customizing topics and cloud configuration, see Section 4.3, “Configuring multiple clouds”.stf-connectors.yaml
resource_registry: OS::TripleO::Services::Collectd: /usr/share/openstack-tripleo-heat-templates/deployment/metrics/collectd-container-puppet.yaml parameter_defaults: MetricsQdrConnectors: - host: default-interconnect-5671-service-telemetry.apps.infra.watch port: 443 role: edge verifyHostname: false sslProfile: sslProfile MetricsQdrSSLProfiles: - name: sslProfile caCertFileContent: | -----BEGIN CERTIFICATE----- <snip> -----END CERTIFICATE----- CeilometerQdrEventsConfig: driver: amqp topic: cloud1-event CeilometerQdrMetricsConfig: driver: amqp topic: cloud1-metering CollectdAmqpInstances: cloud1-notify: notify: true format: JSON presettle: false cloud1-telemetry: format: JSON presettle: false CollectdSensubilityResultsChannel: sensubility/cloud1-telemetry-
The
resource_registryconfiguration directly loads the collectd service because you do not include thecollectd-write-qdr.yamlenvironment file for multiple cloud deployments. -
Replace the
hostparameter with the value that you retrieved in Section 4.1.2, “Retrieving the AMQ Interconnect route address”. -
Replace the
caCertFileContentparameter with the contents retrieved in Section 4.1.1, “Getting CA certificate from Service Telemetry Framework for overcloud configuration”. -
Replace the
hostsub-parameter ofMetricsQdrConnectorswith the value that you retrieved in Section 4.1.2, “Retrieving the AMQ Interconnect route address”. -
Set
topicvalue ofCeilometerQdrEventsConfigto define the topic for Ceilometer events. The value is a unique topic idenifier for the cloud such ascloud1-event. -
Set
topicvalue ofCeilometerQdrMetricsConfig.topicto define the topic for Ceilometer metrics. The value is a unique topic identifier for the cloud such ascloud1-metering. -
Set
CollectdAmqpInstancessub-paramter to define the topic for collectd events. The section name is a unique topic identifier for the cloud such ascloud1-notify. -
Set
CollectdAmqpInstancessub-parameter to define the topic for collectd metrics. The section name is a unique topic identifier for the cloud such ascloud1-telemetry. -
Set
CollectdSensubilityResultsChannelto define the topic for collectd-sensubility events. The value is a unique topic identifier for the cloud such assensubility/cloud1-telemetry.
-
The
When you define the topics for collectd and Ceilometer, the value you provide is transposed into the full topic that the Smart Gateway client uses to listen for messages.
Ceilometer topic values are transposed into the topic address anycast/ceilometer/<TOPIC>.sample and collectd topic values are transposed into the topic address collectd/<TOPIC>. The value for sensubility is the full topic path and has no transposition from topic value to topic address.
For an example of a cloud configuration in the ServiceTelemetry object referring to the full topic address, see the section called “The clouds parameter”.
4.1.5. Deploying the overcloud
Deploy or update the overcloud with the required environment files so that data is collected and transmitted to Service Telemetry Framework (STF).
Procedure
-
Log in to the undercloud host as the
stackuser. Source the
stackrcundercloud credentials file:$ source ~/stackrc
Add your data collection and AMQ Interconnect environment files to the stack with your other environment files and deploy the overcloud:
(undercloud)$ openstack overcloud deploy --templates \
 -e [your environment files] \
 -e /usr/share/openstack-tripleo-heat-templates/environments/metrics/ceilometer-write-qdr.yaml \
 -e /usr/share/openstack-tripleo-heat-templates/environments/metrics/qdr-edge-only.yaml \
 -e /home/stack/enable-stf.yaml \
 -e /home/stack/stf-connectors.yaml
-
Include the
ceilometer-write-qdr.yamlfile to ensure that Ceilometer telemetry and events are sent to STF. -
Include the
qdr-edge-only.yamlfile to ensure that the message bus is enabled and connected to STF message bus routers. -
Include the
enable-stf.yamlenvironment file to ensure that the defaults are configured correctly. -
Include the
stf-connectors.yamlenvironment file to define the connection to STF.
-
Include the
4.1.6. Validating client-side installation
To validate data collection from the Service Telemetry Framework (STF) storage domain, query the data sources for delivered data. To validate individual nodes in the Red Hat OpenStack Platform (RHOSP) deployment, use SSH to connect to the console.
Some telemetry data is available only when RHOSP has active workloads.
Procedure
- Log in to an overcloud node, for example, controller-0.
Ensure that the
metrics_qdrand collection agent containers are running on the node:$ sudo podman container inspect --format '{{.State.Status}}' metrics_qdr collectd ceilometer_agent_notification ceilometer_agent_central running running running runningNoteUse this command on compute nodes:
$ sudo podman container inspect --format '{{.State.Status}}' metrics_qdr collectd ceilometer_agent_computeReturn the internal network address on which AMQ Interconnect is running, for example,
172.17.1.44listening on port5666:$ sudo podman exec -it metrics_qdr cat /etc/qpid-dispatch/qdrouterd.conf listener { host: 172.17.1.44 port: 5666 authenticatePeer: no saslMechanisms: ANONYMOUS }Return a list of connections to the local AMQ Interconnect:
$ sudo podman exec -it metrics_qdr qdstat --bus=172.17.1.44:5666 --connections

Connections
  id   host                                                                  container                                                                                                  role    dir  security                            authentication  tenant
  ============================================================================================================================================================================================================================================================================================
  1    default-interconnect-5671-service-telemetry.apps.infra.watch:443      default-interconnect-7458fd4d69-bgzfb                                                                      edge    out  TLSv1.2(DHE-RSA-AES256-GCM-SHA384)  anonymous-user
  12   172.17.1.44:60290                                                     openstack.org/om/container/controller-0/ceilometer-agent-notification/25/5c02cee550f143ec9ea030db5cccba14  normal  in   no-security                         no-auth
  16   172.17.1.44:36408                                                     metrics                                                                                                    normal  in   no-security                         anonymous-user
  899  172.17.1.44:39500                                                     10a2e99d-1b8a-4329-b48c-4335e5f75c84                                                                       normal  in   no-security                         no-auth
There are four connections:
- Outbound connection to STF
- Inbound connection from ceilometer
- Inbound connection from collectd
Inbound connection from our
qdstatclientThe outbound STF connection is provided to the
MetricsQdrConnectorshost parameter and is the route for the STF storage domain. The other hosts are internal network addresses of the client connections to this AMQ Interconnect.
To ensure that messages are delivered, list the links, and view the
_edgeaddress in thedelivcolumn for delivery of messages:$ sudo podman exec -it metrics_qdr qdstat --bus=172.17.1.44:5666 --links Router Links type dir conn id id peer class addr phs cap pri undel unsett deliv presett psdrop acc rej rel mod delay rate =========================================================================================================================================================== endpoint out 1 5 local _edge 250 0 0 0 2979926 0 0 0 0 2979926 0 0 0 endpoint in 1 6 250 0 0 0 0 0 0 0 0 0 0 0 0 endpoint in 1 7 250 0 0 0 0 0 0 0 0 0 0 0 0 endpoint out 1 8 250 0 0 0 0 0 0 0 0 0 0 0 0 endpoint in 1 9 250 0 0 0 0 0 0 0 0 0 0 0 0 endpoint out 1 10 250 0 0 0 911 911 0 0 0 0 0 911 0 endpoint in 1 11 250 0 0 0 0 911 0 0 0 0 0 0 0 endpoint out 12 32 local temp.lSY6Mcicol4J2Kp 250 0 0 0 0 0 0 0 0 0 0 0 0 endpoint in 16 41 250 0 0 0 2979924 0 0 0 0 2979924 0 0 0 endpoint in 912 1834 mobile $management 0 250 0 0 0 1 0 0 1 0 0 0 0 0 endpoint out 912 1835 local temp.9Ok2resI9tmt+CT 250 0 0 0 0 0 0 0 0 0 0 0 0
To list the addresses from RHOSP nodes to STF, connect to Red Hat OpenShift Container Platform to retrieve the AMQ Interconnect pod name and list the connections. List the available AMQ Interconnect pods:
$ oc get pods -l application=default-interconnect

NAME                                    READY   STATUS    RESTARTS   AGE
default-interconnect-7458fd4d69-bgzfb   1/1     Running   0          6d21h
Connect to the pod and list the known connections. In this example, there are three
edgeconnections from the RHOSP nodes with connectionid22, 23, and 24:$ oc exec -it default-interconnect-7458fd4d69-bgzfb -- qdstat --connections 2020-04-21 18:25:47.243852 UTC default-interconnect-7458fd4d69-bgzfb Connections id host container role dir security authentication tenant last dlv uptime =============================================================================================================================================================================================== 5 10.129.0.110:48498 bridge-3f5 edge in no-security anonymous-user 000:00:00:02 000:17:36:29 6 10.129.0.111:43254 rcv[default-cloud1-ceil-meter-smartgateway-58f885c76d-xmxwn] edge in no-security anonymous-user 000:00:00:02 000:17:36:20 7 10.130.0.109:50518 rcv[default-cloud1-coll-event-smartgateway-58fbbd4485-rl9bd] normal in no-security anonymous-user - 000:17:36:11 8 10.130.0.110:33802 rcv[default-cloud1-ceil-event-smartgateway-6cfb65478c-g5q82] normal in no-security anonymous-user 000:01:26:18 000:17:36:05 22 10.128.0.1:51948 Router.ceph-0.redhat.local edge in TLSv1/SSLv3(DHE-RSA-AES256-GCM-SHA384) anonymous-user 000:00:00:03 000:22:08:43 23 10.128.0.1:51950 Router.compute-0.redhat.local edge in TLSv1/SSLv3(DHE-RSA-AES256-GCM-SHA384) anonymous-user 000:00:00:03 000:22:08:43 24 10.128.0.1:52082 Router.controller-0.redhat.local edge in TLSv1/SSLv3(DHE-RSA-AES256-GCM-SHA384) anonymous-user 000:00:00:00 000:22:08:34 27 127.0.0.1:42202 c2f541c1-4c97-4b37-a189-a396c08fb079 normal in no-security no-auth 000:00:00:00 000:00:00:00
To view the number of messages delivered by the network, use each address with the
oc execcommand:$ oc exec -it default-interconnect-7458fd4d69-bgzfb -- qdstat --address 2020-04-21 18:20:10.293258 UTC default-interconnect-7458fd4d69-bgzfb Router Addresses class addr phs distrib pri local remote in out thru fallback ========================================================================================================================== mobile anycast/ceilometer/event.sample 0 balanced - 1 0 970 970 0 0 mobile anycast/ceilometer/metering.sample 0 balanced - 1 0 2,344,833 2,344,833 0 0 mobile collectd/notify 0 multicast - 1 0 70 70 0 0 mobile collectd/telemetry 0 multicast - 1 0 216,128,890 216,128,890 0 0
4.2. Disabling Red Hat OpenStack Platform services used with Service Telemetry Framework
Disable the services used when deploying Red Hat OpenStack Platform (RHOSP) and connecting it to Service Telemetry Framework (STF). There is no removal of logs or generated configuration files as part of the disablement of the services.
Procedure
-
Log in to the undercloud host as the
stackuser. Source the
stackrcundercloud credentials file:$ source ~/stackrc
Create the
disable-stf.yamlenvironment file:$ cat > ~/disable-stf.yaml <<EOF --- resource_registry: OS::TripleO::Services::CeilometerAgentCentral: OS::Heat::None OS::TripleO::Services::CeilometerAgentNotification: OS::Heat::None OS::TripleO::Services::CeilometerAgentIpmi: OS::Heat::None OS::TripleO::Services::ComputeCeilometerAgent: OS::Heat::None OS::TripleO::Services::Redis: OS::Heat::None OS::TripleO::Services::Collectd: OS::Heat::None OS::TripleO::Services::MetricsQdr: OS::Heat::None EOF
Remove the following files from your RHOSP director deployment:
-
ceilometer-write-qdr.yaml -
qdr-edge-only.yaml -
enable-stf.yaml -
stf-connectors.yaml
-
Update the RHOSP overcloud. Ensure that you use the
disable-stf.yamlfile early in the list of environment files. By addingdisable-stf.yamlearly in the list, other environment files can override the configuration that would disable the service:(undercloud)$ openstack overcloud deploy --templates \ -e /home/stack/disable-stf.yaml \ -e [your environment files]
4.3. Configuring multiple clouds
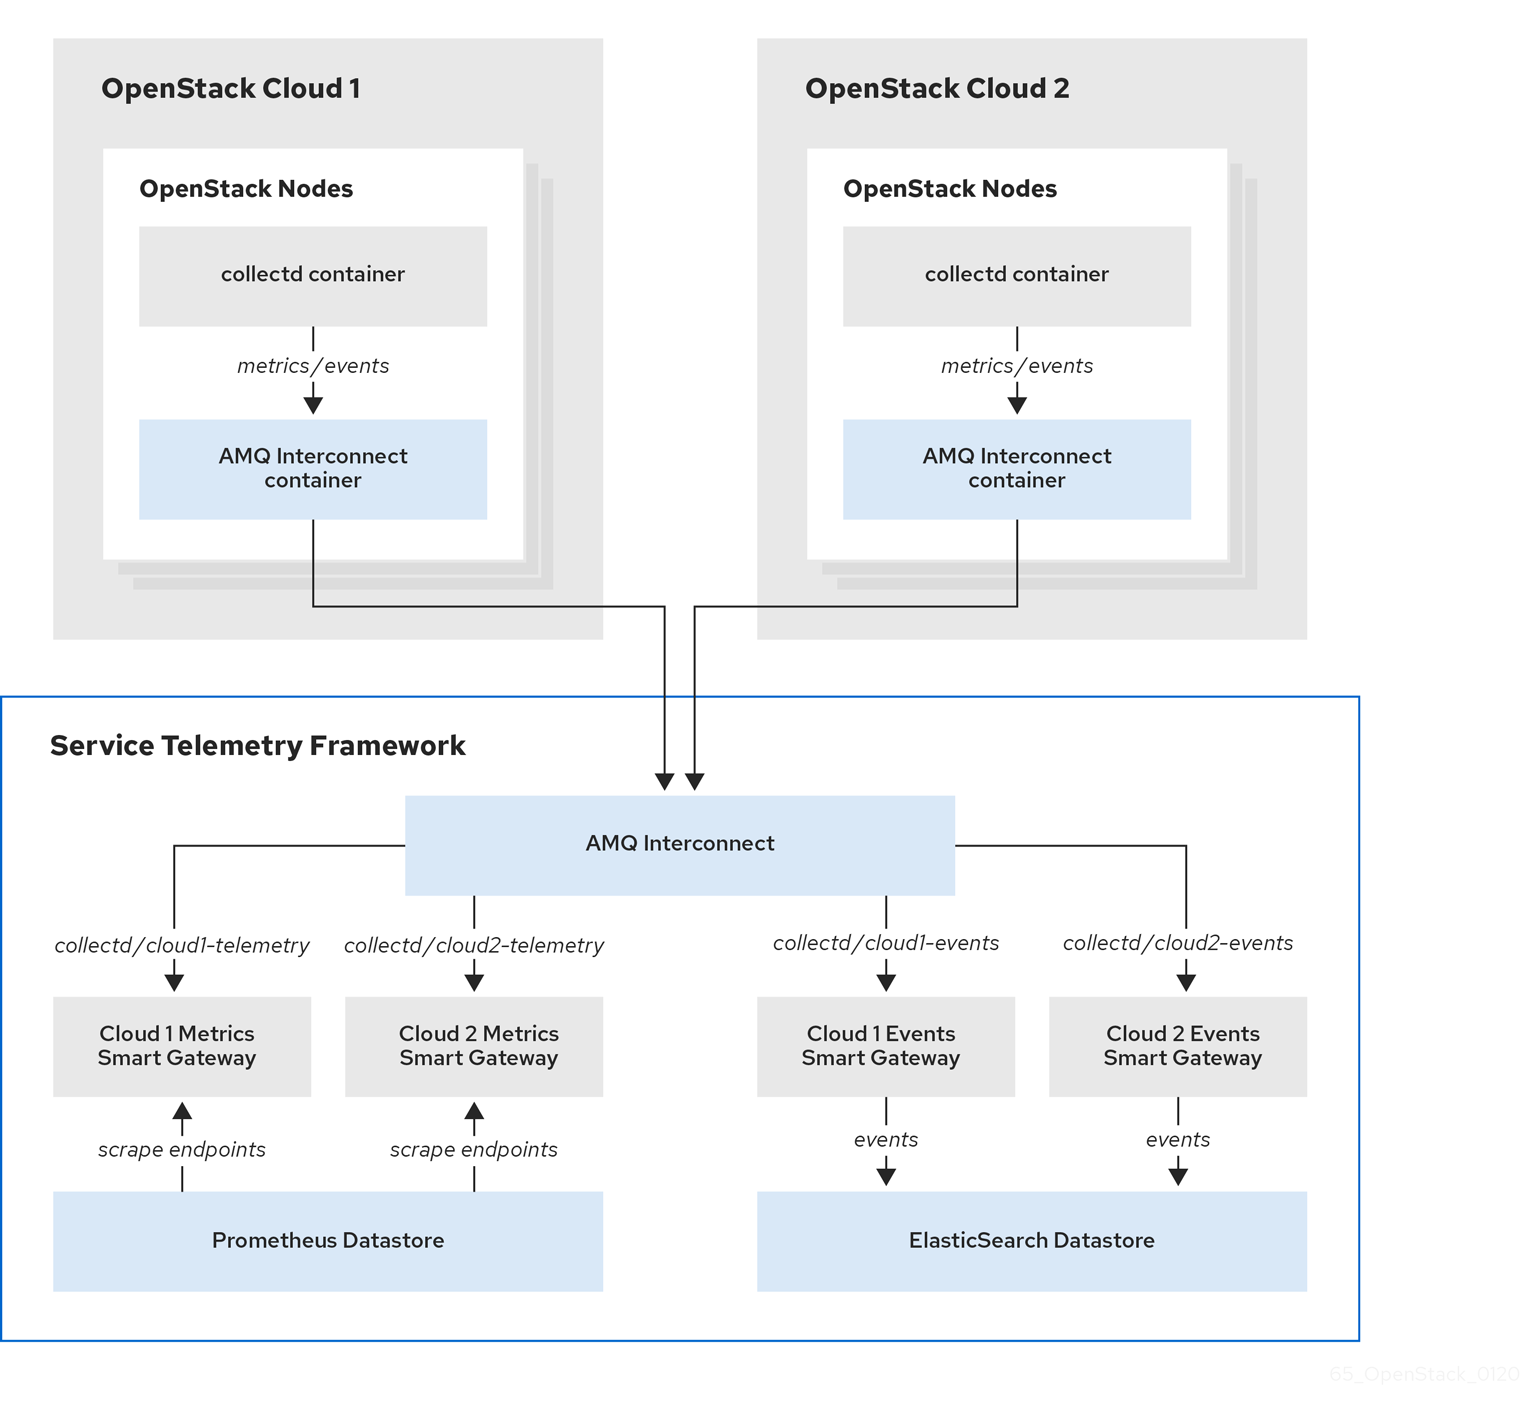
You can configure multiple Red Hat OpenStack Platform (RHOSP) clouds to target a single instance of Service Telemetry Framework (STF). When you configure multiple clouds, every cloud must send metrics and events on their own unique message bus topic. In the STF deployment, Smart Gateway instances listen on these topics to save information to the common data store. Data that is stored by the Smart Gateway in the data storage domain is filtered by using the metadata that each of Smart Gateways creates.
Figure 4.1. Two RHOSP clouds connect to STF
To configure the RHOSP overcloud for a multiple cloud scenario, complete the following tasks:
- Plan the AMQP address prefixes that you want to use for each cloud. For more information, see Section 4.3.1, “Planning AMQP address prefixes”.
- Deploy metrics and events consumer Smart Gateways for each cloud to listen on the corresponding address prefixes. For more information, see Section 4.3.2, “Deploying Smart Gateways”.
- Configure each cloud with a unique domain name. For more information, see Section 4.3.4, “Setting a unique cloud domain”.
- Create the base configuration for STF. For more information, see Section 4.1.3, “Creating the base configuration for STF”.
- Configure each cloud to send its metrics and events to STF on the correct address. For more information, see Section 4.3.5, “Creating the Red Hat OpenStack Platform environment file for multiple clouds”.
4.3.1. Planning AMQP address prefixes
By default, Red Hat OpenStack Platform (RHOSP) nodes receive data through two data collectors; collectd and Ceilometer. The collectd-sensubility plugin requires a unique address. These components send telemetry data or notifications to the respective AMQP addresses, for example, collectd/telemetry. STF Smart Gateways listen on those AMQP addresses for data. To support multiple clouds and to identify which cloud generated the monitoring data, configure each cloud to send data to a unique address. Add a cloud identifier prefix to the second part of the address. The following list shows some example addresses and identifiers:
-
collectd/cloud1-telemetry -
collectd/cloud1-notify -
sensubility/cloud1-telemetry -
anycast/ceilometer/cloud1-metering.sample -
anycast/ceilometer/cloud1-event.sample -
collectd/cloud2-telemetry -
collectd/cloud2-notify -
sensubility/cloud2-telemetry -
anycast/ceilometer/cloud2-metering.sample -
anycast/ceilometer/cloud2-event.sample -
collectd/us-east-1-telemetry -
collectd/us-west-3-telemetry
4.3.2. Deploying Smart Gateways
You must deploy a Smart Gateway for each of the data collection types for each cloud; one for collectd metrics, one for collectd events, one for Ceilometer metrics, one for Ceilometer events, and one for collectd-sensubility metrics. Configure each of the Smart Gateways to listen on the AMQP address that you define for the corresponding cloud. To define Smart Gateways, configure the clouds parameter in the ServiceTelemetry manifest.
When you deploy STF for the first time, Smart Gateway manifests are created that define the initial Smart Gateways for a single cloud. When you deploy Smart Gateways for multiple cloud support, you deploy multiple Smart Gateways for each of the data collection types that handle the metrics and the events data for each cloud. The initial Smart Gateways are defined in cloud1 with the following subscription addresses:
| collector | type | default subscription address |
| collectd | metrics | collectd/telemetry |
| collectd | events | collectd/notify |
| collectd-sensubility | metrics | sensubility/telemetry |
| Ceilometer | metrics | anycast/ceilometer/metering.sample |
| Ceilometer | events | anycast/ceilometer/event.sample |
Prerequisites
- You have determined your cloud naming scheme. For more information about determining your naming scheme, see Section 4.3.1, “Planning AMQP address prefixes”.
-
You have created your list of clouds objects. For more information about creating the content for the
cloudsparameter, see the section called “The clouds parameter”.
Procedure
- Log in to Red Hat OpenShift Container Platform.
Change to the
service-telemetrynamespace:$ oc project service-telemetry
Edit the
defaultServiceTelemetry object and add acloudsparameter with your configuration:WarningLong cloud names might exceed the maximum pod name of 63 characters. Ensure that the combination of the
ServiceTelemetrynamedefaultand theclouds.namedoes not exceed 19 characters. Cloud names cannot contain any special characters, such as-. Limit cloud names to alphanumeric (a-z, 0-9).Topic addresses have no character limitation and can be different from the
clouds.namevalue.$ oc edit stf default
apiVersion: infra.watch/v1beta1 kind: ServiceTelemetry metadata: ... spec: ... clouds: - name: cloud1 events: collectors: - collectorType: collectd subscriptionAddress: collectd/cloud1-notify - collectorType: ceilometer subscriptionAddress: anycast/ceilometer/cloud1-event.sample metrics: collectors: - collectorType: collectd subscriptionAddress: collectd/cloud1-telemetry - collectorType: sensubility subscriptionAddress: sensubility/cloud1-telemetry - collectorType: ceilometer subscriptionAddress: anycast/ceilometer/cloud1-metering.sample - name: cloud2 events: ...- Save the ServiceTelemetry object.
Verify that each Smart Gateway is running. This can take several minutes depending on the number of Smart Gateways:
$ oc get po -l app=smart-gateway
NAME                                                      READY   STATUS    RESTARTS   AGE
default-cloud1-ceil-event-smartgateway-6cfb65478c-g5q82   2/2     Running   0          13h
default-cloud1-ceil-meter-smartgateway-58f885c76d-xmxwn   2/2     Running   0          13h
default-cloud1-coll-event-smartgateway-58fbbd4485-rl9bd   2/2     Running   0          13h
default-cloud1-coll-meter-smartgateway-7c6fc495c4-jn728   2/2     Running   0          13h
default-cloud1-sens-meter-smartgateway-8h4tc445a2-mm683   2/2     Running   0          13h
4.3.3. Deleting the default Smart Gateways
After you configure Service Telemetry Framework (STF) for multiple clouds, you can delete the default Smart Gateways if they are no longer in use. The Service Telemetry Operator can remove SmartGateway objects that were created but are no longer listed in the ServiceTelemetry clouds list of objects. To enable the removal of SmartGateway objects that are not defined by the clouds parameter, you must set the cloudsRemoveOnMissing parameter to true in the ServiceTelemetry manifest.
If you do not want to deploy any Smart Gateways, define an empty clouds list by using the clouds: [] parameter.
The cloudsRemoveOnMissing parameter is disabled by default. If you enable the cloudsRemoveOnMissing parameter, you remove any manually-created SmartGateway objects in the current namespace without any possibility to restore.
Procedure
-
Define your
cloudsparameter with the list of cloud objects that you want the Service Telemetry Operator to manage. For more information, see the section called “The clouds parameter”. Edit the ServiceTelemetry object and add the
cloudsRemoveOnMissingparameter:apiVersion: infra.watch/v1beta1 kind: ServiceTelemetry metadata: ... spec: ... cloudsRemoveOnMissing: true clouds: ...- Save the modifications.
Verify that the Operator deleted the Smart Gateways. This can take several minutes while the Operators reconcile the changes:
$ oc get smartgateways
4.3.4. Setting a unique cloud domain
To ensure that AMQ Interconnect router connections from Red Hat OpenStack Platform (RHOSP) to Service Telemetry Framework (STF) are unique and do not conflict, configure the CloudDomain parameter.
Ensure that you do not change host or domain names in an existing deployment. Host and domain name configuration is supported in new cloud deployments only.
Procedure
-
Create a new environment file, for example,
hostnames.yaml. Set the
CloudDomainparameter in the environment file, as shown in the following example:hostnames.yaml
parameter_defaults: CloudDomain: newyork-west-04 CephStorageHostnameFormat: 'ceph-%index%' ObjectStorageHostnameFormat: 'swift-%index%' ComputeHostnameFormat: 'compute-%index%'- Add the new environment file to your deployment.
Additional resources
- Section 4.3.5, “Creating the Red Hat OpenStack Platform environment file for multiple clouds”
- Core Overcloud Parameters in the Overcloud Parameters guide
4.3.5. Creating the Red Hat OpenStack Platform environment file for multiple clouds
To label traffic according to the cloud of origin, you must create a configuration with cloud-specific instance names. Create an stf-connectors.yaml file and adjust the values of CeilometerQdrEventsConfig, CeilometerQdrMetricsConfig and CollectdAmqpInstances to match the AMQP address prefix scheme.
If you enabled container health and API status monitoring, you must also modify the CollectdSensubilityResultsChannel parameter. For more information, see Section 5.9, “Red Hat OpenStack Platform API status and containerized services health”.
Prerequisites
- You have retrieved the CA certificate from the AMQ Interconnect deployed by STF. For more information, see Section 4.1.1, “Getting CA certificate from Service Telemetry Framework for overcloud configuration”.
- You have created your list of clouds objects. For more information about creating the content for the clouds parameter, see the clouds configuration parameter.
- You have retrieved the AMQ Interconnect route address. For more information, see Section 4.1.2, “Retrieving the AMQ Interconnect route address”.
- You have created the base configuration for STF. For more information, see Section 4.1.3, “Creating the base configuration for STF”.
- You have created a unique domain name environment file. For more information, see Section 4.3.4, “Setting a unique cloud domain”.
Procedure
-
Log in to the undercloud host as the
stackuser. -
Create a configuration file called
stf-connectors.yamlin the/home/stackdirectory. In the
stf-connectors.yamlfile, configure theMetricsQdrConnectorsaddress to connect to the AMQ Interconnect on the overcloud deployment. Configure theCeilometerQdrEventsConfig,CeilometerQdrMetricsConfig,CollectdAmqpInstances, andCollectdSensubilityResultsChanneltopic values to match the AMQP address that you want for this cloud deployment.stf-connectors.yaml
resource_registry: OS::TripleO::Services::Collectd: /usr/share/openstack-tripleo-heat-templates/deployment/metrics/collectd-container-puppet.yaml parameter_defaults: MetricsQdrConnectors: - host: default-interconnect-5671-service-telemetry.apps.infra.watch port: 443 role: edge verifyHostname: false sslProfile: sslProfile MetricsQdrSSLProfiles: - name: sslProfile caCertFileContent: | -----BEGIN CERTIFICATE----- <snip> -----END CERTIFICATE----- CeilometerQdrEventsConfig: driver: amqp topic: cloud1-event CeilometerQdrMetricsConfig: driver: amqp topic: cloud1-metering CollectdAmqpInstances: cloud1-notify: notify: true format: JSON presettle: false cloud1-telemetry: format: JSON presettle: false CollectdSensubilityResultsChannel: sensubility/cloud1-telemetry-
The
resource_registryconfiguration directly loads the collectd service because you do not include thecollectd-write-qdr.yamlenvironment file for multiple cloud deployments. -
Replace the
hostparameter with the value that you retrieved in Section 4.1.2, “Retrieving the AMQ Interconnect route address”. -
Replace the
caCertFileContentparameter with the contents retrieved in Section 4.1.1, “Getting CA certificate from Service Telemetry Framework for overcloud configuration”. -
Replace the
hostsub-parameter ofMetricsQdrConnectorswith the value that you retrieved in Section 4.1.2, “Retrieving the AMQ Interconnect route address”. -
Set
topicvalue ofCeilometerQdrEventsConfigto define the topic for Ceilometer events. The value is a unique topic idenifier for the cloud such ascloud1-event. -
Set
topicvalue ofCeilometerQdrMetricsConfig.topicto define the topic for Ceilometer metrics. The value is a unique topic identifier for the cloud such ascloud1-metering. -
Set
CollectdAmqpInstancessub-paramter to define the topic for collectd events. The section name is a unique topic identifier for the cloud such ascloud1-notify. -
Set
CollectdAmqpInstancessub-parameter to define the topic for collectd metrics. The section name is a unique topic identifier for the cloud such ascloud1-telemetry. Set
CollectdSensubilityResultsChannelto define the topic for collectd-sensubility events. The value is a unique topic identifier for the cloud such assensubility/cloud1-telemetry.NoteWhen you define the topics for collectd and Ceilometer, the value you provide is transposed into the full topic that the Smart Gateway client uses to listen for messages.
Ceilometer topic values are transposed into the topic address
anycast/ceilometer/<TOPIC>.sampleand collectd topic values are transposed into the topic addresscollectd/<TOPIC>. The value for sensubility is the full topic path and has no transposition from topic value to topic address.For an example of a cloud configuration in the
ServiceTelemetryobject referring to the full topic address, see the section called “The clouds parameter”.
-
The
-
Ensure that the naming convention in the
stf-connectors.yamlfile aligns with thespec.bridge.amqpUrlfield in the Smart Gateway configuration. For example, configure theCeilometerQdrEventsConfig.topicfield to a value ofcloud1-event. -
Log in to the undercloud host as the
stackuser. Source the
stackrcundercloud credentials file:$ source stackrc
Include the
stf-connectors.yamlfile and unique domain name environment filehostnames.yamlin theopenstack overcloud deploymentcommand, with any other environment files relevant to your environment:WarningIf you use the
collectd-write-qdr.yamlfile with a customCollectdAmqpInstancesparameter, data publishes to the custom and default topics. In a multiple cloud environment, the configuration of theresource_registryparameter in thestf-connectors.yamlfile loads the collectd service.(undercloud)$ openstack overcloud deploy --templates \ -e [your environment files] \ -e /usr/share/openstack-tripleo-heat-templates/environments/metrics/ceilometer-write-qdr.yaml \ -e /usr/share/openstack-tripleo-heat-templates/environments/metrics/qdr-edge-only.yaml \ -e /home/stack/hostnames.yaml \ -e /home/stack/enable-stf.yaml \ -e /home/stack/stf-connectors.yaml
- Deploy the Red Hat OpenStack Platform overcloud.
4.3.5.1. Ansible-based deployment of Service Telemetry Framework
The content for this feature is available in this release as a Documentation Preview, and therefore is not fully verified by Red Hat. Use it only for testing, and do not use in a production environment.
As of Red Hat OpenStack Platform 17.0, you can preview the use of Ansible instead of Puppet for deploying Service Telemetry Framework (STF) components. The use of Ansible has the following advantages:
- Consolidation of configuration under a single service-specific THT variable (MetricsQdrVars and CollectdVars)
- The ability to switch QDR modes from mesh-mode to edge-only and back
- Fewer technologies used in the deployment stack, resulting in a simpler debug process
To use the Ansible-based deployment, substitute the word "ansible" in place of "puppet" in the resource_registry section of your stf-connectors.yaml file:
    OS::TripleO::Services::Collectd: /usr/share/openstack-tripleo-heat-templates/deployment/metrics/collectd-container-ansible.yaml
    OS::TripleO::Services::MetricsQdr: /usr/share/openstack-tripleo-heat-templates/deployment/metrics/qdr-container-ansible.yaml
To set the configuration, use the new service-specific THT variables, as shown in the following example:
parameter_defaults:
  MetricsQdrVars:
    tripleo_metrics_qdr_deployment_mode: edge-only
  CollectdVars:
    tripleo_collectd_amqp_host: stf.mycluster.example.com
The full list of supported configuration parameters can be found in the deployment files referenced above. https://github.com/openstack/tripleo-heat-templates/blob/stable/wallaby/deployment/metrics/qdr-container-ansible.yaml#L172
Additional resources
- For information about how to validate the deployment, see Section 4.1.6, “Validating client-side installation”.
4.3.6. Querying metrics data from multiple clouds
Data stored in Prometheus has a service label according to the Smart Gateway it was scraped from. You can use this label to query data from a specific cloud.
To query data from a specific cloud, use a Prometheus promql query that matches the associated service label; for example: collectd_uptime{service="default-cloud1-coll-meter"}.