
Chapter 1. Introduction to Service Telemetry Framework 1.4
Service Telemetry Framework (STF) collects monitoring data from Red Hat OpenStack Platform (RHOSP) or third-party nodes. You can use STF to perform the following tasks:
- Store or archive the monitoring data for historical information.
- View the monitoring data graphically on the dashboard.
- Use the monitoring data to trigger alerts or warnings.
The monitoring data can be either metric or event:
- Metric
- A numeric measurement of an application or system.
- Event
- Irregular and discrete occurrences that happen in a system.
The components of STF use a message bus for data transport. Other modular components that receive and store data are deployed as containers on Red Hat OpenShift Container Platform.
Service Telemetry Framework (STF) is compatible with Red Hat OpenShift Container Platform versions 4.7 through 4.8.
Additional resources
- For more information about how to deploy Red Hat OpenShift Container Platform, see the Red Hat OpenShift Container Platform product documentation.
- You can install Red Hat OpenShift Container Platform on cloud platforms or on bare metal. For more information about STF performance and scaling, see https://access.redhat.com/articles/4907241.
- You can install Red Hat OpenShift Container Platform on bare metal or other supported cloud platforms. For more information about installing Red Hat OpenShift Container Platform, see OpenShift Container Platform 4.8 Documentation.
1.1. Support for Service Telemetry Framework
Red Hat supports the two most recent versions of Service Telemetry Framework (STF). Earlier versions are not supported. For more information, see the Service Telemetry Framework Supported Version Matrix.
Red Hat supports the core Operators and workloads, including AMQ Interconnect, AMQ Certificate Manager, Service Telemetry Operator, and Smart Gateway Operator. Red Hat does not support the community Operators or workload components, inclusive of ElasticSearch, Prometheus, Alertmanager, Grafana, and their Operators.
STF does not work in Red Hat OpenShift Container Platform disconnected environments due to dependencies on components that are not yet available for installation in a disconnected environment.
1.2. Service Telemetry Framework architecture
Service Telemetry Framework (STF) uses a client-server architecture, in which Red Hat OpenStack Platform (RHOSP) is the client and Red Hat OpenShift Container Platform is the server.
STF consists of the following components:
Data collection
- collectd: Collects infrastructure metrics and events.
- Ceilometer: Collects RHOSP metrics and events.
Transport
- AMQ Interconnect: An AMQP 1.x compatible messaging bus that provides fast and reliable data transport to transfer the metrics to STF for storage.
- Smart Gateway: A Golang application that takes metrics and events from the AMQP 1.x bus to deliver to ElasticSearch or Prometheus.
Data storage
- Prometheus: Time-series data storage that stores STF metrics received from the Smart Gateway.
- ElasticSearch: Events data storage that stores STF events received from the Smart Gateway.
Observation
- Alertmanager: An alerting tool that uses Prometheus alert rules to manage alerts.
- Grafana: A visualization and analytics application that you can use to query, visualize, and explore data.
The following table describes the application of the client and server components:
Table 1.1. Client and server components of STF
| Component | Client | Server |
|---|---|---|
| An AMQP 1.x compatible messaging bus | yes | yes |
| Smart Gateway | no | yes |
| Prometheus | no | yes |
| ElasticSearch | no | yes |
| collectd | yes | no |
| Ceilometer | yes | no |
To ensure that the monitoring platform can report operational problems with your cloud, do not install STF on the same infrastructure that you are monitoring.
Figure 1.1. Service Telemetry Framework architecture overview
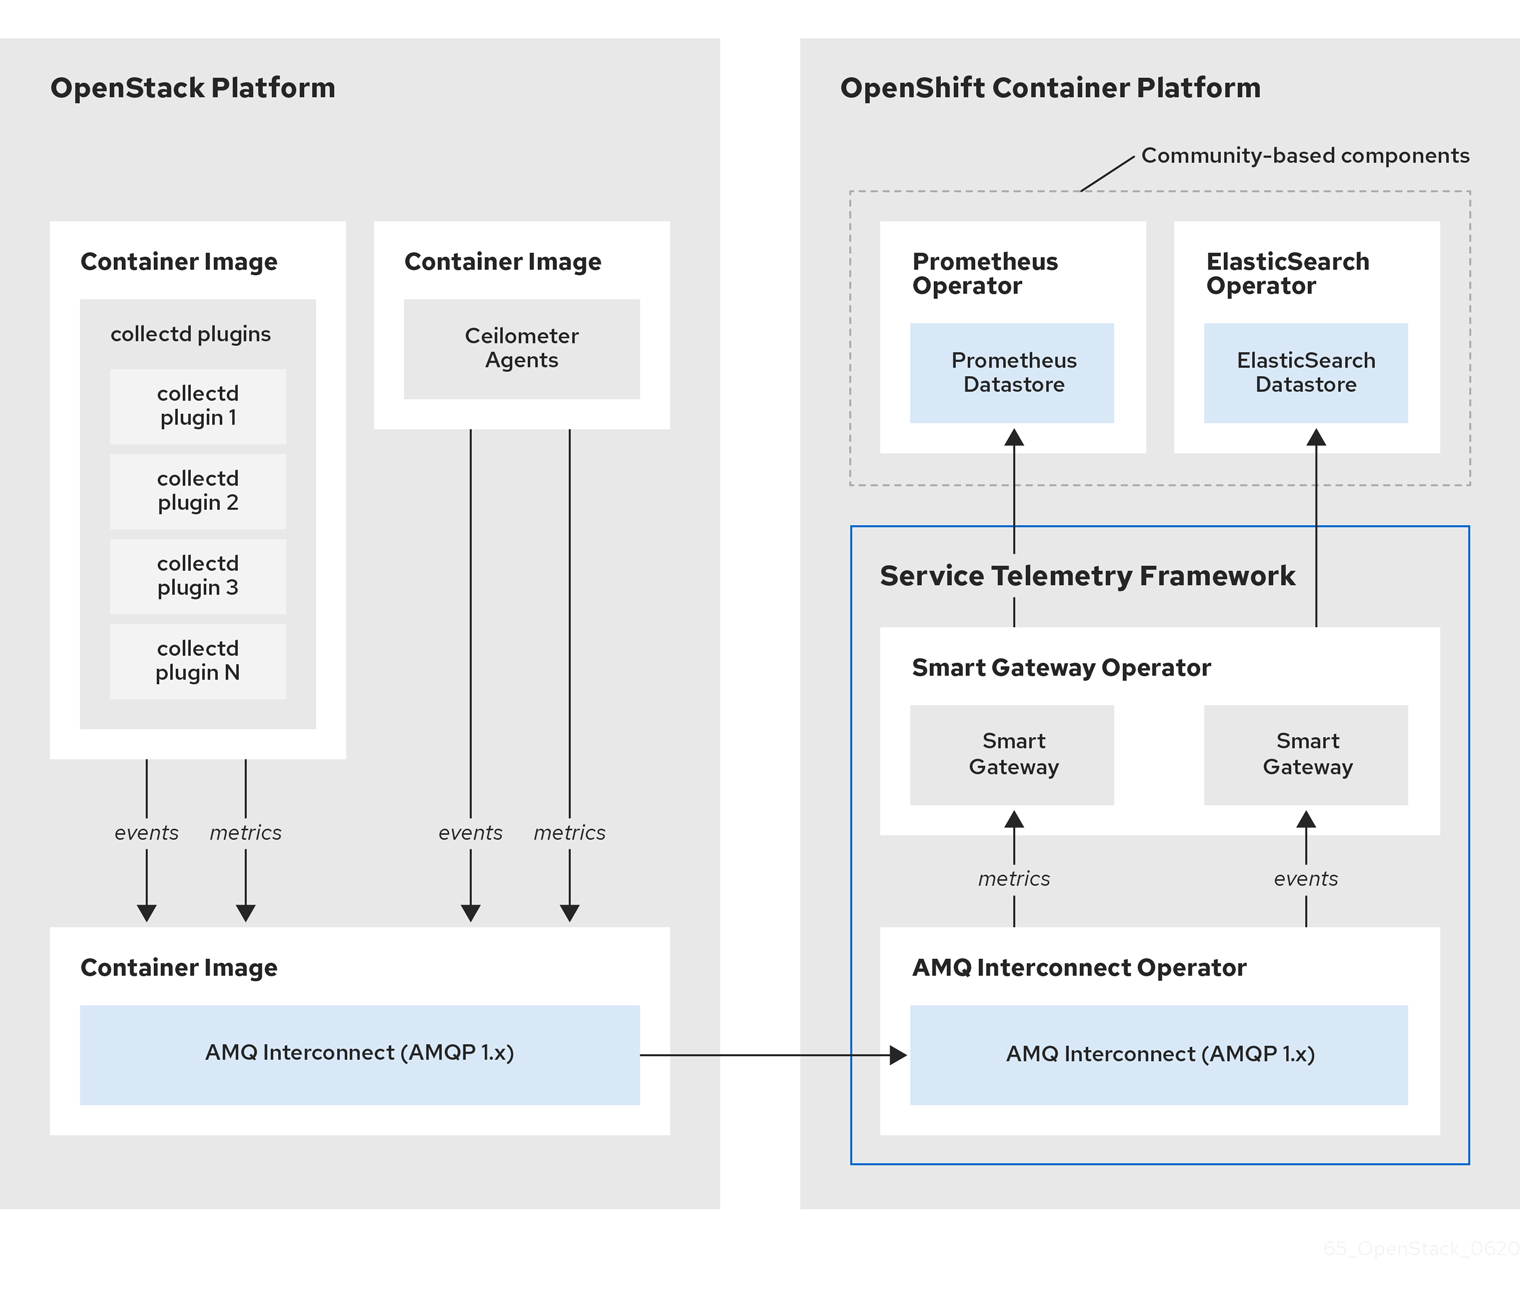
On the client side, collectd provides infrastructure metrics without project data, and Ceilometer provides Red Hat OpenStack Platform (RHOSP) platform data based on projects or user workload. Both Ceilometer and collectd deliver data to Prometheus by using the AMQ Interconnect transport, delivering the data through the message bus. On the server side, a Golang application called the Smart Gateway takes the data stream from the bus and exposes it as a local scrape endpoint for Prometheus.
If you plan to collect and store events, collectd and Ceilometer deliver event data to the server side by using the AMQ Interconnect transport. Another Smart Gateway writes the data to the ElasticSearch datastore.
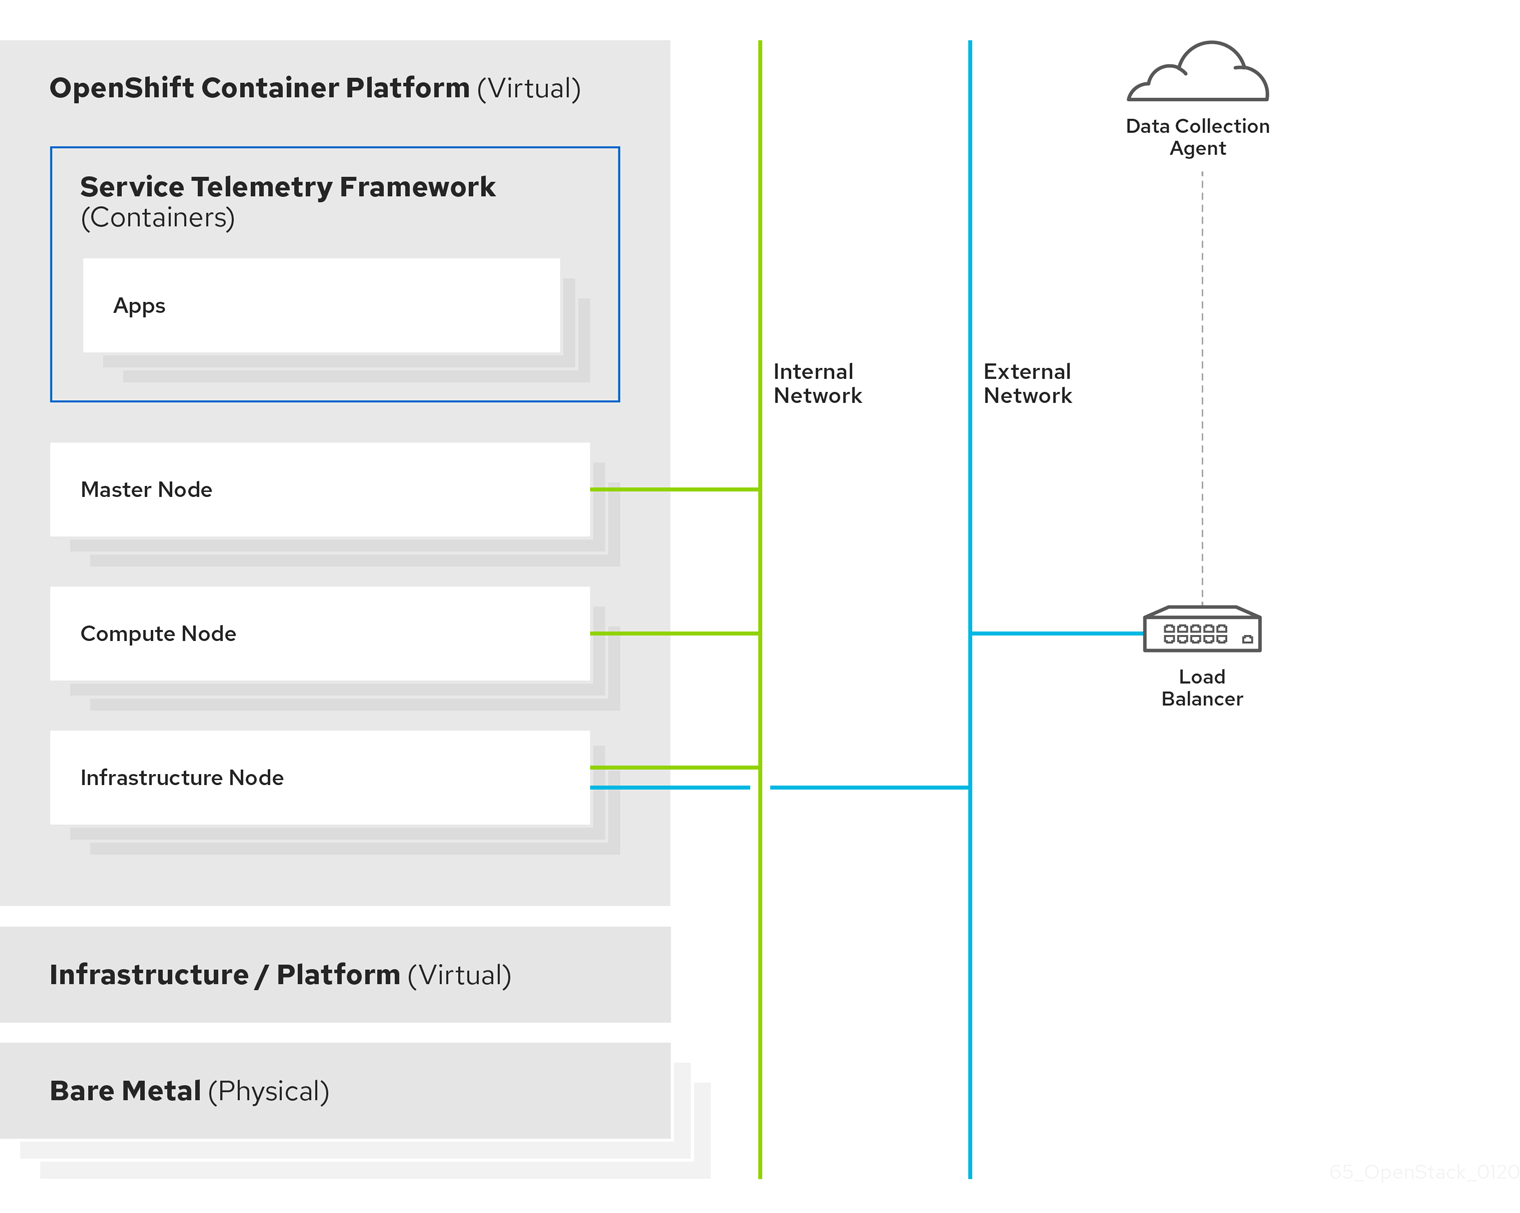
Server-side STF monitoring infrastructure consists of the following layers:
- Service Telemetry Framework 1.4
- Red Hat OpenShift Container Platform 4.7 through 4.8
- Infrastructure platform
Figure 1.2. Server-side STF monitoring infrastructure
1.3. Installation size of Red Hat OpenShift Container Platform
The size of your Red Hat OpenShift Container Platform installation depends on the following factors:
- The infrastructure that you select.
- The number of nodes that you want to monitor.
- The number of metrics that you want to collect.
- The resolution of metrics.
- The length of time that you want to store the data.
Installation of Service Telemetry Framework (STF) depends on an existing Red Hat OpenShift Container Platform environment.
For more information about minimum resources requirements when you install Red Hat OpenShift Container Platform on baremetal, see Minimum resource requirements in the Installing a cluster on bare metal guide. For installation requirements of the various public and private cloud platforms that you can install, see the corresponding installation documentation for your cloud platform of choice.