
Chapter 8. Adding the Red Hat Ceph Storage Dashboard to an overcloud deployment
Red Hat Ceph Storage Dashboard is disabled by default but you can now enable it in your overcloud with the Red Hat OpenStack Platform director. The Ceph Dashboard is a built-in, web-based Ceph management and monitoring application to administer various aspects and objects in your cluster. Red Hat Ceph Storage Dashboard comprises the Ceph Dashboard manager module, which provides the user interface and embeds Grafana, the front end of the platform, Prometheus as a monitoring plugin, Alertmanager and Node Exporters that are deployed throughout the cluster and send alerts and export cluster data to the Dashboard.
- Note
- This feature is supported with Ceph Storage 4.1 or later. For more information about how to determine the version of Ceph Storage installed on your system, see Red Hat Ceph Storage releases and corresponding Ceph package versions.
- Note
- The Red Hat Ceph Storage Dashboard is always colocated on the same nodes as the other Ceph manager components.
- Note
- If you want to add Ceph Dashboard during your initial overcloud deployment, complete the procedures in this chapter before you deploy your initial overcloud in Section 7.2, “Initiating overcloud deployment”.
The following diagram shows the architecture of Ceph Dashboard on Red Hat OpenStack Platform:
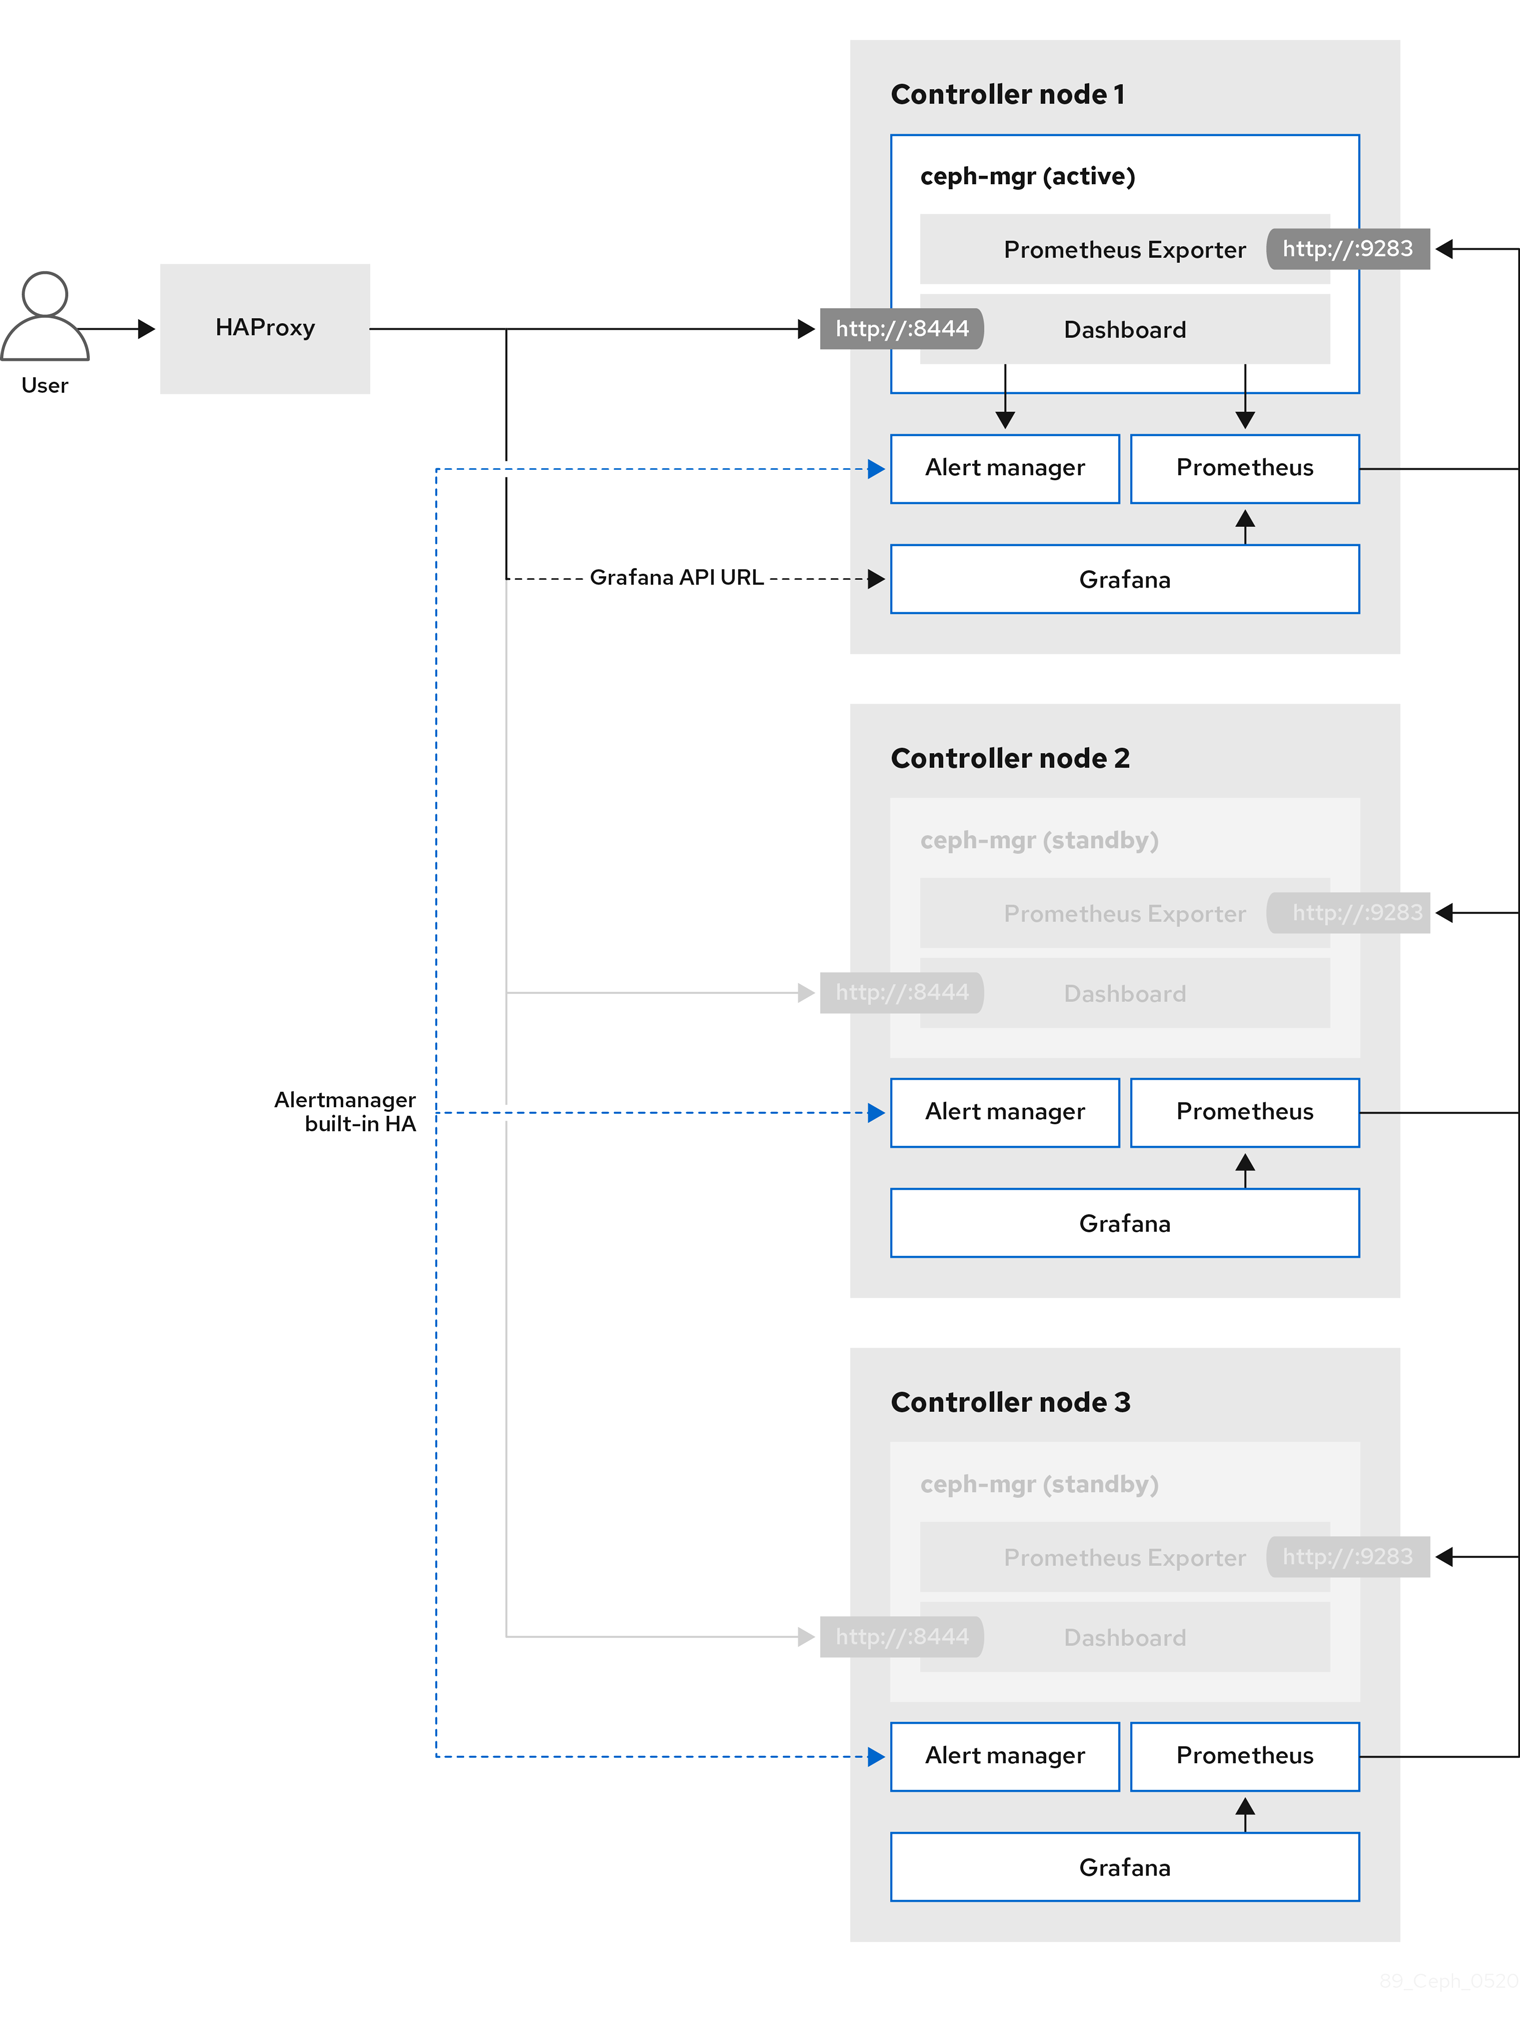
For more information about the Dashboard and its features and limitations, see Dashboard features in the Red Hat Ceph Storage Dashboard Guide.
TLS everywhere with Ceph Dashboard
The dashboard front end is fully integrated with the TLS everywhere framework. You can enable TLS everywhere provided that you have the required environment files and they are included in the overcloud deploy command. This triggers the certificate request for both Grafana and the Ceph Dashboard and the generated certificate and key files are passed to ceph-ansible during the overcloud deployment. For instructions and more information about how to enable TLS for the Dashboard as well as for other openstack services, see the following locations in the Advanced Overcloud Customization guide:
- Enabling SSL/TLS on Overcloud Public Endpoints.
Enabling SSL/TLS on Internal and Public Endpoints with Identity Management.
- Note
- The port to reach the Ceph Dashboard remains the same even in the TLS-everywhere context.
8.1. Including the necessary containers for the Ceph Dashboard
Before you can add the Ceph Dashboard templates to your overcloud, you must include the necessary containers by using the containers-prepare-parameter.yaml file. To generate the containers-prepare-parameter.yaml file to prepare your container images, complete the following steps:
Procedure
-
Log in to your undercloud host as the
stackuser. Generate the default container image preparation file:
$ openstack tripleo container image prepare default \
  --local-push-destination \
  --output-env-file containers-prepare-parameter.yaml
Edit the
containers-prepare-parameter.yamlfile and make the modifications to suit your requirements. The following examplecontainers-prepare-parameter.yamlfile contains the image locations and tags related to the Dashboard services including Grafana, Prometheus, Alertmanager, and Node Exporter. Edit the values depending on your specific scenario:parameter_defaults: ContainerImagePrepare: - push_destination: true set: ceph_alertmanager_image: ose-prometheus-alertmanager ceph_alertmanager_namespace: registry.redhat.io/openshift4 ceph_alertmanager_tag: v4.1 ceph_grafana_image: rhceph-3-dashboard-rhel7 ceph_grafana_namespace: registry.redhat.io/rhceph ceph_grafana_tag: 3 ceph_image: rhceph-4-rhel8 ceph_namespace: registry.redhat.io/rhceph ceph_node_exporter_image: ose-prometheus-node-exporter ceph_node_exporter_namespace: registry.redhat.io/openshift4 ceph_node_exporter_tag: v4.1 ceph_prometheus_image: ose-prometheus ceph_prometheus_namespace: registry.redhat.io/openshift4 ceph_prometheus_tag: v4.1 ceph_tag: latest
For more information about registry and image configuration with the containers-prepare-parameter.yaml file, see Container image preparation parameters in the Transitioning to Containerized Services guide.
8.2. Deploying Ceph Dashboard
- Note
- The Ceph Dashboard admin user role is set to read-only mode by default. To change the Ceph Dashboard admin default mode, see Section 8.3, “Changing the default permissions”.
Procedure
-
Log in to the undercloud node as the
stackuser. Include the following environment files, with all environment files that are part of your existing deployment, in the
openstack overcloud deploycommand:$ openstack overcloud deploy \ --templates \ -e <existing_overcloud_environment_files> \ -e /usr/share/openstack-tripleo-heat-templates/environments/ceph-ansible/ceph-ansible.yaml \ -e /usr/share/openstack-tripleo-heat-templates/environments/ceph-ansible/ceph-dashboard.yaml
Replace
<existing_overcloud_environment_files>with the list of environment files that are part of your existing deployment.- Result
- The resulting deployment comprises an external stack with the grafana, prometheus, alertmanager, and node-exporter containers. The Ceph Dashboard manager module is the back end for this stack and embeds the grafana layouts to provide ceph cluster specific metrics to the end users.
8.3. Changing the default permissions
The Ceph Dashboard admin user role is set to read-only mode by default for safe monitoring of the Ceph cluster. To permit an admin user to have elevated privileges so that they can alter elements of the Ceph cluster with the Dashboard, you can use the CephDashboardAdminRO parameter to change the default admin permissions.
- Warning
- A user with full permissions might alter elements of your cluster that director configures. This can cause a conflict with director-configured options when you run a stack update. To avoid this problem, do not alter director-configured options with Ceph Dashboard, for example, Ceph OSP pools attributes.
Procedure
-
Log in to the undercloud as the
stackuser. Create the following
ceph_dashboard_admin.yamlenvironment file:parameter_defaults: CephDashboardAdminRO: falseRun the overcloud deploy command to update the existing stack and include the environment file you created with all other environment files that are part of your existing deployment:
$ openstack overcloud deploy \
--templates \
-e <existing_overcloud_environment_files> \
-e ceph_dashboard_admin.yml
Replace
<existing_overcloud_environment_files>with the list of environment files that are part of your existing deployment.
8.4. Accessing Ceph Dashboard
To test that Ceph Dashboard is running correctly, complete the following verification steps to access it and check that the data it displays from the Ceph cluster is correct.
Procedure
-
Log in to the undercloud node as the
stackuser. Retrieve the dashboard admin login credentials:
[stack@undercloud ~]$ grep dashboard_admin_password /var/lib/mistral/overcloud/ceph-ansible/group_vars/all.yml
Retrieve the VIP address to access the Ceph Dashboard:
[stack@undercloud-0 ~]$ grep dashboard_frontend /var/lib/mistral/overcloud/ceph-ansible/group_vars/mgrs.yml
Use a web browser to point to the front end VIP and access the Dashboard. Director configures and exposes the Dashboard on the provisioning network, so you can use the VIP that you retrieved in step 2 to access the dashboard directly on TCP port 8444. Ensure that the following conditions are met:
- The Web client host is layer 2 connected to the provisioning network.
The provisioning network is properly routed or proxied, and it can be reached from the web client host. If these conditions are not met, you can still open a SSH tunnel to reach the Dashboard VIP on the overcloud:
client_host$ ssh -L 8444:<dashboard vip>:8444 stack@<your undercloud>
Replace <dashboard vip> with the IP address of the control plane VIP that you retrieved in step 3.
Access the Dashboard by pointing your web browser to http://localhost:8444. The default user that
ceph-ansiblecreates is admin. You can retrieve the password in/var/lib/mistral/overcloud/ceph-ansible/group_vars/all.yml.- Results
- You can access the Ceph Dashboard.
-
The numbers and graphs that the Dashboard displays reflect the same cluster status that the CLI command,
ceph -s, returns.
For more information about the Red Hat Ceph Storage Dashboard, see the Red Hat Ceph Storage Administration Guide