
Service Telemetry Framework 1.0
Installing and deploying Service Telemetry Framework 1.0
Abstract
Chapter 1. Introduction to Service Telemetry Framework
Service Telemetry Framework (STF) provides automated collection of measurements and data from remote clients - Red Hat OpenStack Platform or third-party nodes - and transmission of that information to a centralized, receiving Red Hat OpenShift Container Platform (OCP) deployment for storage, retrieval, and monitoring. The data can be either of two types:
- Metric
- a numeric measurement of an application or system
- Event
- irregular and discrete occurrences that happen in a system
The collection components that are required on the clients are lightweight. The multicast message bus that is shared by all clients and the deployment provides fast and reliable data transport. Other modular components for receiving and storing data are deployed in containers on OCP.
STF provides access to monitoring functions such as alert generation, visualization through dashboards, and single source of truth telemetry analysis to support orchestration.
1.1. Service Telemetry Framework architecture
Service Telemetry Framework (STF) uses the components described in Table 1.1, “STF components”:
Table 1.1. STF components
| Client | Component | Server (OCP) |
|---|---|---|
| yes | An AMQP 1.x compatible messaging bus to shuttle the metrics to STF for storage in Prometheus | yes |
| no | Smart Gateway to pick metrics and events from the AMQP 1.x bus and to deliver events to ElasticSearch or to provide metrics to Prometheus | yes |
| no | Prometheus as time-series data storage | yes |
| no | ElasticSearch as events data storage | yes |
| yes | collectd to collect infrastructure metrics and events | no |
| yes | Ceilometer to collect Red Hat OpenStack Platform metrics and events | no |
Figure 1.1. Service Telemetry Framework architecture overview
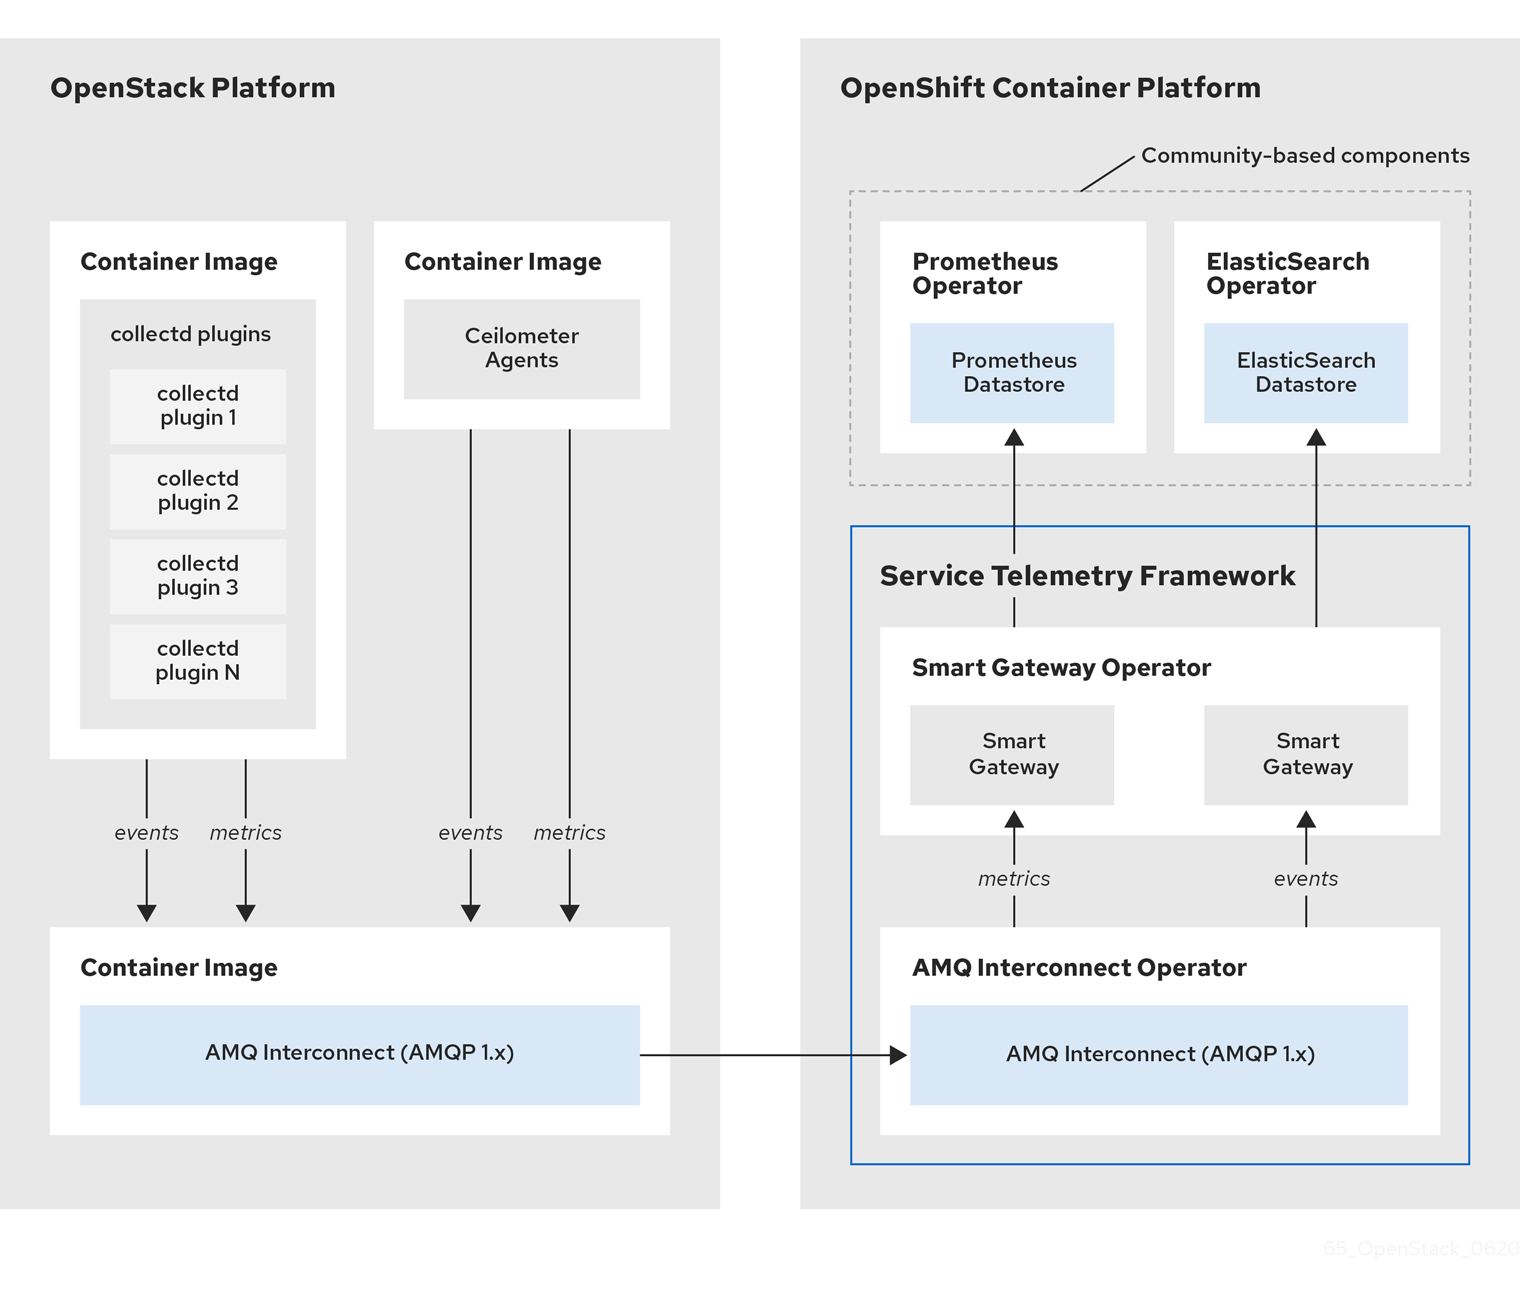
The Service Telemetry Framework data collection components, collectd and Ceilometer, and the transport components, AMQ Interconnect and Smart Gateway, are fully supported. The data storage components, Prometheus and ElasticSearch, including the Operator artifacts, and visualization component Grafana are community-supported, and are not officially supported.
For metrics, on the client side, collectd collects high-resolution metrics. collectd delivers the data to Prometheus by using the AMQP1 plugin, which places the data onto the message bus. On the server side, a Golang application called the Smart Gateway takes the data stream from the bus and exposes it as a local scrape endpoint for Prometheus.
If you plan to collect and store events, collectd or Ceilometer delivers event data to the server side by using the AMQP1 plugin, which places the data onto the message bus. Another Smart Gateway writes the data to the ElasticSearch datastore.
Server-side STF monitoring infrastructure consists of the following layers:
- Service Telemetry Framework 1.0 (STF)
- Red Hat OpenShift Container Platform (OCP)
- Infrastructure platform
Figure 1.2. Server-side STF monitoring infrastructure
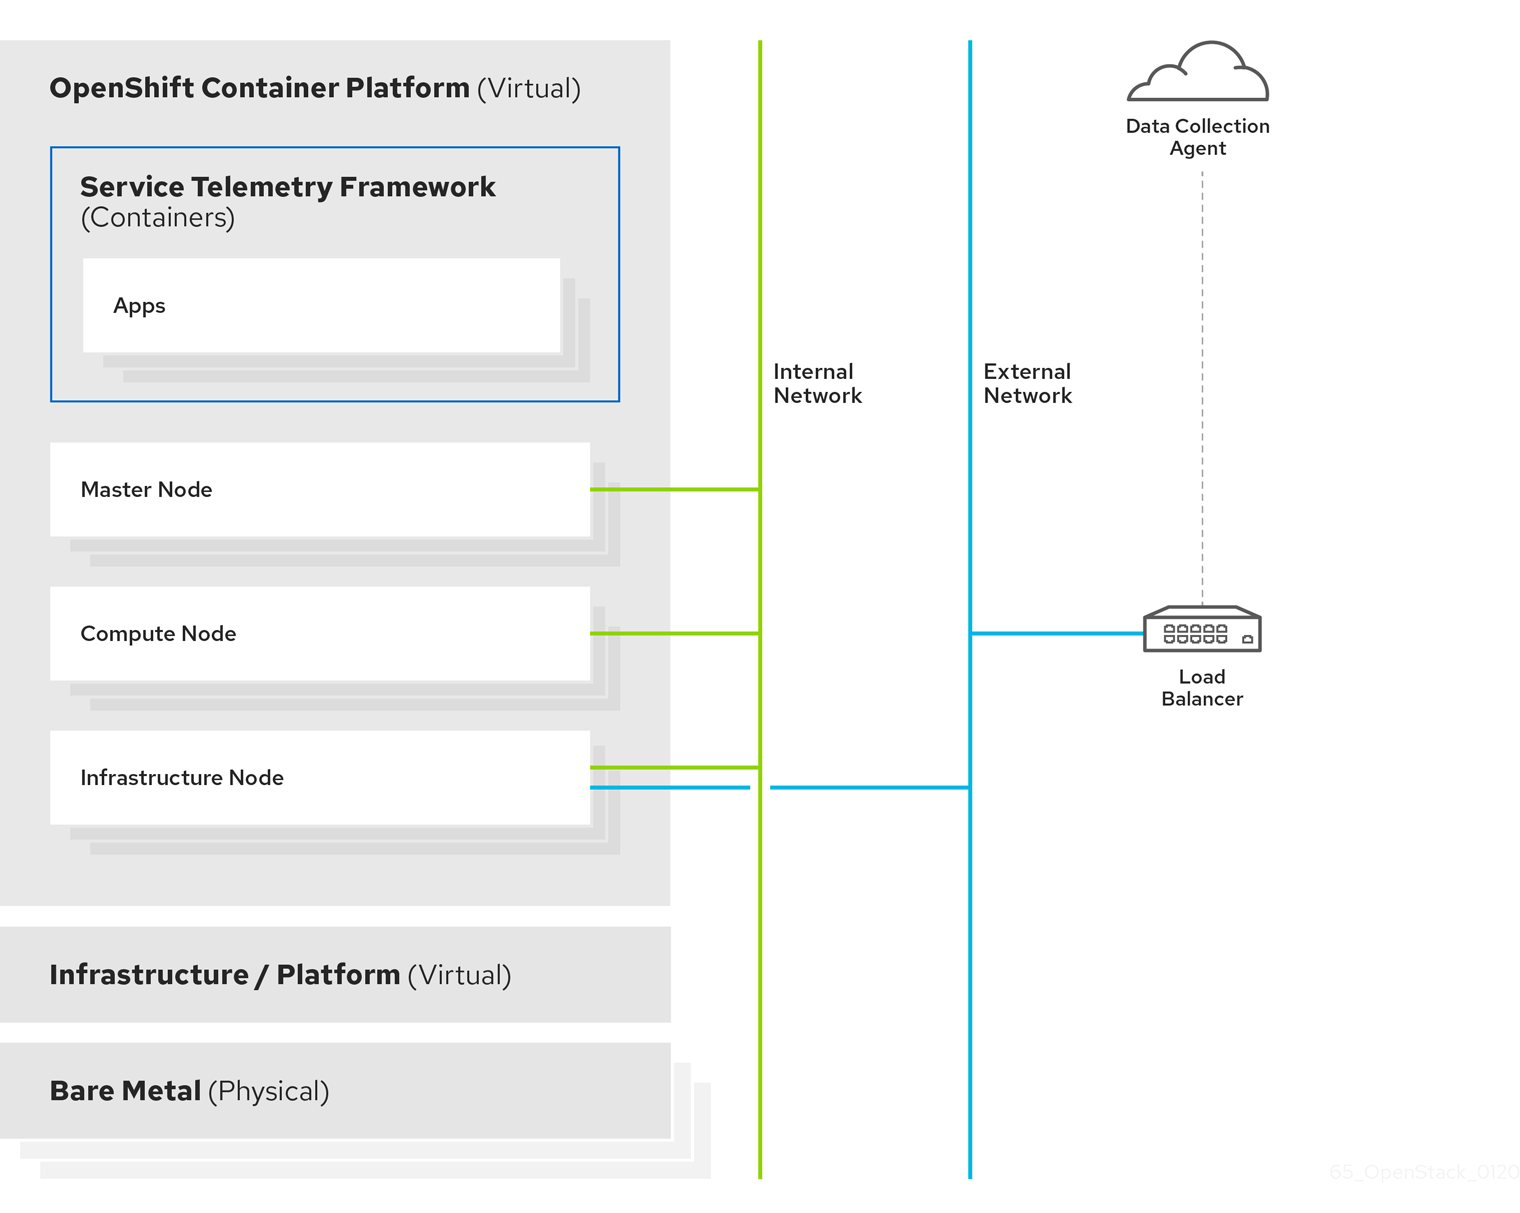
For more information about how to deploy Red Hat OpenShift Container Platform, see the OCP product documentation. You can install OCP on cloud platforms or on bare metal. For more information about STF performance and scaling, see https://access.redhat.com/articles/4907241.
Do not install OCP on the same infrastructure that you want to monitor.
1.2. Installation size
The size of your Red Hat OpenShift Container Platform installation depends on the following factors:
- The number of nodes you want to monitor.
- The number of metrics you want to collect.
- The resolution of metrics.
- The length of time that you want to store the data.
Installation of Service Telemetry Framework (STF) depends on the existing Red Hat OpenShift Container Platform environment. Ensure that you install monitoring for Red Hat OpenStack Platform on a platform separate from your Red Hat OpenStack Platform environment. You can install Red Hat OpenShift Container Platform (OCP) on baremetal or other supported cloud platforms. For more information about installing OCP, see OpenShift Container Platform 4.3 Documentation.
The size of your OCP environment depends on the infrastructure you select. For more information about minimum resources requirements when installing OCP on baremetal, see Minimum resource requirements in the Installing a cluster on bare metal guide. For installation requirements of the various public and private cloud platforms which you can install, see the corresponding installation documentation for your cloud platform of choice.
Chapter 2. Installing the core components of Service Telemetry Framework
Before you install Service Telemetry Framework (STF), ensure that Red Hat OpenShift Container Platform (OCP) version 4.x is running and that you understand the core components of the framework. As part of the OCP installation planning process, ensure that the administrator provides persistent storage and enough resources to run the STF components on top of the OCP environment.
Red Hat OpenShift Container Platform version 4.3 or later is currently required for a successful installation of STF.
2.1. The core components of STF
The following STF core components are managed by Operators:
- Prometheus and AlertManager
- ElasticSearch
- Smart Gateway
- AMQ Interconnect
Each component has a corresponding Operator that you can use to load the various application components and objects.
Additional resources
For more information about Operators, see the Understanding Operators guide.
2.2. Preparing your OCP environment for STF
As you prepare your OCP environment for STF, you must plan for persistent storage, adequate resources, and event storage:
- Ensure that persistent storage is available in your Red Hat OpenShift Container Platform cluster to permit a production grade deployment. For more information, see Section 2.2.1, “Persistent volumes”.
- Ensure that enough resources are available to run the Operators and the application containers. For more information, see Section 2.2.2, “Resource allocation”.
- To install ElasticSearch, you must use a community catalog source. If you do not want to use a community catalog or if you do not want to store events, see Section 2.3, “Deploying STF to the OCP environment”.
-
STF uses ElasticSearch to store events, which requires a larger than normal
vm.max_map_count. Thevm.max_map_countvalue is set by default in Red Hat OpenShift Container Platform. For more information about how to edit the value ofvm.max_map_count, see Section 2.2.3, “Node tuning operator”.
2.2.1. Persistent volumes
STF uses persistent storage in OCP to instantiate the volumes dynamically so that Prometheus and ElasticSearch can store metrics and events.
Additional resources
For more information about configuring persistent storage for OCP, see Understanding persistent storage.
2.2.1.1. Using ephemeral storage
You can use ephemeral storage with STF. However, if you use ephemeral storage, you might experience data loss if a pod is restarted, updated, or rescheduled onto another node. Use ephemeral storage only for development or testing, and not production environments.
Procedure
-
To enable ephemeral storage for STF, set
storageEphemeralEnabled: truein yourServiceTelemetrymanifest.
Additional resources
For more information about enabling ephemeral storage for STF, see Section 4.6.1, “Configuring ephemeral storage”.
2.2.2. Resource allocation
To enable the scheduling of pods within the OCP infrastructure, you need resources for the components that are running. If you do not allocate enough resources, pods remain in a Pending state because they cannot be scheduled.
The amount of resources that you require to run STF depends on your environment and the number of nodes and clouds that you want to monitor.
Additional resources
For recommendations about sizing for metrics collection see https://access.redhat.com/articles/4907241.
For information about sizing requirements for ElasticSearch, see https://www.elastic.co/guide/en/cloud-on-k8s/current/k8s-managing-compute-resources.html
2.2.3. Node tuning operator
STF uses ElasticSearch to store events, which requires a larger than normal vm.max_map_count. The vm.max_map_count value is set by default in Red Hat OpenShift Container Platform.
If you want to edit the value of vm.max_map_count, you cannot apply node tuning manually using the sysctl command because Red Hat OpenShift Container Platform manages nodes directly. To configure values and apply them to the infrastructure, you must use the node tuning operator. For more information, see Using the Node Tuning Operator.
In an OCP deployment, the default node tuning operator specification provides the required profiles for ElasticSearch workloads or pods scheduled on nodes. To view the default cluster node tuning specification, run the following command:
oc get Tuned/default -o yaml -n openshift-cluster-node-tuning-operator
The output of the default specification is documented at Default profiles set on a cluster. The assignment of profiles is managed in the recommend section where profiles are applied to a node when certain conditions are met. When scheduling ElasticSearch to a node in STF, one of the following profiles is applied:
-
openshift-control-plane-es -
openshift-node-es
When scheduling an ElasticSearch pod, there must be a label present that matches tuned.openshift.io/elasticsearch. If the label is present, one of the two profiles is assigned to the pod. No action is required by the administrator if you use the recommended Operator for ElasticSearch. If you use a custom-deployed ElasticSearch with STF, ensure that you add the tuned.openshift.io/elasticsearch label to all scheduled pods.
Additional resources
For more information about virtual memory usage by ElasticSearch, see https://www.elastic.co/guide/en/elasticsearch/reference/current/vm-max-map-count.html
For more information about how the profiles are applied to nodes, see Custom tuning specification.
2.3. Deploying STF to the OCP environment
You can deploy STF to the OCP environment in one of two ways:
- Deploy STF and store events with ElasticSearch. For more information, see Section 2.3.1, “Deploying STF to the OCP environment with ElasticSearch”.
- Deploy STF without ElasticSearch and disable events support. For more information, see Section 2.3.2, “Deploying STF to the OCP environment without ElasticSearch”.
2.3.1. Deploying STF to the OCP environment with ElasticSearch
Complete the following tasks:
- Section 2.3.3, “Creating a namespace”.
- Section 2.3.4, “Creating an OperatorGroup”.
- Section 2.3.5, “Enabling the OperatorHub.io Community Catalog Source”.
- Section 2.3.6, “Enabling Red Hat STF Operator Source”.
- Section 2.3.7, “Subscribing to the AMQ Certificate Manager Operator”.
- Section 2.3.8, “Subscribing to the Elastic Cloud on Kubernetes Operator”.
- Section 2.3.9, “Subscribing to the Service Telemetry Operator”.
- Section 2.3.10, “Creating a ServiceTelemetry object in OCP”.
2.3.2. Deploying STF to the OCP environment without ElasticSearch
Complete the following tasks:
- Section 2.3.3, “Creating a namespace”.
- Section 2.3.4, “Creating an OperatorGroup”.
- Section 2.3.6, “Enabling Red Hat STF Operator Source”.
- Section 2.3.7, “Subscribing to the AMQ Certificate Manager Operator”.
- Section 2.3.9, “Subscribing to the Service Telemetry Operator”.
- Section 2.3.10, “Creating a ServiceTelemetry object in OCP”.
2.3.3. Creating a namespace
Create a namespace to hold the STF components. The service-telemetry namespace is used throughout the documentation:
Procedure
Enter the following command:
oc new-project service-telemetry
2.3.4. Creating an OperatorGroup
Create an OperatorGroup in the namespace so that you can schedule the Operator pods.
Procedure
Enter the following command:
oc apply -f - <<EOF
apiVersion: operators.coreos.com/v1
kind: OperatorGroup
metadata:
  name: service-telemetry-operator-group
  namespace: service-telemetry
spec:
  targetNamespaces:
  - service-telemetry
EOF
Additional resources
For more information, see OperatorGroups.
2.3.5. Enabling the OperatorHub.io Community Catalog Source
Before you install ElasticSearch, you must have access to the resources on the OperatorHub.io Community Catalog Source:
Procedure
Enter the following command:
oc apply -f - <<EOF
apiVersion: operators.coreos.com/v1alpha1
kind: CatalogSource
metadata:
  name: operatorhubio-operators
  namespace: openshift-marketplace
spec:
  sourceType: grpc
  image: quay.io/operator-framework/upstream-community-operators:latest
  displayName: OperatorHub.io Operators
  publisher: OperatorHub.io
EOF
2.3.6. Enabling Red Hat STF Operator Source
Before you deploy STF on Red Hat OpenShift Container Platform, you must enable the operator source.
Procedure
Install an OperatorSource that contains the Service Telemetry Operator and the Smart Gateway Operator:
oc apply -f - <<EOF
apiVersion: operators.coreos.com/v1
kind: OperatorSource
metadata:
  labels:
    opsrc-provider: redhat-operators-stf
  name: redhat-operators-stf
  namespace: openshift-marketplace
spec:
  authorizationToken: {}
  displayName: Red Hat STF Operators
  endpoint: https://quay.io/cnr
  publisher: Red Hat
  registryNamespace: redhat-operators-stf
  type: appregistry
EOF
To validate the creation of your OperatorSource, use the
oc get operatorsourcescommand. A successful import results in theMESSAGEfield returning a result ofThe object has been successfully reconciled.$ oc get -nopenshift-marketplace operatorsource redhat-operators-stf NAME TYPE ENDPOINT REGISTRY DISPLAYNAME PUBLISHER STATUS MESSAGE redhat-operators-stf appregistry https://quay.io/cnr redhat-operators-stf Red Hat STF Operators Red Hat Succeeded The object has been successfully reconciled
To validate that the Operators are available from the catalog, use the
oc get packagemanifestcommand:$ oc get packagemanifests | grep "Red Hat STF" smartgateway-operator Red Hat STF Operators 2m50s servicetelemetry-operator Red Hat STF Operators 2m50s
2.3.7. Subscribing to the AMQ Certificate Manager Operator
You must subscribe to the AMQ Certificate Manager Operator before you deploy the other STF components because the AMQ Certificate Manager Operator runs globally-scoped and is not compatible with the dependency management of Operator Lifecycle Manager when used with other namespace-scoped operators.
Procedure
Subscribe to the AMQ Certificate Manager Operator, create the subscription, and validate the AMQ7 Certificate Manager:
NoteThe AMQ Certificate Manager is installed globally for all namespaces, so the
namespacevalue provided isopenshift-operators. You might not see youramq7-cert-manager.v1.0.0ClusterServiceVersion in theservice-telemetrynamespace for a few minutes until the processing executes against the namespace.oc apply -f - <<EOF apiVersion: operators.coreos.com/v1alpha1 kind: Subscription metadata: name: amq7-cert-manager namespace: openshift-operators spec: channel: alpha installPlanApproval: Automatic name: amq7-cert-manager source: redhat-operators sourceNamespace: openshift-marketplace EOF
To validate your
ClusterServiceVersion, use theoc get csvcommand. Ensure that amq7-cert-manager.v1.0.0 has a phaseSucceeded.$ oc get --namespace openshift-operators csv NAME DISPLAY VERSION REPLACES PHASE amq7-cert-manager.v1.0.0 Red Hat Integration - AMQ Certificate Manager 1.0.0 Succeeded
2.3.8. Subscribing to the Elastic Cloud on Kubernetes Operator
Before you install the Service Telemetry Operator and if you plan to store events in ElasticSearch, you must enable the Elastic Cloud Kubernetes Operator.
Procedure
Apply the following manifest to your OCP environment to enable the Elastic Cloud on Kubernetes Operator:
oc apply -f - <<EOF
apiVersion: operators.coreos.com/v1alpha1
kind: Subscription
metadata:
  name: elastic-cloud-eck
  namespace: service-telemetry
spec:
  channel: stable
  installPlanApproval: Automatic
  name: elastic-cloud-eck
  source: operatorhubio-operators
  sourceNamespace: openshift-marketplace
EOF
To verify that the
ClusterServiceVersionfor ElasticSearch Cloud on Kubernetessucceeded, enter theoc get csvcommand:$ oc get csv NAME DISPLAY VERSION REPLACES PHASE elastic-cloud-eck.v1.1.0 Elastic Cloud on Kubernetes 1.1.0 elastic-cloud-eck.v1.0.1 Succeeded
2.3.9. Subscribing to the Service Telemetry Operator
To instantiate an STF instance, create the ServiceTelemetry object to allow the Service Telemetry Operator to create the environment.
Procedure
To create the Service Telemetry Operator subscription, enter the
oc apply -fcommand:oc apply -f - <<EOF apiVersion: operators.coreos.com/v1alpha1 kind: Subscription metadata: name: servicetelemetry-operator namespace: service-telemetry spec: channel: stable installPlanApproval: Automatic name: servicetelemetry-operator source: redhat-operators-stf sourceNamespace: openshift-marketplace EOF
To validate the Service Telemetry Operator and the dependent operators, enter the following command:
$ oc get csv --namespace service-telemetry
NAME                                DISPLAY                                         VERSION   REPLACES                            PHASE
amq7-cert-manager.v1.0.0            Red Hat Integration - AMQ Certificate Manager   1.0.0                                         Succeeded
amq7-interconnect-operator.v1.2.0   Red Hat Integration - AMQ Interconnect          1.2.0                                         Succeeded
elastic-cloud-eck.v1.1.0            Elastic Cloud on Kubernetes                     1.1.0     elastic-cloud-eck.v1.0.1            Succeeded
prometheusoperator.0.37.0           Prometheus Operator                             0.37.0    prometheusoperator.0.32.0           Succeeded
service-telemetry-operator.v1.0.2   Service Telemetry Operator                      1.0.2     service-telemetry-operator.v1.0.1   Succeeded
smart-gateway-operator.v1.0.1       Smart Gateway Operator                          1.0.1     smart-gateway-operator.v1.0.0       Succeeded
2.3.10. Creating a ServiceTelemetry object in OCP
To deploy the Service Telemetry Framework, you must create an instance of ServiceTelemetry in OCP. By default, eventsEnabled is set to false. If you do not want to store events in ElasticSearch, ensure that eventsEnabled is set to false. For more information, see Section 2.3.2, “Deploying STF to the OCP environment without ElasticSearch”.
The following core parameters are available for a ServiceTelemetry manifest:
Table 2.1. Core parameters for a ServiceTelemetry manifest
| Parameter | Description | Default Value |
|---|---|---|
|
| Enable events support in STF. Requires prerequisite steps to ensure ElasticSearch can be started. For more information, see Section 2.3.8, “Subscribing to the Elastic Cloud on Kubernetes Operator”. |
|
|
| Enable metrics support in STF. |
|
|
| Enable high availability in STF. For more information, see Section 4.3, “High availability”. |
|
|
| Enable ephemeral storage support in STF. For more information, see Section 4.6, “Ephemeral storage”. |
|
Procedure
To store events in ElasticSearch, set
eventsEnabledto true during deployment:oc apply -f - <<EOF apiVersion: infra.watch/v1alpha1 kind: ServiceTelemetry metadata: name: stf-default namespace: service-telemetry spec: eventsEnabled: true metricsEnabled: true EOF
To view the STF deployment logs in the Service Telemetry Operator, use the
oc logscommand:oc logs $(oc get pod --selector='name=service-telemetry-operator' -oname) -c ansible
PLAY RECAP ***
localhost                  : ok=37   changed=0    unreachable=0    failed=0    skipped=1    rescued=0    ignored=0
View the pods and the status of each pod to determine that all workloads are operating nominally:
NoteIf you set
eventsEnabled: true, the notification Smart Gateways willErrorandCrashLoopBackOfffor a period of time before ElasticSearch starts.$ oc get pods NAME READY STATUS RESTARTS AGE alertmanager-stf-default-0 2/2 Running 0 26m elastic-operator-645dc8b8ff-jwnzt 1/1 Running 0 88m elasticsearch-es-default-0 1/1 Running 0 26m interconnect-operator-6fd49d9fb9-4bl92 1/1 Running 0 46m prometheus-operator-bf7d97fb9-kwnlx 1/1 Running 0 46m prometheus-stf-default-0 3/3 Running 0 26m service-telemetry-operator-54f4c99d9b-k7ll6 2/2 Running 0 46m smart-gateway-operator-7ff58bcf94-66rvx 2/2 Running 0 46m stf-default-ceilometer-notification-smartgateway-6675df547q4lbj 1/1 Running 0 26m stf-default-collectd-notification-smartgateway-698c87fbb7-xj528 1/1 Running 0 26m stf-default-collectd-telemetry-smartgateway-79c967c8f7-9hsqn 1/1 Running 0 26m stf-default-interconnect-7458fd4d69-nqbfs 1/1 Running 0 26m
2.4. Removing STF from the OCP environment
Remove STF from an OCP environment if you no longer require the STF functionality.
Complete the following tasks:
2.4.1. Deleting the namespace
To remove the operational resources for STF from OCP, delete the namespace.
Procedure
Run the
oc deletecommand:oc delete project service-telemetry
Verify that the resources have been deleted from the namespace:
$ oc get all
No resources found.
2.4.2. Removing the OperatorSource
If you do not expect to install Service Telemetry Framework again, delete the OperatorSource. When you remove the OperatorSource, PackageManifests related to STF are removed from the Operator Lifecycle Manager catalog.
Procedure
Delete the OperatorSource:
$ oc delete --namespace=openshift-marketplace operatorsource redhat-operators-stf
operatorsource.operators.coreos.com "redhat-operators-stf" deleted
Verify that the STF PackageManifests are removed from the platform. If successful, the following command returns no result:
$ oc get packagemanifests | grep "Red Hat STF"
If you enabled the OperatorHub.io Community Catalog Source during the installation process and you no longer need this catalog source, delete it:
$ oc delete --namespace=openshift-marketplace catalogsource operatorhubio-operators
catalogsource.operators.coreos.com "operatorhubio-operators" deleted
Additional resources
For more information about the OperatorHub.io Community Catalog Source, see Section 2.3, “Deploying STF to the OCP environment”.
Chapter 3. Completing the Service Telemetry Framework configuration
3.1. Connecting Red Hat OpenStack Platform to Service Telemetry Framework
To collect metrics, events, or both, and to send them to the Service Telemetry Framework (STF) storage domain, you must configure the Red Hat OpenStack Platform overcloud to enable data collection and transport.
To deploy data collection and transport to STF on Red Hat OpenStack Platform cloud nodes that employ routed L3 domains, such as distributed compute node (DCN) or spine-leaf, see Section 3.2, “Deploying to non-standard network topologies”.
3.2. Deploying to non-standard network topologies
If your nodes are on a separate network from the default InternalApi network, you must make configuration adjustments so that AMQ Interconnect can transport data to the Service Telemetry Framework (STF) server instance. This scenario is typical in a spine-leaf or a DCN topology. For more information about DCN configuration, see the Spine Leaf Networking guide.
If you use STF with Red Hat OpenStack Platform 16.0 and plan to monitor your Ceph, Block, or Object storage nodes, you must make configuration changes that are similar to the configuration changes that you make to the spine-leaf and DCN network configuration. To monitor Ceph nodes, use the CephStorageExtraConfig parameter to define which network interface to load into the AMQ Interconnect and collectd configuration files.
  CephStorageExtraConfig:
      tripleo::profile::base::metrics::collectd::amqp_host: "%{hiera('storage')}"
      tripleo::profile::base::metrics::qdr::listener_addr: "%{hiera('storage')}"
      tripleo::profile::base::ceilometer::agent::notification::notifier_host_addr: "%{hiera('storage')}"
Similarly, you must specify BlockStorageExtraConfig and ObjectStorageExtraConfig parameters if your environment uses Block and Object storage roles.
The deployment of a spine-leaf topology involves creating roles and networks, then assigning those networks to the available roles. When you configure data collection and transport for STF for an Red Hat OpenStack Platform deployment, the default network for roles is InternalApi. For Ceph, Block and Object storage roles, the default network is Storage. Because a spine-leaf configuration can result in different networks being assigned to different Leaf groupings and those names are typically unique, additional configuration is required in the parameter_defaults section of the Red Hat OpenStack Platform environment files.
Procedure
- Document which networks are available for each of the Leaf roles. For examples of network name definitions, see Creating a network data file in the Spine Leaf Networking guide. For more information about the creation of the Leaf groupings (roles) and assignment of the networks to those groupings, see Creating a roles data file in the Spine Leaf Networking guide.
Add the following configuration example to the
ExtraConfigsection for each of the leaf roles. In this example,internal_api_subnetis the value defined in thename_lowerparameter of your network definition (with_subnetappended to the name for Leaf 0) , and is the network to which theComputeLeaf0leaf role is connected. In this case, the network identification of 0 corresponds to the Compute role for leaf 0, and represents a value that is different from the default internal API network name.For the
ComputeLeaf0leaf role, specify extra configuration to perform a hiera lookup to determine which network interface for a particular network to assign to the collectd AMQP host parameter. Perform the same configuration for the AMQ Interconnect listener address parameter.ComputeLeaf0ExtraConfig: › tripleo::profile::base::metrics::collectd::amqp_host: "%{hiera('internal_api_subnet')}" › tripleo::profile::base::metrics::qdr::listener_addr: "%{hiera('internal_api_subnet')}"Additional leaf roles typically replace
_subnetwith_leafNwhereNrepresents a unique indentifier for the leaf.ComputeLeaf1ExtraConfig: › tripleo::profile::base::metrics::collectd::amqp_host: "%{hiera('internal_api_leaf1')}" › tripleo::profile::base::metrics::qdr::listener_addr: "%{hiera('internal_api_leaf1')}"This example configuration is on a CephStorage leaf role:
CephStorageLeaf0ExtraConfig:
›   tripleo::profile::base::metrics::collectd::amqp_host: "%{hiera('storage_subnet')}"
›   tripleo::profile::base::metrics::qdr::listener_addr: "%{hiera('storage_subnet')}"
3.3. Configuring Red Hat OpenStack Platform overcloud for Service Telemetry Framework
To configure the Red Hat OpenStack Platform overcloud, you must configure the data collection applications and the data transport to STF, and deploy the overcloud.
To configure the Red Hat OpenStack Platform overcloud, complete the following tasks:
3.3.1. Retrieving the AMQ Interconnect route address
When you configure the Red Hat OpenStack Platform overcloud for STF, you must provide the AMQ Interconnect route address in the STF connection file.
Procedure
- Log in to your Red Hat OpenShift Container Platform (OCP) environment.
In the
service-telemetryproject, retrieve the AMQ Interconnect route address:$ oc get routes -ogo-template='{{ range .items }}{{printf "%s\n" .spec.host }}{{ end }}' | grep "\-5671" stf-default-interconnect-5671-service-telemetry.apps.infra.watchNoteIf your STF installation differs from the documentation, ensure that you retrieve the correct AMQ Interconnect route address.
3.3.2. Configuring the STF connection for the overcloud
To configure the STF connection, you must create a file that contains the connection configuration of the AMQ Interconnect for the overcloud to the STF deployment. Enable the collection of events and storage of the events in STF and deploy the overcloud.
Procedure
-
Log in to the Red Hat OpenStack Platform undercloud as the
stackuser. Create a configuration file called
stf-connectors.yamlin the/home/stackdirectory.ImportantThe Service Telemetry Operator simplifies the deployment of all data ingestion and data storage components for single cloud deployments. To share the data storage domain with multiple clouds, see Section 4.5, “Configuring multiple clouds”.
In the
stf-connectors.yamlfile, configure theMetricsQdrConnectorsaddress to connect the AMQ Interconnect on the overcloud to the STF deployment.-
Add the
CeilometerQdrPublishEvents: trueparameter to enable collection and transport of Ceilometer events to STF. Replace the
hostparameter with the value ofHOST/PORTthat you retrieved in Section 3.3.1, “Retrieving the AMQ Interconnect route address”:parameter_defaults: EventPipelinePublishers: [] CeilometerQdrPublishEvents: true MetricsQdrConnectors: - host: stf-default-interconnect-5671-service-telemetry.apps.infra.watch port: 443 role: edge sslProfile: sslProfile verifyHostname: false
-
Add the
Add the following files to your Red Hat OpenStack Platform director deployment to setup collectd and AMQ Interconnect:
-
the
stf-connectors.yamlenvironment file -
the
enable-stf.yamlfile that ensures that the environment is being used during the overcloud deployment the
ceilometer-write-qdr.yamlfile that ensures that Ceilometer telemetry is sent to STFopenstack overcloud deploy <other arguments> --templates /usr/share/openstack-tripleo-heat-templates \ --environment-file <...other-environment-files...> \ --environment-file /usr/share/openstack-tripleo-heat-templates/environments/metrics/ceilometer-write-qdr.yaml \ --environment-file /usr/share/openstack-tripleo-heat-templates/environments/enable-stf.yaml \ --environment-file /home/stack/stf-connectors.yaml
-
the
- Deploy the Red Hat OpenStack Platform overcloud.
3.3.3. Validating client-side installation
To validate data collection from the STF storage domain, query the data sources for delivered data. To validate individual nodes in the Red Hat OpenStack Platform deployment, connect to the console using SSH.
Procedure
- Log in to an overcloud node, for example, controller-0.
Ensure that
metrics_qdrcontainer is running on the node:$ sudo podman container inspect --format '{{.State.Status}}' metrics_qdr runningReturn the internal network address on which AMQ Interconnect is running, for example,
172.17.1.44listening on port5666:$ sudo podman exec -it metrics_qdr cat /etc/qpid-dispatch/qdrouterd.conf listener { host: 172.17.1.44 port: 5666 authenticatePeer: no saslMechanisms: ANONYMOUS }Return a list of connections to the local AMQ Interconnect:
$ sudo podman exec -it metrics_qdr qdstat --bus=172.17.1.44:5666 --connections

Connections
  id   host                                                                  container                                                                                                  role    dir  security                            authentication  tenant
  ============================================================================================================================================================================================================================================================================================
  1    stf-default-interconnect-5671-service-telemetry.apps.infra.watch:443  stf-default-interconnect-7458fd4d69-bgzfb                                                                  edge    out  TLSv1.2(DHE-RSA-AES256-GCM-SHA384)  anonymous-user
  12   172.17.1.44:60290                                                     openstack.org/om/container/controller-0/ceilometer-agent-notification/25/5c02cee550f143ec9ea030db5cccba14  normal  in   no-security                         no-auth
  16   172.17.1.44:36408                                                     metrics                                                                                                    normal  in   no-security                         anonymous-user
  899  172.17.1.44:39500                                                     10a2e99d-1b8a-4329-b48c-4335e5f75c84                                                                       normal  in   no-security                         no-auth
There are four connections:
- Outbound connection to STF
- Inbound connection from collectd
- Inbound connection from ceilometer
Inbound connection from our
qdstatclientThe outbound STF connection is provided to the
MetricsQdrConnectorshost parameter and is the route for the STF storage domain. The other hosts are internal network addresses of the client connections to this AMQ Interconnect.
To ensure that messages are being delivered, list the links, and view the
_edgeaddress in thedelivcolumn for delivery of messages:$ sudo podman exec -it metrics_qdr qdstat --bus=172.17.1.44:5666 --links Router Links type dir conn id id peer class addr phs cap pri undel unsett deliv presett psdrop acc rej rel mod delay rate =========================================================================================================================================================== endpoint out 1 5 local _edge 250 0 0 0 2979926 2979924 0 0 0 2 0 0 0 endpoint in 1 6 250 0 0 0 0 0 0 0 0 0 0 0 0 endpoint in 1 7 250 0 0 0 0 0 0 0 0 0 0 0 0 endpoint out 1 8 250 0 0 0 0 0 0 0 0 0 0 0 0 endpoint in 1 9 250 0 0 0 0 0 0 0 0 0 0 0 0 endpoint out 1 10 250 0 0 0 911 911 0 0 0 0 0 911 0 endpoint in 1 11 250 0 0 0 0 911 0 0 0 0 0 0 0 endpoint out 12 32 local temp.lSY6Mcicol4J2Kp 250 0 0 0 0 0 0 0 0 0 0 0 0 endpoint in 16 41 250 0 0 0 2979924 2979924 0 0 0 0 0 0 0 endpoint in 912 1834 mobile $management 0 250 0 0 0 1 0 0 1 0 0 0 0 0 endpoint out 912 1835 local temp.9Ok2resI9tmt+CT 250 0 0 0 0 0 0 0 0 0 0 0 0
To list the addresses from Red Hat OpenStack Platform nodes to STF, connect to OCP to get the AMQ Interconnect pod name and list the connections. List the available AMQ Interconnect pods:
$ oc get pods -l application=stf-default-interconnect

NAME                                        READY   STATUS    RESTARTS   AGE
stf-default-interconnect-7458fd4d69-bgzfb   1/1     Running   0          6d21h
Connect to the pod and run the
qdstat --connectionscommand to list the known connections:$ oc exec -it stf-default-interconnect-7458fd4d69-bgzfb -- qdstat --connections 2020-04-21 18:25:47.243852 UTC stf-default-interconnect-7458fd4d69-bgzfb Connections id host container role dir security authentication project last dlv uptime ====================================================================================================================================================================================================== 1 10.129.2.21:43062 rcv[stf-default-collectd-telemetry-smartgateway-79c967c8f7-kq4qv] normal in no-security anonymous-user 000:00:00:00 006:21:50:25 2 10.130.0.52:55754 rcv[stf-default-ceilometer-notification-smartgateway-6675df547mbjk5] normal in no-security anonymous-user 000:21:25:57 006:21:49:36 3 10.130.0.51:43110 rcv[stf-default-collectd-notification-smartgateway-698c87fbb7-f28v6] normal in no-security anonymous-user 000:21:36:53 006:21:49:09 22 10.128.0.1:51948 Router.ceph-0.redhat.local edge in TLSv1/SSLv3(DHE-RSA-AES256-GCM-SHA384) anonymous-user 000:00:00:03 000:22:08:43 23 10.128.0.1:51950 Router.compute-0.redhat.local edge in TLSv1/SSLv3(DHE-RSA-AES256-GCM-SHA384) anonymous-user 000:00:00:03 000:22:08:43 24 10.128.0.1:52082 Router.controller-0.redhat.local edge in TLSv1/SSLv3(DHE-RSA-AES256-GCM-SHA384) anonymous-user 000:00:00:00 000:22:08:34 27 127.0.0.1:42202 c2f541c1-4c97-4b37-a189-a396c08fb079 normal in no-security no-auth 000:00:00:00 000:00:00:00
In this example, there are three
edgeconnections from the Red Hat OpenStack Platform nodes with connectionid22, 23, and 24.To view the number of messages delivered by the network, use each address with the
oc execcommand:$ oc exec -it stf-default-interconnect-7458fd4d69-bgzfb -- qdstat --address 2020-04-21 18:20:10.293258 UTC stf-default-interconnect-7458fd4d69-bgzfb Router Addresses class addr phs distrib pri local remote in out thru fallback ==================================================================================================================== mobile anycast/ceilometer/event.sample 0 balanced - 1 0 1,553 1,553 0 0 mobile collectd/notify 0 multicast - 1 0 10 10 0 0 mobile collectd/telemetry 0 multicast - 1 0 7,798,049 7,798,049 0 0
Chapter 4. Advanced features
The following optional features can provide additional functionality to the Service Telemetry Framework (STF):
- Customizing the deployment. For more information, see Section 4.1, “Customizing the deployment”.
- Alerts. For more information, see Section 4.2, “Alerts”.
- High availability. For more information, see Section 4.3, “High availability”.
- Dashboards. For more information, see Section 4.4, “Dashboards”.
- Multiple clouds. For more information, see Section 4.5, “Configuring multiple clouds”.
- Ephemeral storage. For more information, see Section 4.6, “Ephemeral storage”.
4.1. Customizing the deployment
The Service Telemetry Operator watches for a ServiceTelemetry manifest to load into Red Hat OpenShift Container Platform (OCP). The Operator then creates other objects in memory, which results in the dependent Operators creating the workloads they are responsible for managing.
When you override the manifest, you must provide the entire manifest contents, including object names or namespaces. There is no dynamic parameter substitution when you override a manifest.
To override a manifest successfully with Service Telemetry Framework (STF), deploy a default environment using the core options only. For more information about the core options, see Section 2.3.10, “Creating a ServiceTelemetry object in OCP”. When you deploy STF, use the oc get command to retrieve the default deployed manifest. When you use a manifest that was originally generated by Service Telemetry Operator, the manifest is compatible with the other objects that are managed by the Operators.
For example, when the metricsEnabled: true parameter is configured in the ServiceTelemetry manifest, the Service Telemetry Operator requests components for metrics retrieval and storage using the default manifests. In some cases, you might want to override the default manifest. For more information, see Section 4.1.1, “Manifest override parameters”.
4.1.1. Manifest override parameters
This table describes the available parameters that you can use to override a manifest, along with the corresponding retrieval commands.
Table 4.1. Manifest override parameters
| Override parameter | Description | Retrieval command |
|---|---|---|
|
|
Override the |
|
|
|
Override the |
|
|
|
Override the |
|
|
|
Override the |
|
|
|
Override the |
|
|
|
Override the |
|
|
|
Override the |
|
|
|
Override the |
|
|
|
Override the |
|
4.1.2. Overriding a managed manifest
Edit the ServiceTelemetry object and provide a parameter and manifest. For a list of available manifest override parameters, see Section 4.1, “Customizing the deployment”. The default ServiceTelemetry object is stf-default. Use oc get servicetelemetry to list the available STF deployments.
The oc edit command loads the default system editor. To override the default editor, pass or set the environment variable EDITOR to the preferred editor. For example, EDITOR=nano oc edit servicetelemetry stf-default.
Procedure
- Log in to Red Hat OpenShift Container Platform.
Change to the
service-telemetrynamespace:oc project service-telemetry
Load the
ServiceTelemetryobject into an editor:oc edit servicetelemetry stf-default
To modify the
ServiceTelemetryobject, provide a manifest override parameter and the contents of the manifest to write to OCP instead of the defaults provided by STF.NoteThe trailing pipe (
|) after entering the manifest override parameter indicates that the value provided is multi-line.$ oc edit servicetelemetry stf-default apiVersion: infra.watch/v1alpha1 kind: ServiceTelemetry metadata: annotations: kubectl.kubernetes.io/last-applied-configuration: | {"apiVersion":"infra.watch/v1alpha1","kind":"ServiceTelemetry","metadata":{"annotations":{},"name":"stf-default","namespace":"service-telemetry"},"spec":{metricsEnabled":true}} creationTimestamp: "2020-04-14T20:29:42Z" generation: 1 name: stf-default namespace: service-telemetry resourceVersion: "1949423" selfLink: /apis/infra.watch/v1alpha1/namespaces/service-telemetry/servicetelemetrys/stf-default uid: d058bc41-1bb0-49f5-9a8b-642f4b8adb95 spec: metricsEnabled: true smartgatewayCollectdMetricsManifest: | 1 apiVersion: smartgateway.infra.watch/v2alpha1 kind: SmartGateway metadata: name: stf-default-collectd-telemetry namespace: service-telemetry spec: amqpUrl: stf-default-interconnect.service-telemetry.svc.cluster.local:5672/collectd/telemetry debug: true prefetch: 15000 serviceType: metrics size: 1 useTimestamp: true 2 status: conditions: - ansibleResult: changed: 0 completion: 2020-04-14T20:32:19.079508 failures: 0 ok: 52 skipped: 1 lastTransitionTime: "2020-04-14T20:29:59Z" message: Awaiting next reconciliation reason: Successful status: "True" type: Running- Save and close.
4.2. Alerts
You create alert rules in Prometheus and alert routes in Alertmanager. Alert rules in Prometheus servers send alerts to an Alertmanager, which manages the alerts. Alertmanager can silence, inhibit, or aggregate alerts, and send notifications using email, on-call notification systems, or chat platforms.
To create an alert, complete the following tasks:
- Create an alert rule in Prometheus. For more information, see Section 4.2.1, “Creating an alert rule in Prometheus”.
- Create an alert route in Alertmanager. For more information, see Section 4.2.3, “Creating an alert route in Alertmanager”.
Additional resources
For more information about alerts or notifications with Prometheus and Alertmanager, see https://prometheus.io/docs/alerting/overview/
To view an example set of alerts that you can use with Service Telemetry Framework (STF), see https://github.com/infrawatch/service-telemetry-operator/tree/master/deploy/alerts
4.2.1. Creating an alert rule in Prometheus
Prometheus evaluates alert rules to trigger notifications. If the rule condition returns an empty result set, the condition is false. Otherwise, the rule is true and it triggers an alert.
Procedure
- Log in to Red Hat OpenShift Container Platform.
Change to the
service-telemetrynamespace:oc project service-telemetry
Create a
PrometheusRuleobject that contains the alert rule. The Prometheus Operator loads the rule into Prometheus:oc apply -f - <<EOF apiVersion: monitoring.coreos.com/v1 kind: PrometheusRule metadata: creationTimestamp: null labels: prometheus: stf-default role: alert-rules name: prometheus-alarm-rules namespace: service-telemetry spec: groups: - name: ./openstack.rules rules: - alert: Metric Listener down expr: collectd_qpid_router_status < 1 # To change the rule, edit the value of the expr parameter. EOFTo verify that the rules have been loaded into Prometheus by the Operator, create a pod with access to
curl:oc run curl --generator=run-pod/v1 --image=radial/busyboxplus:curl -i --tty
Run
curlto access theprometheus-operatedservice to return the rules loaded into memory:[ root@curl:/ ]$ curl prometheus-operated:9090/api/v1/rules {"status":"success","data":{"groups":[{"name":"./openstack.rules","file":"/etc/prometheus/rules/prometheus-stf-default-rulefiles-0/service-telemetry-prometheus-alarm-rules.yaml","rules":[{"name":"Metric Listener down","query":"collectd_qpid_router_status \u003c 1","duration":0,"labels":{},"annotations":{},"alerts":[],"health":"ok","type":"alerting"}],"interval":30}]}}To verify that the output shows the rules loaded into the
PrometheusRuleobject, for example the output contains the defined./openstack.rules, exit from the pod:[ root@curl:/ ]$ exit
Clean up the environment by deleting the
curlpod:$ oc delete pod curl pod "curl" deleted
Additional resources
For more information on alerting, see https://github.com/coreos/prometheus-operator/blob/master/Documentation/user-guides/alerting.md
4.2.2. Configuring custom alerts
You can add custom alerts to the PrometheusRule object that you created in Section 4.2.1, “Creating an alert rule in Prometheus”.
Procedure
Use the
oc editcommand:oc edit prometheusrules prometheus-alarm-rules
- Edit the PrometheusRules manifest.
- Save and close.
Additional resources
For more information about configuring alerting rules, see https://prometheus.io/docs/prometheus/latest/configuration/alerting_rules/.
For more information about PrometheusRules objects, see https://github.com/coreos/prometheus-operator/blob/master/Documentation/user-guides/alerting.md
4.2.3. Creating an alert route in Alertmanager
Use Alertmanager to deliver alerts to an external system, such as email, IRC, or other notification channel. The Prometheus Operator manages the Alertmanager configuration as an Red Hat OpenShift Container Platform (OCP) secret. STF by default deploys a basic configuration that results in no receivers:
alertmanager.yaml: |-
  global:
    resolve_timeout: 5m
  route:
    group_by: ['job']
    group_wait: 30s
    group_interval: 5m
    repeat_interval: 12h
    receiver: 'null'
  receivers:
  - name: 'null'
To deploy a custom Alertmanager route with STF, an alertmanagerConfigManifest parameter must be passed to the Service Telemetry Operator that results in an updated secret, managed by the Prometheus Operator. For more information, see Section 4.1.2, “Overriding a managed manifest”.
Procedure
- Log in to Red Hat OpenShift Container Platform.
Change to the
service-telemetrynamespace:oc project service-telemetry
Edit the
ServiceTelemetryobject for your STF deploymentoc edit servicetelemetry stf-default
Add a new parameter,
alertmanagerConfigManifestand theSecretobject contents to define thealertmanager.yamlconfiguration for Alertmanager:NoteThis loads the default template that is already managed by Service Telemetry Operator. To validate the changes are populating correctly, change a value, return the
alertmanager-stf-defaultsecret, and verify that the new value is loaded into memory, for example, changing the valueglobal.resolve_timeoutfrom5mto10m.apiVersion: infra.watch/v1alpha1 kind: ServiceTelemetry metadata: name: stf-default namespace: service-telemetry spec: metricsEnabled: true alertmanagerConfigManifest: | apiVersion: v1 kind: Secret metadata: name: 'alertmanager-stf-default' namespace: 'service-telemetry' type: Opaque stringData: alertmanager.yaml: |- global: resolve_timeout: 10m route: group_by: ['job'] group_wait: 30s group_interval: 5m repeat_interval: 12h receiver: 'null' receivers: - name: 'null'Verify that the configuration was applied to the secret:
$ oc get secret alertmanager-stf-default -o go-template='{{index .data "alertmanager.yaml" | base64decode }}'

global:
  resolve_timeout: 10m
route:
  group_by: ['job']
  group_wait: 30s
  group_interval: 5m
  repeat_interval: 12h
  receiver: 'null'
receivers:
- name: 'null'
To verify the configuration has been loaded into Alertmanager, create a pod with access to
curl:oc run curl --generator=run-pod/v1 --image=radial/busyboxplus:curl -i --tty
Run
curlagainst thealertmanager-operatedservice to retrieve the status andconfigYAMLcontents and review the supplied configuration matches the configuration loaded into Alertmanager:[ root@curl:/ ]$ curl alertmanager-operated:9093/api/v1/status {"status":"success","data":{"configYAML":"global:\n resolve_timeout: 10m\n http_config: {}\n smtp_hello: localhost\n smtp_require_tls: true\n pagerduty_url: https://events.pagerduty.com/v2/enqueue\n hipchat_api_url: https://api.hipchat.com/\n opsgenie_api_url: https://api.opsgenie.com/\n wechat_api_url: https://qyapi.weixin.qq.com/cgi-bin/\n victorops_api_url: https://alert.victorops.com/integrations/generic/20131114/alert/\nroute:\n receiver: \"null\"\n group_by:\n - job\n group_wait: 30s\n group_interval: 5m\n repeat_interval: 12h\nreceivers:\n- name: \"null\"\ntemplates: []\n",...}}Verify that the
configYAMLfield contains the expected changes. Exit from the pod:[ root@curl:/ ]$ exit
To clean up the environment, delete the
curlpod:$ oc delete pod curl pod "curl" deleted
Additional resources
For more information about the Red Hat OpenShift Container Platform secret and the Prometheus operator, see https://github.com/coreos/prometheus-operator/blob/master/Documentation/user-guides/alerting.md
4.3. High availability
High availability is the ability of Service Telemetry Framework (STF) to rapidly recover from failures in its component services. Although Red Hat OpenShift Container Platform (OCP) restarts a failed pod if nodes are available to schedule the workload, this recovery process might take more than one minute, during which time events and metrics are lost. A high availability configuration includes multiple copies of STF components, reducing recovery time to approximately 2 seconds. To protect against failure of an OCP node, deploy STF to an OCP cluster with three or more nodes.
STF is not yet a fully fault tolerant system. Delivery of metrics and events during the recovery period is not guaranteed.
Enabling high availability has the following effects:
- Two AMQ Interconnect pods run instead of the default 1.
- Three ElasticSearch pods run instead of the default 1.
- Recovery time from a lost pod in either of these services reduces to approximately 2 seconds.
4.3.1. Configuring high availability
To configure STF for high availability, add highAvailabilityEnabled: true to the ServiceTelemetry object in OCP. You can this set this parameter at installation time or, if you already deployed STF, complete the following steps:
Procedure
- Log in to Red Hat OpenShift Container Platform.
Change to the
service-telemetrynamespace:oc project service-telemetry
Use the oc command to edit the ServiceTelemetry object:
$ oc edit ServiceTelemetry
Add
highAvailabilityEnabled: trueto thespecsection:spec: eventsEnabled: true metricsEnabled: true highAvailabilityEnabled: true
- Save your changes and close the object.
4.4. Dashboards
Use third-party application Grafana to visualize system-level metrics gathered by collectd for each individual host node. For more information about configuring collectd, see Section 3.3, “Configuring Red Hat OpenStack Platform overcloud for Service Telemetry Framework”.
4.4.1. Setting up Grafana to host the dashboard
Grafana is not included in the default Service Telemetry Framework (STF) deployment so you must deploy the Grafana Operator from OperatorHub.io.
Procedure
- Log in to Red Hat OpenShift Container Platform.
Change to the
service-telemetrynamespace:oc project service-telemetry
Clone the dashboard repository.
git clone https://github.com/infrawatch/dashboards
cd dashboards
Deploy the Grafana operator:
oc create -f deploy/subscription.yaml
To verify that the operator launched successfully, run the
oc get csvcommand. If the value of the PHASE column is Succeeded, the operator launched successfully:$ oc get csv NAME DISPLAY VERSION REPLACES PHASE grafana-operator.v3.2.0 Grafana Operator 3.2.0 Succeeded ...
Launch a Grafana instance:
$ oc create -f deploy/grafana.yaml
Verify that the Grafana instance deployed:
$ oc get pod -l app=grafana

NAME                                  READY   STATUS    RESTARTS   AGE
grafana-deployment-7fc7848b56-sbkhv   1/1     Running   0          1m
Create the datasource and dashboard resources:
oc create -f deploy/datasource.yaml \
    -f deploy/rhos-dashboard.yaml
Verify that the resources installed correctly:
$ oc get grafanadashboards

NAME             AGE
rhos-dashboard   7d21h

$ oc get grafanadatasources
NAME                                  AGE
service-telemetry-grafanadatasource   1m
Navigate to https://<grafana-route-address> in a web browser. Use the
oc get routescommand to retrieve the Grafana route address:oc get routes
- To view the dashboard, click Dashboards and Manage.
Additional resources
- For more information about enabling the OperatorHub.io catalog source, see Section 2.3.5, “Enabling the OperatorHub.io Community Catalog Source”.
4.4.1.1. Viewing and editing queries
Procedure
-
Log in to Red Hat OpenShift Container Platform. To view and edit queries, log in as the
adminuser. Change to the
service-telemetrynamespace:oc project service-telemetry
To retrieve the default username and password, describe the Grafana object using
oc describe:oc describe grafana service-telemetry-grafana
4.4.2. The Grafana infrastructure dashboard
The infrastructure dashboard shows metrics for a single node at a time. Select a node from the upper left corner of the dashboard.
4.4.2.1. Top panels
| Title | Unit | Description |
| Current Global Alerts | - | Current alerts fired by Prometheus |
| Recent Global Alerts | - | Recently fired alerts in 5m time steps |
| Status Panel | - | Node status: up, down, unavailable |
| Uptime | s/m/h/d/M/Y | Total operational time of node |
| CPU Cores | cores | Total number of cores |
| Memory | bytes | Total memory |
| Disk Size | bytes | Total storage size |
| Processes | processes | Total number of processes listed by type |
| Load Average | processes | Load average represents the average number of running and uninterruptible processes residing in the kernel execution queue. |
4.4.2.2. Networking panels
Panels that display the network interfaces of the node.
| Panel | Unit | Description |
| Physical Interfaces Ingress Errors | errors | Total errors with incoming data |
| Physical Interfaces Egress Errors | errors | Total errors with outgoing data |
| Physical Interfaces Ingress Error Rates | errors/s | Rate of incoming data errors |
| Physical Interfaces egress Error Rates | errors/s | Rate of outgoing data errors |
| Physical Interfaces Packets Ingress pps Incoming packets per second | Physical Interfaces Packets Egress | pps |
| Outgoing packets per second | Physical Interfaces Data Ingress | bytes/s |
| Incoming data rates | Physical Interfaces Data Egress | bytes/s |
| Outgoing data rates | Physical Interfaces Drop Rate Ingress | pps |
| Incoming packets drop rate | Physical Interfaces Drop Rate Egress | pps |
4.4.2.3. CPU panels
Panels that display CPU usage of the node.
| Panel | Unit | Description |
|---|---|---|
| Current CPU Usage | percent | Instantaneous usage at the time of the last query. |
| Aggregate CPU Usage | percent | Average non-idle CPU activity of all cores on a node. |
| Aggr. CPU Usage by Type | percent | Shows time spent for each type of thread averaged across all cores. |
4.4.2.4. Memory panels
Panels that display memory usage on the node.
| Panel | Unit | Description |
|---|---|---|
| Memory Used | percent | Amount of memory being used at time of last query. |
| Huge Pages Used | hugepages | Number of hugepages being used. Memory |
4.4.2.5. Disk/file system
Panels that display space used on disk.
| Panel | Unit | Description | Notes |
|---|---|---|---|
| Disk Space Usage | percent | Total disk use at time of last query. | |
| Inode Usage | percent | Total inode use at time of last query. | |
| Aggregate Disk Space Usage | bytes | Total disk space used and reserved. |
Because this query relies on the |
| Disk Traffic | bytes/s | Shows rates for both reading and writing. | |
| Disk Load | percent | Approximate percentage of total disk bandwidth being used. The weighted I/O time series includes the backlog that might be accumulating. For more information, see the collectd disk plugin docs. | |
| Operations/s | ops/s | Operations done per second | |
| Average I/O Operation Time | seconds | Average time each I/O operation took to complete. This average is not accurate, see the collectd disk plugin docs. |
4.5. Configuring multiple clouds
You can configure multiple Red Hat OpenStack Platform clouds to target a single instance of Service Telemetry Framework (STF):
- Plan the AMQP address prefixes that you want to use for each cloud. For more information, see Section 4.5.1, “Planning AMQP address prefixes”.
- Deploy metrics and events consumer Smart Gateways for each cloud to listen on the corresponding address prefixes. For more information, see Section 4.5.2, “Deploying Smart Gateways”.
- Configure each cloud to send its metrics and events to STF on the correct address. For more information, see Section 4.5.3, “Creating the OpenStack environment file”.
Figure 4.1. Two Red Hat OpenStack Platform clouds connect to STF
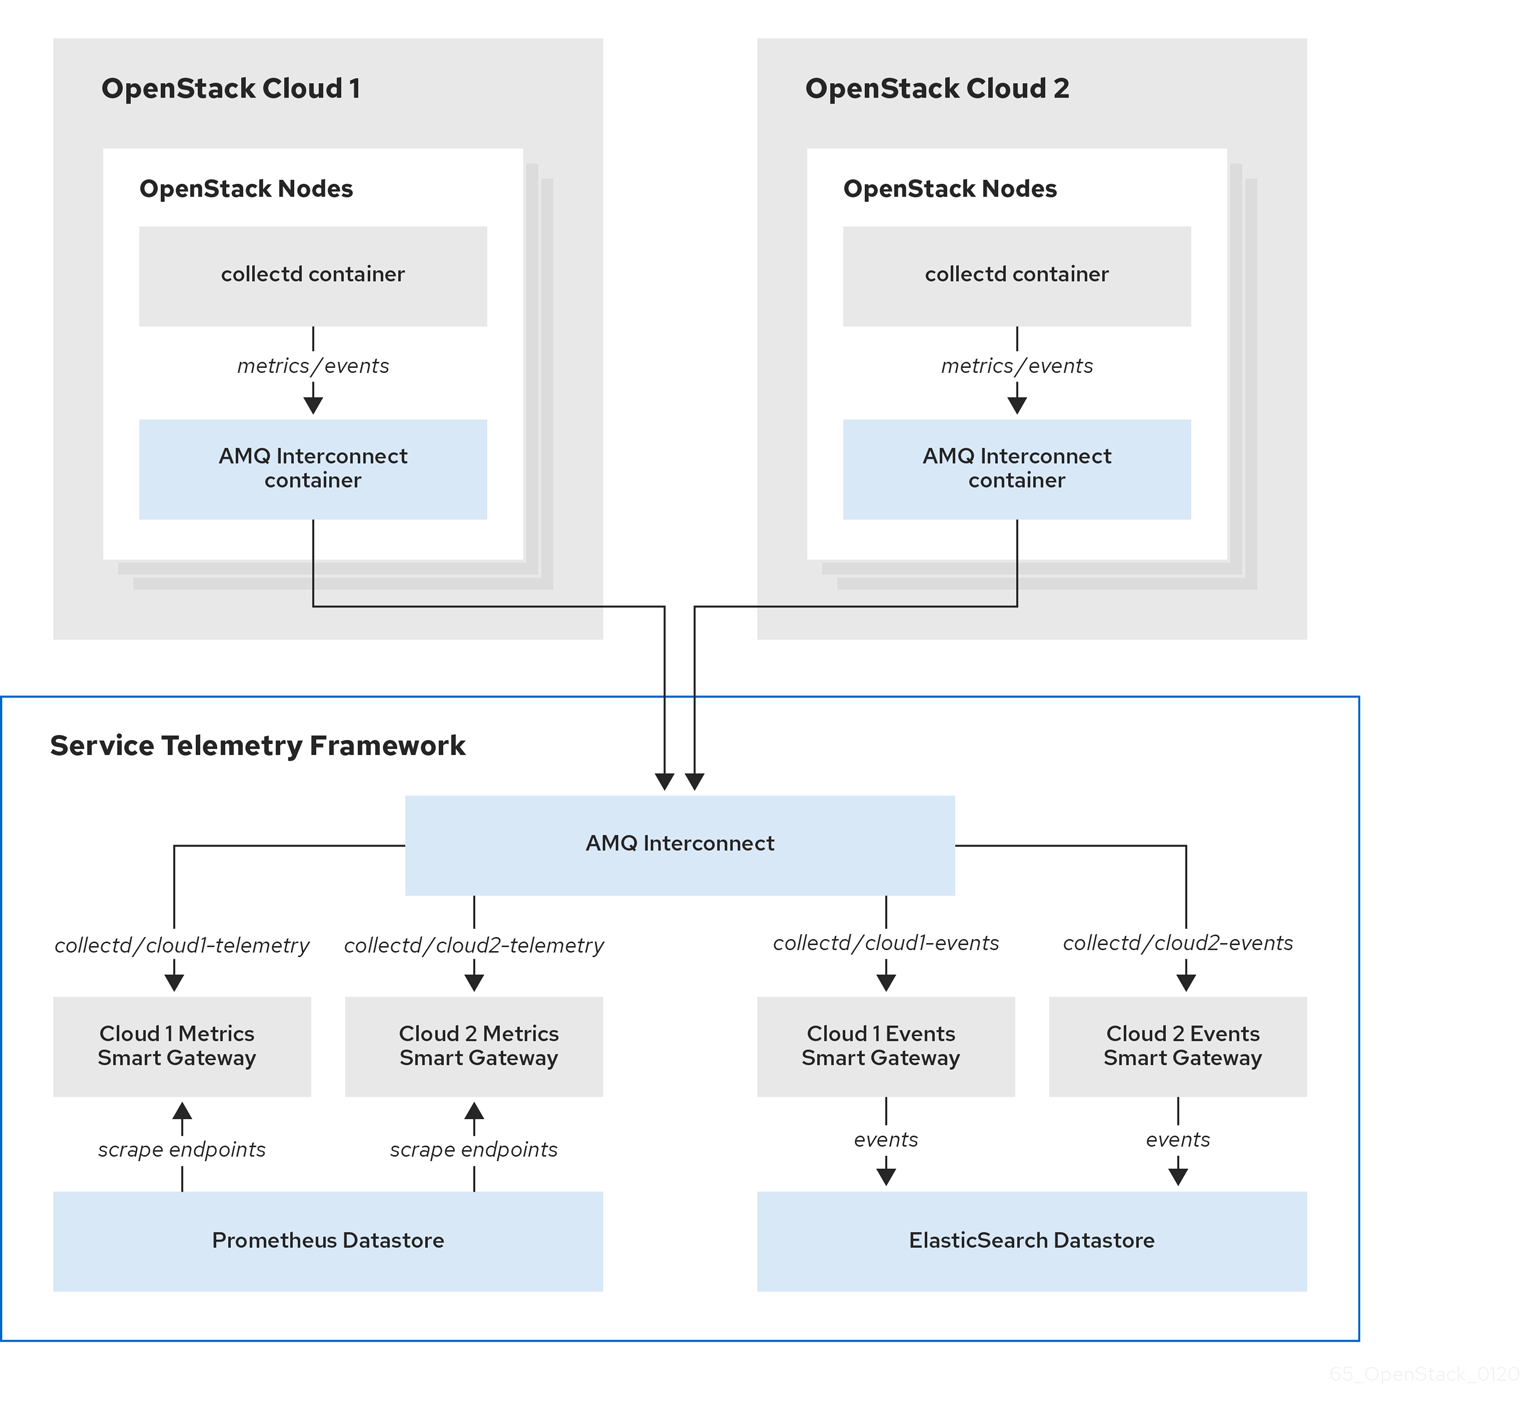
4.5.1. Planning AMQP address prefixes
By default, Red Hat OpenStack Platform nodes get data through two data collectors; collectd and Ceilometer. These components send telemetry data or notifications to the respective AMQP addresses, for example, collectd/telemetry, where STF Smart Gateways listen on those addresses for monitoring data.
To support multiple clouds and to identify which cloud generated the monitoring data, configure each cloud to send data to a unique address. Prefix a cloud identifier to the second part of the address. The following list shows some example addresses and identifiers:
-
collectd/cloud1-telemetry -
collectd/cloud1-notify -
anycast/ceilometer/cloud1-event.sample -
collectd/cloud2-telemetry -
collectd/cloud2-notify -
anycast/ceilometer/cloud2-event.sample -
collectd/us-east-1-telemetry -
collectd/us-west-3-telemetry
4.5.2. Deploying Smart Gateways
You must deploy a Smart Gateway for each of the data collection types for each cloud; one for collectd metrics, one for collectd events, and one for Ceilometer events. Configure each of the Smart Gateways to listen on the AMQP address that you define for the corresponding cloud.
When you deploy STF for the first time, Smart Gateway manifests are created that define the initial Smart Gateways for a single cloud. When deploying Smart Gateways for multiple cloud support, you deploy multiple Smart Gateways for each of the data collection types that handle the metrics and the events data for each cloud. The initial Smart Gateways act as a template to create additional Smart Gateways, along with any authentication information required to connect to the data stores.
Procedure
- Log in to Red Hat OpenShift Container Platform.
Change to the
service-telemetrynamespace:oc project service-telemetry
Use the initially deployed Smart Gateways as a template for additional Smart Gateways. List the currently deployed Smart Gateways with the
oc get smartgatewayscommand. For example, if you deployed STF withmetricsEnabled: trueandeventsEnabled: true, the following Smart Gateways are displayed in the output:$ oc get smartgateways NAME AGE stf-default-ceilometer-notification 14d stf-default-collectd-notification 14d stf-default-collectd-telemetry 14d
Retrieve the manifests for each Smart Gateway and store the contents in a temporary file, which you can modify later and use to create the new set of Smart Gateways:
truncate --size 0 /tmp/cloud1-smartgateways.yaml && \ for sg in $(oc get smartgateways -oname) do echo "---" >> /tmp/cloud1-smartgateways.yaml oc get ${sg} -oyaml --export >> /tmp/cloud1-smartgateways.yaml done-
Modify the Smart Gateway manifest in the
/tmp/cloud1-smartgateways.yamlfile. Adjust themetadata.nameandspec.amqpUrlfields to include the cloud identifier from your schema. For more information, see ]. To view example Smart Gateway manifests, see <<example-manifests_advanced-features[. Deploy your new Smart Gateways:
oc apply -f /tmp/cloud1-smartgateways.yaml
Verify that each Smart Gateway is running. This can take several minutes depending on the number of Smart Gateways:
oc get po -l app=smart-gateway
4.5.2.1. Example manifests
The content in the following examples might be different to the file content in your deployment. Copy the manifests in your deployment.
Ensure that the name and amqpUrl parameters of each Smart Gateway match the names that you want to use for your clouds. For more information, see Section 4.5.1, “Planning AMQP address prefixes”.
Your output may have some additional metadata parameters that you can remove from the manifests you that load into OCP.
apiVersion: smartgateway.infra.watch/v2alpha1
kind: SmartGateway
metadata:
  name: stf-default-ceilometer-notification-cloud1  1
spec:
  amqpDataSource: ceilometer
  amqpUrl: stf-default-interconnect.service-telemetry.svc.cluster.local:5672/anycast/ceilometer/cloud1-event.sample  2
  debug: false
  elasticPass: fkzfhghw......
  elasticUrl: https://elasticsearch-es-http.service-telemetry.svc.cluster.local:9200
  elasticUser: elastic
  resetIndex: false
  serviceType: events
  size: 1
  tlsCaCert: /config/certs/ca.crt
  tlsClientCert: /config/certs/tls.crt
  tlsClientKey: /config/certs/tls.key
  tlsServerName: elasticsearch-es-http.service-telemetry.svc.cluster.local
  useBasicAuth: true
  useTls: true
---
apiVersion: smartgateway.infra.watch/v2alpha1
kind: SmartGateway
metadata:
  name: stf-default-collectd-notification-cloud1  3
spec:
  amqpDataSource: collectd
  amqpUrl: stf-default-interconnect.service-telemetry.svc.cluster.local:5672/collectd/cloud1-notify  4
  debug: false
  elasticPass: fkzfhghw......
  elasticUrl: https://elasticsearch-es-http.service-telemetry.svc.cluster.local:9200
  elasticUser: elastic
  resetIndex: false
  serviceType: events
  size: 1
  tlsCaCert: /config/certs/ca.crt
  tlsClientCert: /config/certs/tls.crt
  tlsClientKey: /config/certs/tls.key
  tlsServerName: elasticsearch-es-http.service-telemetry.svc.cluster.local
  useBasicAuth: true
  useTls: true
---
apiVersion: smartgateway.infra.watch/v2alpha1
kind: SmartGateway
metadata:
  name: stf-default-collectd-telemetry-cloud1 5
spec:
  amqpUrl: stf-default-interconnect.service-telemetry.svc.cluster.local:5672/collectd/cloud1-telemetry  6
  debug: false
  prefetch: 15000
  serviceType: metrics
  size: 1
  useTimestamp: true
4.5.3. Creating the OpenStack environment file
To label traffic according to the cloud of origin, you must create a configuration with cloud-specific instance names. Create an stf-connectors.yaml file and adjust the values of CeilometerQdrEventsConfig and CollectdAmqpInstances to match the AMQP address prefix scheme. For more information, see Section 4.5.1, “Planning AMQP address prefixes”.
Remove enable-stf.yaml and ceilometer-write-qdr.yaml environment file references from your overcloud deployment. This configuration is redundant and results in duplicate information being sent from each cloud node.
Procedure
-
Create the
stf-connectors.yamlfile and modify it to match the AMQP address that you want for this cloud deployment:
resource_registry:
    OS::TripleO::Services::Collectd: /usr/share/openstack-tripleo-heat-templates/deployment/metrics/collectd-container-puppet.yaml
    OS::TripleO::Services::MetricsQdr: /usr/share/openstack-tripleo-heat-templates/deployment/metrics/qdr-container-puppet.yaml
    OS::TripleO::Services::CeilometerAgentCentral: /usr/share/openstack-tripleo-heat-templates/deployment/ceilometer/ceilometer-agent-central-container-puppet.yaml
    OS::TripleO::Services::CeilometerAgentNotification: /usr/share/openstack-tripleo-heat-templates/deployment/ceilometer/ceilometer-agent-notification-container-puppet.yaml
    OS::TripleO::Services::CeilometerAgentIpmi: /usr/share/openstack-tripleo-heat-templates/deployment/ceilometer/ceilometer-agent-ipmi-container-puppet.yaml
    OS::TripleO::Services::ComputeCeilometerAgent: /usr/share/openstack-tripleo-heat-templates/deployment/ceilometer/ceilometer-agent-compute-container-puppet.yaml
    OS::TripleO::Services::Redis: /usr/share/openstack-tripleo-heat-templates/deployment/database/redis-pacemaker-puppet.yaml

parameter_defaults:
    EnableSTF: true

    EventPipelinePublishers: []
    CeilometerEnablePanko: false
    CeilometerQdrPublishEvents: true
    CeilometerQdrEventsConfig:
        driver: amqp
        topic: cloud1-event   1

    CollectdConnectionType: amqp1
    CollectdAmqpInterval: 5
    CollectdDefaultPollingInterval: 5

    CollectdAmqpInstances:
        cloud1-notify:        2
            notify: true
            format: JSON
            presettle: false
        cloud1-telemetry:     3
            format: JSON
            presettle: true

    MetricsQdrAddresses:
        - prefix: collectd
          distribution: multicast
        - prefix: anycast/ceilometer
          distribution: multicast

    MetricsQdrSSLProfiles:
        - name: sslProfile

    MetricsQdrConnectors:
        - host: stf-default-interconnect-5671-service-telemetry.apps.infra.watch   4
          port: 443
          role: edge
          verifyHostname: false
          sslProfile: sslProfile
+ <1> Define the topic for Ceilometer events. This value is the address format of anycast/ceilometer/cloud1-event.sample. <2> Define the topic for collectd events. This value is the format of collectd/cloud1-notify. <3> Define the topic for collectd metrics. This value is the format of collectd/cloud1-telemetry. <4> Adjust the MetricsQdrConnectors host to the address of the STF route.
-
Ensure that the naming convention in the
stf-connectors.yamlfile aligns with thespec.amqpUrlfield in the Smart Gateway configuration. For example, configure theCeilometerQdrEventsConfig.topicfield to a value ofcloud1-event. -
Save the file in a directory for custom environment files, for example
/home/stack/custom_templates/. Source the authentication file:
[stack@undercloud-0 ~]$ source stackrc

(undercloud) [stack@undercloud-0 ~]$
Include the
stf-connectors.yamlfile in theovercloud deploymentcommand, along with any other environment files relevant to your environment:(undercloud) [stack@undercloud-0 ~]$ openstack overcloud deploy \ --templates /usr/share/openstack-tripleo-heat-templates \ ... -e /home/stack/custom_templates/stf-connectors.yaml \ ...
Additional resources
For information about validating the deployment, see Section 3.3.3, “Validating client-side installation”.
4.5.4. Querying metrics data from multiple clouds
Data stored in Prometheus has a service label attached according to the Smart Gateway it was scraped from. You can use this label to query data from a specific cloud.
To query data from a specific cloud, use a Prometheus promql query that matches the associated service label; for example: collectd_uptime{service="stf-default-collectd-telemetry-cloud1-smartgateway"}.
4.6. Ephemeral storage
Use ephemeral storage to run Service Telemetry Framework (STF) without persistently storing data in your Red Hat OpenShift Container Platform (OCP) cluster. Ephemeral storage is not recommended in a production environment due to the volatility of the data in the platform when operating correctly and as designed. For example, restarting a pod or rescheduling the workload to another node results in the loss of any local data written since the pod started.
If you enable ephemeral storage in STF, the Service Telemetry Operator does not add the relevant storage sections to the data storage components manifests.
4.6.1. Configuring ephemeral storage
To configure STF for ephemeral storage, add storageEphemeralEnabled: true to the ServiceTelemetry object in OCP. You can add storageEphemeralEnabled: true at installation time or, if you already deployed STF, complete the following steps:
Procedure
- Log in to Red Hat OpenShift Container Platform.
Change to the
service-telemetrynamespace:oc project service-telemetry
Edit the ServiceTelemetry object:
$ oc edit ServiceTelemetry stf-default
Add the
storageEphemeralEnabled: trueparameter to thespecsection:spec: eventsEnabled: true metricsEnabled: true storageEphemeralEnabled: true
- Save your changes and close the object.
Appendix A. collectd plug-ins
This section contains a complete list of collectd plug-ins and configurations for Red Hat OpenStack Platform 16.0.
- collectd-aggregation
- collectd::plugin::aggregation::aggregators
- collectd::plugin::aggregation::interval
collectd-amqp1
- collectd-apache
- collectd::plugin::apache::instances (ex.: {localhost ⇒ {url ⇒ http://localhost/mod_status?auto}})
- collectd::plugin::apache::interval
collectd-apcups
- collectd-battery
- collectd::plugin::battery::values_percentage
- collectd::plugin::battery::report_degraded
- collectd::plugin::battery::query_state_fs
- collectd::plugin::battery::interval
- collectd-ceph
- collectd::plugin::ceph::daemons
- collectd::plugin::ceph::longrunavglatency
- collectd::plugin::ceph::convertspecialmetrictypes
- collectd-cgroups
- collectd::plugin::cgroups::ignore_selected
- collectd::plugin::cgroups::interval
- collectd-conntrack
- None
- collectd-contextswitch
- collectd::plugin::contextswitch::interval
- collectd-cpu
- collectd::plugin::cpu::reportbystate
- collectd::plugin::cpu::reportbycpu
- collectd::plugin::cpu::valuespercentage
- collectd::plugin::cpu::reportnumcpu
- collectd::plugin::cpu::reportgueststate
- collectd::plugin::cpu::subtractgueststate
- collectd::plugin::cpu::interval
- collectd-cpufreq
- None
collectd-cpusleep
- collectd-csv
- collectd::plugin::csv::datadir
- collectd::plugin::csv::storerates
- collectd::plugin::csv::interval
- collectd-df
- collectd::plugin::df::devices
- collectd::plugin::df::fstypes
- collectd::plugin::df::ignoreselected
- collectd::plugin::df::mountpoints
- collectd::plugin::df::reportbydevice
- collectd::plugin::df::reportinodes
- collectd::plugin::df::reportreserved
- collectd::plugin::df::valuesabsolute
- collectd::plugin::df::valuespercentage
- collectd::plugin::df::interval
- collectd-disk
- collectd::plugin::disk::disks
- collectd::plugin::disk::ignoreselected
- collectd::plugin::disk::udevnameattr
- collectd::plugin::disk::interval
- collectd-entropy
- collectd::plugin::entropy::interval
- collectd-ethstat
- collectd::plugin::ethstat::interfaces
- collectd::plugin::ethstat::maps
- collectd::plugin::ethstat::mappedonly
- collectd::plugin::ethstat::interval
- collectd-exec
- collectd::plugin::exec::commands
- collectd::plugin::exec::commands_defaults
- collectd::plugin::exec::globals
- collectd::plugin::exec::interval
- collectd-fhcount
- collectd::plugin::fhcount::valuesabsolute
- collectd::plugin::fhcount::valuespercentage
- collectd::plugin::fhcount::interval
- collectd-filecount
- collectd::plugin::filecount::directories
- collectd::plugin::filecount::interval
- collectd-fscache
- None
- collectd-hddtemp
- collectd::plugin::hddtemp::host
- collectd::plugin::hddtemp::port
- collectd::plugin::hddtemp::interval
- collectd-hugepages
- collectd::plugin::hugepages::report_per_node_hp
- collectd::plugin::hugepages::report_root_hp
- collectd::plugin::hugepages::values_pages
- collectd::plugin::hugepages::values_bytes
- collectd::plugin::hugepages::values_percentage
- collectd::plugin::hugepages::interval
collectd-intel_rdt
- collectd-interface
- collectd::plugin::interface::interfaces
- collectd::plugin::interface::ignoreselected
- collectd::plugin::interface::reportinactive
- Collectd::plugin::interface::interval
- collectd-ipc
- None
- collectd-ipmi
- collectd::plugin::ipmi::ignore_selected
- collectd::plugin::ipmi::notify_sensor_add
- collectd::plugin::ipmi::notify_sensor_remove
- collectd::plugin::ipmi::notify_sensor_not_present
- collectd::plugin::ipmi::sensors
- collectd::plugin::ipmi::interval
- collectd-irq
- collectd::plugin::irq::irqs
- collectd::plugin::irq::ignoreselected
- collectd::plugin::irq::interval
- collectd-load
- collectd::plugin::load::report_relative
- collectd::plugin::load::interval
- collectd-logfile
- collectd::plugin::logfile::log_level
- collectd::plugin::logfile::log_file
- collectd::plugin::logfile::log_timestamp
- collectd::plugin::logfile::print_severity
- collectd::plugin::logfile::interval
collectd-madwifi
collectd-mbmon
collectd-md
- collectd-memcached
- collectd::plugin::memcached::instances
- collectd::plugin::memcached::interval
- collectd-memory
- collectd::plugin::memory::valuesabsolute
- collectd::plugin::memory::valuespercentage
- collectd::plugin::memory::interval collectd-multimeter
collectd-multimeter
- collectd-mysql
- collectd::plugin::mysql::interval
- collectd-netlink
- collectd::plugin::netlink::interfaces
- collectd::plugin::netlink::verboseinterfaces
- collectd::plugin::netlink::qdiscs
- collectd::plugin::netlink::classes
- collectd::plugin::netlink::filters
- collectd::plugin::netlink::ignoreselected
- collectd::plugin::netlink::interval
- collectd-network
- collectd::plugin::network::timetolive
- collectd::plugin::network::maxpacketsize
- collectd::plugin::network::forward
- collectd::plugin::network::reportstats
- collectd::plugin::network::listeners
- collectd::plugin::network::servers
- collectd::plugin::network::interval
- collectd-nfs
- collectd::plugin::nfs::interval
- collectd-ntpd
- collectd::plugin::ntpd::host
- collectd::plugin::ntpd::port
- collectd::plugin::ntpd::reverselookups
- collectd::plugin::ntpd::includeunitid
- collectd::plugin::ntpd::interval
- collectd-numa
- None
collectd-olsrd
- collectd-openvpn
- collectd::plugin::openvpn::statusfile
- collectd::plugin::openvpn::improvednamingschema
- collectd::plugin::openvpn::collectcompression
- collectd::plugin::openvpn::collectindividualusers
- collectd::plugin::openvpn::collectusercount
- collectd::plugin::openvpn::interval
- collectd-ovs_events
- collectd::plugin::ovs_events::address
- collectd::plugin::ovs_events::dispatch
- collectd::plugin::ovs_events::interfaces
- collectd::plugin::ovs_events::send_notification
- collectd::plugin::ovs_events::$port
- collectd::plugin::ovs_events::socket
- collectd-ovs_stats
- collectd::plugin::ovs_stats::address
- collectd::plugin::ovs_stats::bridges
- collectd::plugin::ovs_stats::port
- collectd::plugin::ovs_stats::socket
- collectd-ping
- collectd::plugin::ping::hosts
- collectd::plugin::ping::timeout
- collectd::plugin::ping::ttl
- collectd::plugin::ping::source_address
- collectd::plugin::ping::device
- collectd::plugin::ping::max_missed
- collectd::plugin::ping::size
- collectd::plugin::ping::interval
- collectd-powerdns
- collectd::plugin::powerdns::interval
- collectd::plugin::powerdns::servers
- collectd::plugin::powerdns::recursors
- collectd::plugin::powerdns::local_socket
- collectd::plugin::powerdns::interval
- collectd-processes
- collectd::plugin::processes::processes
- collectd::plugin::processes::process_matches
- collectd::plugin::processes::collect_context_switch
- collectd::plugin::processes::collect_file_descriptor
- collectd::plugin::processes::collect_memory_maps
- collectd::plugin::powerdns::interval
- collectd-protocols
- collectd::plugin::protocols::ignoreselected
- collectd::plugin::protocols::values
collectd-python
collectd-serial
- collectd-smart
- collectd::plugin::smart::disks
- collectd::plugin::smart::ignoreselected
- collectd::plugin::smart::interval
collectd-snmp_agent
- collectd-statsd
- collectd::plugin::statsd::host
- collectd::plugin::statsd::port
- collectd::plugin::statsd::deletecounters
- collectd::plugin::statsd::deletetimers
- collectd::plugin::statsd::deletegauges
- collectd::plugin::statsd::deletesets
- collectd::plugin::statsd::countersum
- collectd::plugin::statsd::timerpercentile
- collectd::plugin::statsd::timerlower
- collectd::plugin::statsd::timerupper
- collectd::plugin::statsd::timersum
- collectd::plugin::statsd::timercount
- collectd::plugin::statsd::interval
- collectd-swap
- collectd::plugin::swap::reportbydevice
- collectd::plugin::swap::reportbytes
- collectd::plugin::swap::valuesabsolute
- collectd::plugin::swap::valuespercentage
- collectd::plugin::swap::reportio
- collectd::plugin::swap::interval
- collectd-syslog
- collectd::plugin::syslog::log_level
- collectd::plugin::syslog::notify_level
- collectd::plugin::syslog::interval
- collectd-table
- collectd::plugin::table::tables
- collectd::plugin::table::interval
- collectd-tail
- collectd::plugin::tail::files
- collectd::plugin::tail::interval
- collectd-tail_csv
- collectd::plugin::tail_csv::metrics
- collectd::plugin::tail_csv::files
- collectd-tcpconns
- collectd::plugin::tcpconns::localports
- collectd::plugin::tcpconns::remoteports
- collectd::plugin::tcpconns::listening
- collectd::plugin::tcpconns::allportssummary
- collectd::plugin::tcpconns::interval
collectd-ted
- collectd-thermal
- collectd::plugin::thermal::devices
- collectd::plugin::thermal::ignoreselected
- collectd::plugin::thermal::interval
- collectd-threshold
- collectd::plugin::threshold::types
- collectd::plugin::threshold::plugins
- collectd::plugin::threshold::hosts
- collectd::plugin::threshold::interval
- collectd-turbostat
- collectd::plugin::turbostat::core_c_states
- collectd::plugin::turbostat::package_c_states
- collectd::plugin::turbostat::system_management_interrupt
- collectd::plugin::turbostat::digital_temperature_sensor
- collectd::plugin::turbostat::tcc_activation_temp
- collectd::plugin::turbostat::running_average_power_limit
- collectd::plugin::turbostat::logical_core_names
collectd-unixsock
- collectd-uptime
- collectd::plugin::uptime::interval
- collectd-users
- collectd::plugin::users::interval
- collectd-uuid
- collectd::plugin::uuid::uuid_file
- collectd::plugin::uuid::interval
- collectd-virt
- collectd::plugin::virt::connection
- collectd::plugin::virt::refresh_interval
- collectd::plugin::virt::domain
- collectd::plugin::virt::block_device
- collectd::plugin::virt::interface_device
- collectd::plugin::virt::ignore_selected
- collectd::plugin::virt::hostname_format
- collectd::plugin::virt::interface_format
- collectd::plugin::virt::extra_stats
- collectd::plugin::virt::interval
- collectd-vmem
- collectd::plugin::vmem::verbose
- collectd::plugin::vmem::interval
collectd-vserver
collectd-wireless
- collectd-write_graphite
- collectd::plugin::write_graphite::carbons
- collectd::plugin::write_graphite::carbon_defaults
- collectd::plugin::write_graphite::globals
- collectd-write_kafka
- collectd::plugin::write_kafka::kafka_host
- collectd::plugin::write_kafka::kafka_port
- collectd::plugin::write_kafka::kafka_hosts
- collectd::plugin::write_kafka::topics
- collectd-write_log
- collectd::plugin::write_log::format
- collectd-zfs_arc
- None