
Monitoring Tools Configuration Guide
A guide to OpenStack logging and monitoring tools
Abstract
Chapter 1. Introduction
Monitoring tools are an optional suite of tools designed to help operators maintain an OpenStack environment. The tools perform the following functions:
- Centralized logging: Allows you gather logs from all components in the OpenStack environment in one central location. You can identify problems across all nodes and services, and optionally, export the log data to Red Hat for assistance in diagnosing problems.
- Availability monitoring: Allows you to monitor all components in the OpenStack environment and determine if any components are currently experiencing outages or are otherwise not functional. You can also configure the system to alert you when problems are identified.
Chapter 2. Monitoring architecture
Monitoring tools use a client-server model with the client deployed onto the Red Hat OpenStack Platform overcloud nodes. The Rsyslog service provides client-side centralized logging (CL) and collectd with enabled sensubility plugin provides client-side availability monitoring (AM).
2.1. Centralized logging
In your Red Hat OpenStack Platform environment, collect the logs from all services in one central location to simplify debugging and administration. These logs come from the operating system, such as syslog and audit log files, infrastructure components such as RabbitMQ and MariaDB, and OpenStack services such as Identity, Compute, and others.
The centralized logging toolchain consists of the following components:
- Log Collection Agent (Rsyslog)
- Data Store (Elasticsearch)
- API/Presentation Layer (Kibana)
Red Hat OpenStack Platform director does not deploy the server-side components for centralized logging. Red Hat does not support the server-side components, including the Elasticsearch database and Kibana.
2.2. Availability monitoring
With availability monitoring, you have one central place to monitor the high-level functionality of all components across your entire OpenStack environment.
The availability monitoring toolchain consists of several components:
- Monitoring Agent (collectd with enabled sensubility plugin)
- Monitoring Relay/Proxy (RabbitMQ)
- Monitoring Controller/Server (Sensu server)
- API/Presentation Layer (Uchiwa)
Red Hat OpenStack Platform director does not deploy the server-side components for availability monitoring. Red Hat does not support the server-side components, including Uchiwa, Sensu Server, the Sensu API plus RabbitMQ, and a Redis instance running on a monitoring node.
The availability monitoring components and their interactions are laid out in the following diagrams:
Items shown in blue denote Red Hat-supported components.
Figure 2.1. Availability monitoring architecture at a high level
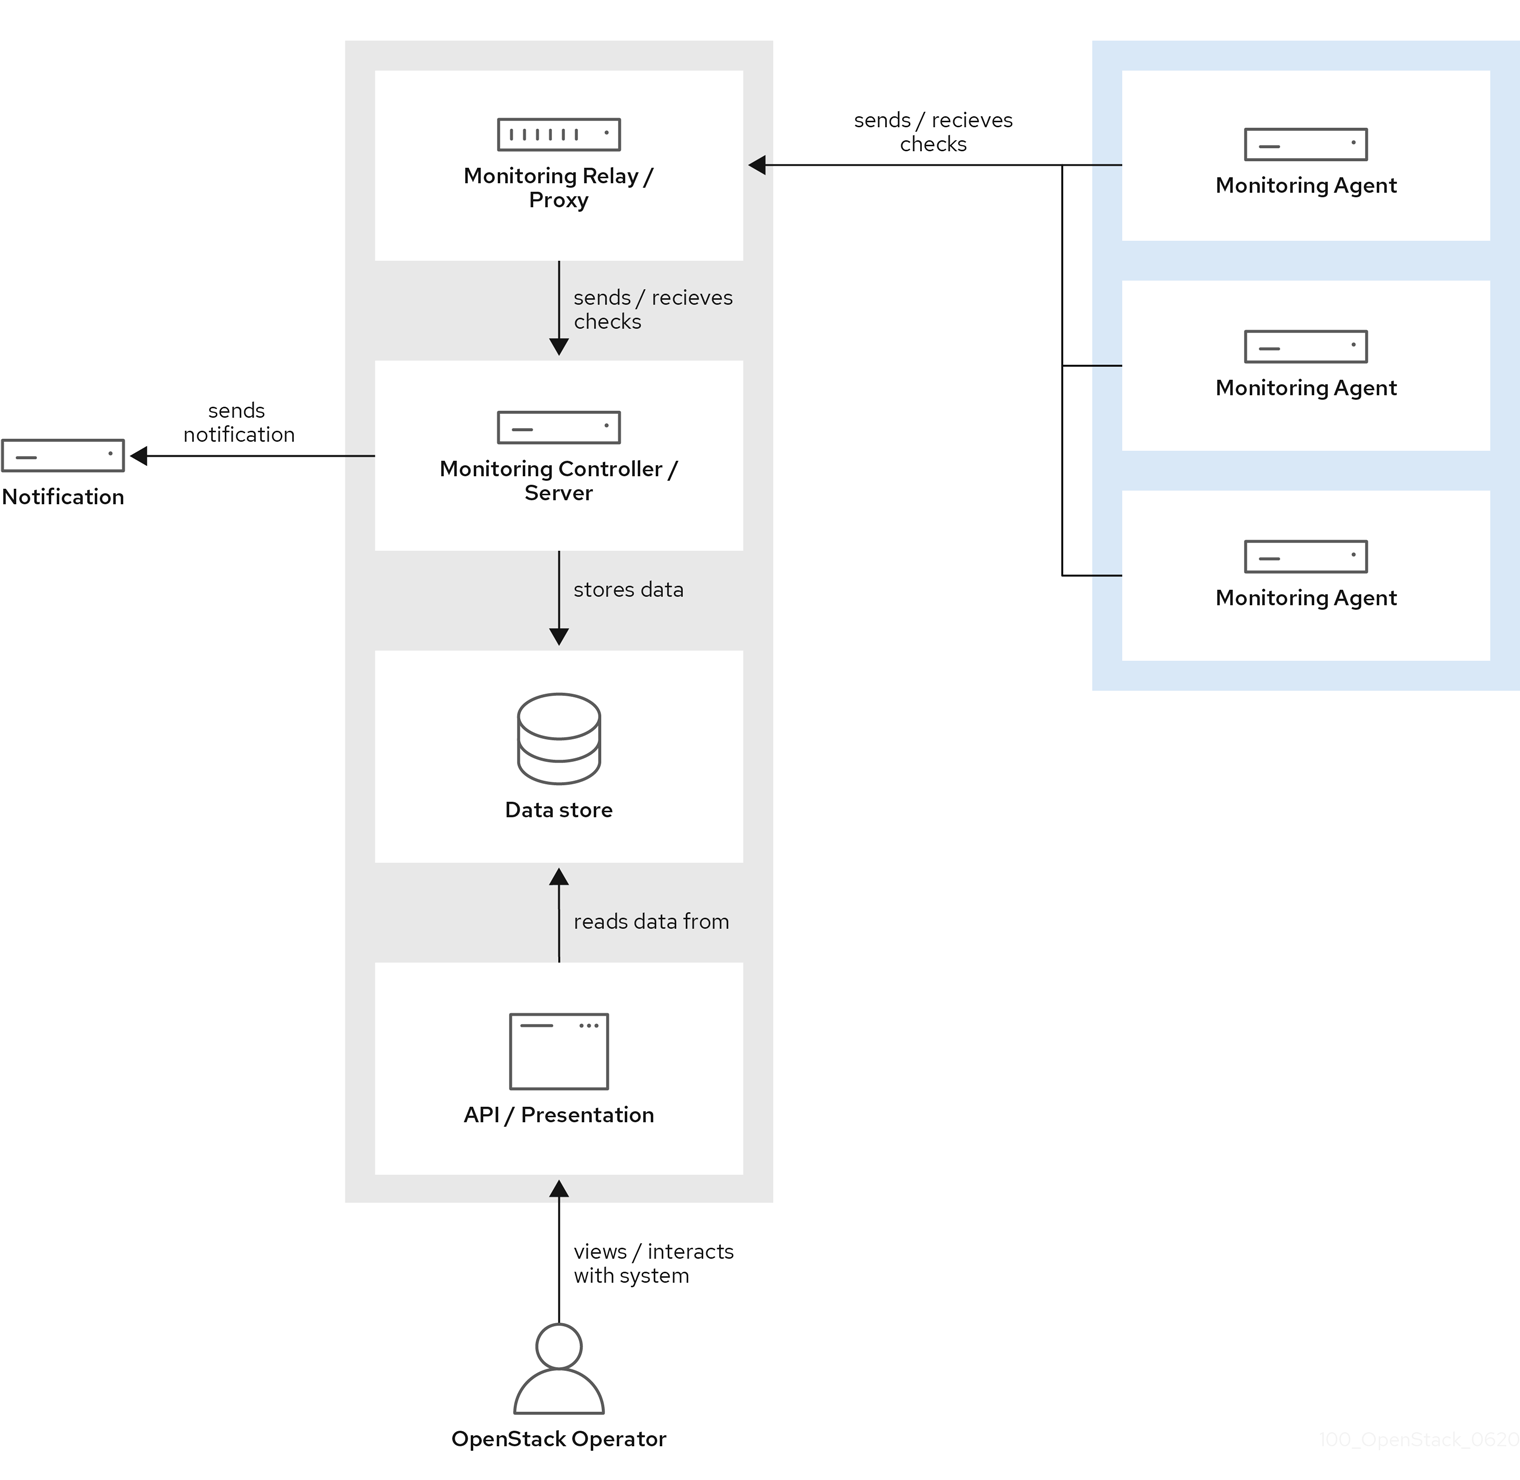
Figure 2.2. Single-node deployment for Red Hat OpenStack Platform
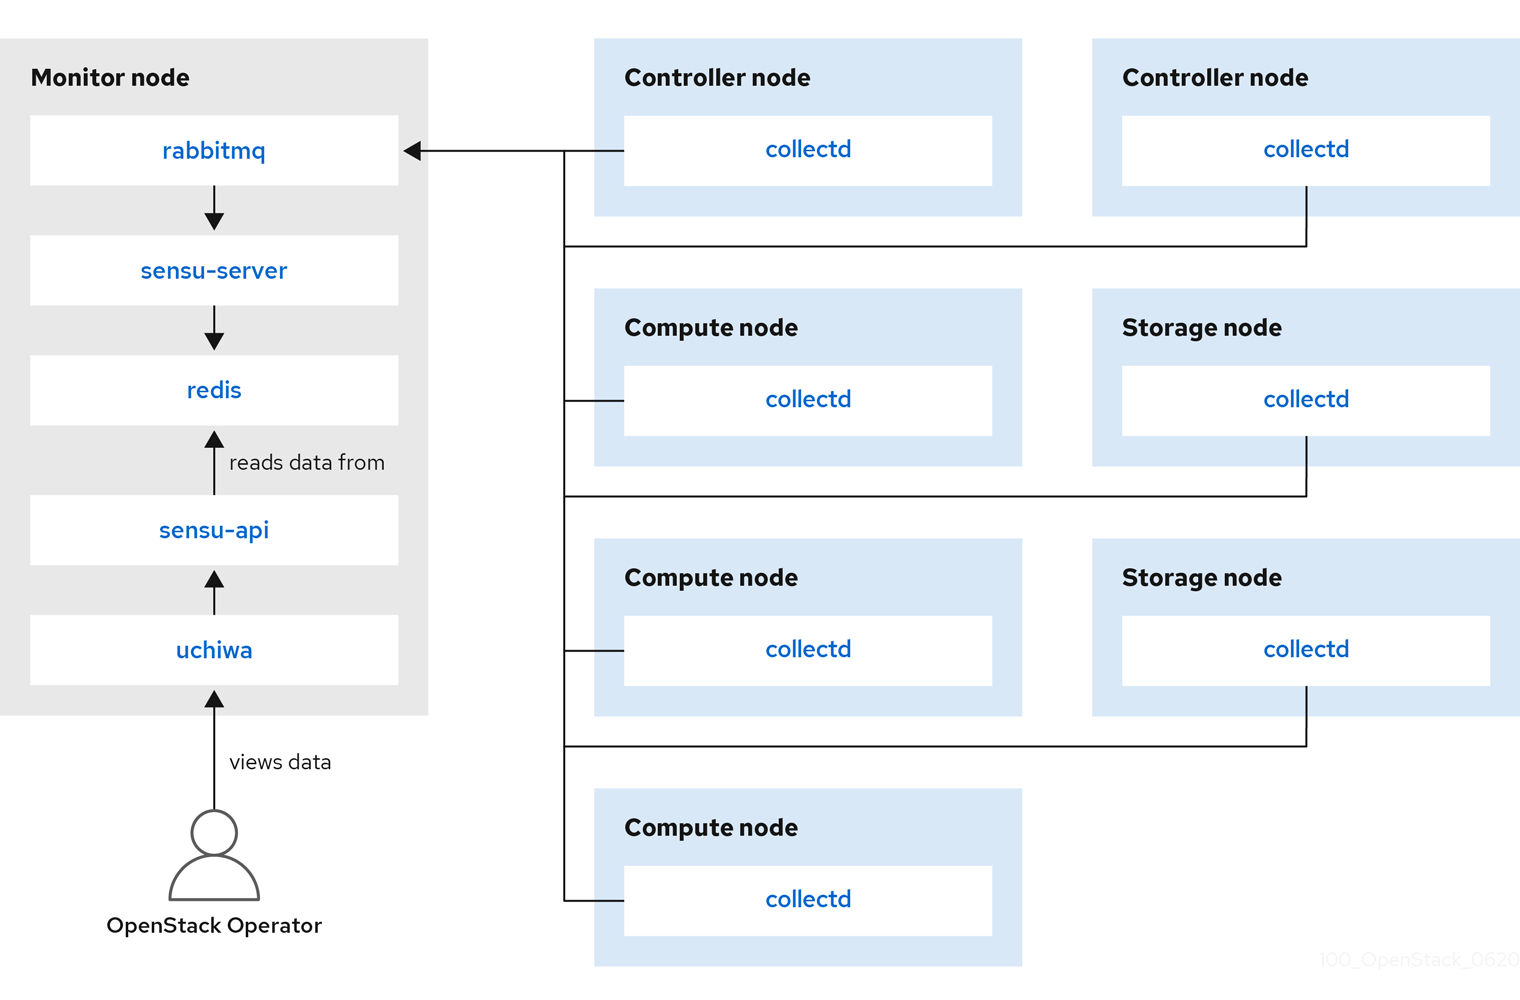
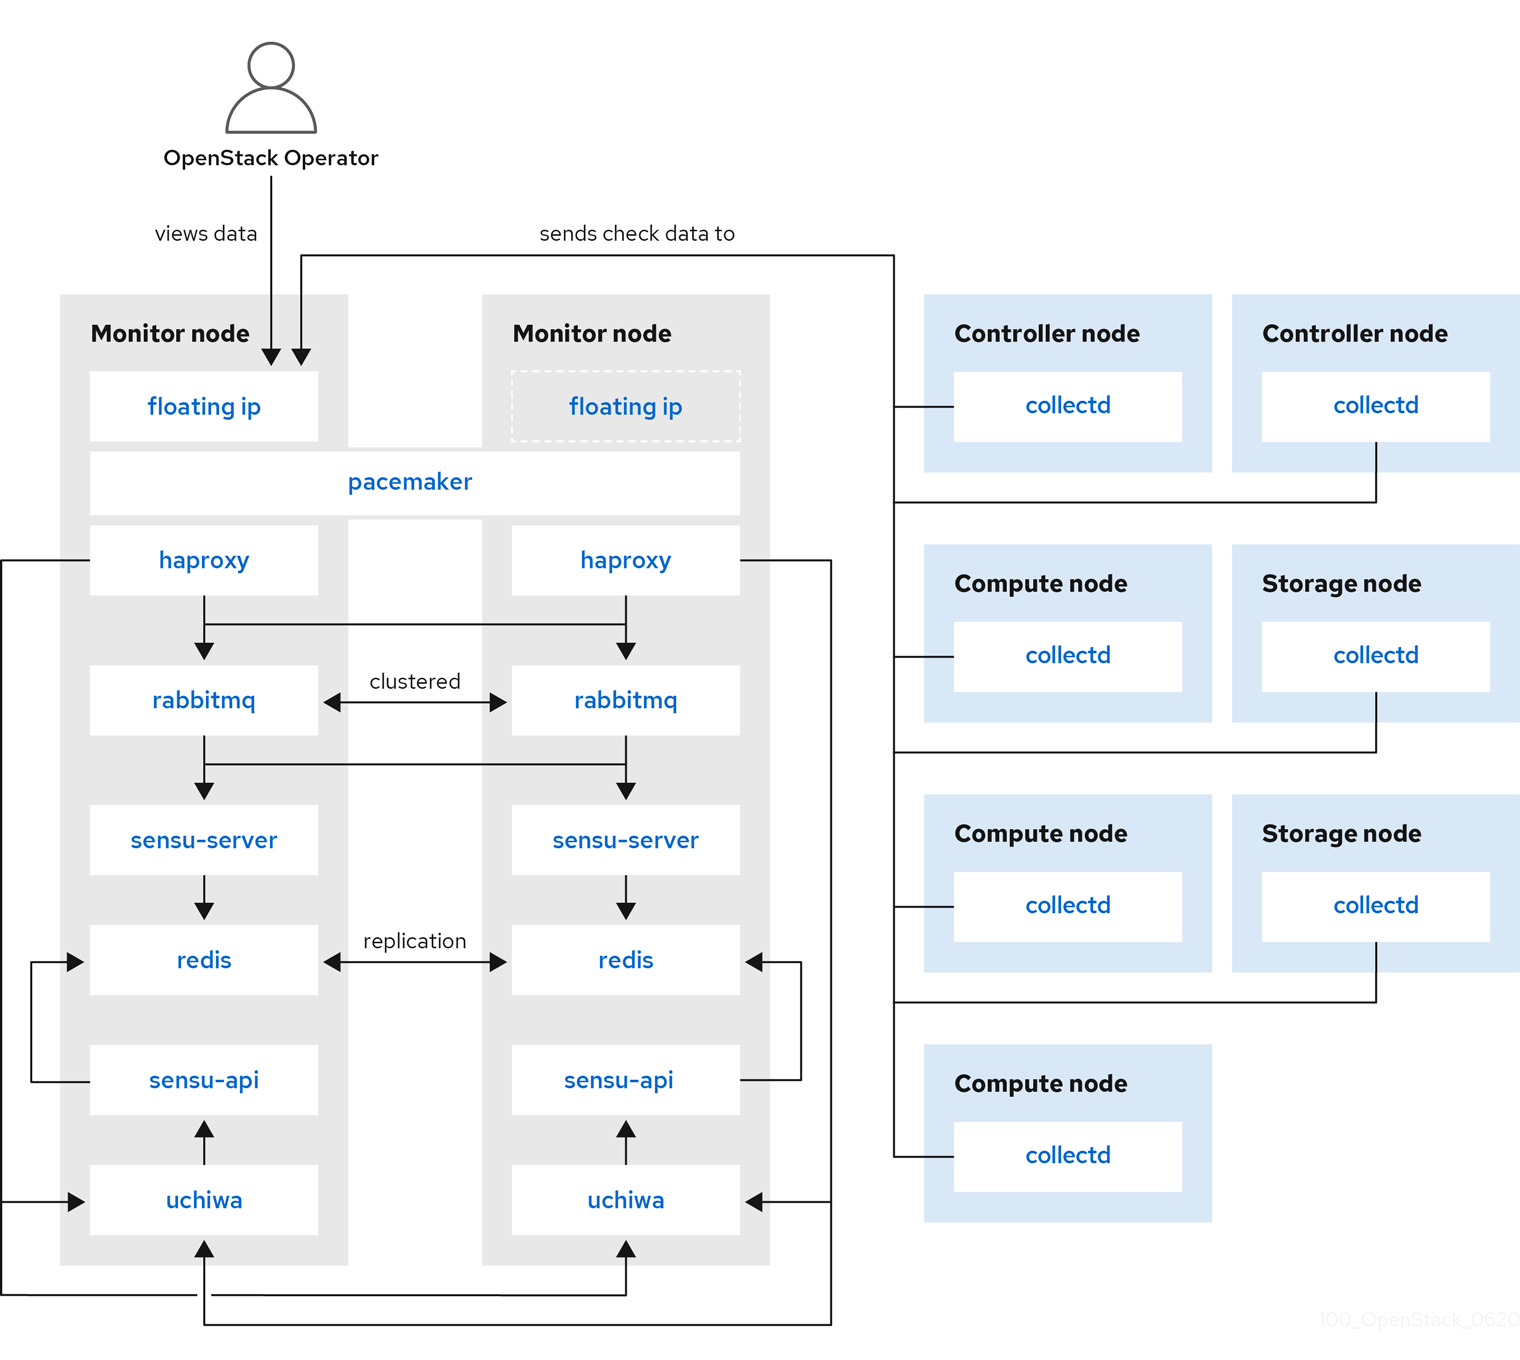
Figure 2.3. HA deployment for Red Hat OpenStack Platform
Chapter 3. Installing the client-side tools
Before you deploy the overcloud, you need to determine the configuration settings to apply to each client. Copy the example environment files from the heat template collection and modify the files to suit your environment.
3.1. Setting centralized logging client parameters
For more information, see Enabling centralized logging during deployment.
3.2. Setting monitoring client parameters
The monitoring solution collects system information periodically and provides a mechanism to store and monitor the values in a variety of ways using a data collecting agent. Red Hat supports collectd as a collection agent. Collectd-sensubility is an extention of collectd and communicates with Sensu server side through RabbitMQ. You can use Service Telemetry Framework (STF) to store the data, and in turn, monitor systems, find performance bottlenecks, and predict future system load. For more information, see the Service Telemetry Framework guide.
To configure collectd and collectd-sensubility, complete the following steps:
Create
config.yamlin your home directory, for example,/home/templates/custom, and configure theMetricsQdrConnectorsparameter to point to STF server side:MetricsQdrConnectors: - host: qdr-normal-sa-telemetry.apps.remote.tld port: 443 role: inter-router sslProfile: sslProfile verifyHostname: false MetricsQdrSSLProfiles: - name: sslProfileIn the
config.yamlfile, list the plug-ins you want underCollectdExtraPlugins. You can also provide parameters in theExtraConfigsection. By default, collectd comes with thecpu,df,disk,hugepages,interface,load,memory,processes,tcpconns,unixsock, anduptimeplug-ins. You can add additional plug-ins using theCollectdExtraPluginsparameter. You can also provide additional configuration information for theCollectdExtraPluginsusing theExtraConfigoption as shown. For example, to enable thevirtplug-in, and configure the connection string and the hostname format, use the following syntax:parameter_defaults: CollectdExtraPlugins: - disk - df - virt ExtraConfig: collectd::plugin::virt::connection: "qemu:///system" collectd::plugin::virt::hostname_format: "hostname uuid"NoteDo not remove the
unixsockplug-in. Removal results in the permanent marking of the collectd container as unhealthy.To enable collectd-sensubility, add the following environment configuration to the
config.yamlfile:parameter_defaults: CollectdEnableSensubility: true # Use this if there is restricted access for your checks by using the sudo command. # The rule will be created in /etc/sudoers.d for sensubility to enable it calling restricted commands via sensubility executor. CollectdSensubilityExecSudoRule: "collectd ALL = NOPASSWD: <some command or ALL for all commands>" # Connection URL to Sensu server side for reporting check results. CollectdSensubilityConnection: "amqp://sensu:sensu@<sensu server side IP>:5672//sensu" # Interval in seconds for sending keepalive messages to Sensu server side. CollectdSensubilityKeepaliveInterval: 20 # Path to temporary directory where the check scripts are created. CollectdSensubilityTmpDir: /var/tmp/collectd-sensubility-checks # Path to shell used for executing check scripts. CollectdSensubilityShellPath: /usr/bin/sh # To improve check execution rate use this parameter and value to change the number of goroutines spawned for executing check scripts. CollectdSensubilityWorkerCount: 2 # JSON-formatted definition of standalone checks to be scheduled on client side. If you need to schedule checks # on overcloud nodes instead of Sensu server, use this parameter. Configuration is compatible with Sensu check definition. # For more information, see https://docs.sensu.io/sensu-core/1.7/reference/checks/#check-definition-specification # There are some configuration options which sensubility ignores such as: extension, publish, cron, stdin, hooks. CollectdSensubilityChecks: example: command: "ping -c1 -W1 8.8.8.8" interval: 30 # The following parameters are used to modify standard, standalone checks for monitoring container health on overcloud nodes. # Do not modify these parameters. # CollectdEnableContainerHealthCheck: true # CollectdContainerHealthCheckCommand: <snip> # CollectdContainerHealthCheckInterval: 10 # The Sensu server side event handler to use for events created by the container health check. # CollectdContainerHealthCheckHandlers: # - handle-container-health-check # CollectdContainerHealthCheckOccurrences: 3 # CollectdContainerHealthCheckRefresh: 90Deploy the overcloud. Include
config.yaml,collectd-write-qdr.yaml, and one of theqdr-*.yamlfiles in your overcloud deploy command. For example:$ openstack overcloud deploy -e /home/templates/custom/config.yaml -e tripleo-heat-templates/environments/metrics/collectd-write-qdr.yaml -e tripleo-heat-templates/environments/metrics/qdr-form-controller-mesh.yaml
-
Optional: To enable overcloud RabbitMQ monitoring, include the
collectd-read-rabbitmq.yamlfile in your overcloud deploy command. For more information about the YAML files, see Section 3.3, “YAML files”.
3.3. YAML files
When you configure collectd, you can include the following YAML files in your overcloud deploy command:
-
collectd-read-rabbitmq.yaml: Enables python-collect-rabbitmq and configures it to monitor overcloud RabbitMQ instance. -
collectd-write-qdr.yaml: Enables collectd to send telemetry and notification data through QPID dispatch routers. -
qdr-edge-only.yaml: Enables deployment of QPID dispatch routers. Each overcloud node will have one local qdrouterd service running and operating in edge mode, for example, sending received data straight to defined MetricsQdrConnectors. -
qdr-form-controller-mesh.yaml: Enables deployment of QPID dispatch routers (QDR). Each overcloud node will have one local qdrouterd service running and forming a mesh topology. For example, QDRs running on controllers operate in interior router mode, with connections to defined MetricsQdrConnectors, and QDRs running on other node types connect in edge mode to the interior routers running on the controllers.
Chapter 4. Monitor the OpenStack Platform
See the Sensu documentation for further details about the Sensu stack infrastructure: https://docs.sensu.io/sensu-core/1.7/overview/architecture/
Red Hat supplies a set of check scripts in the osops-tools-monitoring-oschecks package. The majority of the check scripts only check the API connection to the OpenStack component. However, certain scripts also perform additional OpenStack resource tests for OpenStack Compute (nova), OpenStack Block Storage (cinder), OpenStack Image (glance), and OpenStack Networking (neutron). For example, the OpenStack Identity (keystone) API check returns the following result when keystone is running:
OK: Got a token, Keystone API is working.
Chapter 5. Validate the Sensu Client Installation
Check the status of the
sensu-clienton each overcloud node:# podman ps | grep sensu-client
-
Review the error log for any issues:
/var/log/containers/sensu/sensu-client.log -
Verify that each overcloud node has the
/var/lib/config-data/puppet-generated/sensu/etc/sensu/conf.d/rabbitmq.jsonfile that sets the IP address of the monitoring server.
Chapter 6. Review the State of a Node
If you have a deployment of the Uchiwa dashboard, you can use it with the Sensu server to review the state of your nodes:
Login to the Uchiwa dashboard and click the
Data Centertab to confirm that the Data Center is operational.http://<SERVER_IP_ADDRESS>/uchiwa
-
Check that all overcloud nodes are in a
Connectedstate. - At a suitable time, reboot one of the overcloud nodes and review the rebooted node’s status in the Uchiwa dashboard. After the reboot completes, verify that the node successfully re-connects to the Sensu server and starts executing checks.
Chapter 7. Review the State of an OpenStack Service
This example tests the monitoring of the openstack-ceilometer-central service.
Confirm that the
openstack-ceilometer-centralservice is running:docker ps -a | grep ceilometer
-
Connect to the Uchiwa dashboard and confirm that a successful
ceilometercheck is present and running as defined in theceilometerJSON file.