
Monitoring Tools Configuration Guide
A guide to OpenStack logging and monitoring tools
Abstract
Chapter 1. Introduction
Monitoring tools are an optional suite of tools designed to help operators maintain an OpenStack environment. The tools perform the following functions:
- Centralized logging: Allows you gather logs from all components in the OpenStack environment in one central location. You can identify problems across all nodes and services, and optionally, export the log data to Red Hat for assistance in diagnosing problems.
- Availability monitoring: Allows you to monitor all components in the OpenStack environment and determine if any components are currently experiencing outages or are otherwise not functional. You can also configure the system to alert you when problems are identified.
Chapter 2. Architecture
Monitoring tools use a client-server model with the client deployed onto the Red Hat OpenStack Platform overcloud nodes. The Fluentd service provides client-side centralized logging (CL) and the Sensu client service provides client-side availability monitoring (AM).
2.1. Centralized Logging
Centralized logging allows you to have one central place to view logs across your entire OpenStack environment. These logs come from the operating system, such as syslog and audit log files, infrastructure components such as RabbitMQ and MariaDB, and OpenStack services such as Identity, Compute, and others.
The centralized logging toolchain consists of a number of components, including:
- Log Collection Agent (Fluentd)
- Log Relay/Transformer (Fluentd)
- Data Store (Elasticsearch)
- API/Presentation Layer (Kibana)
The director does not deploy the server-side components for centralized logging. Red Hat does not support the server-side components, including the Elasticsearch database, Kibana, and Fluentd with plugins running as a log aggregator.
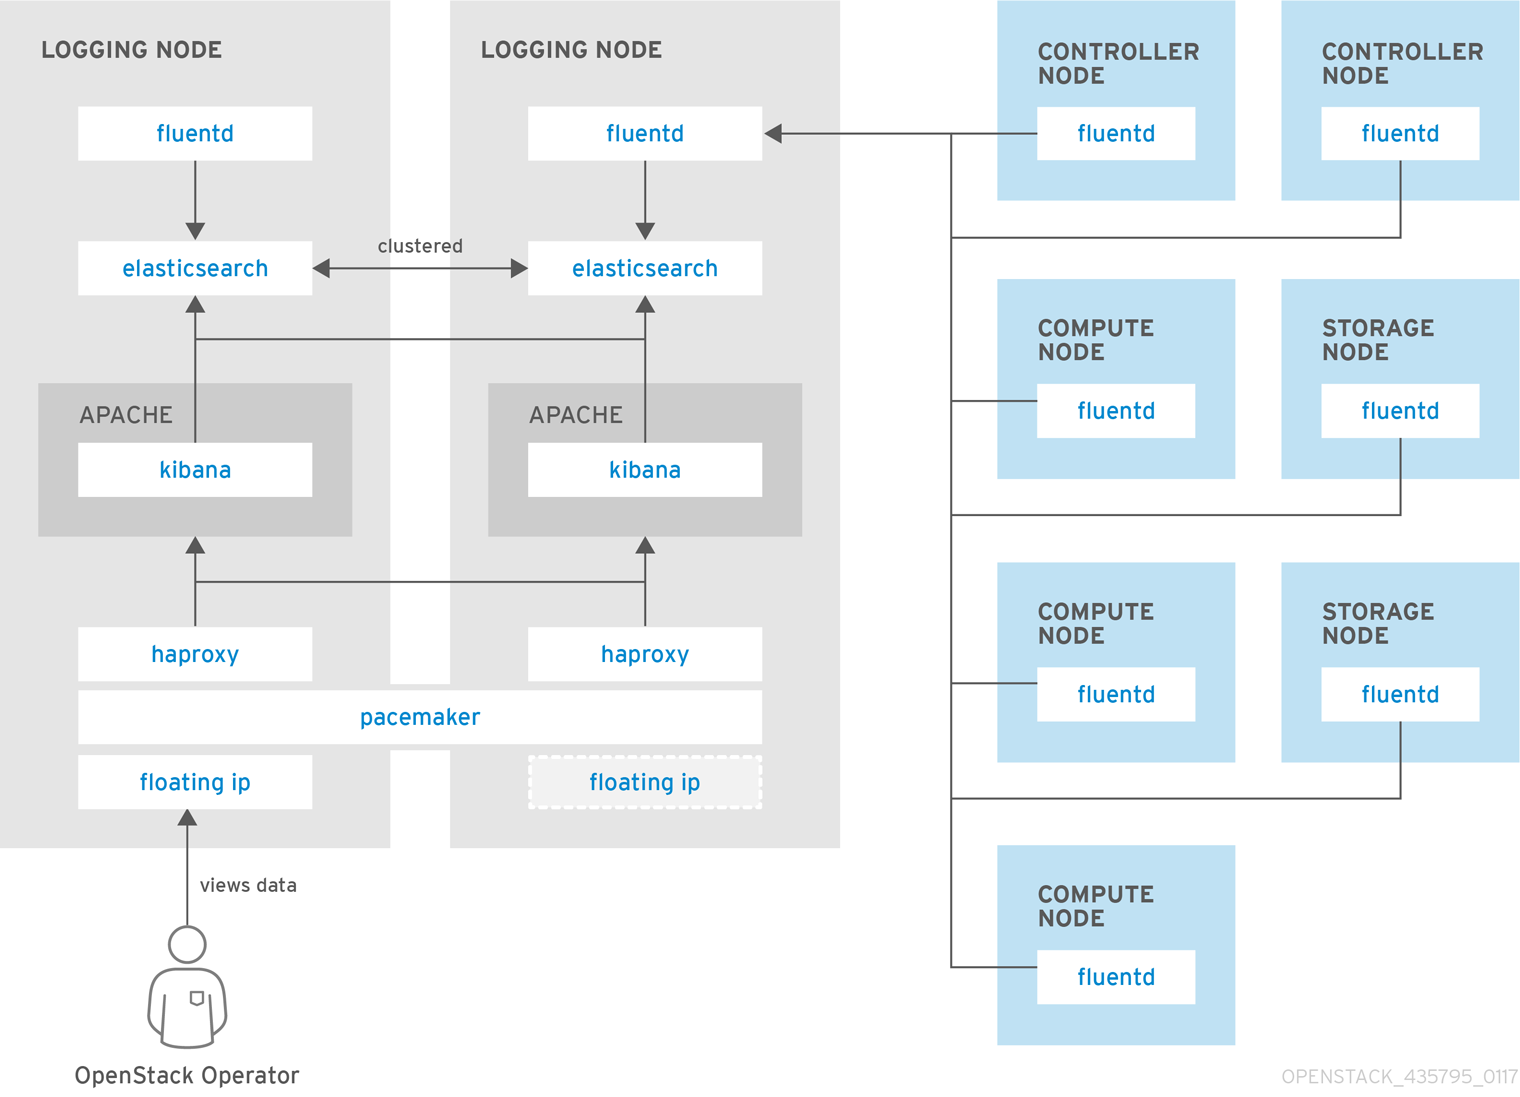
The centralized logging components and their interactions are laid out in the following diagrams:
Items shown in blue denote Red Hat-supported components.
Figure 2.1. Centralized logging architecture at a high level
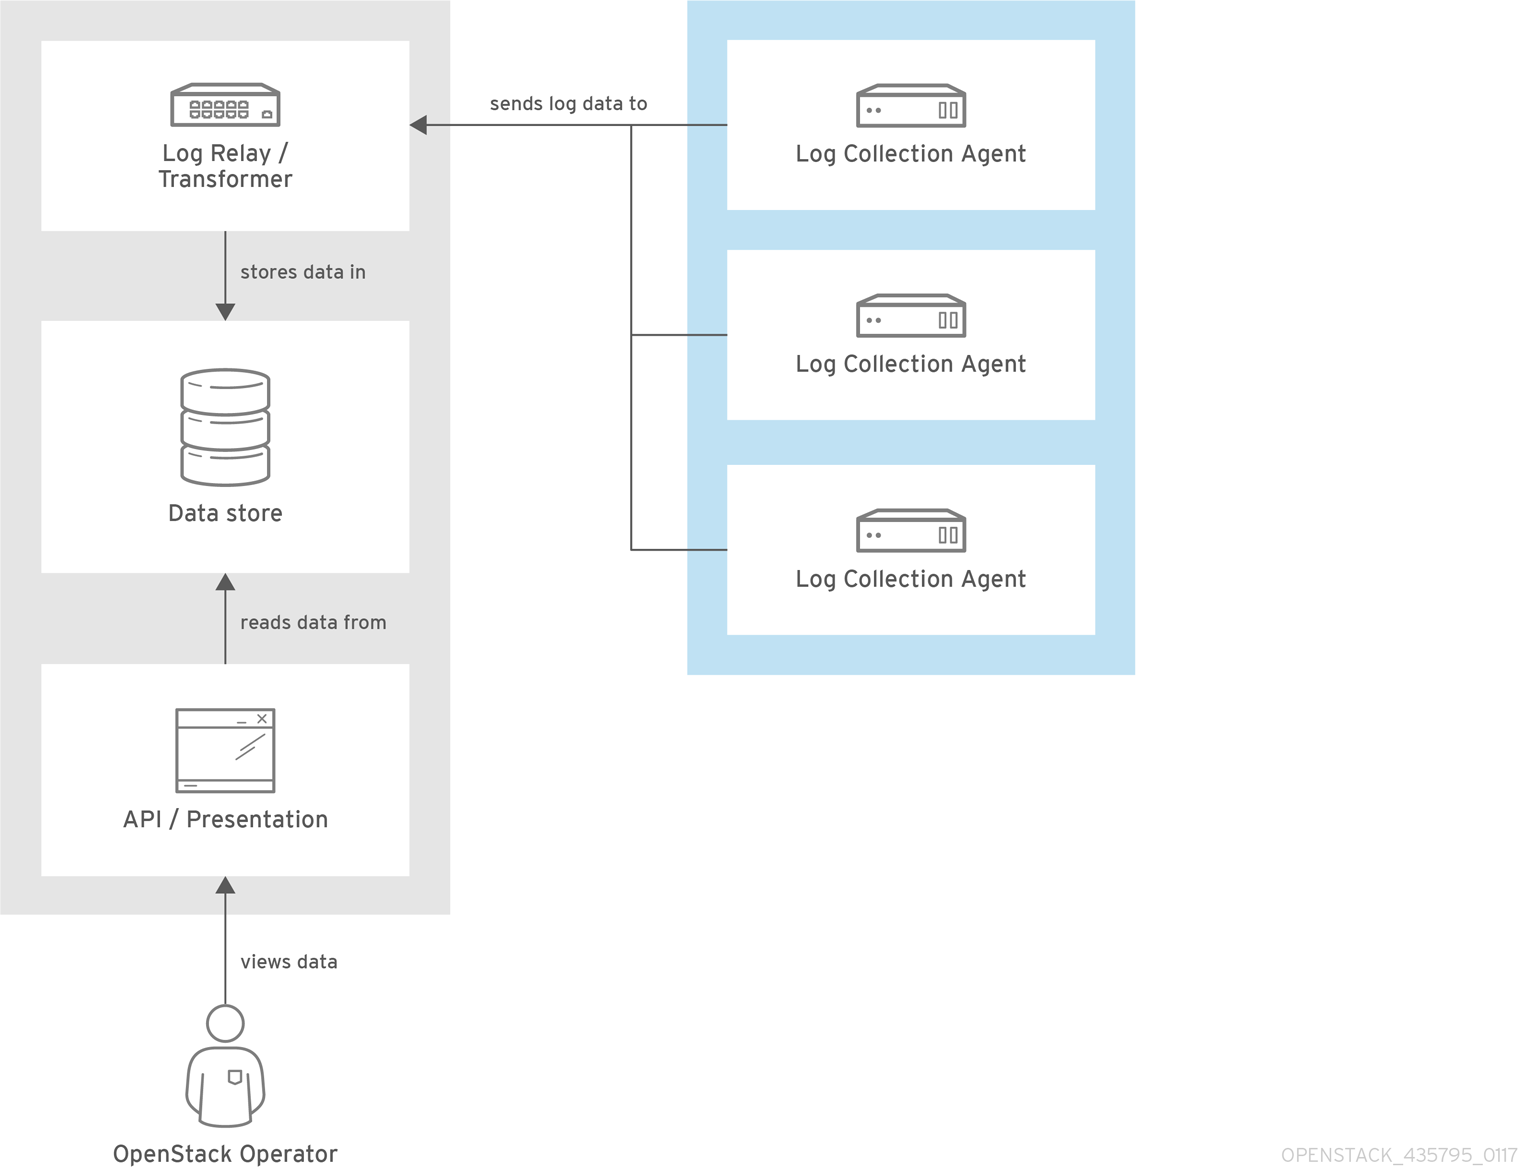
Figure 2.2. Single-node deployment for Red Hat OpenStack Platform
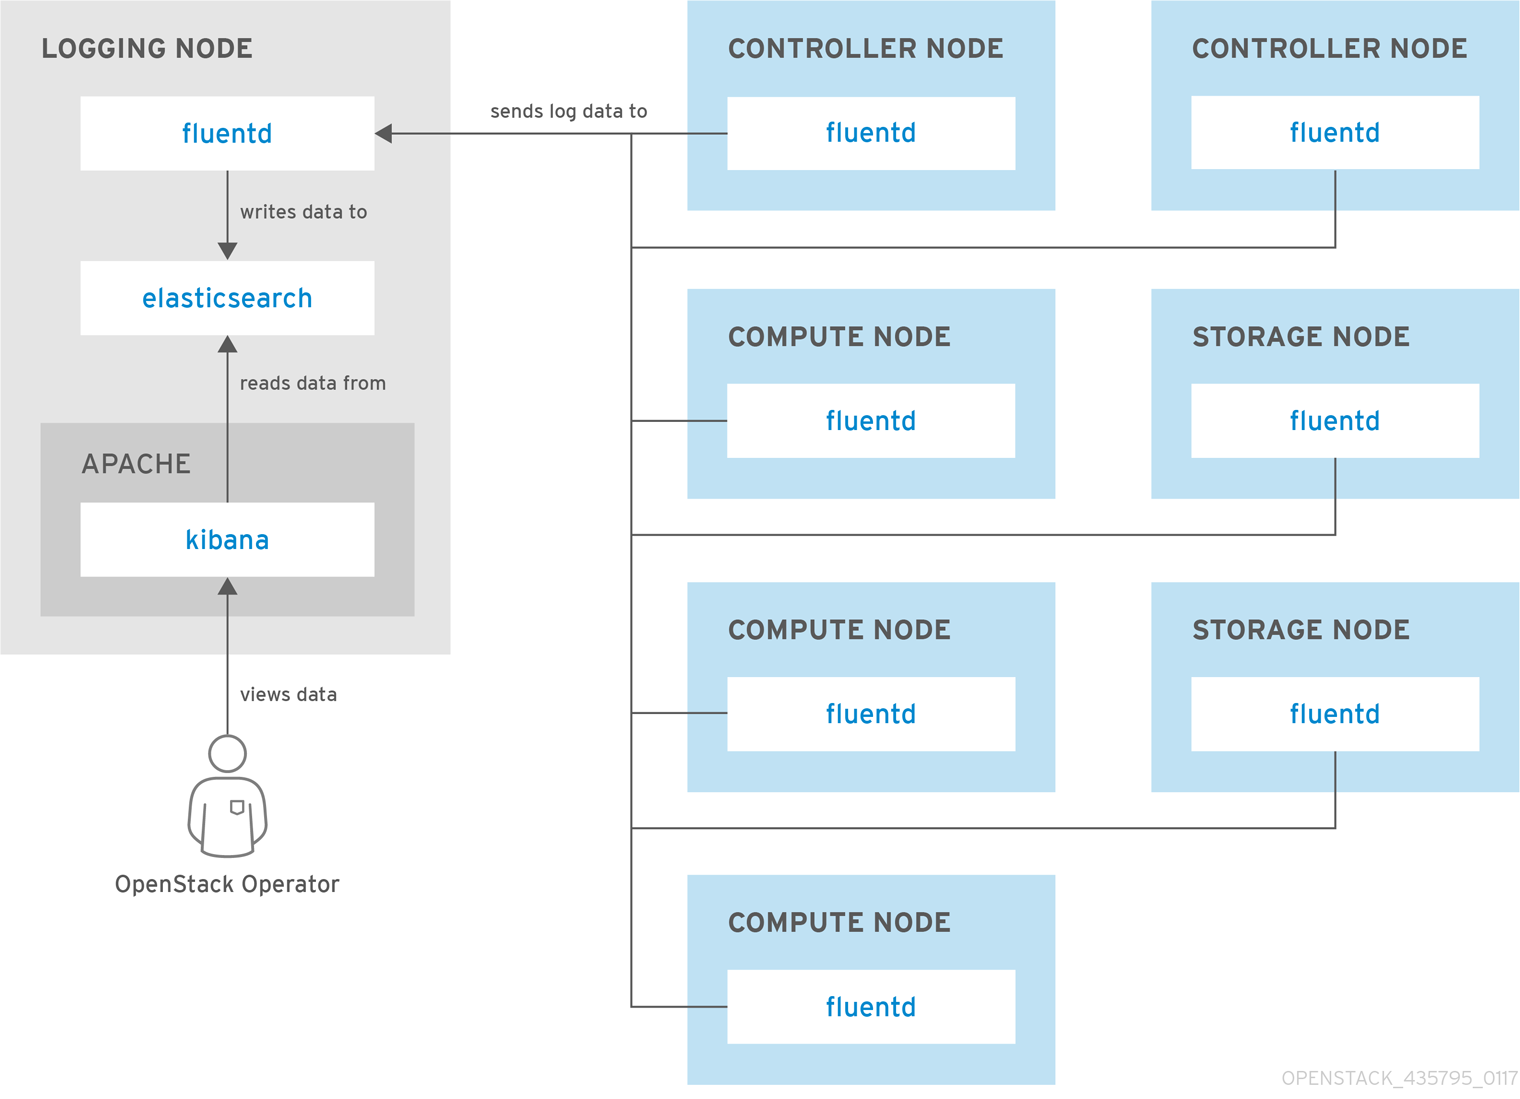
Figure 2.3. HA deployment for Red Hat OpenStack Platform
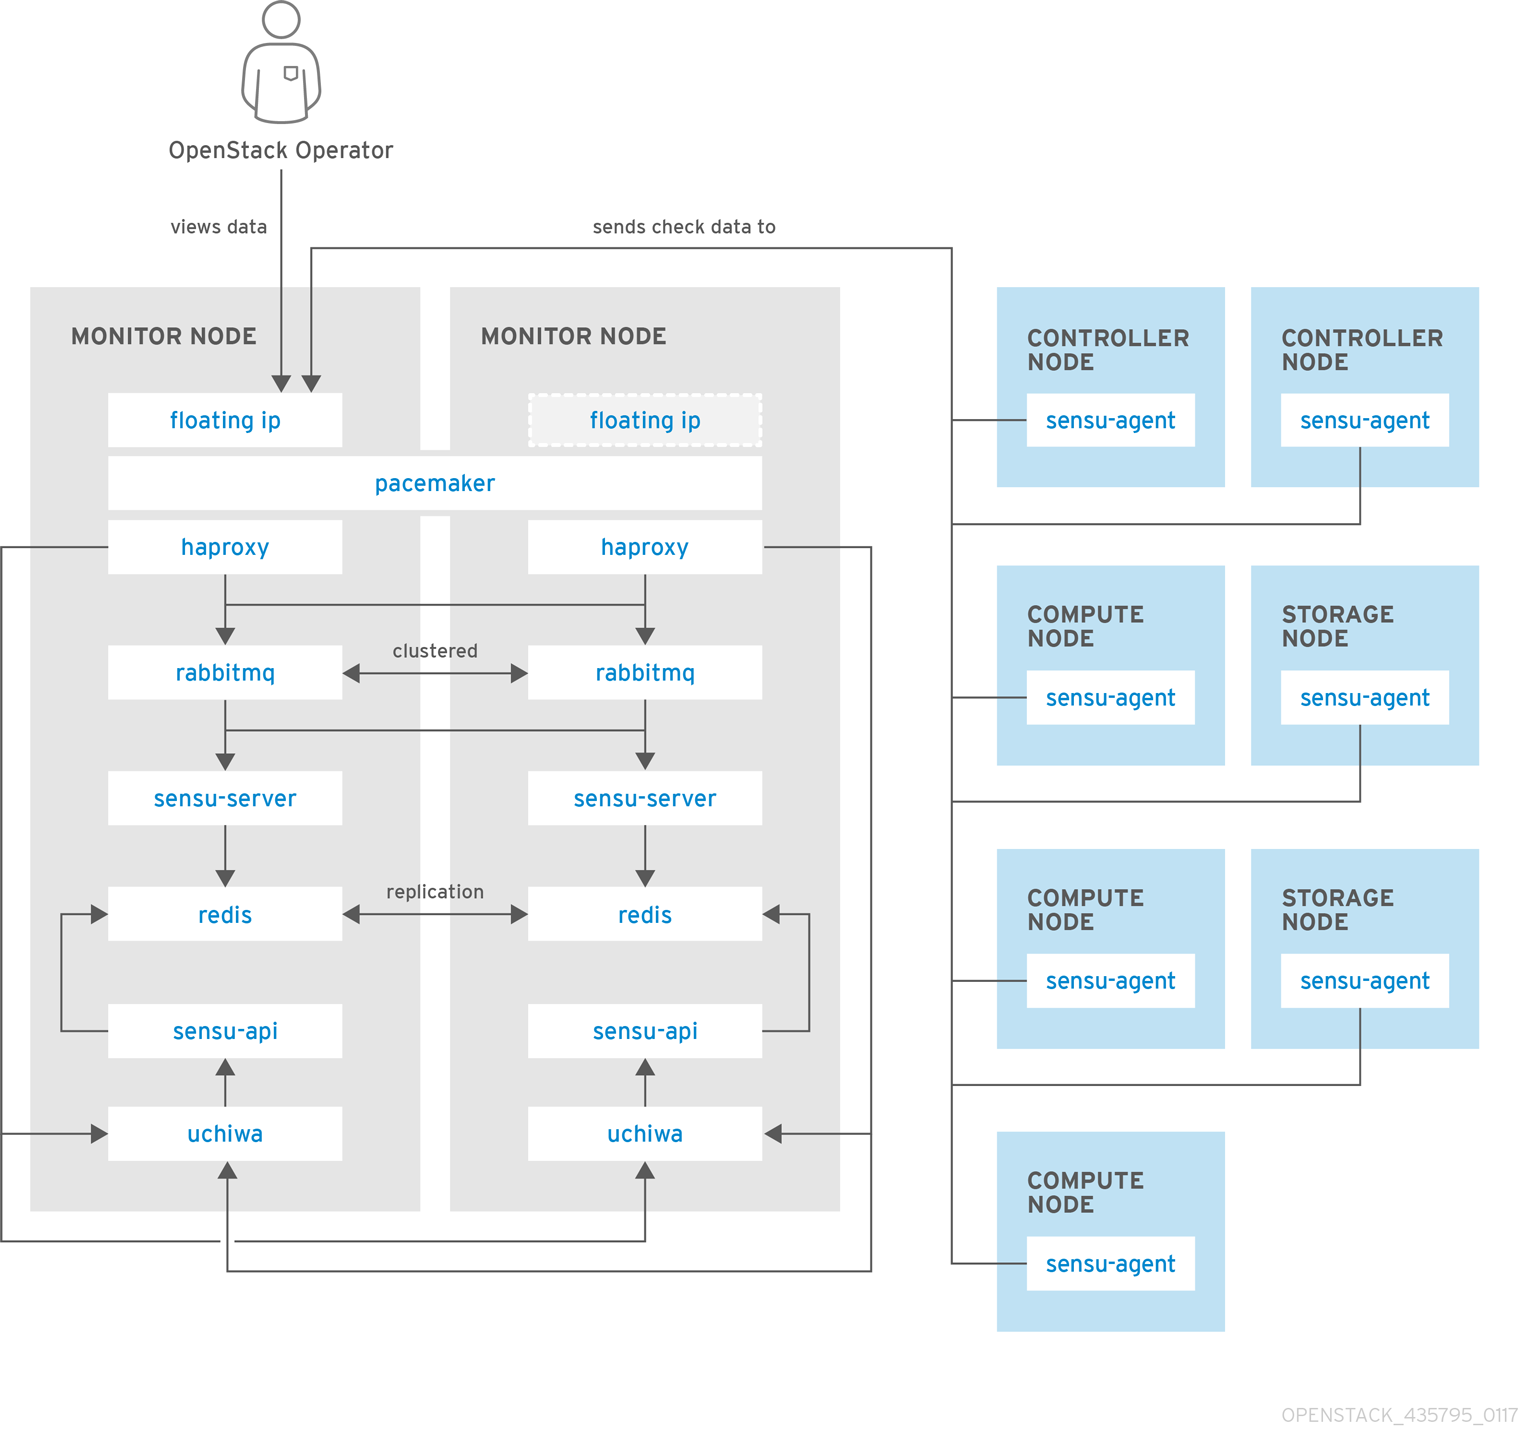
2.2. Availability Monitoring
Availability monitoring allows you to have one central place to monitor the high-level functionality of all components across your entire OpenStack environment.
The availability monitoring toolchain consists of a number of components, including:
- Monitoring Agent (Sensu client)
- Monitoring Relay/Proxy (RabbitMQ)
- Monitoring Controller/Server (Sensu server)
- API/Presentation Layer (Uchiwa)
The director does not deploy the server-side components for availability monitoring. Red Hat does not support the server-side components, including Uchiwa, Sensu Server, the Sensu API plus RabbitMQ, and a Redis instance running on a monitoring node.
The availability monitoring components and their interactions are laid out in the following diagrams:
Items shown in blue denote Red Hat-supported components.
Figure 2.4. Availability monitoring architecture at a high level

Figure 2.5. Single-node deployment for Red Hat OpenStack Platform
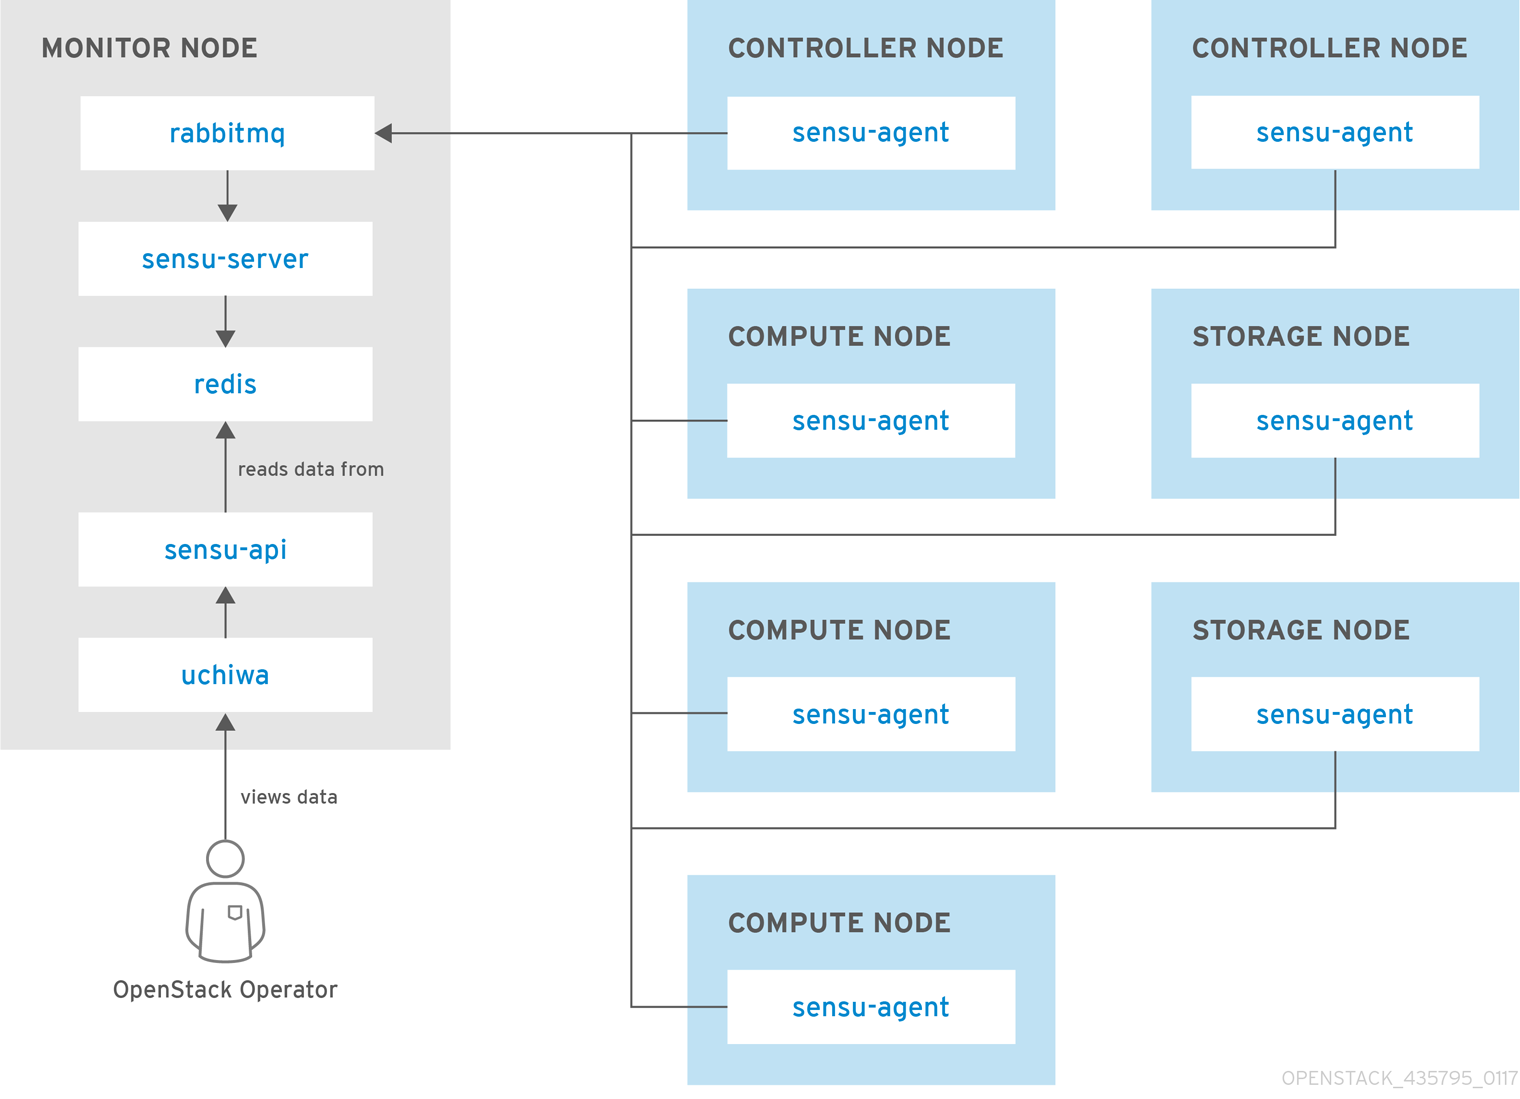
Figure 2.6. HA deployment for Red Hat OpenStack Platform
Chapter 3. Install the Client-Side Tools
Before you deploy the overcloud, you need to determine the configuration settings to apply to each client. Copy the example environment files from the director’s Heat template collection and modify them to suit your environment.
3.1. Set Centralized Logging Client Parameters
For Fluentd configuration settings, copy /usr/share/openstack-tripleo-heat-templates/environments/logging-environment.yaml and modify the file to suit your environment. For example:
Simple configuration
resource_registry:
  OS::TripleO::Services::Fluentd: ../deployment/deprecated/logging/fluentd-container-puppet.yaml

parameter_defaults:
  LoggingServers:
    - host: log0.example.com
      port: 24224
    - host: log1.example.com
      port: 24224
Example SSL configuration
## (note the use of port 24284 for ssl connections)

resource_registry:
  OS::TripleO::Services::Fluentd: ../deployment/deprecated/logging/fluentd-container-puppet.yaml

parameter_defaults:
  LoggingServers:
    - host: 192.0.2.11
      port: 24284
  LoggingUsesSSL: true
  LoggingSharedKey: secret
  LoggingSSLCertificate: |
    -----BEGIN CERTIFICATE-----
    ...certificate data here...
    -----END CERTIFICATE-----
-
LoggingServers- The destination system that will receive Fluentd log messages. -
LoggingUsesSSL- Setting that determines whethersecure_forwardis used when forwarding log messages. -
LoggingSharedKey- The shared secret used bysecure_forward. -
LoggingSSLCertificate- The PEM-encoded contents of the SSL CA certificate.
3.2. Set Availability Monitoring Client Parameters
For the Sensu client configuration settings, copy /usr/share/openstack-tripleo-heat-templates/environments/monitoring-environment.yaml and modify the file to suit your environment. For example:
resource_registry:
  OS::TripleO::Services::SensuClient: ../deployment/deprecated/monitoring/sensu-client-container-puppet.yaml

parameter_defaults:
  MonitoringRabbitHost: 10.10.10.10
  MonitoringRabbitPort: 5672
  MonitoringRabbitUserName: sensu
  MonitoringRabbitPassword: sensu
  MonitoringRabbitUseSSL: true
  MonitoringRabbitVhost: "/sensu"
  SensuClientCustomConfig:
    api:
      warning: 10
critical: 20-
MonitoringRabbit- These parameters connect the Sensu client services to the RabbitMQ instance that runs on the monitoring server. -
MonitoringRabbitUseSSL- Enables SSL for the RabbitMQ client. Uses SSL transport if the private key or certificate chain are not specified, as below. -
MonitoringRabbitSSLPrivateKey- Defines the path to the private key file, or can contain the contents of that file. -
MonitoringRabbitSSLCertChain- Defines the private SSL certificate chain to use. -
SensuClientCustomConfig- Specify additional Sensu client configuration. Defines the OpenStack credentials to be used, including username/password,auth_url, tenant, and region.
3.3. Install Operational Tools on Overcloud Nodes
Include the modified YAML files with your openstack overcloud deploy command to install the Sensu client and Fluentd tools on all overcloud nodes. For example:
$ openstack overcloud deploy --templates -e /usr/share/openstack-tripleo-heat-templates/environments/network-isolation.yaml -e network-environment.yaml -e ~/templates/monitoring-environment.yaml -e ~/templates/logging-environment.yaml --control-scale 3 --compute-scale 1 --ntp-server 192.168.122.10
3.4. Filter and Transform Logging Data
You can filter and transform events sent to Fluentd by setting the LoggingDefaultFilters parameter in your environment file. For example, the record_transformer type can modify incoming events:
parameter_defaults:

  LoggingDefaultFilters:
      - tag_pattern: '**'
        type: record_transformer
        enable_ruby: true
        record:
          openstack: '{"hostname": "${hostname}","tag": "${tag}","region": "regionOne","inputname":"fluent-plugin-in_tail","name":"fluentd openstack","fluentd version":"0.12.26", "pipeline_metadata": {"collector":{"ipaddr4":"#{ begin Socket.ip_address_list.select { |a| a.ipv4? && !a.ipv4_loopback? }.map { |a| a.ip_address } end}","ipaddr6":"#{ begin Socket.ip_address_list.select { |a| a.ipv6? && !a.ipv6_loopback? }.map { |a| a.ip_address } end}"}}}'
        remove_keys: host

      - tag_pattern: 'openstack.**'
        type: record_transformer
        record:
          service: '${tag_parts[1]}'

      - tag_pattern: 'system.messages**'
        type: record_transformer
        enable_ruby: true
        record:
          openstack: '{"info": "${record[''message'']}", "systemd":{"t":{"PID":"${record[''pid'']}"},"u":{"SYSLOG_IDENTIFIER":"${record[''ident'']}"}}}'
        remove_keys: 'ident,message,pid'
As a result, the data received by Kibana has been transformed accordingly:
{
  "_index": "logstash-2017.06.29",
  "_type": "fluentd",
  "_id": "AVz132QmRtyd8nnlv_11",
  "_score": null,
  "_source": {
    "pid": "22691",
    "priority": "INFO",
    "message": "cinder.api.openstack.wsgi [req-04bc2808-f86f-4443-86e6-bfc596969937 - - - - -] OPTIONS http://overcloud-controller-0.lab.local/",
    "openstack": {
      "hostname": "overcloud-controller-0",
      "tag": "openstack.cinder.api",
      "region": "regionOne",
      "inputname": "fluent-plugin-in_tail",
      "name": "fluentd openstack",
      "fluentd version": "0.12.26",
      "pipeline_metadata": {
        "collector": {
          "ipaddr4": "[\"192.168.24.14\", \"192.168.24.8\", \"10.0.0.4\", \"10.0.0.5\", \"172.16.2.8\", \"172.16.2.4\", \"172.16.2.14\", \"172.16.1.7\", \"172.16.1.9\", \"172.16.3.10\", \"172.16.3.11\", \"172.16.0.14\"]",
          "ipaddr6": "[\"fe80::293:33ff:fed8:2228%eth0\", \"fe80::293:33ff:fed8:2228%br-ex\", \"fe80::b86c:79ff:fe8f:9fb8%vlan10\", \"fe80::4c78:6fff:feff:14fc%vlan20\", \"fe80::9ced:dfff:fe8c:2d62%vlan30\", \"fe80::ecde:1bff:fe5d:e362%vlan40\", \"fe80::549c:51ff:feea:dfa8%vlan50\", \"fe80::e093:8fff:fef9:69b6%vxlan_sys_4789\"]"
        }
      }
    },
    "service": "cinder",
    "@timestamp": "2017-06-29T21:59:38+00:00"
  },
  "fields": {
    "@timestamp": [
      1498773578000
    ]
  },
  "sort": [
    1498773578000
  ]
}
Chapter 4. Monitor the OpenStack Platform
See the Sensu documentation for further details about the Sensu stack infrastructure: https://docs.sensu.io/sensu-core/1.7/overview/architecture/
Red Hat supplies a set of check scripts in the osops-tools-monitoring-oschecks package. The majority of the check scripts only check the API connection to the OpenStack component. However, certain scripts also perform additional OpenStack resource tests for OpenStack Compute (nova), OpenStack Block Storage (cinder), OpenStack Image (glance), and OpenStack Networking (neutron). For example, the OpenStack Identity (keystone) API check returns the following result when keystone is running:
OK: Got a token, Keystone API is working.
Chapter 5. Validate the Sensu Client Installation
Check the status of the
sensu-clienton each overcloud node:# podman ps | grep sensu-client
-
Review the error log for any issues:
/var/log/containers/sensu/sensu-client.log -
Verify that each overcloud node has the
/var/lib/config-data/puppet-generated/sensu/etc/sensu/conf.d/rabbitmq.jsonfile that sets the IP address of the monitoring server.
Chapter 6. Review the State of a Node
If you have a deployment of the Uchiwa dashboard, you can use it with the Sensu server to review the state of your nodes:
Login to the Uchiwa dashboard and click the
Data Centertab to confirm that the Data Center is operational.http://<SERVER_IP_ADDRESS>/uchiwa
-
Check that all overcloud nodes are in a
Connectedstate. - At a suitable time, reboot one of the overcloud nodes and review the rebooted node’s status in the Uchiwa dashboard. After the reboot completes, verify that the node successfully re-connects to the Sensu server and starts executing checks.
Chapter 7. Review the State of an OpenStack Service
This example tests the monitoring of the openstack-ceilometer-central service.
Confirm that the
openstack-ceilometer-centralservice is running:docker ps -a | grep ceilometer
-
Connect to the Uchiwa dashboard and confirm that a successful
ceilometercheck is present and running as defined in theceilometerJSON file.