
Chapter 2. Validating an OVS-DPDK Deployment
This chapter describes the validation steps to take following a deployment.
2.1. Confirming OpenStack
Use the following commands to confirm OpenStack and OVS-DPDK configuration.
2.1.1. Show the Network Agents
Ensure that the value for Alive is True and State is UP for each agent. If there are any issues, view the logs in /var/log/containers/neutron and /var/log/openvswitch/ovs-vswitchd.log to determine the issue.
$ openstack network agent list

+------------------+------------------+------------------+-------------------+-------+-------+--------------------+
| ID               | Agent Type       | Host             | Availability Zone | Alive | State | Binary             |
+------------------+------------------+------------------+-------------------+-------+-------+--------------------+
| 19188fa7-50f1-4a | DHCP agent       | control-0.locald | nova              | True  | UP    | neutron-dhcp-agent |
| b1-a86c-         |                  | omain            |                   |       |       |                    |
| 986724e6e75d     |                  |                  |                   |       |       |                    |
| 6b58175c-a07e-49 | L3 agent         | control-0.locald | nova              | True  | UP    | neutron-l3-agent   |
| 56-a736-dc2a3f27 |                  | omain            |                   |       |       |                    |
| 2a34             |                  |                  |                   |       |       |                    |
| b4bc9e26-959c-   | Metadata agent   | control-0.locald | None              | True  | UP    | neutron-metadata-  |
| 402a-ab24-b7ccad |                  | omain            |                   |       |       | agent              |
| b8119f           |                  |                  |                   |       |       |                    |
| eb7df511-5e09-46 | Open vSwitch     | control-0.locald | None              | True  | UP    | neutron-           |
| 55-a82d-         | agent            | omain            |                   |       |       | openvswitch-agent  |
| 8aa52537f730     |                  |                  |                   |       |       |                    |
| fc1a71f0-06af-   | Open vSwitch     | compute-0.locald | None              | True  | UP    | neutron-           |
| 43e3-b48a-       | agent            | omain            |                   |       |       | openvswitch-agent  |
| f0923bcec843     |                  |                  |                   |       |       |                    |
+------------------+------------------+------------------+-------------------+-------+-------+--------------------+
2.1.2. Show the Hosts in the Compute Service
Ensure that the value for Status is enabled and State is up for each host. If there are any issues, see the logs in /var/log/containers/nova to determine the issue.
$ openstack compute service list

+----+------------------+-----------------------+----------+---------+-------+----------------------------+
| ID | Binary           | Host                  | Zone     | Status  | State | Updated At                 |
+----+------------------+-----------------------+----------+---------+-------+----------------------------+
|  3 | nova-consoleauth | control-0.localdomain | internal | enabled | up    | 2019-02-06T16:21:52.000000 |
|  4 | nova-scheduler   | control-0.localdomain | internal | enabled | up    | 2019-02-06T16:21:51.000000 |
|  5 | nova-conductor   | control-0.localdomain | internal | enabled | up    | 2019-02-06T16:21:50.000000 |
|  6 | nova-compute     | compute-0.localdomain | dpdk     | enabled | up    | 2019-02-06T16:21:45.000000 |
+----+------------------+-----------------------+----------+---------+-------+----------------------------+
For more information about confirming a Red Hat OpenStack Platform configuration see Validating a containerized overcloud in the Upgrading Red Hat OpenStack Platform guide.
2.2. Confirming Compute Node OVS Configuration
To verify the configuration and health of network adapters and OpenvSwitch, complete the following the steps:
To verify the DPDK network device on the compute node, run the following command. This rpm is found in repo:
rhel-7-server-extras-rpms.$ yum install dpdk-tools
Show the network devices managed by DPDK and those used for networking.
$ dpdk-devbind --status
The devices using a DPDK driver are the types
ovs_dpdk_bondorovs_dpdk_portin the Tripleo compute role templates:Network devices using DPDK-compatible driver ============================================ 0000:04:00.1 'Ethernet 10G 2P X520 Adapter 154d' drv=vfio-pci unused= 0000:05:00.0 'Ethernet 10G 2P X520 Adapter 154d' drv=vfio-pci unused= Network devices using kernel driver =================================== 0000:02:00.0 'NetXtreme BCM5720 Gigabit Ethernet PCIe 165f' if=em1 drv=tg3 unused=vfio-pci *Active* 0000:02:00.1 'NetXtreme BCM5720 Gigabit Ethernet PCIe 165f' if=em2 drv=tg3 unused=vfio-pci 0000:03:00.0 'NetXtreme BCM5720 Gigabit Ethernet PCIe 165f' if=em3 drv=tg3 unused=vfio-pci 0000:03:00.1 'NetXtreme BCM5720 Gigabit Ethernet PCIe 165f' if=em4 drv=tg3 unused=vfio-pci *Active* 0000:04:00.0 'Ethernet 10G 2P X520 Adapter 154d' if=p1p1 drv=ixgbe unused=vfio-pci 0000:05:00.1 'Ethernet 10G 2P X520 Adapter 154d' if=p2p2 drv=ixgbe unused=vfio-pci
Run the following command to confirm that DPDK is enabled:
$ sudo  ovs-vsctl get Open_vSwitch . iface_types

[dpdk, dpdkr, dpdkvhostuser, dpdkvhostuserclient, geneve, gre, internal, lisp, patch, stt, system, tap, vxlan]
Run the following command. The results show PCI devices from the DPDK compatible drivers, for example,
0000:04:00.1and:05:00.0astype: dpdkwith no errors.$ ovs-vsctl show Bridge "br-link0" Controller "tcp:127.0.0.1:6633" is_connected: true fail_mode: secure Port "phy-br-link0" Interface "phy-br-link0" type: patch options: {peer="int-br-link0"} Port "dpdkbond0" Interface "dpdk1" type: dpdk options: {dpdk-devargs="0000:04:00.1", n_rxq="2"} Interface "dpdk0" type: dpdk options: {dpdk-devargs="0000:05:00.0", n_rxq="2"} Port "br-link0" Interface "br-link0" type: internal ovs_version: "2.9.0"The following output shows an error:
Port "dpdkbond0"
           Interface "dpdk1"
               type: dpdk
               options: {dpdk-devargs="0000:04:00.1", n_rxq="2"}
               error: "Error attaching device '0000:04:00.1' to DPDK"
To show details about interfaces, run the following command:
$ sudo ovs-vsctl list interface dpdk1 | egrep "name|mtu|options|status"
Run the following command. Note that lacp is not enabled.
$ ovs-appctl bond/show dpdkbond0

bond_mode: active-backup
bond may use recirculation:
no, Recirc-ID : -1
bond-hash-basis: 0
updelay: 0 ms
downdelay: 0 ms
lacp_status: off
lacp_fallback_ab: false
active slave mac: a0:36:9f:e5:da:82(dpdk1)

slave dpdk0: enabled
    may_enable: true

slave dpdk1: enabled
    active slave
    may_enable: true
Check that all ovs bridges on compute nodes are
netdevfor fast data path (user space) networkingNoteMixing system (kernel) and netdev (user space) datapath types is not supported.
$ ovs-vsctl list bridge | grep -e name -e datapath_type

datapath_type       : netdev
name                : br-int
datapath_type       : netdev
name                : "br-link0"
Run the following command to check for persistent Open vSwitch errors:
$ grep ERROR /var/log/openvswitch/ovs-vswitchd.log
2.3. Confirming OVS for Instance Configuration
To ensure that vhostuser DMA works, configure instances with OVS-DPDK ports to have dedicated CPUs and huge pages enabled using flavors. For more information, see Step 3 in: Creating a flavor and deploying an instance for OVS-DPDK.
To confirm the instance configuration, complete the following steps:
Confirm the instance has pinned CPUs. Dedicated CPUs can be identified with
virsh:$ sudo virsh vcpupin 2
Confirm that the emulator threads used for the instance are not running on the same vCPUs assigned to that instance:
$ sudo virsh emulatorpin 2
NoteBeginning with Red Hat OpenStack Platform 12, you can select where the emulator thread will run by flavor. See Configuring emulator threads policy with Red Hat OpenStack Platform 12.
For older versions, you must perform emulator thread pinning manually when the instance is powered on. See About the impact of using virsh emulatorpin in virtual environments with NFV, with and without isolcpus, and about optimal emulator thread pinning.
Confirm the instance is using huge pages, which is required for optimal performance.
$ sudo virsh numatune 1
Confirm that the receive queues for the instance are being serviced by a poll mode driver (PMD).
The ports and queues should be equally balanced across the PMDs. Optimally, ports will be serviced by a CPU in the same NUMA node as the network adapter.
$ sudo ovs-appctl dpif-netdev/pmd-rxq-show

pmd thread numa_id 0 core_id 2:
    isolated : false
    port: dpdk0               queue-id:  1    pmd usage:  0 %
    port: dpdk1               queue-id:  0    pmd usage:  0 %
    port: vhu94ccc316-ea      queue-id:  0    pmd usage:  0 %
pmd thread numa_id 1 core_id 3:
    isolated : false
pmd thread numa_id 0 core_id 22:
    isolated : false
    port: dpdk0               queue-id:  0    pmd usage:  0 %
    port: dpdk1               queue-id:  1    pmd usage:  0 %
    port: vhu24e6c032-db      queue-id:  0    pmd usage:  0 %
pmd thread numa_id 1 core_id 23:
    isolated : false
Show statistics for the PMDs. This helps to determine how well receive queues are balanced across PMDs. For more information, see PMD Threads in the Open vSwitch documentation.
NoteThe
pmd-rxq-rebalanceoption was added in OVS 2.9.0. This command performs new PMD queue assignments in order to balance equally across PMDs based on the latest rxq processing cycle information.The
pmd-stats-showcommand shows the full history since the PMDs were running or since the statistics were last cleared. If it is not cleared, it will have incorporated into the stats before the ports were set up and data was flowing. If it is being used to see the load on a datapath (which it typically is) it would then be useless.It is best to put the system into a steady state, clear the stats, wait a few seconds, and then show the stats. This provides an accurate picture of the datapath.
Use the following command to show statistics for the PMDs:
$ sudo ovs-appctl dpif-netdev/pmd-stats-show

pmd thread numa_id 0 core_id 2:
    packets received: 492207
    packet recirculations: 0
    avg. datapath passes per packet: 1.00
    emc hits: 419949
    megaflow hits: 2485
    avg. subtable lookups per megaflow hit: 1.33
    miss with success upcall: 69773
    miss with failed upcall: 0
    avg. packets per output batch: 1.00
    idle cycles: 1867450752126715 (100.00%)
    processing cycles: 5274066849 (0.00%)
    avg cycles per packet: 3794046054.19 (1867456026193564/492207)
    avg processing cycles per packet: 10715.14 (5274066849/492207)
pmd thread numa_id 1 core_id 3:
    packets received: 0
    packet recirculations: 0
    avg. datapath passes per packet: 0.00
    emc hits: 0
    megaflow hits: 0
    avg. subtable lookups per megaflow hit: 0.00
    miss with success upcall: 0
    miss with failed upcall: 0
    avg. packets per output batch: 0.00
pmd thread numa_id 0 core_id 22:
    packets received: 493258
    packet recirculations: 0
    avg. datapath passes per packet: 1.00
    emc hits: 419755
    megaflow hits: 3223
    avg. subtable lookups per megaflow hit: 1.49
    miss with success upcall: 70279
    miss with failed upcall: 1
    avg. packets per output batch: 1.00
    idle cycles: 1867449561100794 (100.00%)
    processing cycles: 6465180459 (0.00%)
    avg cycles per packet: 3785961963.68 (1867456026281253/493258)
    avg processing cycles per packet: 13107.10 (6465180459/493258)
pmd thread numa_id 1 core_id 23:
    packets received: 0
    packet recirculations: 0
    avg. datapath passes per packet: 0.00
    emc hits: 0
    megaflow hits: 0
    avg. subtable lookups per megaflow hit: 0.00
    miss with success upcall: 0
    miss with failed upcall: 0
    avg. packets per output batch: 0.00
main thread:
    packets received: 16
    packet recirculations: 0
    avg. datapath passes per packet: 1.00
    emc hits: 1
    megaflow hits: 9
    avg. subtable lookups per megaflow hit: 1.00
    miss with success upcall: 6
    miss with failed upcall: 0
    avg. packets per output batch: 1.00
Reset the PMD statistics. The
pmd-stats-showcommand shows the PMD statistics since the lastpmd-stats-clearcommand. If there was no previouspmd-stats-clearissued, it contains data since the PMD began running.If you are examining a system under load, it is useful to clear the PMD statistics and then show them. Otherwise, the statistics can also include data from an earlier time when the system was not under load (before traffic flowing).
Use the following command to reset the PMD statistics:
$ sudo ovs-appctl dpif-netdev/pmd-stats-clear
2.4. Other Helpful Commands
Use these commands to perform additional validation checks.
Find the OVS-DPDK Port & Physical NIC Mapping Configured by os-net-config
cat /var/lib/os-net-config/dpdk_mapping.yaml
Find the DPDK port for an instance with the Nova instance $ID
sudo ovs-vsctl find interface external_ids:vm-uuid="$ID" | grep ^name
Find the Nova ID for an instance using a DPDK port
sudo ovs-vsctl get interface vhu24e6c032-db external_ids:vm-uuid
Perform a tcpdump on a dpdk port
sudo ovs-tcpdump -i vhu94ccc316-ea
ovs-tcpdump is from the openvswitch-test RPM located in the rhel-7-server-openstack-13-devtools-rpms repo.
For performance concerns, ovs-tcpdump is not recommended for production environments. For more information, see: How to use ovs-tcpdump on vhost-user interfaces in Red Hat OpenStack Platform?.
2.5. Simple Compute Node CPU Partitioning and Memory Checks
Prerequisites
Run this command on a deployed compute node and note how the cpu masks map to TripleO Heat Template values:
$ sudo ovs-vsctl get Open_vSwitch . other_config

{dpdk-init="true", dpdk-lcore-mask="300003", dpdk-socket-mem="3072,1024", pmd-cpu-mask="c0000c"}
Note the following:
-
dpdk-lcore-maskmaps toOvsDpdkCoreListin TripleO Heat Templates. -
dpdk-socket-memmaps toOvsDpdkSocketMemoryin TripleO Heat Templates. pmd-cpu-maskmaps toOvsPmdCoreListin TripleO Heat Templates.To convert these cpu masks to decimal values that can be reconciled back to TripleO Heat Templates and actual system values see: How to convert a hexadecimal CPU mask into a bit mask and identify the masked CPUs?
2.5.1. Detecting CPUs
To detect CPUs for pid 1, use the following command. No PMDs or Nova vCPUs should be running on these cores:
$ taskset -c -p 1

pid 1's current affinity list: 0,1,20,21
2.5.2. Detecting PMD Threads
To see PMD threads, use the following command. The output should reflect the values of the Tripleo parameter OvsPmdCoreList. There should be no overlap with the values of Tripleo parameters OvsDpdkCoreList or HostIsolatedCoreslist:
$ ps -T -o spid,comm -p $(pidof ovs-vswitchd) |grep '\<pmd' |while read spid name; do echo $name $(taskset -p -c $spid); done

pmd44 pid 679318's current affinity list: 3
pmd45 pid 679319's current affinity list: 23
pmd46 pid 679320's current affinity list: 22
pmd47 pid 679321's current affinity list: 2
2.5.3. Detecting NUMA node
For optimal performance ensure that physical network adapters, PMD threads, and pinned CPUs for instances are all on the same NUMA node. For more information, see: CPUs and NUMA nodes.
The following is a simple exercise for examining NUMA assignments.
Examine the vhu port for an instance on a compute node:
$ sudo virsh domiflist 1

Interface  Type       Source     Model       MAC
-------------------------------------------------------
vhu24e6c032-db vhostuser  -          virtio      fa:16:3e:e3:c4:c2
Examine the PMD thread that is servicing that port and note the NUMA node:
$ sudo ovs-appctl dpif-netdev/pmd-rxq-show

pmd thread numa_id 0 core_id 2:
    isolated : false
    port: vhu24e6c032-db      queue-id:  0    pmd usage:  0 %
    port: vhu94ccc316-ea      queue-id:  0    pmd usage:  0 %
Find the physical pinned cpus for the instance. For example, the PMD servicing the port for this instance is on cpu 2 and the instance is serviced by cpus 34 and 6.
$ sudo virsh dumpxml 1 | grep cpuset

    <vcpupin 1 vcpu='0' cpuset='34'/>
    <emulatorpin cpuset='6'/>
Examine the cores for each NUMA node. Note that the CPUs servicing the instance (34,6) are on the same NUMA node (0).
$ lscpu | grep ^NUMA

NUMA node(s):          2
NUMA node0 CPU(s):     0,2,4,6,8,10,12,14,16,18,20,22,24,26,28,30,32,34,36,38
NUMA node1 CPU(s):     1,3,5,7,9,11,13,15,17,19,21,23,25,27,29,31,33,35,37,39
Additionally, network adapters that are not managed by OVS DPDK will have an entry here that indicates what NUMA node they belong to:
$ sudo cat /sys/class/net/<device name>/device/numa_node
Alternatively, you can see the NUMA node for a network adapter by querying the PCI address, even for those managed by OVS DPDK:
$ sudo lspci -v -s 05:00.1 | grep -i numa

Flags: bus master, fast devsel, latency 0, IRQ 203, NUMA node 0
These exercises demonstrate that the PMD, instance, and network adapter are all on NUMA 0, which is optimal for performance. For an indication of cross NUMA polling from the openvswitch logs (located in /var/log/openvswitch), look for a log entry similar to this:
dpif_netdev|WARN|There's no available (non-isolated) pmd thread on numa node 0. Queue 0 on port 'dpdk0' will be assigned to the pmd on core 7 (numa node 1). Expect reduced performance.
2.5.4. Detecting Isolated CPUs
Use the following command to show isolated CPUs. The output should be the same as the value of the TripleO parameter IsolCpusList.
$ cat /etc/tuned/cpu-partitioning-variables.conf | grep -v ^#

isolated_cores=2-19,22-39
2.5.5. Detecting CPUs Dedicated to Nova Instances
Use the following command to show the CPUs dedicated to Nova instances. This output should be the same as the value of the parameter isolcpus without poll mode driver (PMD) CPUs:
$ grep ^vcpu_pin_set /var/lib/config-data/puppet-generated/nova_libvirt/etc/nova/nova.conf

vcpu_pin_set=4-19,24-39
2.5.6. Confirming Huge Pages Configuration
Check for huge pages configuration on the compute node.
[root@compute-0 ~]# cat /sys/devices/system/node/node*/meminfo  | grep -i huge
Node 0 AnonHugePages:      4096 kB
Node 0 HugePages_Total:    16
Node 0 HugePages_Free:     11
Node 0 HugePages_Surp:      0
Node 1 AnonHugePages:      8192 kB
Node 1 HugePages_Total:    16
Node 1 HugePages_Free:     15
Node 1 HugePages_Surp:      0
If huge pages are not configured or are exhausted, see KernelArgs.
2.6. Causes for Packet Drops
Packets are dropped when a queue is full, usually when the queue is not drained fast enough. The bottleneck is the entity that is supposed to drain the queue when the queue is not draining quickly enough. In most instances, a drop counter is used to track dropped packets. Sometimes a bug in the hardware or software design can cause packets to skip the drop counter.
The Data Plan Development Kit (DPDK) includes the testpmd application for forwarding packets. In the scenarios shown in this chapter, testpmd is installed on a VM and polls ports with its assigned logical cores (lcores) to forward packets from one port to another. testpmd is ordinarily used with a traffic generator to test, in this case, throughput across a physical-virtual-physical (PVP) path.
2.6.1. OVS-DPDK Too Slow to Drain Physical NICs
This example shows that a PMD thread is responsible for polling the receive (RX) queue of the physical network adapter (dpdk0). When the PMD thread cannot keep up with the packet volume, or is interrupted, packets might be dropped.
Figure 2.1. Polling the physical adapter RX queue
The following command shows statistics from the dpdk0 interface. If packets are being dropped because ovs-dpdk is not draining the physical adapter fast enough, you will see the value of rx_dropped increasing rapidly.
There should be no more than one physical CPU core per NUMA node for PMDs.
# ovs-vsctl --column statistics list interface dpdk0

statistics          : {mac_local_errors=0, mac_remote_errors=0, "rx_1024_to_1522_packets"=26, "rx_128_to_255_packets"=243,
"rx_1523_to_max_packets"=0, "rx_1_to_64_packets"=102602, "rx_256_to_511_packets"=6100, "rx_512_to_1023_packets"=27,
"rx_65_to_127_packets"=16488, rx_broadcast_packets=2751, rx_bytes=7718218, rx_crc_errors=0, rx_dropped=0, rx_errors=0,
rx_fragmented_errors=0, rx_illegal_byte_errors=0, rx_jabber_errors=0, rx_length_errors=0, rx_mac_short_dropped=0,
rx_mbuf_allocation_errors=0, rx_oversize_errors=0, rx_packets=125486, rx_undersized_errors=0, "tx_1024_to_1522_packets"=63,
"tx_128_to_255_packets"=319, "tx_1523_to_max_packets"=0, "tx_1_to_64_packets"=1053, "tx_256_to_511_packets"=50,
"tx_512_to_1023_packets"=68, "tx_65_to_127_packets"=7732, tx_broadcast_packets=12, tx_bytes=466813, tx_dropped=0,
tx_errors=0, tx_link_down_dropped=0, tx_multicast_packets=5642, tx_packets=9285}
2.6.2. VM Too Slow to Drain vhost-user
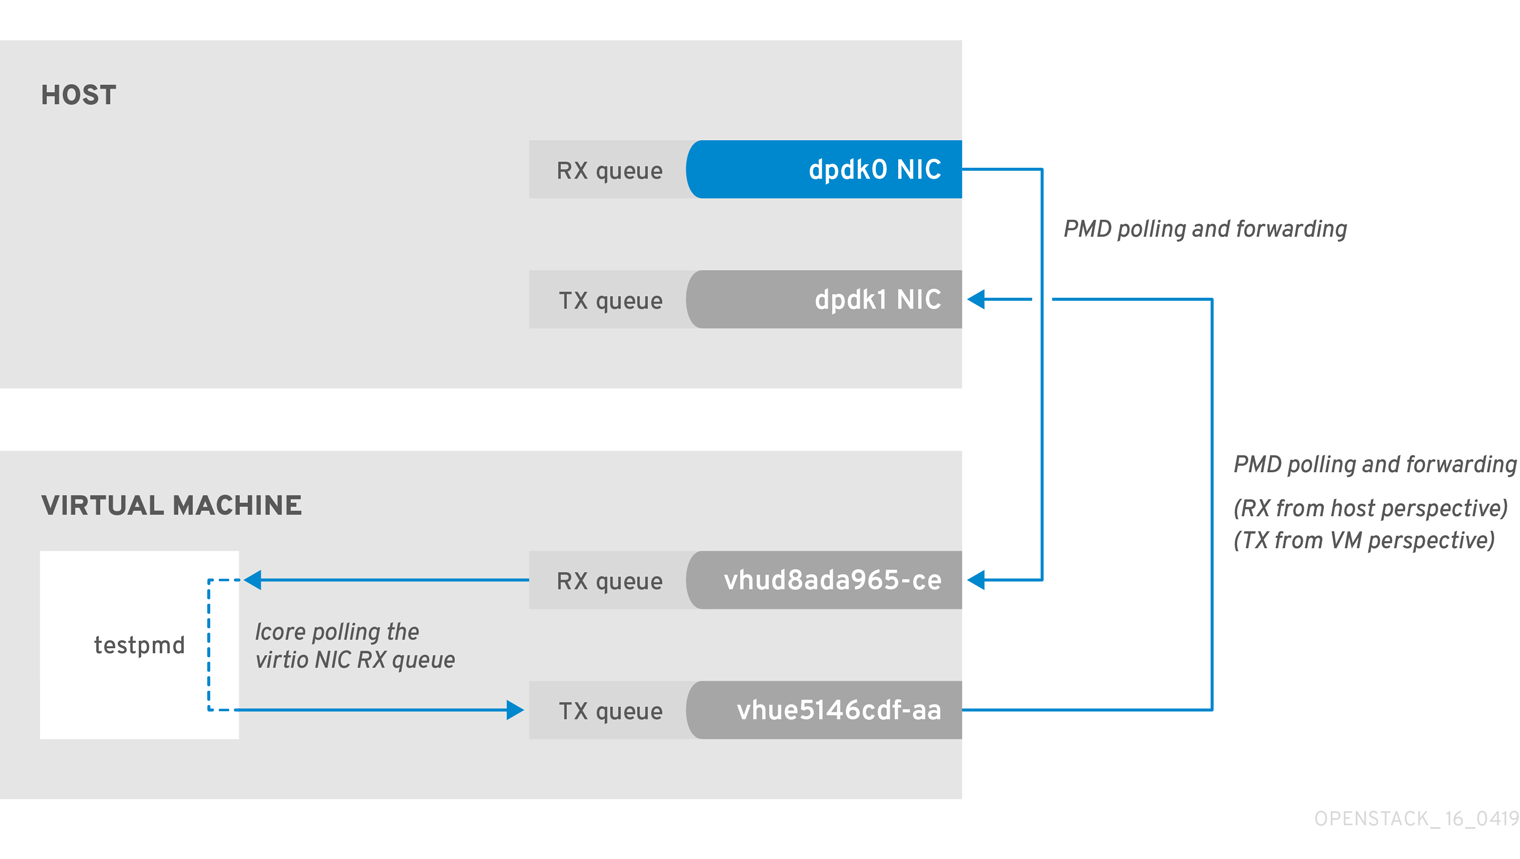
This example is similar to the example in Figure 2.1, in that you might experience packet loss if the lcore thread is overwhelmed by the packet volume sent to the instance receive (RX) queue.
For more information, see the following articles:
Figure 2.2. Polling the virtual adapter RX queue

To check if the tx_dropped value of the host corresponds to the rx_dropped value of the VM, run the following command:
ovs-vsctl --column statistics list interface vhud8ada965-ce

statistics          : {"rx_1024_to_1522_packets"=0, "rx_128_to_255_packets"=0, "rx_1523_to_max_packets"=0,
"rx_1_to_64_packets"=0, "rx_256_to_511_packets"=0, "rx_512_to_1023_packets"=0, "rx_65_to_127_packets"=0, rx_bytes=0,
rx_dropped=0, rx_errors=0, rx_packets=0, tx_bytes=0, tx_dropped=0, tx_packets=0}
2.6.3. OVS-DPDK Too Slow to Drain vhost-user
In this example, a PMD thread is polls the virtio TX, the receive queue from the host perspective. If the PMD thread is overwhelmed by the packet volume, or is interrupted, packets might drop.
Figure 2.3. Polling the virtual adapter TX queue
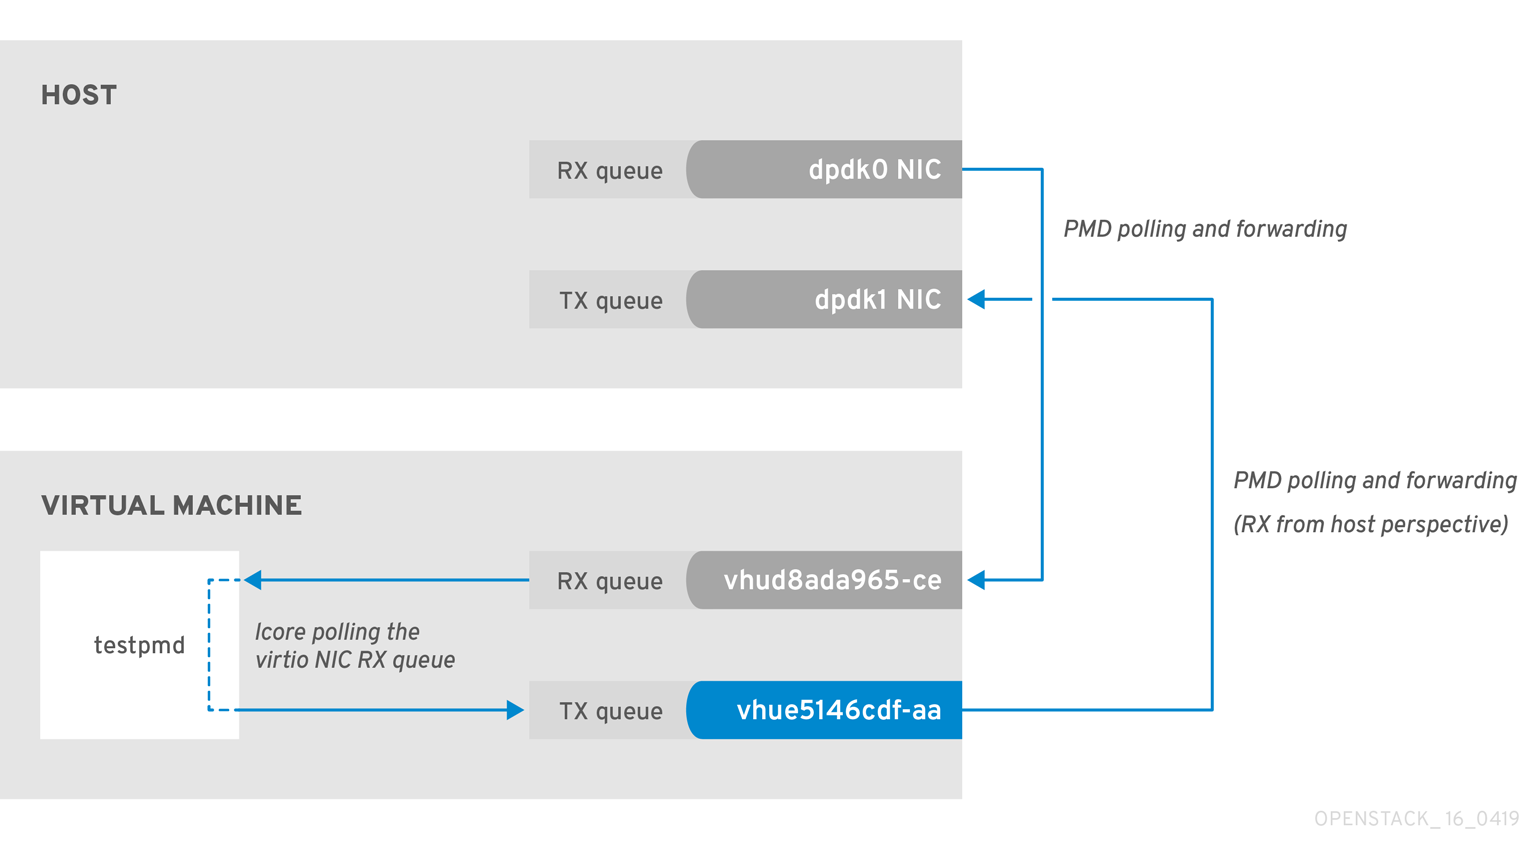
The trace the return path of the packets from the VM and provides values from drop counters on both the host (tx_dropped) and VM (rx_dropped) sides, run the following command:
ovs-vsctl --column statistics list interface vhue5146cdf-aa

statistics          : {"rx_1024_to_1522_packets"=0, "rx_128_to_255_packets"=0, "rx_1523_to_max_packets"=0,
"rx_1_to_64_packets"=0, "rx_256_to_511_packets"=0, "rx_512_to_1023_packets"=0, "rx_65_to_127_packets"=0,
rx_bytes=0, rx_dropped=0, rx_errors=0, rx_packets=0, tx_bytes=0, tx_dropped=0, tx_packets=0}
2.6.4. Packet Loss on Egress Physical Interface
A slow transfer rate between the PCIe and RAM can result in the physical adapter dropping packets from the TX queue. While this is infrequent, it’s important to know how to identify and resolve this issue.
Figure 2.4. Polling the physical adapter TX queue
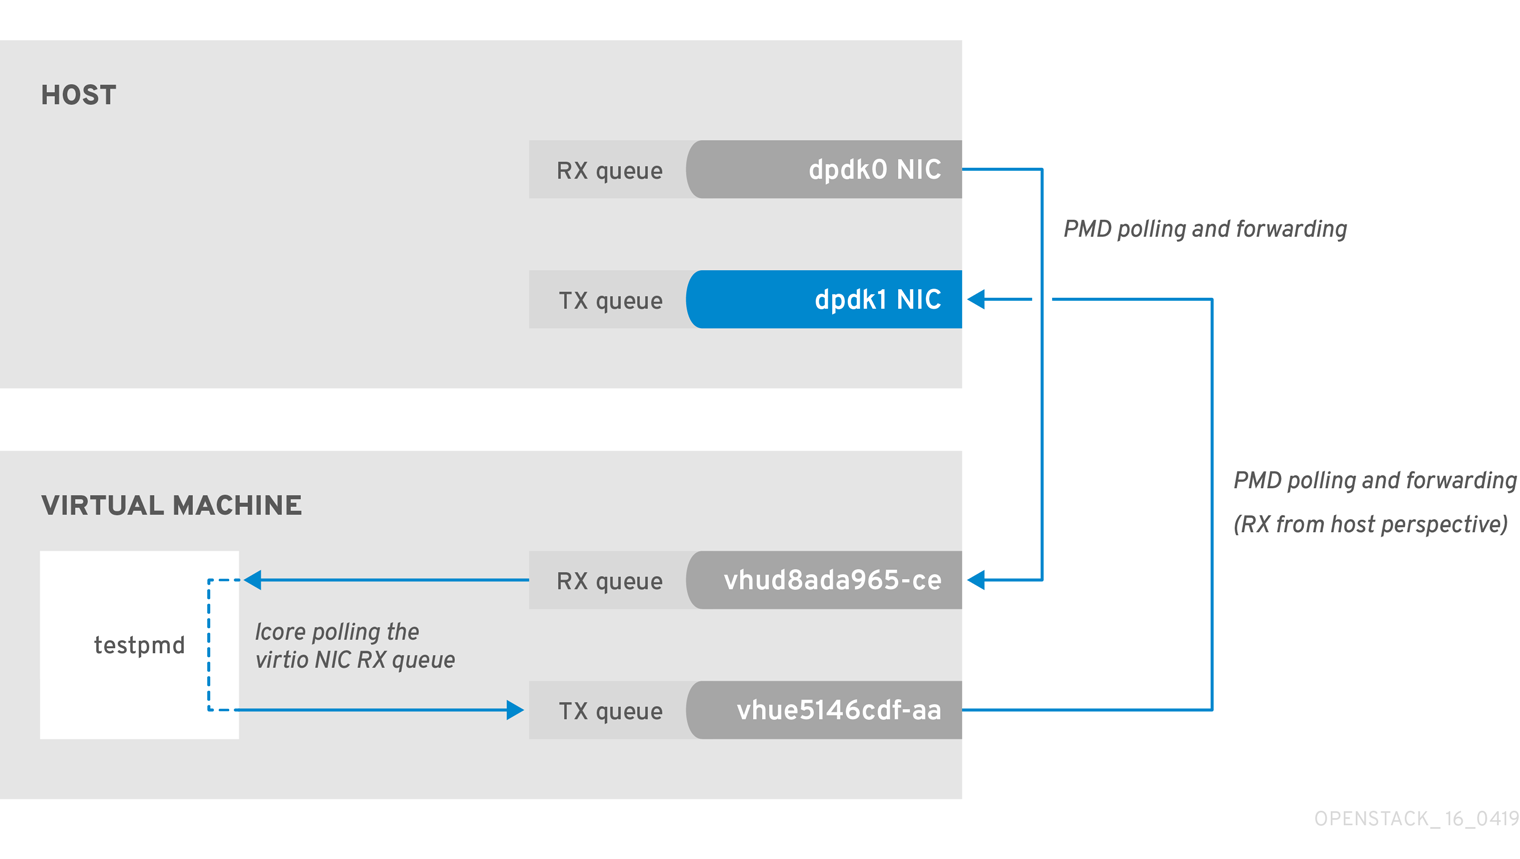
The following command shows statistics from the dpdk1 interface. If tx_dropped is greater than zero and growing rapidly, open a support case with Red Hat.
ovs-vsctl --column statistics list interface dpdk1

statistics          : {mac_local_errors=0, mac_remote_errors=0, "rx_1024_to_1522_packets"=26,
"rx_128_to_255_packets"=243, "rx_1523_to_max_packets"=0, "rx_1_to_64_packets"=102602, "rx_256_to_511_packets"=6100,
"rx_512_to_1023_packets"=27, "rx_65_to_127_packets"=16488, rx_broadcast_packets=2751, rx_bytes=7718218,
rx_crc_errors=0, rx_dropped=0, rx_errors=0, rx_fragmented_errors=0, rx_illegal_byte_errors=0, rx_jabber_errors=0,
rx_length_errors=0, rx_mac_short_dropped=0, rx_mbuf_allocation_errors=0, rx_oversize_errors=0, rx_packets=125486,
rx_undersized_errors=0, "tx_1024_to_1522_packets"=63, "tx_128_to_255_packets"=319, "tx_1523_to_max_packets"=0,
"tx_1_to_64_packets"=1053, "tx_256_to_511_packets"=50, "tx_512_to_1023_packets"=68, "tx_65_to_127_packets"=7732,
tx_broadcast_packets=12, tx_bytes=466813, tx_dropped=0, tx_errors=0, tx_link_down_dropped=0,
tx_multicast_packets=5642, tx_packets=9285}
If you see these types of packet losses, consider reconfiguring the memory channels.
- To calculate memory channels, see: Memory parameters in the Network Functions Virtualization Planning and Conifguration Guide.
- To determine the number of memory channels, see: How to determine the number of memory channels for NeutronDpdkMemoryChannels or OvsDpdkMemoryChannels in Red Hat OpenStack Platform.