
Chapter 6. Logs
Red Hat OpenStack Platform (RHOSP) writes informational messages to specific log files; you can use these messages for troubleshooting and monitoring system events.
You do not need to attach the individual log files to your support cases manually. The sosreport utility gathers the required logs automatically.
6.1. Location of log files for OpenStack services
Each OpenStack component has a separate logging directory containing files specific to a running service.
6.1.1. Bare Metal Provisioning (ironic) log files
| Service | Service Name | Log Path |
|---|---|---|
| OpenStack Ironic API | openstack-ironic-api.service | /var/log/containers/ironic/ironic-api.log |
| OpenStack Ironic Conductor | openstack-ironic-conductor.service | /var/log/containers/ironic/ironic-conductor.log |
6.1.2. Block Storage (cinder) log files
| Service | Service Name | Log Path |
|---|---|---|
| Block Storage API | openstack-cinder-api.service | /var/log/containers/cinder-api.log |
| Block Storage Backup | openstack-cinder-backup.service | /var/log/containers/cinder/backup.log |
| Informational messages | The cinder-manage command | /var/log/containers/cinder/cinder-manage.log |
| Block Storage Scheduler | openstack-cinder-scheduler.service | /var/log/containers/cinder/scheduler.log |
| Block Storage Volume | openstack-cinder-volume.service | /var/log/containers/cinder/volume.log |
6.1.3. Compute (nova) log files
| Service | Service Name | Log Path |
|---|---|---|
| OpenStack Compute API service | openstack-nova-api.service | /var/log/containers/nova/nova-api.log |
| OpenStack Compute certificate server | openstack-nova-cert.service | /var/log/containers/nova/nova-cert.log |
| OpenStack Compute service | openstack-nova-compute.service | /var/log/containers/nova/nova-compute.log |
| OpenStack Compute Conductor service | openstack-nova-conductor.service | /var/log/containers/nova/nova-conductor.log |
| OpenStack Compute VNC console authentication server | openstack-nova-consoleauth.service | /var/log/containers/nova/nova-consoleauth.log |
| Informational messages | nova-manage command | /var/log/containers/nova/nova-manage.log |
| OpenStack Compute NoVNC Proxy service | openstack-nova-novncproxy.service | /var/log/containers/nova/nova-novncproxy.log |
| OpenStack Compute Scheduler service | openstack-nova-scheduler.service | /var/log/containers/nova/nova-scheduler.log |
6.1.4. Dashboard (horizon) log files
| Service | Service Name | Log Path |
|---|---|---|
| Log of certain user interactions | Dashboard interface | /var/log/containers/horizon/horizon.log |
The Apache HTTP server uses several additional log files for the Dashboard web interface, which you can access by using a web browser or command-line client, for example, keystone and nova. The following log files can be helpful in tracking the usage of the Dashboard and diagnosing faults:
| Purpose | Log Path |
|---|---|
| All processed HTTP requests | /var/log/containers/httpd/horizon_access.log |
| HTTP errors | /var/log/containers/httpd/horizon_error.log |
| Admin-role API requests | /var/log/containers/httpd/keystone_wsgi_admin_access.log |
| Admin-role API errors | /var/log/containers/httpd/keystone_wsgi_admin_error.log |
| Member-role API requests | /var/log/containers/httpd/keystone_wsgi_main_access.log |
| Member-role API errors | /var/log/containers/httpd/keystone_wsgi_main_error.log |
There is also /var/log/containers/httpd/default_error.log, which stores errors reported by other web services running on the same host.
6.1.5. Data Processing (sahara) log files
| Service | Service Name | Log Path |
|---|---|---|
| Sahara API Server |
openstack-sahara-all.service |
/var/log/containers/sahara/sahara-all.log |
| Sahara Engine Server | openstack-sahara-engine.service | /var/log/containers/messages |
6.1.6. Database as a Service (trove) log files
| Service | Service Name | Log Path |
|---|---|---|
| OpenStack Trove API Service | openstack-trove-api.service | /var/log/containers/trove/trove-api.log |
| OpenStack Trove Conductor Service | openstack-trove-conductor.service | /var/log/containers/trove/trove-conductor.log |
| OpenStack Trove guestagent Service | openstack-trove-guestagent.service | /var/log/containers/trove/logfile.txt |
| OpenStack Trove taskmanager Service | openstack-trove-taskmanager.service | /var/log/containers/trove/trove-taskmanager.log |
6.1.7. Identity Service (keystone) log files
| Service | Service Name | Log Path |
|---|---|---|
| OpenStack Identity Service | openstack-keystone.service | /var/log/containers/keystone/keystone.log |
6.1.8. Image Service (glance) log files
| Service | Service Name | Log Path |
|---|---|---|
| OpenStack Image Service API server | openstack-glance-api.service | /var/log/containers/glance/api.log |
| OpenStack Image Service Registry server | openstack-glance-registry.service | /var/log/containers/glance/registry.log |
6.1.9. Networking (neutron) log files
| Service | Service Name | Log Path |
|---|---|---|
| OpenStack Neutron DHCP Agent | neutron-dhcp-agent.service | /var/log/containers/neutron/dhcp-agent.log |
| OpenStack Networking Layer 3 Agent | neutron-l3-agent.service | /var/log/containers/neutron/l3-agent.log |
| Metadata agent service | neutron-metadata-agent.service | /var/log/containers/neutron/metadata-agent.log |
| Metadata namespace proxy | n/a | /var/log/containers/neutron/neutron-ns-metadata-proxy-UUID.log |
| Open vSwitch agent | neutron-openvswitch-agent.service | /var/log/containers/neutron/openvswitch-agent.log |
| OpenStack Networking service | neutron-server.service | /var/log/containers/neutron/server.log |
6.1.10. Object Storage (swift) log files
OpenStack Object Storage sends logs to the system logging facility only.
By default, all Object Storage log files go to /var/log/containers/swift/swift.log, using the local0, local1, and local2 syslog facilities.
The log messages of Object Storage are classified in to two broad categories: those by REST API services and those by background daemons. The API service messages contain one line per API request, in a manner similar to popular HTTP servers; both the frontend (Proxy) and backend (Account, Container, Object) services post such messages. The daemon messages are less structured and typically contain human-readable information about daemons performing their periodic tasks. However, regardless of which part of Object Storage produces the message, the source identity is always at the beginning of the line.
Here is an example of a proxy message:
Apr 20 15:20:34 rhev-a24c-01 proxy-server: 127.0.0.1 127.0.0.1 20/Apr/2015/19/20/34 GET /v1/AUTH_zaitcev%3Fformat%3Djson%26marker%3Dtestcont HTTP/1.0 200 - python-swiftclient-2.1.0 AUTH_tk737d6... - 2 - txc454fa8ea4844d909820a-0055355182 - 0.0162 - - 1429557634.806570053 1429557634.822791100
Here is an example of ad-hoc messages from background daemons:
Apr 27 17:08:15 rhev-a24c-02 object-auditor: Object audit (ZBF). Since Mon Apr 27 21:08:15 2015: Locally: 1 passed, 0 quarantined, 0 errors files/sec: 4.34 , bytes/sec: 0.00, Total time: 0.23, Auditing time: 0.00, Rate: 0.00
Apr 27 17:08:16 rhev-a24c-02 object-auditor: Object audit (ZBF) "forever" mode completed: 0.56s. Total quarantined: 0, Total errors: 0, Total files/sec: 14.31, Total bytes/sec: 0.00, Auditing time: 0.02, Rate: 0.04
Apr 27 17:08:16 rhev-a24c-02 account-replicator: Beginning replication run
Apr 27 17:08:16 rhev-a24c-02 account-replicator: Replication run OVER
Apr 27 17:08:16 rhev-a24c-02 account-replicator: Attempted to replicate 5 dbs in 0.12589 seconds (39.71876/s)
Apr 27 17:08:16 rhev-a24c-02 account-replicator: Removed 0 dbs
Apr 27 17:08:16 rhev-a24c-02 account-replicator: 10 successes, 0 failures
6.1.11. Orchestration (heat) log files
| Service | Service Name | Log Path |
|---|---|---|
| OpenStack Heat API Service | openstack-heat-api.service | /var/log/containers/heat/heat-api.log |
| OpenStack Heat Engine Service | openstack-heat-engine.service | /var/log/containers/heat/heat-engine.log |
| Orchestration service events | n/a | /var/log/containers/heat/heat-manage.log |
6.1.13. Telemetry (ceilometer) log files
| Service | Service Name | Log Path |
|---|---|---|
| OpenStack ceilometer notification agent | openstack-ceilometer-notification.service | /var/log/containers/ceilometer/agent-notification.log |
| OpenStack ceilometer alarm evaluation | openstack-ceilometer-alarm-evaluator.service | /var/log/containers/ceilometer/alarm-evaluator.log |
| OpenStack ceilometer alarm notification | openstack-ceilometer-alarm-notifier.service | /var/log/containers/ceilometer/alarm-notifier.log |
| OpenStack ceilometer API | httpd.service | /var/log/containers/ceilometer/api.log |
| Informational messages | MongoDB integration | /var/log/containers/ceilometer/ceilometer-dbsync.log |
| OpenStack ceilometer central agent | openstack-ceilometer-central.service | /var/log/containers/ceilometer/central.log |
| OpenStack ceilometer collection | openstack-ceilometer-collector.service | /var/log/containers/ceilometer/collector.log |
| OpenStack ceilometer compute agent | openstack-ceilometer-compute.service | /var/log/containers/ceilometer/compute.log |
6.1.14. Log files for supporting services
The following services are used by the core OpenStack components and have their own log directories and files.
| Service | Service Name | Log Path |
|---|---|---|
| Message broker (RabbitMQ) | rabbitmq-server.service |
/var/log/rabbitmq/rabbit@short_hostname.log |
| Database server (MariaDB) | mariadb.service | /var/log/mariadb/mariadb.log |
| Document-oriented database (MongoDB) | mongod.service | /var/log/mongodb/mongodb.log |
| Virtual network switch (Open vSwitch) | openvswitch-nonetwork.service |
/var/log/openvswitch/ovsdb-server.log |
6.2. The centralized log system architecture and components
Monitoring tools use a client-server model with the client deployed onto the Red Hat OpenStack Platform (RHOSP) overcloud nodes. The Fluentd service provides client-side centralized logging (CL). All RHOSP services generate and update log files. These log files record actions, errors, warnings, and other events. In a distributed environment like OpenStack, collecting these logs in a central location simplifies debugging and administration. Centralized logging allows you to have one central place to view logs across your entire OpenStack environment. These logs come from the operating system, such as syslog and audit log files, infrastructure components such as RabbitMQ and MariaDB, and OpenStack services such as Identity, Compute, and others. The centralized logging toolchain consists of the following components:
- Log Collection Agent (Fluentd)
- Log Relay/Transformer (Fluentd)
- Data Store (ElasticSearch)
- API/Presentation Layer (Kibana)
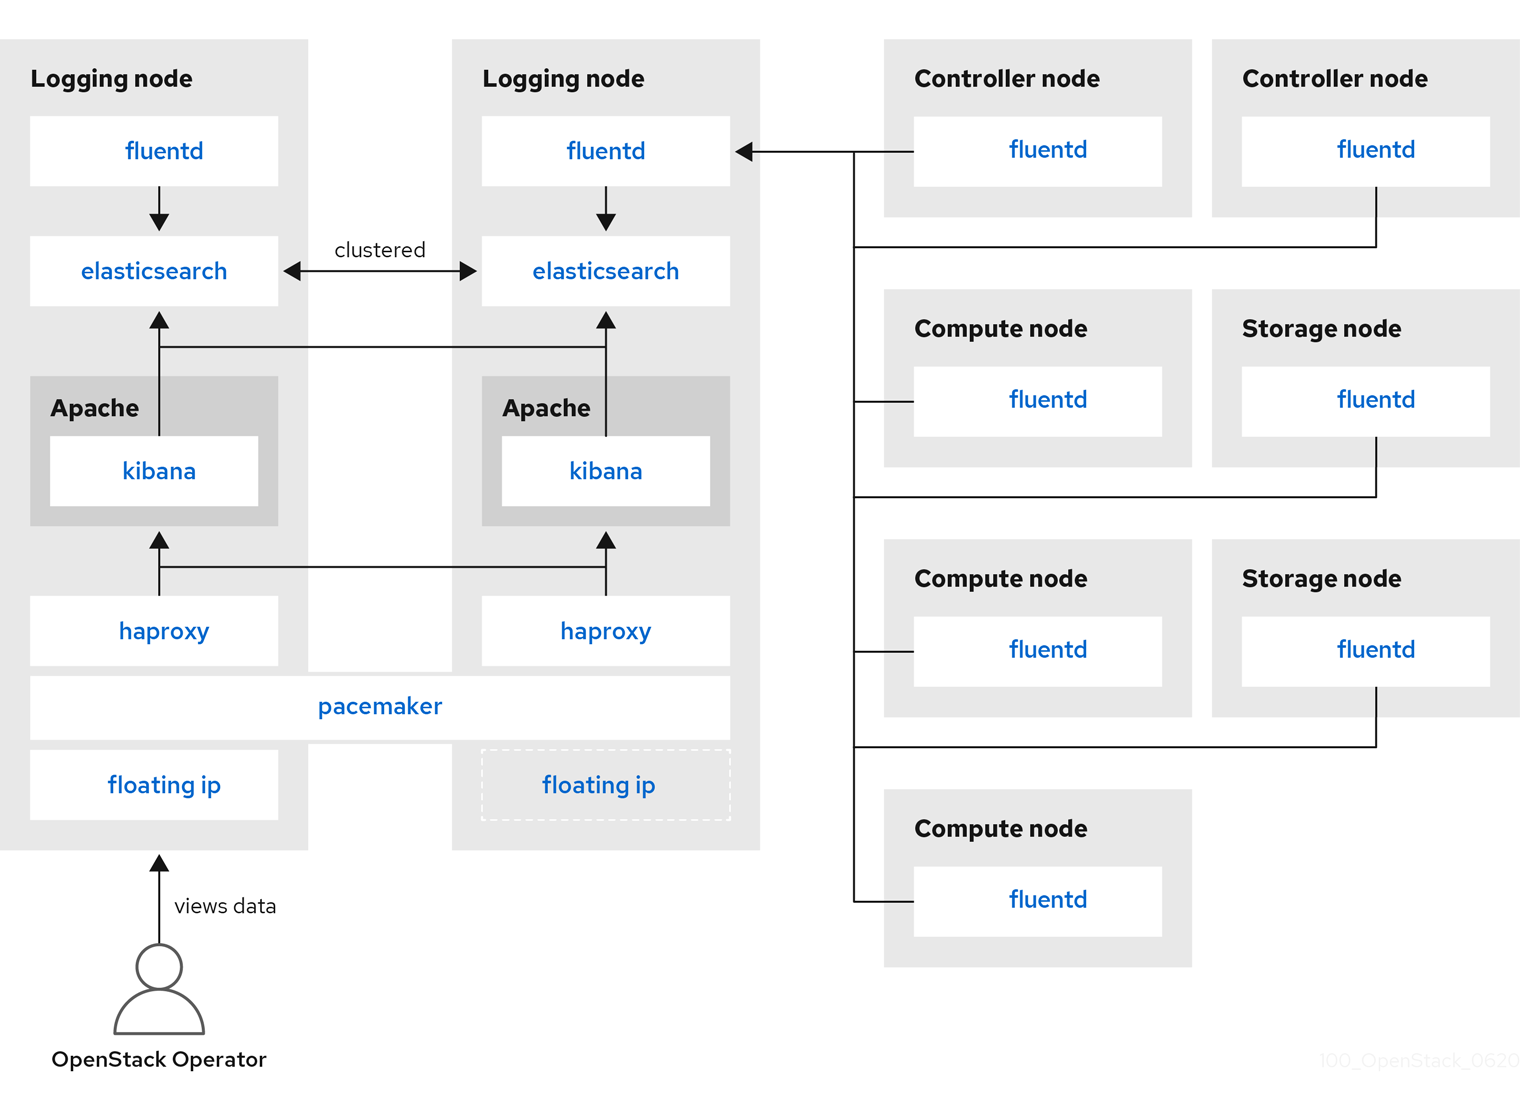
Red Hat OpenStack Platform director does not deploy the server-side components for centralized logging. Red Hat does not support the server-side components, including the ElasticSearch database, Kibana, and Fluentd with plug-ins running as a log aggregator. The centralized logging components and their interactions are described in the following diagrams.
Items shown in blue denote Red Hat-supported components.
Figure 6.1. Single HA deployment for Red Hat OpenStack Platform
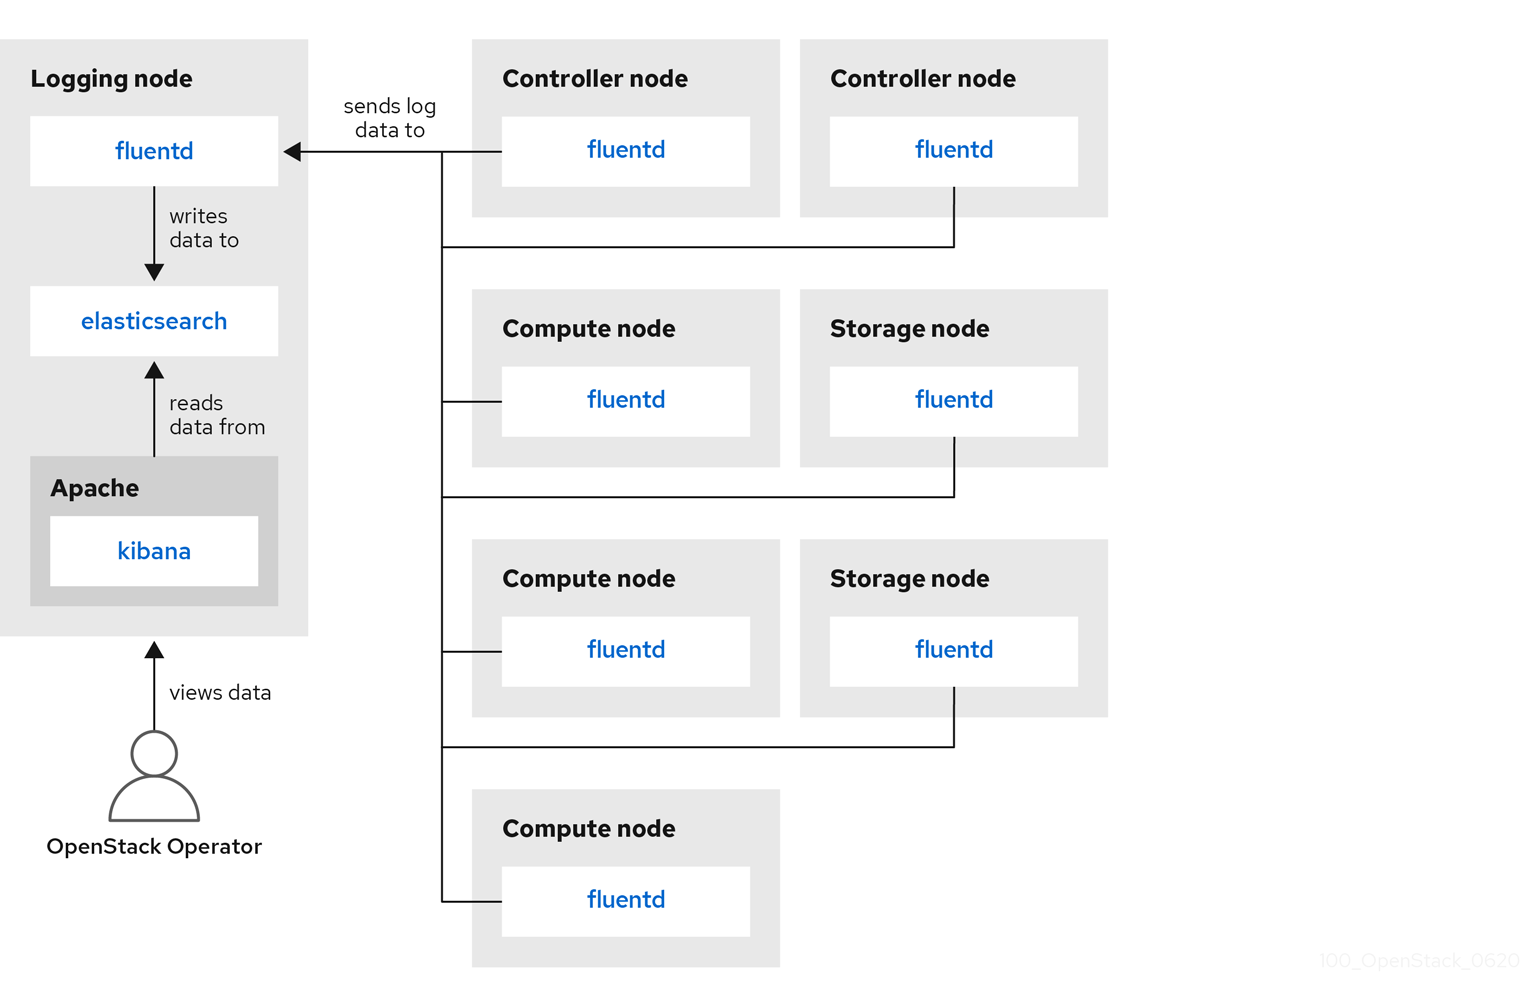
Figure 6.2. HA deployment for Red Hat OpenStack Platform
6.3. Overview of the installation of the logs service
The log collection agent Fluentd collects logs on the client side and sends these logs to a Fluentd instance running on the server side. This Fluentd instance redirects log records to Elasticsearch for storage.
6.4. Deploying Fluentd on all machines
Fluentd is a log collection agent and is part of the centralized logging toolchain. To deploy Fluentd on all machines, you must modify the LoggingServers parameter in the logging-environment.yaml file:
Prerequisites
- Ensure that Elasticsearch and Fluentd relay are installed on the server side. For more information, see the example deployment in the opstools-ansible project with which our client-side integration is compatible.
Procedure
-
Copy the
tripleo-heat-templates/environments/logging-environment.yamlfile to your home directory. In the copied file, create entries in the
LoggingServersparameter to suit your environment. The following snippet is an example configuration of theLoggingServersparameter:parameter_defaults: Simple configuration LoggingServers: - host: log0.example.com port: 24224 - host: log1.example.com port: 24224
Include the modified environment file in the
openstack overcloud deploycommand with any other environment files that are relevant to your environment and deploy. Replace<existing_overcloud_environment_files>with the list of environment files that are part of your existing deployment:$ openstack overcloud deploy \ <existing_overcloud_environment_files> \ -e /home/templates/environments/logging-environment.yaml \ ...
s .Additional resources
- For more information, see Section 6.5, “Configurable logging parameters”.
6.5. Configurable logging parameters
This table contains descriptions of the logging parameters that you can configure. You can find these parameters in the tripleo-heat-templates/puppet/services/logging/fluentd-config.yaml file.
| Parameter | Description |
|---|---|
| LoggingDefaultFormat | Default format used to parse messages from log files. |
| LoggingPosFilePath |
Directory in which to place Fluentd |
| LoggingDefaultGroups |
Add the Fluentd user to these groups. Override this parameter if you want to modify the default list of groups. Use the |
| LoggingExtraGroups |
Add the Fluentd user to these groups, in addition to the |
| LoggingDefaultFilters |
A list of Fluentd default filters. This list is passed verbatim to the |
| LoggingExtraFilters |
A list of additional Fluentd filters. This list is passed verbatim to the |
| LoggingUsesSSL |
A boolean value indicating whether or not to forward log messages using the |
| LoggingSSLKey |
PEM-encoded key for Fluentd CA certificate. The |
| LoggingSSLCertificate | PEM-encoded SSL CA certificate for Fluentd. |
| LoggingSSLKeyPassphrase |
Passphrase for the |
| LoggingSharedKey |
Shared secret for Fluentd |
| LoggingDefaultSources |
A list of default logging sources for Fluentd. Override this parameter to disable the default logging sources. Use the |
| LoggingExtraSources |
This list combines with the |
6.6. Overriding the default path for a log file
If you modify the default containers and the modification includes the path to the service log file, you must also modify the default log file path. Every composable service has a <service_name>LoggingSource parameter. For example, for nova-compute service, the parameter is NovaComputeLoggingSource.
Procedure
To override the default path for the nova-compute service, add the path to the
NovaComputeLoggingSourceparameter in your configuration file.NovaComputeLoggingSource: tag: openstack.nova.compute path: /some/other/path/nova-compute.logThe tag and path attributes are mandatory elements of the
<service_name>LoggingSourceparameter. On each service, the tag and the path are defined and the rest of the values are derived by default.You can modify the format for a specific service. This passes directly to the Fluentd configuration. The default format for the
LoggingDefaultFormatparameter is /(?<time>\d{4}-\d{2}-\d{2} \d{2}:\d{2}:\d{2}.\d+) (?<pid>\d+) (?<priority>\S+) (?<message>.*)$/ Use the following syntax:<service_name>LoggingSource: tag: <service_name>.tag path: <service_name>.path format: <service_name>.formatThe following snippet is an example of a more complex transformation:
 ServiceLoggingSource:
    tag: openstack.Service
    path: /var/log/containers/service/service.log
    format: multiline
    format_firstline: '/^\d{4}-\d{2}-\d{2} \d{2}:\d{2}:\d{2}.\d{3} \d+ \S+ \S+ \[(req-\S+ \S+ \S+ \S+ \S+ \S+|-)\]/'
    format1: '/^(?<Timestamp>\S+ \S+) (?<Pid>\d+) (?<log_level>\S+) (?<python_module>\S+) (\[(req-(?<request_id>\S+) (?<user_id>\S+) (?<tenant_id>\S+) (?<domain_id>\S+) (?<user_domain>\S+) (?<project_domain>\S+)|-)\])? (?<Payload>.*)?$/'
6.7. Verifying a successful deployment
To verify that centralized logging deployed successfully, view logs to see if the output matches expectations. You can use third-party visualization software, for example, Kibana.