
Observability
Observability features including administrator and developer metrics, cluster logging, and tracing.
Abstract
Chapter 1. Administrator metrics
1.1. Serverless administrator metrics
Metrics enable cluster administrators to monitor how OpenShift Serverless cluster components and workloads are performing.
You can view different metrics for OpenShift Serverless by navigating to Dashboards in the web console Administrator perspective.
1.1.1. Prerequisites
- See the OpenShift Container Platform documentation on Managing metrics for information about enabling metrics for your cluster.
- You have access to an account with cluster administrator access (or dedicated administrator access for OpenShift Dedicated or Red Hat OpenShift Service on AWS).
- You have access to the Administrator perspective in the web console.
If Service Mesh is enabled with mTLS, metrics for Knative Serving are disabled by default because Service Mesh prevents Prometheus from scraping metrics.
For information about resolving this issue, see Enabling Knative Serving metrics when using Service Mesh with mTLS.
Scraping the metrics does not affect autoscaling of a Knative service, because scraping requests do not go through the activator. Consequently, no scraping takes place if no pods are running.
1.2. Serverless controller metrics
The following metrics are emitted by any component that implements a controller logic. These metrics show details about reconciliation operations and the work queue behavior upon which reconciliation requests are added to the work queue.
| Metric name | Description | Type | Tags | Unit |
|---|---|---|---|---|
|
| The depth of the work queue. | Gauge |
| Integer (no units) |
|
| The number of reconcile operations. | Counter |
| Integer (no units) |
|
| The latency of reconcile operations. | Histogram |
| Milliseconds |
|
| The total number of add actions handled by the work queue. | Counter |
| Integer (no units) |
|
| The length of time an item stays in the work queue before being requested. | Histogram |
| Seconds |
|
| The total number of retries that have been handled by the work queue. | Counter |
| Integer (no units) |
|
| The length of time it takes to process and item from the work queue. | Histogram |
| Seconds |
|
| The length of time that outstanding work queue items have been in progress. | Histogram |
| Seconds |
|
| The length of time that the longest outstanding work queue items has been in progress. | Histogram |
| Seconds |
1.3. Webhook metrics
Webhook metrics report useful information about operations. For example, if a large number of operations fail, this might indicate an issue with a user-created resource.
| Metric name | Description | Type | Tags | Unit |
|---|---|---|---|---|
|
| The number of requests that are routed to the webhook. | Counter |
| Integer (no units) |
|
| The response time for a webhook request. | Histogram |
| Milliseconds |
1.4. Knative Eventing metrics
Cluster administrators can view the following metrics for Knative Eventing components.
By aggregating the metrics from HTTP code, events can be separated into two categories; successful events (2xx) and failed events (5xx).
1.4.1. Broker ingress metrics
You can use the following metrics to debug the broker ingress, see how it is performing, and see which events are being dispatched by the ingress component.
| Metric name | Description | Type | Tags | Unit |
|---|---|---|---|---|
|
| Number of events received by a broker. | Counter |
| Integer (no units) |
|
| The time taken to dispatch an event to a channel. | Histogram |
| Milliseconds |
1.4.2. Broker filter metrics
You can use the following metrics to debug broker filters, see how they are performing, and see which events are being dispatched by the filters. You can also measure the latency of the filtering action on an event.
| Metric name | Description | Type | Tags | Unit |
|---|---|---|---|---|
|
| Number of events received by a broker. | Counter |
| Integer (no units) |
|
| The time taken to dispatch an event to a channel. | Histogram |
| Milliseconds |
|
| The time it takes to process an event before it is dispatched to a trigger subscriber. | Histogram |
| Milliseconds |
1.4.3. InMemoryChannel dispatcher metrics
You can use the following metrics to debug InMemoryChannel channels, see how they are performing, and see which events are being dispatched by the channels.
| Metric name | Description | Type | Tags | Unit |
|---|---|---|---|---|
|
|
Number of events dispatched by | Counter |
| Integer (no units) |
|
|
The time taken to dispatch an event from an | Histogram |
| Milliseconds |
1.4.4. Event source metrics
You can use the following metrics to verify that events have been delivered from the event source to the connected event sink.
| Metric name | Description | Type | Tags | Unit |
|---|---|---|---|---|
|
| Number of events sent by the event source. | Counter |
| Integer (no units) |
|
| Number of retried events sent by the event source after initially failing to be delivered. | Counter |
| Integer (no units) |
1.5. Knative Serving metrics
Cluster administrators can view the following metrics for Knative Serving components.
1.5.1. Activator metrics
You can use the following metrics to understand how applications respond when traffic passes through the activator.
| Metric name | Description | Type | Tags | Unit |
|---|---|---|---|---|
|
| The number of concurrent requests that are routed to the activator, or average concurrency over a reporting period. | Gauge |
| Integer (no units) |
|
| The number of requests that are routed to activator. These are requests that have been fulfilled from the activator handler. | Counter |
| Integer (no units) |
|
| The response time in milliseconds for a fulfilled, routed request. | Histogram |
| Milliseconds |
1.5.2. Autoscaler metrics
The autoscaler component exposes a number of metrics related to autoscaler behavior for each revision. For example, at any given time, you can monitor the targeted number of pods the autoscaler tries to allocate for a service, the average number of requests per second during the stable window, or whether the autoscaler is in panic mode if you are using the Knative pod autoscaler (KPA).
| Metric name | Description | Type | Tags | Unit |
|---|---|---|---|---|
|
| The number of pods the autoscaler tries to allocate for a service. | Gauge |
| Integer (no units) |
|
| The excess burst capacity served over the stable window. | Gauge |
| Integer (no units) |
|
| The average number of requests for each observed pod over the stable window. | Gauge |
| Integer (no units) |
|
| The average number of requests for each observed pod over the panic window. | Gauge |
| Integer (no units) |
|
| The number of concurrent requests that the autoscaler tries to send to each pod. | Gauge |
| Integer (no units) |
|
| The average number of requests-per-second for each observed pod over the stable window. | Gauge |
| Integer (no units) |
|
| The average number of requests-per-second for each observed pod over the panic window. | Gauge |
| Integer (no units) |
|
| The number of requests-per-second that the autoscaler targets for each pod. | Gauge |
| Integer (no units) |
|
|
This value is | Gauge |
| Integer (no units) |
|
| The number of pods that the autoscaler has requested from the Kubernetes cluster. | Gauge |
| Integer (no units) |
|
| The number of pods that are allocated and currently have a ready state. | Gauge |
| Integer (no units) |
|
| The number of pods that have a not ready state. | Gauge |
| Integer (no units) |
|
| The number of pods that are currently pending. | Gauge |
| Integer (no units) |
|
| The number of pods that are currently terminating. | Gauge |
| Integer (no units) |
1.5.3. Go runtime metrics
Each Knative Serving control plane process emits a number of Go runtime memory statistics (MemStats).
The name tag for each metric is an empty tag.
| Metric name | Description | Type | Tags | Unit |
|---|---|---|---|---|
|
|
The number of bytes of allocated heap objects. This metric is the same as | Gauge |
| Integer (no units) |
|
| The cumulative bytes allocated for heap objects. | Gauge |
| Integer (no units) |
|
| The total bytes of memory obtained from the operating system. | Gauge |
| Integer (no units) |
|
| The number of pointer lookups performed by the runtime. | Gauge |
| Integer (no units) |
|
| The cumulative count of heap objects allocated. | Gauge |
| Integer (no units) |
|
| The cumulative count of heap objects that have been freed. | Gauge |
| Integer (no units) |
|
| The number of bytes of allocated heap objects. | Gauge |
| Integer (no units) |
|
| The number of bytes of heap memory obtained from the operating system. | Gauge |
| Integer (no units) |
|
| The number of bytes in idle, unused spans. | Gauge |
| Integer (no units) |
|
| The number of bytes in spans that are currently in use. | Gauge |
| Integer (no units) |
|
| The number of bytes of physical memory returned to the operating system. | Gauge |
| Integer (no units) |
|
| The number of allocated heap objects. | Gauge |
| Integer (no units) |
|
| The number of bytes in stack spans that are currently in use. | Gauge |
| Integer (no units) |
|
| The number of bytes of stack memory obtained from the operating system. | Gauge |
| Integer (no units) |
|
|
The number of bytes of allocated | Gauge |
| Integer (no units) |
|
|
The number of bytes of memory obtained from the operating system for | Gauge |
| Integer (no units) |
|
|
The number of bytes of allocated | Gauge |
| Integer (no units) |
|
|
The number of bytes of memory obtained from the operating system for | Gauge |
| Integer (no units) |
|
| The number of bytes of memory in profiling bucket hash tables. | Gauge |
| Integer (no units) |
|
| The number of bytes of memory in garbage collection metadata. | Gauge |
| Integer (no units) |
|
| The number of bytes of memory in miscellaneous, off-heap runtime allocations. | Gauge |
| Integer (no units) |
|
| The target heap size of the next garbage collection cycle. | Gauge |
| Integer (no units) |
|
| The time that the last garbage collection was completed in Epoch or Unix time. | Gauge |
| Nanoseconds |
|
| The cumulative time in garbage collection stop-the-world pauses since the program started. | Gauge |
| Nanoseconds |
|
| The number of completed garbage collection cycles. | Gauge |
| Integer (no units) |
|
| The number of garbage collection cycles that were forced due to an application calling the garbage collection function. | Gauge |
| Integer (no units) |
|
| The fraction of the available CPU time of the program that has been used by the garbage collector since the program started. | Gauge |
| Integer (no units) |
Chapter 2. Developer metrics
2.1. Serverless developer metrics overview
Metrics enable developers to monitor how Knative services are performing. You can use the OpenShift Container Platform monitoring stack to record and view health checks and metrics for your Knative services.
You can view different metrics for OpenShift Serverless by navigating to Dashboards in the web console Developer perspective.
If Service Mesh is enabled with mTLS, metrics for Knative Serving are disabled by default because Service Mesh prevents Prometheus from scraping metrics.
For information about resolving this issue, see Enabling Knative Serving metrics when using Service Mesh with mTLS.
Scraping the metrics does not affect autoscaling of a Knative service, because scraping requests do not go through the activator. Consequently, no scraping takes place if no pods are running.
2.1.1. Additional resources for OpenShift Container Platform
2.2. Knative service metrics exposed by default
Table 2.1. Metrics exposed by default for each Knative service on port 9090
| Metric name, unit, and type | Description | Metric tags |
|---|---|---|
|
Metric unit: dimensionless Metric type: gauge | Number of requests per second that hit the queue proxy.
Formula:
| destination_configuration="event-display", destination_namespace="pingsource1", destination_pod="event-display-00001-deployment-6b455479cb-75p6w", destination_revision="event-display-00001" |
|
Metric unit: dimensionless Metric type: gauge | Number of proxied requests per second.
Formula:
| |
|
Metric unit: dimensionless Metric type: gauge | Number of requests currently being handled by this pod.
Average concurrency is calculated at the networking
| destination_configuration="event-display", destination_namespace="pingsource1", destination_pod="event-display-00001-deployment-6b455479cb-75p6w", destination_revision="event-display-00001" |
|
Metric unit: dimensionless Metric type: gauge | Number of proxied requests currently being handled by this pod:
| destination_configuration="event-display", destination_namespace="pingsource1", destination_pod="event-display-00001-deployment-6b455479cb-75p6w", destination_revision="event-display-00001" |
|
Metric unit: seconds Metric type: gauge | The number of seconds that the process has been up. | destination_configuration="event-display", destination_namespace="pingsource1", destination_pod="event-display-00001-deployment-6b455479cb-75p6w", destination_revision="event-display-00001" |
Table 2.2. Metrics exposed by default for each Knative service on port 9091
| Metric name, unit, and type | Description | Metric tags |
|---|---|---|
|
Metric unit: dimensionless Metric type: counter |
The number of requests that are routed to | configuration_name="event-display", container_name="queue-proxy", namespace_name="apiserversource1", pod_name="event-display-00001-deployment-658fd4f9cf-qcnr5", response_code="200", response_code_class="2xx", revision_name="event-display-00001", service_name="event-display" |
|
Metric unit: milliseconds Metric type: histogram | The response time in milliseconds. | configuration_name="event-display", container_name="queue-proxy", namespace_name="apiserversource1", pod_name="event-display-00001-deployment-658fd4f9cf-qcnr5", response_code="200", response_code_class="2xx", revision_name="event-display-00001", service_name="event-display" |
|
Metric unit: dimensionless Metric type: gauge |
The current number of items in the serving and waiting queue, or not reported if unlimited concurrency. | configuration_name="event-display", container_name="queue-proxy", namespace_name="apiserversource1", pod_name="event-display-00001-deployment-658fd4f9cf-qcnr5", response_code="200", response_code_class="2xx", revision_name="event-display-00001", service_name="event-display" |
2.3. Knative service with custom application metrics
You can extend the set of metrics exported by a Knative service. The exact implementation depends on your application and the language used.
The following listing implements a sample Go application that exports the count of processed events custom metric.
package main

import (
  "fmt"
  "log"
  "net/http"
  "os"

  "github.com/prometheus/client_golang/prometheus" 1
  "github.com/prometheus/client_golang/prometheus/promauto"
  "github.com/prometheus/client_golang/prometheus/promhttp"
)

var (
  opsProcessed = promauto.NewCounter(prometheus.CounterOpts{ 2
     Name: "myapp_processed_ops_total",
     Help: "The total number of processed events",
  })
)


func handler(w http.ResponseWriter, r *http.Request) {
  log.Print("helloworld: received a request")
  target := os.Getenv("TARGET")
  if target == "" {
     target = "World"
  }
  fmt.Fprintf(w, "Hello %s!\n", target)
  opsProcessed.Inc() 3
}

func main() {
  log.Print("helloworld: starting server...")

  port := os.Getenv("PORT")
  if port == "" {
     port = "8080"
  }

  http.HandleFunc("/", handler)

  // Separate server for metrics requests
  go func() { 4
     mux := http.NewServeMux()
     server := &http.Server{
        Addr: fmt.Sprintf(":%s", "9095"),
        Handler: mux,
     }
     mux.Handle("/metrics", promhttp.Handler())
     log.Printf("prometheus: listening on port %s", 9095)
     log.Fatal(server.ListenAndServe())
  }()

   // Use same port as normal requests for metrics
  //http.Handle("/metrics", promhttp.Handler()) 5
  log.Printf("helloworld: listening on port %s", port)
  log.Fatal(http.ListenAndServe(fmt.Sprintf(":%s", port), nil))
}
2.4. Configuration for scraping custom metrics
Custom metrics scraping is performed by an instance of Prometheus purposed for user workload monitoring. After you enable user workload monitoring and create the application, you need a configuration that defines how the monitoring stack will scrape the metrics.
The following sample configuration defines the ksvc for your application and configures the service monitor. The exact configuration depends on your application and how it exports the metrics.
apiVersion: serving.knative.dev/v1 1
kind: Service
metadata:
  name: helloworld-go
spec:
  template:
    metadata:
      labels:
        app: helloworld-go
      annotations:
    spec:
      containers:
      - image: docker.io/skonto/helloworld-go:metrics
        resources:
          requests:
            cpu: "200m"
        env:
        - name: TARGET
          value: "Go Sample v1"
---
apiVersion: monitoring.coreos.com/v1 2
kind: ServiceMonitor
metadata:
  labels:
  name: helloworld-go-sm
spec:
  endpoints:
  - port: queue-proxy-metrics
    scheme: http
  - port: app-metrics
    scheme: http
  namespaceSelector: {}
  selector:
    matchLabels:
       name:  helloworld-go-sm
---
apiVersion: v1 3
kind: Service
metadata:
  labels:
    name:  helloworld-go-sm
  name:  helloworld-go-sm
spec:
  ports:
  - name: queue-proxy-metrics
    port: 9091
    protocol: TCP
    targetPort: 9091
  - name: app-metrics
    port: 9095
    protocol: TCP
    targetPort: 9095
  selector:
    serving.knative.dev/service: helloworld-go
  type: ClusterIP
2.5. Examining metrics of a service
After you have configured the application to export the metrics and the monitoring stack to scrape them, you can examine the metrics in the web console.
Prerequisites
- You have logged in to the OpenShift Container Platform web console.
- You have installed the OpenShift Serverless Operator and Knative Serving.
Procedure
Optional: Run requests against your application that you will be able to see in the metrics:
$ hello_route=$(oc get ksvc helloworld-go -n ns1 -o jsonpath='{.status.url}') && \
    curl $hello_route
Example output
Hello Go Sample v1!
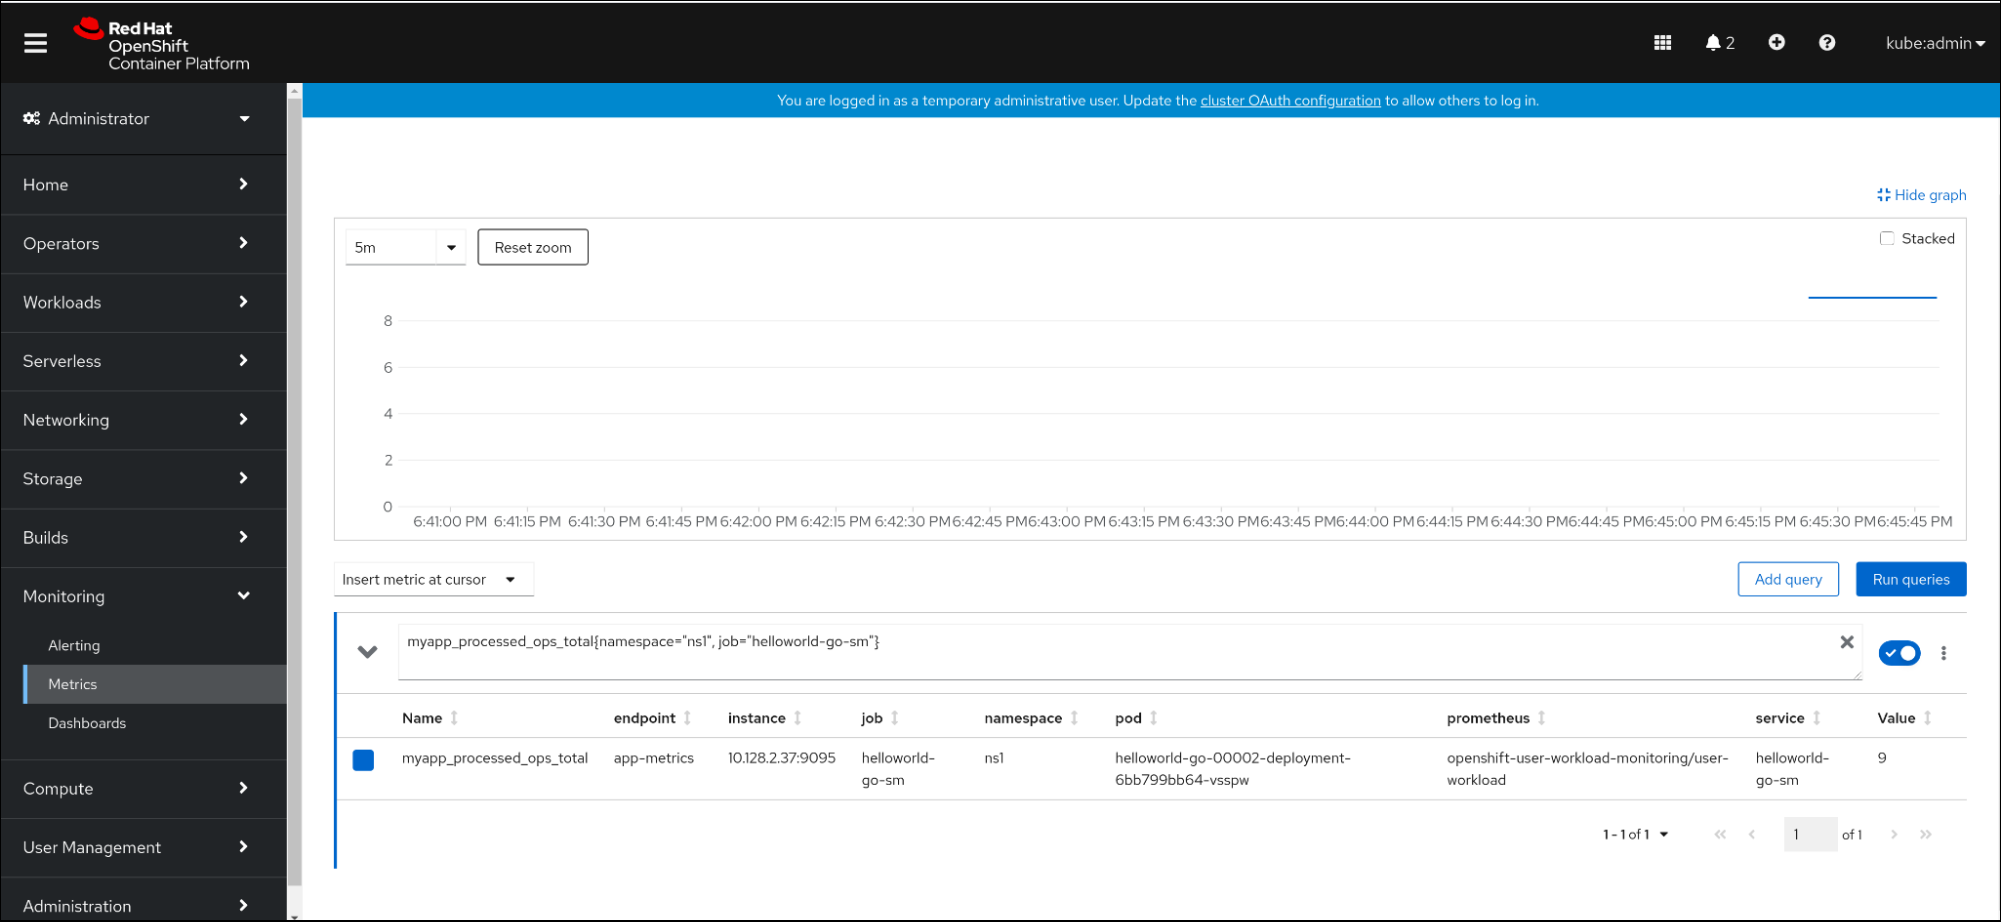
- In the web console, navigate to the Observe → Metrics interface.
In the input field, enter the query for the metric you want to observe, for example:
revision_app_request_count{namespace="ns1", job="helloworld-go-sm"}Another example:
myapp_processed_ops_total{namespace="ns1", job="helloworld-go-sm"}Observe the visualized metrics:
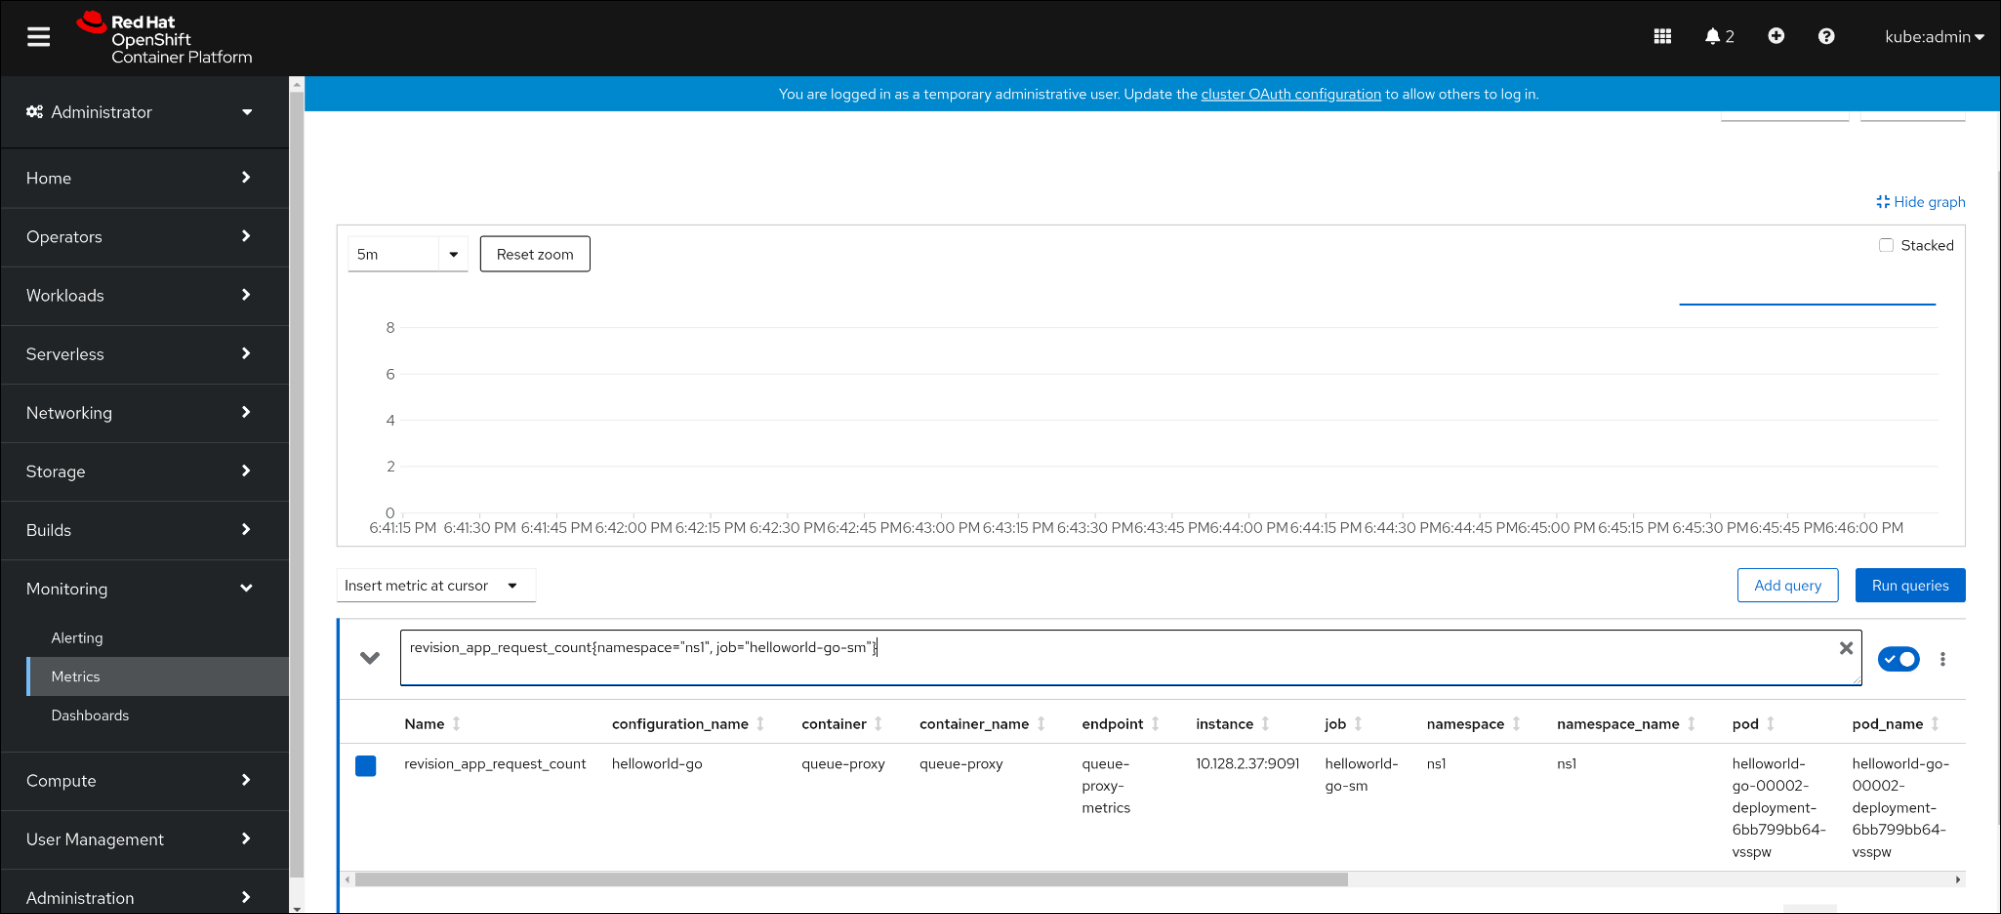
2.5.1. Queue proxy metrics
Each Knative service has a proxy container that proxies the connections to the application container. A number of metrics are reported for the queue proxy performance.
You can use the following metrics to measure if requests are queued at the proxy side and the actual delay in serving requests at the application side.
| Metric name | Description | Type | Tags | Unit |
|---|---|---|---|---|
|
|
The number of requests that are routed to | Counter |
| Integer (no units) |
|
| The response time of revision requests. | Histogram |
| Milliseconds |
|
|
The number of requests that are routed to the | Counter |
| Integer (no units) |
|
| The response time of revision app requests. | Histogram |
| Milliseconds |
|
|
The current number of items in the | Gauge |
| Integer (no units) |
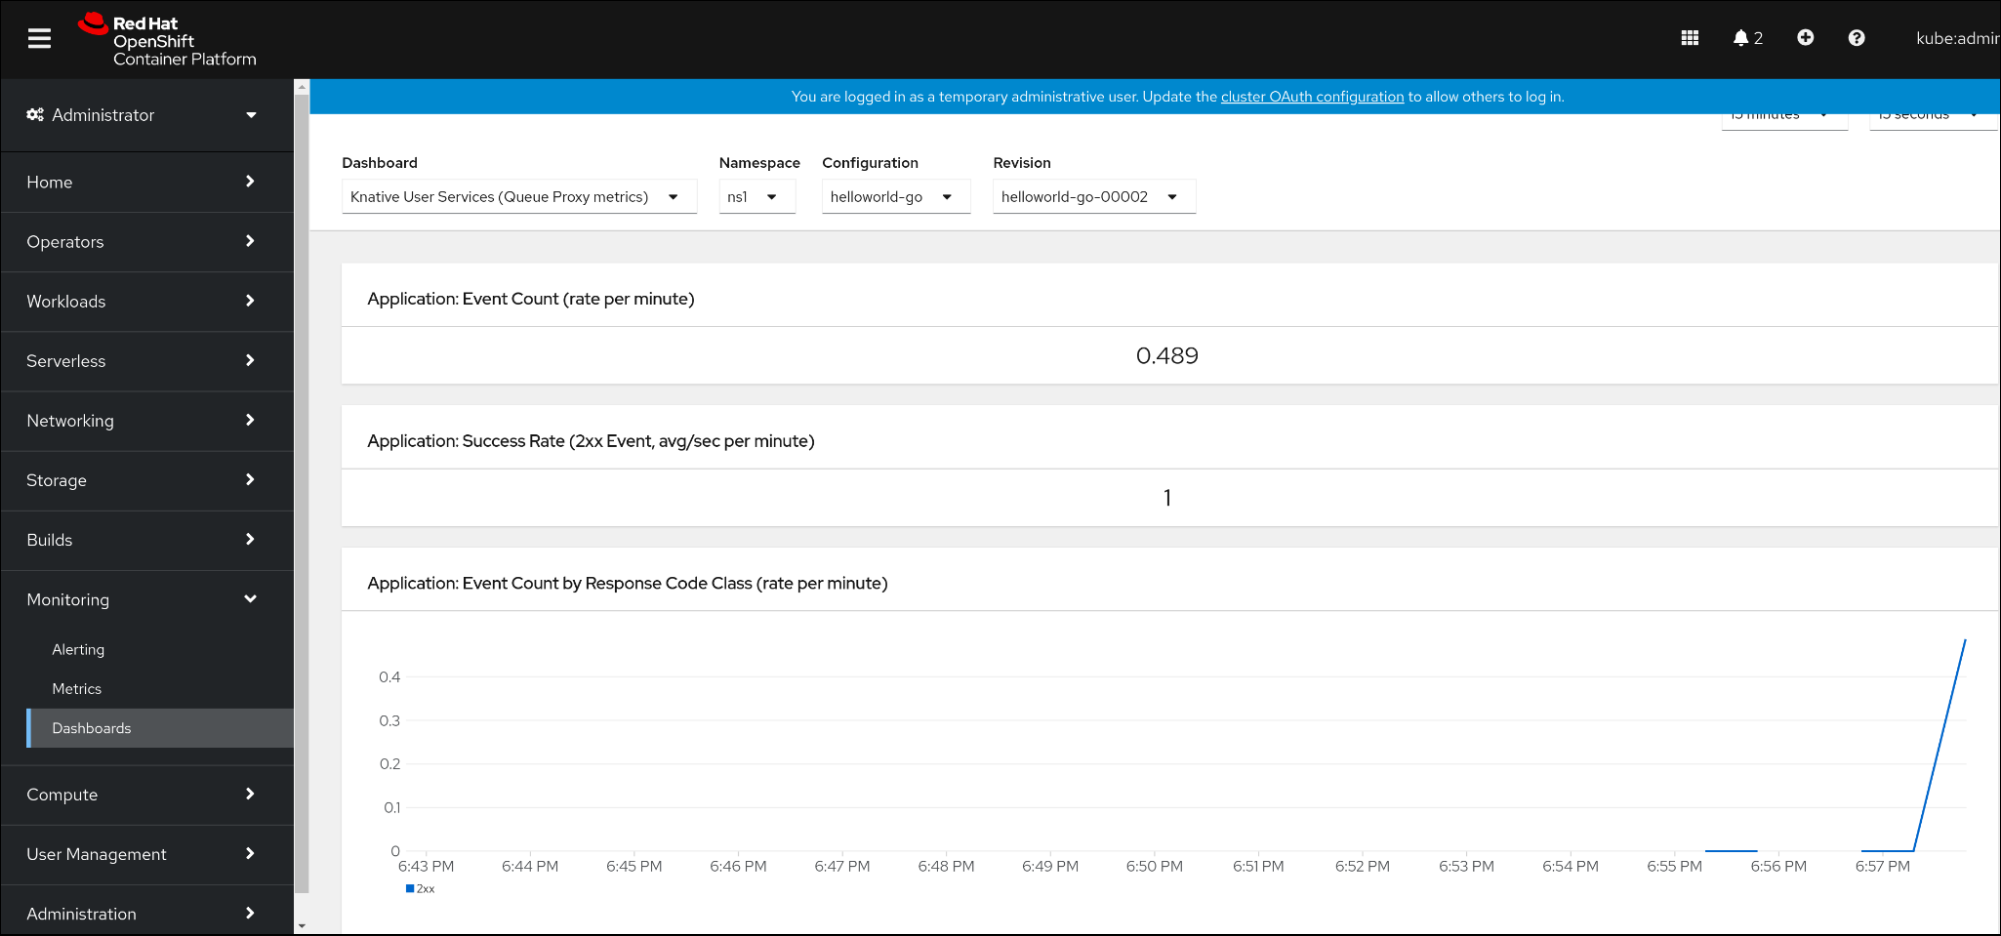
2.6. Dashboard for service metrics
You can examine the metrics using a dedicated dashboard that aggregates queue proxy metrics by namespace.
2.6.1. Examining metrics of a service in the dashboard
Prerequisites
- You have logged in to the OpenShift Container Platform web console.
- You have installed the OpenShift Serverless Operator and Knative Serving.
Procedure
- In the web console, navigate to the Observe → Metrics interface.
-
Select the
Knative User Services (Queue Proxy metrics)dashboard. - Select the Namespace, Configuration, and Revision that correspond to your application.
Observe the visualized metrics:
Chapter 3. Cluster logging
3.1. Using OpenShift Logging with OpenShift Serverless
3.1.1. About deploying the logging subsystem for Red Hat OpenShift
OpenShift Container Platform cluster administrators can deploy the logging subsystem using the OpenShift Container Platform web console or CLI to install the OpenShift Elasticsearch Operator and Red Hat OpenShift Logging Operator. When the Operators are installed, you create a ClusterLogging custom resource (CR) to schedule logging subsystem pods and other resources necessary to support the logging subsystem. The Operators are responsible for deploying, upgrading, and maintaining the logging subsystem.
The ClusterLogging CR defines a complete logging subsystem environment that includes all the components of the logging stack to collect, store and visualize logs. The Red Hat OpenShift Logging Operator watches the logging subsystem CR and adjusts the logging deployment accordingly.
Administrators and application developers can view the logs of the projects for which they have view access.
3.1.2. About deploying and configuring the logging subsystem for Red Hat OpenShift
The logging subsystem is designed to be used with the default configuration, which is tuned for small to medium sized OpenShift Container Platform clusters.
The installation instructions that follow include a sample ClusterLogging custom resource (CR), which you can use to create a logging subsystem instance and configure your logging subsystem environment.
If you want to use the default logging subsystem install, you can use the sample CR directly.
If you want to customize your deployment, make changes to the sample CR as needed. The following describes the configurations you can make when installing your OpenShift Logging instance or modify after installation. See the Configuring sections for more information on working with each component, including modifications you can make outside of the ClusterLogging custom resource.
3.1.2.1. Configuring and Tuning the logging subsystem
You can configure your logging subsystem by modifying the ClusterLogging custom resource deployed in the openshift-logging project.
You can modify any of the following components upon install or after install:
- Memory and CPU
-
You can adjust both the CPU and memory limits for each component by modifying the
resourcesblock with valid memory and CPU values:
spec:
  logStore:
    elasticsearch:
      resources:
        limits:
          cpu:
          memory: 16Gi
        requests:
          cpu: 500m
          memory: 16Gi
      type: "elasticsearch"
  collection:
    logs:
      fluentd:
        resources:
          limits:
            cpu:
            memory:
          requests:
            cpu:
            memory:
        type: "fluentd"
  visualization:
    kibana:
      resources:
        limits:
          cpu:
          memory:
        requests:
          cpu:
          memory:
type: kibana- Elasticsearch storage
-
You can configure a persistent storage class and size for the Elasticsearch cluster using the
storageClassnameandsizeparameters. The Red Hat OpenShift Logging Operator creates a persistent volume claim (PVC) for each data node in the Elasticsearch cluster based on these parameters.
  spec:
    logStore:
      type: "elasticsearch"
      elasticsearch:
        nodeCount: 3
        storage:
          storageClassName: "gp2"
          size: "200G"
This example specifies each data node in the cluster will be bound to a PVC that requests "200G" of "gp2" storage. Each primary shard will be backed by a single replica.
Omitting the storage block results in a deployment that includes ephemeral storage only.
  spec:
    logStore:
      type: "elasticsearch"
      elasticsearch:
        nodeCount: 3
storage: {}- Elasticsearch replication policy
You can set the policy that defines how Elasticsearch shards are replicated across data nodes in the cluster:
-
FullRedundancy. The shards for each index are fully replicated to every data node. -
MultipleRedundancy. The shards for each index are spread over half of the data nodes. -
SingleRedundancy. A single copy of each shard. Logs are always available and recoverable as long as at least two data nodes exist. -
ZeroRedundancy. No copies of any shards. Logs may be unavailable (or lost) in the event a node is down or fails.
-
3.1.2.2. Sample modified ClusterLogging custom resource
The following is an example of a ClusterLogging custom resource modified using the options previously described.
Sample modified ClusterLogging custom resource
apiVersion: "logging.openshift.io/v1"
kind: "ClusterLogging"
metadata:
  name: "instance"
  namespace: "openshift-logging"
spec:
  managementState: "Managed"
  logStore:
    type: "elasticsearch"
    retentionPolicy:
      application:
        maxAge: 1d
      infra:
        maxAge: 7d
      audit:
        maxAge: 7d
    elasticsearch:
      nodeCount: 3
      resources:
        limits:
          cpu: 200m
          memory: 16Gi
        requests:
          cpu: 200m
          memory: 16Gi
        storage:
          storageClassName: "gp2"
          size: "200G"
      redundancyPolicy: "SingleRedundancy"
  visualization:
    type: "kibana"
    kibana:
      resources:
        limits:
          memory: 1Gi
        requests:
          cpu: 500m
          memory: 1Gi
      replicas: 1
  collection:
    logs:
      type: "fluentd"
      fluentd:
        resources:
          limits:
            memory: 1Gi
          requests:
            cpu: 200m
            memory: 1Gi
3.2. Finding logs for Knative Serving components
You can find the logs for Knative Serving components using the following procedure.
3.2.1. Using OpenShift Logging to find logs for Knative Serving components
Prerequisites
-
Install the OpenShift CLI (
oc).
Procedure
Get the Kibana route:
$ oc -n openshift-logging get route kibana
- Use the route’s URL to navigate to the Kibana dashboard and log in.
- Check that the index is set to .all. If the index is not set to .all, only the OpenShift Container Platform system logs will be listed.
-
Filter the logs by using the
knative-servingnamespace. Enterkubernetes.namespace_name:knative-servingin the search box to filter results.
Knative Serving uses structured logging by default. You can enable the parsing of these logs by customizing the OpenShift Logging Fluentd settings. This makes the logs more searchable and enables filtering on the log level to quickly identify issues.
3.3. Finding logs for Knative Serving services
You can find the logs for Knative Serving services using the following procedure.
3.3.1. Using OpenShift Logging to find logs for services deployed with Knative Serving
With OpenShift Logging, the logs that your applications write to the console are collected in Elasticsearch. The following procedure outlines how to apply these capabilities to applications deployed by using Knative Serving.
Prerequisites
-
Install the OpenShift CLI (
oc).
Procedure
Get the Kibana route:
$ oc -n openshift-logging get route kibana
- Use the route’s URL to navigate to the Kibana dashboard and log in.
- Check that the index is set to .all. If the index is not set to .all, only the OpenShift system logs will be listed.
Filter the logs by using the
knative-servingnamespace. Enter a filter for the service in the search box to filter results.Example filter
kubernetes.namespace_name:default AND kubernetes.labels.serving_knative_dev\/service:{service_name}You can also filter by using
/configurationor/revision.-
Narrow your search by using
kubernetes.container_name:<user_container>to only display the logs generated by your application. Otherwise, you will see logs from the queue-proxy.
Use JSON-based structured logging in your application to allow for the quick filtering of these logs in production environments.
Chapter 4. Tracing
4.1. Tracing requests
Distributed tracing records the path of a request through the various services that make up an application. It is used to tie information about different units of work together, to understand a whole chain of events in a distributed transaction. The units of work might be executed in different processes or hosts.
4.1.1. Distributed tracing overview
As a service owner, you can use distributed tracing to instrument your services to gather insights into your service architecture. You can use distributed tracing for monitoring, network profiling, and troubleshooting the interaction between components in modern, cloud-native, microservices-based applications.
With distributed tracing you can perform the following functions:
- Monitor distributed transactions
- Optimize performance and latency
- Perform root cause analysis
Red Hat OpenShift distributed tracing consists of two main components:
- Red Hat OpenShift distributed tracing platform - This component is based on the open source Jaeger project.
- Red Hat OpenShift distributed tracing data collection - This component is based on the open source OpenTelemetry project.
Both of these components are based on the vendor-neutral OpenTracing APIs and instrumentation.
4.1.2. Additional resources for OpenShift Container Platform
4.2. Using Red Hat OpenShift distributed tracing
You can use Red Hat OpenShift distributed tracing with OpenShift Serverless to monitor and troubleshoot serverless applications.
4.2.1. Using Red Hat OpenShift distributed tracing to enable distributed tracing
Red Hat OpenShift distributed tracing is made up of several components that work together to collect, store, and display tracing data.
Prerequisites
- You have access to an OpenShift Container Platform account with cluster administrator access.
- You have not yet installed the OpenShift Serverless Operator, Knative Serving, and Knative Eventing. These must be installed after the Red Hat OpenShift distributed tracing installation.
- You have installed Red Hat OpenShift distributed tracing by following the OpenShift Container Platform "Installing distributed tracing" documentation.
-
You have installed the OpenShift CLI (
oc). - You have created a project or have access to a project with the appropriate roles and permissions to create applications and other workloads in OpenShift Container Platform.
Procedure
Create an
OpenTelemetryCollectorcustom resource (CR):Example OpenTelemetryCollector CR
apiVersion: opentelemetry.io/v1alpha1
kind: OpenTelemetryCollector
metadata:
  name: cluster-collector
  namespace: <namespace>
spec:
  mode: deployment
  config: |
    receivers:
      zipkin:
    processors:
    exporters:
      jaeger:
        endpoint: jaeger-all-in-one-inmemory-collector-headless.tracing-system.svc:14250
        tls:
          ca_file: "/var/run/secrets/kubernetes.io/serviceaccount/service-ca.crt"
      logging:
    service:
      pipelines:
        traces:
          receivers: [zipkin]
          processors: []
          exporters: [jaeger, logging]
Verify that you have two pods running in the namespace where Red Hat OpenShift distributed tracing is installed:
$ oc get pods -n <namespace>
Example output
NAME                                          READY   STATUS    RESTARTS   AGE
cluster-collector-collector-85c766b5c-b5g99   1/1     Running   0          5m56s
jaeger-all-in-one-inmemory-ccbc9df4b-ndkl5    2/2     Running   0          15m
Verify that the following headless services have been created:
$ oc get svc -n <namespace> | grep headless
Example output
cluster-collector-collector-headless            ClusterIP   None             <none>        9411/TCP                                 7m28s
jaeger-all-in-one-inmemory-collector-headless   ClusterIP   None             <none>        9411/TCP,14250/TCP,14267/TCP,14268/TCP   16m
These services are used to configure Jaeger, Knative Serving, and Knative Eventing. The name of the Jaeger service may vary.
- Install the OpenShift Serverless Operator by following the "Installing the OpenShift Serverless Operator" documentation.
Install Knative Serving by creating the following
KnativeServingCR:Example KnativeServing CR
apiVersion: operator.knative.dev/v1beta1 kind: KnativeServing metadata: name: knative-serving namespace: knative-serving spec: config: tracing: backend: "zipkin" zipkin-endpoint: "http://cluster-collector-collector-headless.tracing-system.svc:9411/api/v2/spans" debug: "false" sample-rate: "0.1" 1- 1
- The
sample-ratedefines sampling probability. Usingsample-rate: "0.1"means that 1 in 10 traces are sampled.
Install Knative Eventing by creating the following
KnativeEventingCR:Example KnativeEventing CR
apiVersion: operator.knative.dev/v1beta1 kind: KnativeEventing metadata: name: knative-eventing namespace: knative-eventing spec: config: tracing: backend: "zipkin" zipkin-endpoint: "http://cluster-collector-collector-headless.tracing-system.svc:9411/api/v2/spans" debug: "false" sample-rate: "0.1" 1- 1
- The
sample-ratedefines sampling probability. Usingsample-rate: "0.1"means that 1 in 10 traces are sampled.
Create a Knative service:
Example service
apiVersion: serving.knative.dev/v1
kind: Service
metadata:
  name: helloworld-go
spec:
  template:
    metadata:
      labels:
        app: helloworld-go
      annotations:
        autoscaling.knative.dev/minScale: "1"
        autoscaling.knative.dev/target: "1"
    spec:
      containers:
      - image: quay.io/openshift-knative/helloworld:v1.2
        imagePullPolicy: Always
        resources:
          requests:
            cpu: "200m"
        env:
        - name: TARGET
          value: "Go Sample v1"
Make some requests to the service:
Example HTTPS request
$ curl https://helloworld-go.example.com
Get the URL for the Jaeger web console:
Example command
$ oc get route jaeger-all-in-one-inmemory -o jsonpath='{.spec.host}' -n <namespace>You can now examine traces by using the Jaeger console.
4.3. Using Jaeger distributed tracing
If you do not want to install all of the components of Red Hat OpenShift distributed tracing, you can still use distributed tracing on OpenShift Container Platform with OpenShift Serverless.
4.3.1. Configuring Jaeger to enable distributed tracing
To enable distributed tracing using Jaeger, you must install and configure Jaeger as a standalone integration.
Prerequisites
- You have cluster administrator permissions on OpenShift Container Platform, or you have cluster or dedicated administrator permissions on Red Hat OpenShift Service on AWS or OpenShift Dedicated.
- You have installed the OpenShift Serverless Operator, Knative Serving, and Knative Eventing.
- You have installed the Red Hat OpenShift distributed tracing platform Operator.
-
You have installed the OpenShift CLI (
oc). - You have created a project or have access to a project with the appropriate roles and permissions to create applications and other workloads.
Procedure
Create and apply a
Jaegercustom resource (CR) that contains the following:Jaeger CR
apiVersion: jaegertracing.io/v1
kind: Jaeger
metadata:
  name: jaeger
  namespace: default
Enable tracing for Knative Serving, by editing the
KnativeServingCR and adding a YAML configuration for tracing:Tracing YAML example for Serving
apiVersion: operator.knative.dev/v1beta1 kind: KnativeServing metadata: name: knative-serving namespace: knative-serving spec: config: tracing: sample-rate: "0.1" 1 backend: zipkin 2 zipkin-endpoint: "http://jaeger-collector.default.svc.cluster.local:9411/api/v2/spans" 3 debug: "false" 4- 1
- The
sample-ratedefines sampling probability. Usingsample-rate: "0.1"means that 1 in 10 traces are sampled. - 2
backendmust be set tozipkin.- 3
- The
zipkin-endpointmust point to yourjaeger-collectorservice endpoint. To get this endpoint, substitute the namespace where the Jaeger CR is applied. - 4
- Debugging should be set to
false. Enabling debug mode by settingdebug: "true"allows all spans to be sent to the server, bypassing sampling.
Enable tracing for Knative Eventing by editing the
KnativeEventingCR:Tracing YAML example for Eventing
apiVersion: operator.knative.dev/v1beta1 kind: KnativeEventing metadata: name: knative-eventing namespace: knative-eventing spec: config: tracing: sample-rate: "0.1" 1 backend: zipkin 2 zipkin-endpoint: "http://jaeger-collector.default.svc.cluster.local:9411/api/v2/spans" 3 debug: "false" 4- 1
- The
sample-ratedefines sampling probability. Usingsample-rate: "0.1"means that 1 in 10 traces are sampled. - 2
- Set
backendtozipkin. - 3
- Point the
zipkin-endpointto yourjaeger-collectorservice endpoint. To get this endpoint, substitute the namespace where the Jaeger CR is applied. - 4
- Debugging should be set to
false. Enabling debug mode by settingdebug: "true"allows all spans to be sent to the server, bypassing sampling.
Verification
You can access the Jaeger web console to see tracing data, by using the jaeger route.
Get the
jaegerroute’s hostname by entering the following command:$ oc get route jaeger -n default
Example output
NAME     HOST/PORT                         PATH   SERVICES       PORT    TERMINATION   WILDCARD
jaeger   jaeger-default.apps.example.com          jaeger-query   <all>   reencrypt     None
- Open the endpoint address in your browser to view the console.