
Chapter 3. Configuring Dev Spaces
This section describes configuration methods and options for Red Hat OpenShift Dev Spaces.
3.1. Understanding the CheCluster Custom Resource
A default deployment of OpenShift Dev Spaces consists of a CheCluster Custom Resource parameterized by the Red Hat OpenShift Dev Spaces Operator.
The CheCluster Custom Resource is a Kubernetes object. You can configure it by editing the CheCluster Custom Resource YAML file. This file contains sections to configure each component: devWorkspace, cheServer, pluginRegistry, devfileRegistry, database, dashboard and imagePuller.
The Red Hat OpenShift Dev Spaces Operator translates the CheCluster Custom Resource into a config map usable by each component of the OpenShift Dev Spaces installation.
The OpenShift platform applies the configuration to each component, and creates the necessary Pods. When OpenShift detects changes in the configuration of a component, it restarts the Pods accordingly.
Example 3.1. Configuring the main properties of the OpenShift Dev Spaces server component
-
Apply the
CheClusterCustom Resource YAML file with suitable modifications in thecheServercomponent section. -
The Operator generates the
cheConfigMap. -
OpenShift detects changes in the
ConfigMapand triggers a restart of the OpenShift Dev Spaces Pod.
Additional resources
3.1.1. Using dsc to configure the CheCluster Custom Resource during installation
To deploy OpenShift Dev Spaces with a suitable configuration, edit the CheCluster Custom Resource YAML file during the installation of OpenShift Dev Spaces. Otherwise, the OpenShift Dev Spaces deployment uses the default configuration parameterized by the Operator.
Prerequisites
-
An active
ocsession with administrative permissions to the OpenShift cluster. See Getting started with the CLI. -
dsc. See: Section 2.1, “Installing the dsc management tool”.
Procedure
Create a
che-operator-cr-patch.yamlYAML file that contains the subset of theCheClusterCustom Resource to configure:spec: <component>: <property_to_configure>: <value>
Deploy OpenShift Dev Spaces and apply the changes described in
che-operator-cr-patch.yamlfile:$ dsc server:deploy \ --che-operator-cr-patch-yaml=che-operator-cr-patch.yaml \ --platform <chosen_platform>
Verification
Verify the value of the configured property:
$ oc get configmap che -o jsonpath='{.data.<configured_property>}' \
-n openshift-devspaces
3.1.2. Using the CLI to configure the CheCluster Custom Resource
To configure a running instance of OpenShift Dev Spaces, edit the CheCluster Custom Resource YAML file.
Prerequisites
- An instance of OpenShift Dev Spaces on OpenShift.
-
An active
ocsession with administrative permissions to the destination OpenShift cluster. See Getting started with the CLI.
Procedure
Edit the CheCluster Custom Resource on the cluster:
$ oc edit checluster/devspaces -n openshift-devspaces
- Save and close the file to apply the changes.
Verification
Verify the value of the configured property:
$ oc get configmap che -o jsonpath='{.data.<configured_property>}' \
-n openshift-devspaces
3.1.3. CheCluster Custom Resource fields reference
This section describes all fields available to customize the CheCluster Custom Resource.
-
Example 3.2, “A minimal
CheClusterCustom Resource example.” - Table 3.1, “Development environment configuration options.”
- Table 3.4, “OpenShift Dev Spaces components configuration.”
- Table 3.5, “DevWorkspace operator component configuration.”
- Table 3.6, “General configuration settings related to the OpenShift Dev Spaces server component.”
- Table 3.7, “Configuration settings related to the Plug-in registry component used by the OpenShift Dev Spaces installation.”
- Table 3.8, “Configuration settings related to the Devfile registry component used by the OpenShift Dev Spaces installation.”
- Table 3.9, “Configuration settings related to the Database component used by the OpenShift Dev Spaces installation.”
- Table 3.10, “Configuration settings related to the Dashboard component used by the OpenShift Dev Spaces installation.”
- Table 3.11, “Kubernetes Image Puller component configuration.”
- Table 3.12, “OpenShift Dev Spaces server metrics component configuration.”
- Table 3.13, “Networking, OpenShift Dev Spaces authentication and TLS configuration.”
- Table 3.14, “Configuration of an alternative registry that stores OpenShift Dev Spaces images.”
-
Table 3.15, “
CheClusterCustom Resourcestatusdefines the observed state of OpenShift Dev Spaces installation”
Example 3.2. A minimal CheCluster Custom Resource example.
apiVersion: org.eclipse.che/v2
kind: CheCluster
metadata:
  name: devspaces
spec:
  devEnvironments:
    defaultNamespace:
      template: '<username>-che'
    storage:
      pvcStrategy: 'common'
  components:
    database:
      externalDb: false
    metrics:
      enable: true
Table 3.1. Development environment configuration options.
| Property | Description |
|---|---|
| containerBuildConfiguration | Container build configuration. |
| defaultComponents | Default components applied to DevWorkspaces. These default components are meant to be used when a Devfile, that does not contain any components. |
| defaultEditor |
The default editor to workspace create with. It could be a plugin ID or a URI. The plugin ID must have |
| defaultNamespace | User’s default namespace. |
| defaultPlugins | Default plug-ins applied to DevWorkspaces. |
| disableContainerBuildCapabilities | Disables the container build capabilities. |
| nodeSelector | The node selector limits the nodes that can run the workspace pods. |
| secondsOfInactivityBeforeIdling | Idle timeout for workspaces in seconds. This timeout is the duration after which a workspace will be idled if there is no activity. To disable workspace idling due to inactivity, set this value to -1. |
| secondsOfRunBeforeIdling | Run timeout for workspaces in seconds. This timeout is the maximum duration a workspace runs. To disable workspace run timeout, set this value to -1. |
| storage | Workspaces persistent storage. |
| tolerations | The pod tolerations of the workspace pods limit where the workspace pods can run. |
| trustedCerts | Trusted certificate settings. |
Table 3.2. Development environment defaultNamespace options.
| Property | Description |
|---|---|
| autoProvision | Indicates if is allowed to automatically create a user namespace. If it set to false, then user namespace must be pre-created by a cluster administrator. |
| template |
If you don’t create the user namespaces in advance, this field defines the Kubernetes namespace created when you start your first workspace. You can use |
Table 3.3. Development environment storage options.
| Property | Description |
|---|---|
| perUserStrategyPvcConfig |
PVC settings when using the |
| perWorkspaceStrategyPvcConfig |
PVC settings when using the |
| pvcStrategy |
Persistent volume claim strategy for the OpenShift Dev Spaces server. The supported strategies are: |
Table 3.4. OpenShift Dev Spaces components configuration.
| Property | Description |
|---|---|
| cheServer | General configuration settings related to the OpenShift Dev Spaces server. |
| dashboard | Configuration settings related to the dashboard used by the OpenShift Dev Spaces installation. |
| database | Configuration settings related to the database used by the OpenShift Dev Spaces installation. |
| devWorkspace | DevWorkspace Operator configuration. |
| devfileRegistry | Configuration settings related to the devfile registry used by the OpenShift Dev Spaces installation. |
| imagePuller | Kubernetes Image Puller configuration. |
| metrics | OpenShift Dev Spaces server metrics configuration. |
| pluginRegistry | Configuration settings related to the plug-in registry used by the OpenShift Dev Spaces installation. |
Table 3.5. DevWorkspace operator component configuration.
| Property | Description |
|---|---|
| runningLimit | The maximum number of running workspaces per user. |
Table 3.6. General configuration settings related to the OpenShift Dev Spaces server component.
| Property | Description |
|---|---|
| clusterRoles |
ClusterRoles assigned to OpenShift Dev Spaces ServiceAccount. The defaults roles are: - |
| debug | Enables the debug mode for OpenShift Dev Spaces server. |
| deployment | Deployment override options. |
| extraProperties |
A map of additional environment variables applied in the generated |
| logLevel |
The log level for the OpenShift Dev Spaces server: |
| proxy | Proxy server settings for Kubernetes cluster. No additional configuration is required for OpenShift cluster. By specifying these settings for the OpenShift cluster, you override the OpenShift proxy configuration. |
Table 3.7. Configuration settings related to the Plug-in registry component used by the OpenShift Dev Spaces installation.
| Property | Description |
|---|---|
| deployment | Deployment override options. |
| disableInternalRegistry | Disables internal plug-in registry. |
| externalPluginRegistries | External plugin registries. |
| openVSXURL | Open VSX registry URL. If omitted an embedded instance will be used. |
Table 3.8. Configuration settings related to the Devfile registry component used by the OpenShift Dev Spaces installation.
| Property | Description |
|---|---|
| deployment | Deployment override options. |
| disableInternalRegistry | Disables internal devfile registry. |
| externalDevfileRegistries | External devfile registries serving sample ready-to-use devfiles. |
Table 3.9. Configuration settings related to the Database component used by the OpenShift Dev Spaces installation.
| Property | Description |
|---|---|
| credentialsSecretName |
The secret that contains PostgreSQL |
| deployment | Deployment override options. |
| externalDb |
Instructs the Operator to deploy a dedicated database. By default, a dedicated PostgreSQL database is deployed as part of the OpenShift Dev Spaces installation. When |
| postgresDb | PostgreSQL database name that the OpenShift Dev Spaces server uses to connect to the database. |
| postgresHostName |
PostgreSQL database hostname that the OpenShift Dev Spaces server connects to. Override this value only when using an external database. See field |
| postgresPort |
PostgreSQL Database port the OpenShift Dev Spaces server connects to. Override this value only when using an external database. See field |
| pvc | PVC settings for PostgreSQL database. |
Table 3.10. Configuration settings related to the Dashboard component used by the OpenShift Dev Spaces installation.
| Property | Description |
|---|---|
| deployment | Deployment override options. |
| headerMessage | Dashboard header message. |
Table 3.11. Kubernetes Image Puller component configuration.
| Property | Description |
|---|---|
| enable |
Install and configure the community supported Kubernetes Image Puller Operator. When you set the value to |
| spec | A Kubernetes Image Puller spec to configure the image puller in the CheCluster. |
Table 3.12. OpenShift Dev Spaces server metrics component configuration.
| Property | Description |
|---|---|
| enable |
Enables |
Table 3.13. Networking, OpenShift Dev Spaces authentication and TLS configuration.
| Property | Description |
|---|---|
| annotations | Defines annotations which will be set for an Ingress (a route for OpenShift platform). The defaults for kubernetes platforms are: kubernetes.io/ingress.class: \nginx\ nginx.ingress.kubernetes.io/proxy-read-timeout: \3600\, nginx.ingress.kubernetes.io/proxy-connect-timeout: \3600\, nginx.ingress.kubernetes.io/ssl-redirect: \true\ |
| auth | Authentication settings. |
| domain | For an OpenShift cluster, the Operator uses the domain to generate a hostname for the route. The generated hostname follows this pattern: che-<devspaces-namespace>.<domain>. The <devspaces-namespace> is the namespace where the CheCluster CRD is created. In conjunction with labels, it creates a route served by a non-default Ingress controller. For a Kubernetes cluster, it contains a global ingress domain. There are no default values: you must specify them. |
| hostname | The public hostname of the installed OpenShift Dev Spaces server. |
| labels | Defines labels which will be set for an Ingress (a route for OpenShift platform). |
| tlsSecretName |
The name of the secret used to set up Ingress TLS termination. If the field is an empty string, the default cluster certificate is used. The secret must have a |
Table 3.14. Configuration of an alternative registry that stores OpenShift Dev Spaces images.
| Property | Description |
|---|---|
| hostname | An optional hostname or URL of an alternative container registry to pull images from. This value overrides the container registry hostname defined in all the default container images involved in a OpenShift Dev Spaces deployment. This is particularly useful for installing OpenShift Dev Spaces in a restricted environment. |
| organization | An optional repository name of an alternative registry to pull images from. This value overrides the container registry organization defined in all the default container images involved in a OpenShift Dev Spaces deployment. This is particularly useful for installing OpenShift Dev Spaces in a restricted environment. |
Table 3.15. CheCluster Custom Resource status defines the observed state of OpenShift Dev Spaces installation
| Property | Description |
|---|---|
| chePhase | Specifies the current phase of the OpenShift Dev Spaces deployment. |
| cheURL | Public URL of the OpenShift Dev Spaces server. |
| cheVersion | Currently installed OpenShift Dev Spaces version. |
| devfileRegistryURL | The public URL of the internal devfile registry. |
| gatewayPhase | Specifies the current phase of the gateway deployment. |
| message | A human readable message indicating details about why the OpenShift Dev Spaces deployment is in the current phase. |
| pluginRegistryURL | The public URL of the internal plug-in registry. |
| postgresVersion | The PostgreSQL version of the image in use. |
| reason | A brief CamelCase message indicating details about why the OpenShift Dev Spaces deployment is in the current phase. |
| workspaceBaseDomain | The resolved workspace base domain. This is either the copy of the explicitly defined property of the same name in the spec or, if it is undefined in the spec and we’re running on OpenShift, the automatically resolved basedomain for routes. |
3.2. Configuring projects
For each user, OpenShift Dev Spaces isolates workspaces in a project. OpenShift Dev Spaces identifies the user project by the presence of labels and annotations. When starting a workspace, if the required project doesn’t exist, OpenShift Dev Spaces creates the project using a template name.
You can modify OpenShift Dev Spaces behavior by:
3.2.1. Configuring project name
You can configure the project name template that OpenShift Dev Spaces uses to create the required project when starting a workspace.
A valid project name template follows these conventions:
-
The
<username>or<userid>placeholder is mandatory. -
Usernames and IDs cannot contain invalid characters. If the formatting of a username or ID is incompatible with the naming conventions for OpenShift objects, OpenShift Dev Spaces changes the username or ID to a valid name by replacing incompatible characters with the
-symbol. -
OpenShift Dev Spaces evaluates the
<userid>placeholder into a 14 character long string, and adds a random six character long suffix to prevent IDs from colliding. The result is stored in the user preferences for reuse. - Kubernetes limits the length of a project name to 63 characters.
- OpenShift limits the length further to 49 characters.
Procedure
Configure the
CheClusterCustom Resource. See Section 3.1.2, “Using the CLI to configure the CheCluster Custom Resource”.spec: components: devEnvironments: defaultNamespace: template: <workspace_namespace_template_>Example 3.3. User workspaces project name template examples
User workspaces project name template Resulting project example <username>-devspaces(default)user1-devspaces
<userid>-namespacecge1egvsb2nhba-namespace-ul1411<userid>-aka-<username>-namespacecgezegvsb2nhba-aka-user1-namespace-6m2w2b
3.2.2. Provisioning projects in advance
You can provision workspaces projects in advance, rather than relying on automatic provisioning. Repeat the procedure for each user.
Procedure
Create the <project_name> project for <username> user with the following labels and annotations:
kind: Namespace
apiVersion: v1
metadata:
  name: <project_name> 1
  labels:
    app.kubernetes.io/part-of: che.eclipse.org
    app.kubernetes.io/component: workspaces-namespace
  annotations:
    che.eclipse.org/username: <username>
- 1
- Use a project name of your choosing.
3.3. Configuring server components
3.3.1. Mounting a Secret or a ConfigMap as a file or an environment variable into a Red Hat OpenShift Dev Spaces container
Secrets are OpenShift objects that store sensitive data such as:
- usernames
- passwords
- authentication tokens
in an encrypted form.
Users can mount a OpenShift Secret that contains sensitive data or a ConfigMap that contains configuration in a OpenShift Dev Spaces managed containers as:
- a file
- an environment variable
The mounting process uses the standard OpenShift mounting mechanism, but it requires additional annotations and labeling.
3.3.1.1. Mounting a Secret or a ConfigMap as a file into a OpenShift Dev Spaces container
Prerequisites
- A running instance of Red Hat OpenShift Dev Spaces.
Procedure
Create a new OpenShift Secret or a ConfigMap in the OpenShift project where a OpenShift Dev Spaces is deployed. The labels of the object that is about to be created must match the set of labels:
-
app.kubernetes.io/part-of: che.eclipse.org -
app.kubernetes.io/component: <DEPLOYMENT_NAME>-<OBJECT_KIND> The
<DEPLOYMENT_NAME>corresponds to the one following deployments:-
postgres -
keycloak -
devfile-registry -
plugin-registry devspacesand
-
<OBJECT_KIND>is either:secretor
-
configmap
-
Example 3.4. Example:
apiVersion: v1
kind: Secret
metadata:
  name: custom-settings
  labels:
    app.kubernetes.io/part-of: che.eclipse.org
    app.kubernetes.io/component: devspaces-secret
...
or
apiVersion: v1
kind: ConfigMap
metadata:
  name: custom-settings
  labels:
    app.kubernetes.io/part-of: che.eclipse.org
    app.kubernetes.io/component: devspaces-configmap
...
Annotations must indicate that the given object is mounted as a file.
Configure the annotation values:
-
che.eclipse.org/mount-as: file- To indicate that a object is mounted as a file. -
che.eclipse.org/mount-path: <TARGET_PATH>- To provide a required mount path.
-
Example 3.5. Example:
apiVersion: v1
kind: Secret
metadata:
  name: custom-data
  annotations:
    che.eclipse.org/mount-as: file
    che.eclipse.org/mount-path: /data
  labels:
...
or
apiVersion: v1
kind: ConfigMap
metadata:
  name: custom-data
  annotations:
    che.eclipse.org/mount-as: file
    che.eclipse.org/mount-path: /data
  labels:
...
The OpenShift object can contain several items whose names must match the desired file name mounted into the container.
Example 3.6. Example:
apiVersion: v1
kind: Secret
metadata:
  name: custom-data
  labels:
    app.kubernetes.io/part-of: che.eclipse.org
    app.kubernetes.io/component: devspaces-secret
  annotations:
    che.eclipse.org/mount-as: file
    che.eclipse.org/mount-path: /data
data:
  ca.crt: <base64 encoded data content here>
or
apiVersion: v1
kind: ConfigMap
metadata:
  name: custom-data
  labels:
    app.kubernetes.io/part-of: che.eclipse.org
    app.kubernetes.io/component: devspaces-configmap
  annotations:
    che.eclipse.org/mount-as: file
    che.eclipse.org/mount-path: /data
data:
  ca.crt: <data content here>
This results in a file named ca.crt being mounted at the /data path of OpenShift Dev Spaces container.
To make the changes in a OpenShift Dev Spaces container visible, recreate the object entirely.
3.3.1.2. Mounting a Secret or a ConfigMap as an environment variable into a OpenShift Dev Spaces container
Prerequisites
- A running instance of Red Hat OpenShift Dev Spaces.
Procedure
Create a new OpenShift Secret or a ConfigMap in the OpenShift project where a OpenShift Dev Spaces is deployed. The labels of the object that is about to be created must match the set of labels:
-
app.kubernetes.io/part-of: che.eclipse.org -
app.kubernetes.io/component: <DEPLOYMENT_NAME>-<OBJECT_KIND> The
<DEPLOYMENT_NAME>corresponds to the one following deployments:-
postgres -
keycloak -
devfile-registry -
plugin-registry devspacesand
-
<OBJECT_KIND>is either:secretor
-
configmap
-
Example 3.7. Example:
apiVersion: v1
kind: Secret
metadata:
  name: custom-settings
  labels:
    app.kubernetes.io/part-of: che.eclipse.org
    app.kubernetes.io/component: devspaces-secret
...
or
apiVersion: v1
kind: ConfigMap
metadata:
  name: custom-settings
  labels:
    app.kubernetes.io/part-of: che.eclipse.org
    app.kubernetes.io/component: devspaces-configmap
...
Annotations must indicate that the given object is mounted as a environment variable.
Configure the annotation values:
-
che.eclipse.org/mount-as: env- to indicate that a object is mounted as an environment variable -
che.eclipse.org/env-name: <FOO_ENV>- to provide an environment variable name, which is required to mount a object key value
-
Example 3.8. Example:
apiVersion: v1
kind: Secret
metadata:
  name: custom-settings
  annotations:
    che.eclipse.org/env-name: FOO_ENV
    che.eclipse.org/mount-as: env
  labels:
   ...
data:
  mykey: myvalue
or
apiVersion: v1
kind: ConfigMap
metadata:
  name: custom-settings
  annotations:
    che.eclipse.org/env-name: FOO_ENV
    che.eclipse.org/mount-as: env
  labels:
   ...
data:
  mykey: myvalue
This results in two environment variables:
-
FOO_ENV -
myvalue
being provisioned into a OpenShift Dev Spaces container.
If the object provides more than one data item, the environment variable name must be provided for each of the data keys as follows:
Example 3.9. Example:
apiVersion: v1
kind: Secret
metadata:
  name: custom-settings
  annotations:
    che.eclipse.org/mount-as: env
    che.eclipse.org/mykey_env-name: FOO_ENV
    che.eclipse.org/otherkey_env-name: OTHER_ENV
  labels:
   ...
data:
  mykey: __<base64 encoded data content here>__
  otherkey: __<base64 encoded data content here>__
or
apiVersion: v1
kind: ConfigMap
metadata:
  name: custom-settings
  annotations:
    che.eclipse.org/mount-as: env
    che.eclipse.org/mykey_env-name: FOO_ENV
    che.eclipse.org/otherkey_env-name: OTHER_ENV
  labels:
   ...
data:
  mykey: __<data content here>__
  otherkey: __<data content here>__
This results in two environment variables:
-
FOO_ENV -
OTHER_ENV
being provisioned into a OpenShift Dev Spaces container.
The maximum length of annotation names in a OpenShift object is 63 characters, where 9 characters are reserved for a prefix that ends with /. This acts as a restriction for the maximum length of the key that can be used for the object.
To make the changes in a OpenShift Dev Spaces container visible, recreate the object entirely.
3.3.2. Advanced configuration options for Dev Spaces server
The following section describes advanced deployment and configuration methods for the OpenShift Dev Spaces server component.
3.3.2.1. Understanding OpenShift Dev Spaces server advanced configuration
The following section describes the OpenShift Dev Spaces server component advanced configuration method for a deployment.
Advanced configuration is necessary to:
-
Add environment variables not automatically generated by the Operator from the standard
CheClusterCustom Resource fields. -
Override the properties automatically generated by the Operator from the standard
CheClusterCustom Resource fields.
The customCheProperties field, part of the CheCluster Custom Resource server settings, contains a map of additional environment variables to apply to the OpenShift Dev Spaces server component.
Example 3.10. Override the default memory limit for workspaces
Configure the
CheClusterCustom Resource. See Section 3.1.2, “Using the CLI to configure the CheCluster Custom Resource”.apiVersion: org.eclipse.che/v2 kind: CheCluster spec: components: cheServer: extraProperties: CHE_LOGS_APPENDERS_IMPL: json
Previous versions of the OpenShift Dev Spaces Operator had a ConfigMap named custom to fulfill this role. If the OpenShift Dev Spaces Operator finds a configMap with the name custom, it adds the data it contains into the customCheProperties field, redeploys OpenShift Dev Spaces, and deletes the custom configMap.
Additional resources
3.4. Configuring workspaces globally
This section describes how an administrator can configure workspaces globally.
3.4.1. Limiting the number of workspaces that a user can keep
By default, users can keep an unlimited number of workspaces in the dashboard, but you can limit this number to reduce demand on the cluster.
This configuration is part of the CheCluster Custom Resource:
spec:
  components:
    cheServer:
      extraProperties:
CHE_LIMITS_USER_WORKSPACES_COUNT: "<kept_workspaces_limit>" 1- 1
- Sets the maximum number of workspaces per user. The default value,
-1, allows users to keep an unlimited number of workspaces. Use a positive integer to set the maximum number of workspaces per user.
Procedure
Get the name of the OpenShift Dev Spaces namespace. The default is
openshift-devspaces.$ oc get checluster --all-namespaces \ -o=jsonpath="{.items[*].metadata.namespace}"Configure the
CHE_LIMITS_USER_WORKSPACES_COUNT:$ oc patch checluster/devspaces -n openshift-devspaces \1 --type='merge' -p \ '{"spec":{"components":{"cheServer":{"extraProperties":{"CHE_LIMITS_USER_WORKSPACES_COUNT": "<kept_workspaces_limit>"}}}}}' 2
Additional resources
3.4.2. Enabling users to run multiple workspaces simultaneously
By default, a user can run only one workspace at a time. You can enable users to run multiple workspaces simultaneously.
If using the default storage method, users might experience problems when concurrently running workspaces if pods are distributed across nodes in a multi-node cluster. Switching from the per-user common storage strategy to the per-workspace storage strategy or using the ephemeral storage type can avoid or solve those problems.
This configuration is part of the CheCluster Custom Resource:
spec:
  components:
    devWorkspace:
runningLimit: "<running_workspaces_limit>" 1- 1
- Sets the maximum number of simultaneously running workspaces per user. The default value is
1.
Procedure
Get the name of the OpenShift Dev Spaces namespace. The default is
openshift-devspaces.$ oc get checluster --all-namespaces \ -o=jsonpath="{.items[*].metadata.namespace}"Configure the
runningLimit:$ oc patch checluster/devspaces -n openshift-devspaces \1 --type='merge' -p \ '{"spec":{"components":{"devWorkspace":{"runningLimit": "<running_workspaces_limit>"}}}}' 2
Additional resources
3.4.3. Git with self-signed certificates
You can configure OpenShift Dev Spaces to support operations on Git providers that use self-signed certificates.
Prerequisites
-
An active
ocsession with administrative permissions to the OpenShift cluster. See Getting started with the OpenShift CLI. - Git version 2 or later
Procedure
Create a new ConfigMap with details about the Git server:
$ oc create configmap che-git-self-signed-cert \
  --from-file=ca.crt=<path_to_certificate> \  1
  --from-literal=githost=<host:port> -n openshift-devspaces  2
Note-
When
githostis not specified, the given certificate is used for all HTTPS repositories. -
Certificate files are typically stored as Base64 ASCII files, such as.
.pem,.crt,.ca-bundle. Also, they can be encoded as binary data, for example,.cer. AllSecretsthat hold certificate files should use the Base64 ASCII certificate rather than the binary data certificate.
-
When
Add the required labels to the ConfigMap:
$ oc label configmap che-git-self-signed-cert \
  app.kubernetes.io/part-of=che.eclipse.org -n openshift-devspaces
Configure OpenShift Dev Spaces operand to use self-signed certificates for Git repositories. See Section 3.1.2, “Using the CLI to configure the CheCluster Custom Resource”.
spec:
  devEnvironments:
    trustedCerts:
      gitTrustedCertsConfigMapName: che-git-self-signed-cert
Verification steps
Create and start a new workspace. Every container used by the workspace mounts a special volume that contains a file with the self-signed certificate. The container’s
/etc/gitconfigfile contains information about the Git server host (its URL) and the path to the certificate in thehttpsection (see Git documentation about git-config).Example 3.11. Contents of an
/etc/gitconfigfile[http "https://10.33.177.118:3000"] sslCAInfo = /etc/config/che-git-tls-creds/certificate
3.4.4. Configuring workspaces nodeSelector
This section describes how to configure nodeSelector for Pods of OpenShift Dev Spaces workspaces.
Procedure
OpenShift Dev Spaces uses the CHE_WORKSPACE_POD_NODE__SELECTOR environment variable to configure nodeSelector. This variable can contain a set of comma-separated key=value pairs to form the nodeSelector rule, or NULL to disable it.
CHE_WORKSPACE_POD_NODE__SELECTOR=disktype=ssd,cpu=xlarge,[key=value]
nodeSelector must be configured during OpenShift Dev Spaces installation. This prevents existing workspaces from failing to run due to volumes affinity conflict caused by existing workspace PVC and Pod being scheduled in different zones.
To avoid Pods and PVCs to be scheduled in different zones on large, multizone clusters, create an additional StorageClass object (pay attention to the allowedTopologies field), which will coordinate the PVC creation process.
Pass the name of this newly created StorageClass to OpenShift Dev Spaces through the CHE_INFRA_KUBERNETES_PVC_STORAGE__CLASS__NAME environment variable. A default empty value of this variable instructs OpenShift Dev Spaces to use the cluster’s default StorageClass.
3.4.5. Open VSX registry URL
To search and install extensions, the Visual Studio Code editor uses an embedded Open VSX registry instance. You can also configure OpenShift Dev Spaces to use another Open VSX registry instance rather than the embedded one.
Procedure
Set the URL of your Open VSX registry instance in the CheCluster Custom Resource
spec.components.pluginRegistry.openVSXURLfield.spec: components: # [...] pluginRegistry: openVSXRegistryURL: <your_open_vsx_registy> # [...]
3.5. Caching images for faster workspace start
To improve the start time performance of OpenShift Dev Spaces workspaces, use the Image Puller, a OpenShift Dev Spaces-agnostic component that can be used to pre-pull images for OpenShift clusters. The Image Puller is an additional OpenShift deployment which creates a DaemonSet that can be configured to pre-pull relevant OpenShift Dev Spaces workspace images on each node. These images would already be available when a OpenShift Dev Spaces workspace starts, therefore improving the workspace start time.
The Image Puller provides the following parameters for configuration.
Table 3.16. Image Puller parameters
| Parameter | Usage | Default |
|---|---|---|
|
| DaemonSets health checks interval in hours |
|
|
| The memory request for each cached image while the puller is running. See Section 3.5.2, “Defining the memory settings”. |
|
|
| The memory limit for each cached image while the puller is running. See Section 3.5.2, “Defining the memory settings”. |
|
|
| The processor request for each cached image while the puller is running |
|
|
| The processor limit for each cached image while the puller is running |
|
|
| Name of DaemonSet to create |
|
|
| Name of the Deployment to create |
|
|
| OpenShift project containing DaemonSet to create |
|
|
|
Semicolon-separated list of images to pull, in the format | |
|
| Node selector to apply to the pods created by the DaemonSet |
|
|
| Affinity applied to pods created by the DaemonSet |
|
|
|
List of image pull secrets, in the format |
|
Additional resources
3.5.1. Defining the list of images
The Image Puller can pre-pull most images, including scratch images such as che-machine-exec. However, images that mount volumes in the Dockerfile, such as traefik, are not supported for pre-pulling on OpenShift 3.11.
Procedure
-
Gather a list of relevant container images to pull by navigating to the
"https://devspaces-<openshift_deployment_name>.<domain_name>"/plugin-registry/v3/external_images.txtURL. -
Determine images from the list for pre-pulling. For faster workspace startup times, consider pulling workspace related images such as
universal-developer-image, che-code`, andche-gateway.
3.5.2. Defining the memory settings
Define the memory requests and limits parameters to ensure pulled containers and the platform have enough memory to run.
Prerequisites
Procedure
-
To define the minimal value for
CACHING_MEMORY_REQUESTorCACHING_MEMORY_LIMIT, consider the necessary amount of memory required to run each of the container images to pull. To define the maximal value for
CACHING_MEMORY_REQUESTorCACHING_MEMORY_LIMIT, consider the total memory allocated to the DaemonSet Pods in the cluster:(memory limit) * (number of images) * (number of nodes in the cluster)
Pulling 5 images on 20 nodes, with a container memory limit of
20Mirequires2000Miof memory.
3.5.3. Installing Image Puller on OpenShift using the web console
You can install the community supported Kubernetes Image Puller Operator on OpenShift using the OpenShift web console.
Prerequisites
- Section 3.5.1, “Defining the list of images”
- Section 3.5.2, “Defining the memory settings”.
- An OpenShift web console session by a cluster administrator. See Accessing the web console.
Procedure
- Install the community supported Kubernetes Image Puller Operator. See Installing from OperatorHub using the web console.
-
Create a kubernetes-image-puller
KubernetesImagePulleroperand from the community supported Kubernetes Image Puller Operator. See Creating applications from installed Operators.
3.5.4. Installing Image Puller on OpenShift using CLI
You can install the Kubernetes Image Puller on OpenShift by using OpenShift oc management tool.
Prerequisites
- Section 3.5.1, “Defining the list of images”.
- Section 3.5.2, “Defining the memory settings”.
-
An active
ocsession with administrative permissions to the OpenShift cluster. See Getting started with the OpenShift CLI.
Procedure
Clone the Image Puller repository and get in the directory containing the OpenShift templates:
$ git clone https://github.com/che-incubator/kubernetes-image-puller
$ cd kubernetes-image-puller/deploy/openshift
Configure the
app.yaml,configmap.yamlandserviceaccount.yamlOpenShift templates using following parameters:Table 3.17. Image Puller OpenShift templates parameters in
app.yamlValue Usage Default DEPLOYMENT_NAMEThe value of
DEPLOYMENT_NAMEin the ConfigMapkubernetes-image-pullerIMAGEImage used for the
kubernetes-image-pullerdeploymentregistry.redhat.io/devspaces/imagepuller-rhel8:3.3IMAGE_TAGThe image tag to pull
latestSERVICEACCOUNT_NAMEThe name of the ServiceAccount created and used by the deployment
kubernetes-image-pullerTable 3.18. Image Puller OpenShift templates parameters in
configmap.yamlValue Usage Default CACHING_CPU_LIMITThe value of
CACHING_CPU_LIMITin the ConfigMap.2CACHING_CPU_REQUESTThe value of
CACHING_CPU_REQUESTin the ConfigMap.05CACHING_INTERVAL_HOURSThe value of
CACHING_INTERVAL_HOURSin the ConfigMap"1"CACHING_MEMORY_LIMITThe value of
CACHING_MEMORY_LIMITin the ConfigMap"20Mi"CACHING_MEMORY_REQUESTThe value of
CACHING_MEMORY_REQUESTin the ConfigMap"10Mi"DAEMONSET_NAMEThe value of
DAEMONSET_NAMEin the ConfigMapkubernetes-image-pullerDEPLOYMENT_NAMEThe value of
DEPLOYMENT_NAMEin the ConfigMapkubernetes-image-pullerIMAGESThe value of
IMAGESin the ConfigMap"undefined"NAMESPACEThe value of
NAMESPACEin the ConfigMapk8s-image-pullerNODE_SELECTORThe value of
NODE_SELECTORin the ConfigMap"{}"Table 3.19. Image Puller OpenShift templates parameters in
serviceaccount.yamlValue Usage Default SERVICEACCOUNT_NAMEThe name of the ServiceAccount created and used by the deployment
kubernetes-image-pullerCreate an OpenShift project to host the Image Puller:
$ oc new-project <k8s-image-puller>Process and apply the templates to install the puller:
$ oc process -f serviceaccount.yaml | oc apply -f -
$ oc process -f configmap.yaml | oc apply -f -
$ oc process -f app.yaml | oc apply -f -
Verification steps
Verify the existence of a <kubernetes-image-puller> deployment and a <kubernetes-image-puller> DaemonSet. The DaemonSet needs to have a Pod for each node in the cluster:
$ oc get deployment,daemonset,pod --namespace <k8s-image-puller>Verify the values of the <kubernetes-image-puller>
ConfigMap.$ oc get configmap <kubernetes-image-puller> --output yaml
3.6. Configuring observability
To configure OpenShift Dev Spaces observability features, see:
3.6.1. Che-Theia workspaces
3.6.1.1. Telemetry overview
Telemetry is the explicit and ethical collection of operation data. By default, telemetry is not available in Red Hat OpenShift Dev Spaces, but in the Che-Theia editor there is an abstract API that allows enabling telemetry using the plug-in mechanism and in the chectl command line tool usage data can be collected using segment. This approach is used in the "Eclipse Che hosted by Red Hat" service where telemetry is enabled for every Che-Theia workspace.
This documentation includes a guide describing how to make your own telemetry client for Red Hat OpenShift Dev Spaces, followed by an overview of the Red Hat OpenShift Dev Spaces Woopra Telemetry Plugin.
3.6.1.2. Use cases
Red Hat OpenShift Dev Spaces telemetry API allows tracking:
- Duration of a workspace utilization
- User-driven actions such as file editing, committing, and pushing to remote repositories.
- Programming languages and devfiles used in workspaces.
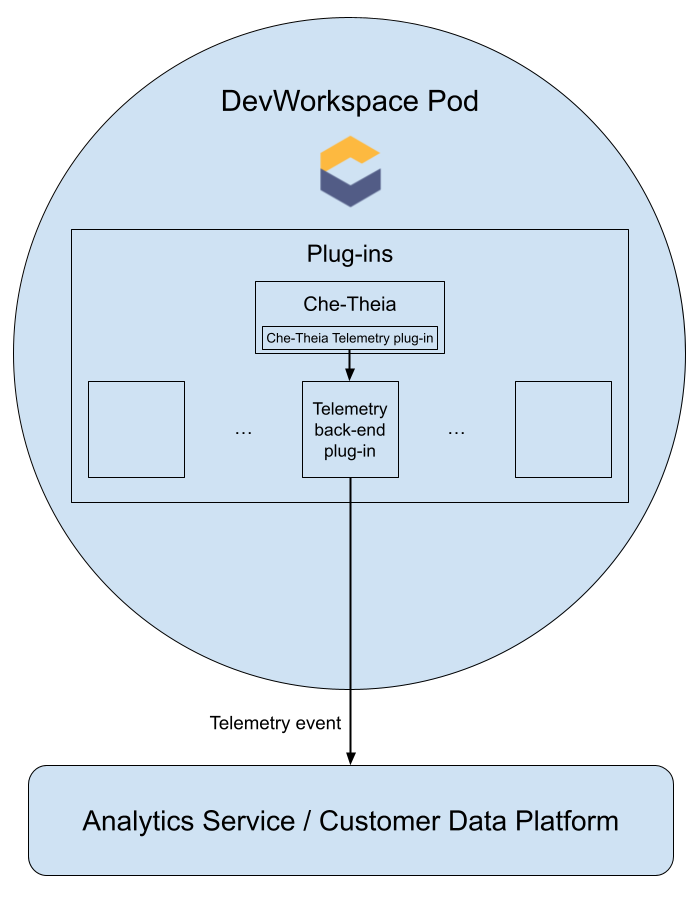
3.6.1.3. How it works
When a Dev Workspace starts, the che-theia container starts the telemetry plug-in which is responsible for sending telemetry events to a backend. If the $DEVWORKSPACE_TELEMETRY_BACKEND_PORT environment variable is set in the Dev Workspace Pod, the telemetry plug-in sends events to a backend listening at that port. The backend turns received events into a backend-specific representation of the events and sends them to the configured analytics backend (for example, Segment or Woopra).
3.6.1.4. Events sent to the backend by the Che-Theia telemetry plug-in
| Event | Description |
|---|---|
| WORKSPACE_OPENED | Sent when Che-Theia starts running |
| COMMIT_LOCALLY |
Sent when a commit was made locally with the |
| PUSH_TO_REMOTE |
Sent when a Git push was made with the |
| EDITOR_USED | Sent when a file was changed within the editor |
Other events such as WORKSPACE_INACTIVE and WORKSPACE_STOPPED can be detected within the back-end plug-in.
3.6.1.5. The Woopra telemetry plug-in
The Woopra Telemetry Plugin is a plug-in built to send telemetry from a Red Hat OpenShift Dev Spaces installation to Segment and Woopra. This plug-in is used by Eclipse Che hosted by Red Hat, but any Red Hat OpenShift Dev Spaces deployment can take advantage of this plug-in. There are no dependencies other than a valid Woopra domain and Segment Write key. The devfile v2 for the plug-in, plugin.yaml, has four environment variables that can be passed to the plug-in:
-
WOOPRA_DOMAIN- The Woopra domain to send events to. -
SEGMENT_WRITE_KEY- The write key to send events to Segment and Woopra. -
WOOPRA_DOMAIN_ENDPOINT- If you prefer not to pass in the Woopra domain directly, the plug-in will get it from a supplied HTTP endpoint that returns the Woopra Domain. -
SEGMENT_WRITE_KEY_ENDPOINT- If you prefer not to pass in the Segment write key directly, the plug-in will get it from a supplied HTTP endpoint that returns the Segment write key.
To enable the Woopra plug-in on the Red Hat OpenShift Dev Spaces installation:
Procedure
Deploy the
plugin.yamldevfile v2 file to an HTTP server with the environment variables set correctly.Configure the
CheClusterCustom Resource. See Section 3.1.2, “Using the CLI to configure the CheCluster Custom Resource”.spec: devEnvironments: defaultPlugins: - editor: eclipse/che-theia/next 1 plugins: 2 - 'https://your-web-server/plugin.yaml'
3.6.1.6. Creating a telemetry plug-in
This section shows how to create an AnalyticsManager class that extends AbstractAnalyticsManager and implements the following methods:
-
isEnabled()- determines whether the telemetry backend is functioning correctly. This can mean always returningtrue, or have more complex checks, for example, returningfalsewhen a connection property is missing. -
destroy()- cleanup method that is run before shutting down the telemetry backend. This method sends theWORKSPACE_STOPPEDevent. -
onActivity()- notifies that some activity is still happening for a given user. This is mainly used to sendWORKSPACE_INACTIVEevents. -
onEvent()- submits telemetry events to the telemetry server, such asWORKSPACE_USEDorWORKSPACE_STARTED. -
increaseDuration()- increases the duration of a current event rather than sending many events in a small frame of time.
The following sections cover:
- Creating a telemetry server to echo events to standard output.
- Extending the OpenShift Dev Spaces telemetry client and implementing a user’s custom backend.
-
Creating a
plugin.yamlfile representing a Dev Workspace plug-in for the custom backend. -
Specifying of a location of a custom plug-in to OpenShift Dev Spaces by setting the
workspacesDefaultPluginsattribute from theCheClustercustom resource.
3.6.1.6.1. Getting started
This document describes the steps required to extend the OpenShift Dev Spaces telemetry system to communicate with to a custom backend:
- Creating a server process that receives events
- Extending OpenShift Dev Spaces libraries to create a backend that sends events to the server
- Packaging the telemetry backend in a container and deploying it to an image registry
- Adding a plug-in for your backend and instructing OpenShift Dev Spaces to load the plug-in in your Dev Workspaces
A finished example of the telemetry backend is available here.
Creating a server that receives events
For demonstration purposes, this example shows how to create a server that receives events from our telemetry plug-in and writes them to standard output.
For production use cases, consider integrating with a third-party telemetry system (for example, Segment, Woopra) rather than creating your own telemetry server. In this case, use your provider’s APIs to send events from your custom backend to their system.
The following Go code starts a server on port 8080 and writes events to standard output:
Example 3.12. main.go
package main

import (
	"io/ioutil"
	"net/http"

	"go.uber.org/zap"
)

var logger *zap.SugaredLogger

func event(w http.ResponseWriter, req *http.Request) {
	switch req.Method {
	case "GET":
		logger.Info("GET /event")
	case "POST":
		logger.Info("POST /event")
	}
	body, err := req.GetBody()
	if err != nil {
		logger.With("err", err).Info("error getting body")
		return
	}
	responseBody, err := ioutil.ReadAll(body)
	if err != nil {
		logger.With("error", err).Info("error reading response body")
		return
	}
	logger.With("body", string(responseBody)).Info("got event")
}

func activity(w http.ResponseWriter, req *http.Request) {
	switch req.Method {
	case "GET":
		logger.Info("GET /activity, doing nothing")
	case "POST":
		logger.Info("POST /activity")
		body, err := req.GetBody()
		if err != nil {
			logger.With("error", err).Info("error getting body")
			return
		}
		responseBody, err := ioutil.ReadAll(body)
		if err != nil {
			logger.With("error", err).Info("error reading response body")
			return
		}
		logger.With("body", string(responseBody)).Info("got activity")
	}
}

func main() {

	log, _ := zap.NewProduction()
	logger = log.Sugar()

	http.HandleFunc("/event", event)
	http.HandleFunc("/activity", activity)
	logger.Info("Added Handlers")

	logger.Info("Starting to serve")
	http.ListenAndServe(":8080", nil)
}
Create a container image based on this code and expose it as a deployment in OpenShift in the openshift-devspaces project. The code for the example telemetry server is available at telemetry-server-example. To deploy the telemetry server, clone the repository and build the container:
$ git clone https://github.com/che-incubator/telemetry-server-example
$ cd telemetry-server-example
$ podman build -t registry/organization/telemetry-server-example:latest .
$ podman push registry/organization/telemetry-server-example:latest
Both manifest_with_ingress.yaml and manifest_with_route contain definitions for a Deployment and Service. The former also defines a Kubernetes Ingress, while the latter defines an OpenShift Route.
In the manifest file, replace the image and host fields to match the image you pushed, and the public hostname of your OpenShift cluster. Then run:
$ kubectl apply -f manifest_with_[ingress|route].yaml -n openshift-devspaces
3.6.1.6.2. Creating the back-end project
For fast feedback when developing, it is recommended to do development inside a Dev Workspace. This way, you can run the application in a cluster and receive events from the front-end telemetry plug-in.
Maven Quarkus project scaffolding:
mvn io.quarkus:quarkus-maven-plugin:2.7.1.Final:create \ -DprojectGroupId=mygroup -DprojectArtifactId=devworkspace-telemetry-example-plugin \ -DprojectVersion=1.0.0-SNAPSHOT-
Remove the files under
src/main/java/mygroupandsrc/test/java/mygroup. -
Consult the GitHub packages for the latest version and Maven coordinates of
backend-base. Add the following dependencies to your
pom.xml:Example 3.13.
pom.xml<!-- Required --> <dependency> <groupId>org.eclipse.che.incubator.workspace-telemetry</groupId> <artifactId>backend-base</artifactId> <version>LATEST VERSION FROM PREVIOUS STEP</version> </dependency> <!-- Used to make http requests to the telemetry server --> <dependency> <groupId>io.quarkus</groupId> <artifactId>quarkus-rest-client</artifactId> </dependency> <dependency> <groupId>io.quarkus</groupId> <artifactId>quarkus-rest-client-jackson</artifactId> </dependency>-
Create a personal access token with
read:packagespermissions to download theorg.eclipse.che.incubator.workspace-telemetry:backend-basedependency from GitHub packages. Add your GitHub username, personal access token and
che-incubatorrepository details in your~/.m2/settings.xmlfile:Example 3.14.
settings.xml<settings xmlns="http://maven.apache.org/SETTINGS/1.0.0" xmlns:xsi="http://www.w3.org/2001/XMLSchema-instance" xsi:schemaLocation="http://maven.apache.org/SETTINGS/1.0.0 http://maven.apache.org/xsd/settings-1.0.0.xsd"> <servers> <server> <id>che-incubator</id> <username>YOUR GITHUB USERNAME</username> <password>YOUR GITHUB TOKEN</password> </server> </servers> <profiles> <profile> <id>github</id> <activation> <activeByDefault>true</activeByDefault> </activation> <repositories> <repository> <id>central</id> <url>https://repo1.maven.org/maven2</url> <releases><enabled>true</enabled></releases> <snapshots><enabled>false</enabled></snapshots> </repository> <repository> <id>che-incubator</id> <url>https://maven.pkg.github.com/che-incubator/che-workspace-telemetry-client</url> </repository> </repositories> </profile> </profiles> </settings>
3.6.1.6.3. Creating a concrete implementation of AnalyticsManager and adding specialized logic
Create two files in your project under src/main/java/mygroup:
-
MainConfiguration.java- contains configuration provided toAnalyticsManager. -
AnalyticsManager.java- contains logic specific to the telemetry system.
Example 3.15. MainConfiguration.java
package org.my.group;

import java.util.Optional;

import javax.enterprise.context.Dependent;
import javax.enterprise.inject.Alternative;

import org.eclipse.che.incubator.workspace.telemetry.base.BaseConfiguration;
import org.eclipse.microprofile.config.inject.ConfigProperty;

@Dependent
@Alternative
public class MainConfiguration extends BaseConfiguration {
    @ConfigProperty(name = "welcome.message")      1
    Optional<String> welcomeMessage;               2
}- 1
- A MicroProfile configuration annotation is used to inject the
welcome.messageconfiguration.
For more details on how to set configuration properties specific to your backend, see the Quarkus Configuration Reference Guide.
Example 3.16. AnalyticsManager.java
package org.my.group;

import java.util.HashMap;
import java.util.Map;

import javax.enterprise.context.Dependent;
import javax.enterprise.inject.Alternative;
import javax.inject.Inject;

import org.eclipse.che.incubator.workspace.telemetry.base.AbstractAnalyticsManager;
import org.eclipse.che.incubator.workspace.telemetry.base.AnalyticsEvent;
import org.eclipse.che.incubator.workspace.telemetry.finder.DevWorkspaceFinder;
import org.eclipse.che.incubator.workspace.telemetry.finder.UsernameFinder;
import org.eclipse.microprofile.rest.client.inject.RestClient;
import org.slf4j.Logger;

import static org.slf4j.LoggerFactory.getLogger;

@Dependent
@Alternative
public class AnalyticsManager extends AbstractAnalyticsManager {

    private static final Logger LOG = getLogger(AbstractAnalyticsManager.class);

    public AnalyticsManager(MainConfiguration mainConfiguration, DevWorkspaceFinder devworkspaceFinder, UsernameFinder usernameFinder) {
        super(mainConfiguration, devworkspaceFinder, usernameFinder);

        mainConfiguration.welcomeMessage.ifPresentOrElse(     1
            (str) -> LOG.info("The welcome message is: {}", str),
            () -> LOG.info("No welcome message provided")
        );
    }

    @Override
    public boolean isEnabled() {
        return true;
    }

    @Override
    public void destroy() {}

    @Override
    public void onEvent(AnalyticsEvent event, String ownerId, String ip, String userAgent, String resolution, Map<String, Object> properties) {
        LOG.info("The received event is: {}", event);         2
    }

    @Override
    public void increaseDuration(AnalyticsEvent event, Map<String, Object> properties) { }

    @Override
    public void onActivity() {}
}
Since org.my.group.AnalyticsManager and org.my.group.MainConfiguration are alternative beans, specify them using the quarkus.arc.selected-alternatives property in src/main/resources/application.properties.
Example 3.17. application.properties
quarkus.arc.selected-alternatives=MainConfiguration,AnalyticsManager
3.6.1.6.4. Running the application within a Dev Workspace
Set the
DEVWORKSPACE_TELEMETRY_BACKEND_PORTenvironment variable in the Dev Workspace. Here, the value is set to4167.spec: template: attributes: workspaceEnv: - name: DEVWORKSPACE_TELEMETRY_BACKEND_PORT value: '4167'- Restart the Dev Workspace from the Red Hat OpenShift Dev Spaces dashboard.
Run the following command within a Dev Workspace’s terminal window to start the application. Use the
--settingsflag to specify path to the location of thesettings.xmlfile that contains the GitHub access token.$ mvn --settings=settings.xml quarkus:dev -Dquarkus.http.port=${DEVWORKSPACE_TELEMETRY_BACKEND_PORT}The application now receives telemetry events through port
4167from the front-end plug-in.
Verification steps
Verify that the following output is logged:
INFO  [org.ecl.che.inc.AnalyticsManager] (Quarkus Main Thread) No welcome message provided
INFO  [io.quarkus] (Quarkus Main Thread) devworkspace-telemetry-example-plugin 1.0.0-SNAPSHOT on JVM (powered by Quarkus 2.7.2.Final) started in 0.323s. Listening on: http://localhost:4167
INFO  [io.quarkus] (Quarkus Main Thread) Profile dev activated. Live Coding activated.
INFO  [io.quarkus] (Quarkus Main Thread) Installed features: [cdi, kubernetes-client, rest-client, rest-client-jackson, resteasy, resteasy-jsonb, smallrye-context-propagation, smallrye-openapi, swagger-ui, vertx]
To verify that the
onEvent()method ofAnalyticsManagerreceives events from the front-end plug-in, press the l key to disable Quarkus live coding and edit any file within the IDE. The following output should be logged:INFO [io.qua.dep.dev.RuntimeUpdatesProcessor] (Aesh InputStream Reader) Live reload disabled INFO [org.ecl.che.inc.AnalyticsManager] (executor-thread-2) The received event is: Edit Workspace File in Che
3.6.1.6.5. Implementing isEnabled()
For the purposes of the example, this method always returns true whenever it is called.
Example 3.18. AnalyticsManager.java
@Override
public boolean isEnabled() {
    return true;
}
It is possible to put more complex logic in isEnabled(). For example, the hosted OpenShift Dev Spaces Woopra backend checks that a configuration property exists before determining if the backend is enabled.
3.6.1.6.6. Implementing onEvent()
onEvent() sends the event received by the backend to the telemetry system. For the example application, it sends an HTTP POST payload to the /event endpoint from the telemetry server.
Sending a POST request to the example telemetry server
For the following example, the telemetry server application is deployed to OpenShift at the following URL: http://little-telemetry-server-che.apps-crc.testing, where apps-crc.testing is the ingress domain name of the OpenShift cluster.
Set up the RESTEasy REST Client by creating
TelemetryService.javaExample 3.19.
TelemetryService.javapackage org.my.group; import java.util.Map; import javax.ws.rs.Consumes; import javax.ws.rs.POST; import javax.ws.rs.Path; import javax.ws.rs.core.MediaType; import javax.ws.rs.core.Response; import org.eclipse.microprofile.rest.client.inject.RegisterRestClient; @RegisterRestClient public interface TelemetryService { @POST @Path("/event") 1 @Consumes(MediaType.APPLICATION_JSON) Response sendEvent(Map<String, Object> payload); }- 1
- The endpoint to make the
POSTrequest to.
Specify the base URL for
TelemetryServicein thesrc/main/resources/application.propertiesfile:Example 3.20.
application.propertiesorg.my.group.TelemetryService/mp-rest/url=http://little-telemetry-server-che.apps-crc.testing
Inject
TelemetryServiceintoAnalyticsManagerand send aPOSTrequest inonEvent()Example 3.21.
AnalyticsManager.java@Dependent @Alternative public class AnalyticsManager extends AbstractAnalyticsManager { @Inject @RestClient TelemetryService telemetryService; ... @Override public void onEvent(AnalyticsEvent event, String ownerId, String ip, String userAgent, String resolution, Map<String, Object> properties) { Map<String, Object> payload = new HashMap<String, Object>(properties); payload.put("event", event); telemetryService.sendEvent(payload); }This sends an HTTP request to the telemetry server and automatically delays identical events for a small period of time. The default duration is 1500 milliseconds.
3.6.1.6.7. Implementing increaseDuration()
Many telemetry systems recognize event duration. The AbstractAnalyticsManager merges similar events that happen in the same frame of time into one event. This implementation of increaseDuration() is a no-op. This method uses the APIs of the user’s telemetry provider to alter the event or event properties to reflect the increased duration of an event.
Example 3.22. AnalyticsManager.java
@Override
public void increaseDuration(AnalyticsEvent event, Map<String, Object> properties) {}
3.6.1.6.8. Implementing onActivity()
Set an inactive timeout limit, and use onActivity() to send a WORKSPACE_INACTIVE event if the last event time is longer than the timeout.
Example 3.23. AnalyticsManager.java
public class AnalyticsManager extends AbstractAnalyticsManager {

    ...

    private long inactiveTimeLimit = 60000 * 3;

    ...

    @Override
    public void onActivity() {
        if (System.currentTimeMillis() - lastEventTime >= inactiveTimeLimit) {
            onEvent(WORKSPACE_INACTIVE, lastOwnerId, lastIp, lastUserAgent, lastResolution, commonProperties);
        }
    }
3.6.1.6.9. Implementing destroy()
When destroy() is called, send a WORKSPACE_STOPPED event and shutdown any resources such as connection pools.
Example 3.24. AnalyticsManager.java
@Override
public void destroy() {
    onEvent(WORKSPACE_STOPPED, lastOwnerId, lastIp, lastUserAgent, lastResolution, commonProperties);
}
Running mvn quarkus:dev as described in Section 3.6.1.6.4, “Running the application within a Dev Workspace” and terminating the application with Ctrl+C sends a WORKSPACE_STOPPED event to the server.
3.6.1.6.10. Packaging the Quarkus application
See the Quarkus documentation for the best instructions to package the application in a container. Build and push the container to a container registry of your choice.
Sample Dockerfile for building a Quarkus image running with JVM
Example 3.25. Dockerfile.jvm
FROM registry.access.redhat.com/ubi8/openjdk-11:1.11

ENV LANG='en_US.UTF-8' LANGUAGE='en_US:en'

COPY --chown=185 target/quarkus-app/lib/ /deployments/lib/
COPY --chown=185 target/quarkus-app/*.jar /deployments/
COPY --chown=185 target/quarkus-app/app/ /deployments/app/
COPY --chown=185 target/quarkus-app/quarkus/ /deployments/quarkus/

EXPOSE 8080
USER 185

ENTRYPOINT ["java", "-Dquarkus.http.host=0.0.0.0", "-Djava.util.logging.manager=org.jboss.logmanager.LogManager", "-Dquarkus.http.port=${DEVWORKSPACE_TELEMETRY_BACKEND_PORT}", "-jar", "/deployments/quarkus-run.jar"]
To build the image, run:
mvn package && \
podman build -f src/main/docker/Dockerfile.jvm -t image:tag .
Sample Dockerfile for building a Quarkus native image
Example 3.26. Dockerfile.native
FROM registry.access.redhat.com/ubi8/ubi-minimal:8.5
WORKDIR /work/
RUN chown 1001 /work \
    && chmod "g+rwX" /work \
    && chown 1001:root /work
COPY --chown=1001:root target/*-runner /work/application

EXPOSE 8080
USER 1001

CMD ["./application", "-Dquarkus.http.host=0.0.0.0", "-Dquarkus.http.port=$DEVWORKSPACE_TELEMETRY_BACKEND_PORT}"]
To build the image, run:
mvn package -Pnative -Dquarkus.native.container-build=true && \
podman build -f src/main/docker/Dockerfile.native -t image:tag .
3.6.1.6.11. Creating a plugin.yaml for your plug-in
Create a plugin.yaml devfile v2 file representing a Dev Workspace plug-in that runs your custom backend in a Dev Workspace Pod. For more information about devfile v2, see Devfile v2 documentation
Example 3.27. plugin.yaml
schemaVersion: 2.1.0
metadata:
  name: devworkspace-telemetry-backend-plugin
  version: 0.0.1
  description: A Demo telemetry backend
  displayName: Devworkspace Telemetry Backend
components:
  - name: devworkspace-telemetry-backend-plugin
    attributes:
      workspaceEnv:
        - name: DEVWORKSPACE_TELEMETRY_BACKEND_PORT
          value: '4167'
    container:
      image: YOUR IMAGE            1
      env:
        - name: WELCOME_MESSAGE    2
value: 'hello world!'- 1
- Specify the container image built from Section 3.6.1.6.10, “Packaging the Quarkus application”.
- 2
- Set the value for the
welcome.messageoptional configuration property from Example 4.
Typically, the user deploys this file to a corporate web server. This guide demonstrates how to create an Apache web server on OpenShift and host the plug-in there.
Create a ConfigMap object that references the new plugin.yaml file.
$ oc create configmap --from-file=plugin.yaml -n openshift-devspaces telemetry-plugin-yaml
Create a deployment, a service, and a route to expose the web server. The deployment references this ConfigMap object and places it in the /var/www/html directory.
Example 3.28. manifest.yaml
kind: Deployment
apiVersion: apps/v1
metadata:
  name: apache
spec:
  replicas: 1
  selector:
    matchLabels:
      app: apache
  template:
    metadata:
      labels:
        app: apache
    spec:
      volumes:
        - name: plugin-yaml
          configMap:
            name: telemetry-plugin-yaml
            defaultMode: 420
      containers:
        - name: apache
          image: 'registry.redhat.io/rhscl/httpd-24-rhel7:latest'
          ports:
            - containerPort: 8080
              protocol: TCP
          resources: {}
          volumeMounts:
            - name: plugin-yaml
              mountPath: /var/www/html
  strategy:
    type: RollingUpdate
    rollingUpdate:
      maxUnavailable: 25%
      maxSurge: 25%
  revisionHistoryLimit: 10
  progressDeadlineSeconds: 600
---
kind: Service
apiVersion: v1
metadata:
  name: apache
spec:
  ports:
    - protocol: TCP
      port: 8080
      targetPort: 8080
  selector:
    app: apache
  type: ClusterIP
---
kind: Route
apiVersion: route.openshift.io/v1
metadata:
  name: apache
spec:
  host: apache-che.apps-crc.testing
  to:
    kind: Service
    name: apache
    weight: 100
  port:
    targetPort: 8080
  wildcardPolicy: None
$ oc apply -f manifest.yaml
Verification steps
After the deployment has started, confirm that
plugin.yamlis available in the web server:$ curl apache-che.apps-crc.testing/plugin.yaml
3.6.1.6.12. Specifying the telemetry plug-in in a Dev Workspace
Add the following to the
componentsfield of an existing Dev Workspace:components: ... - name: telemetry-plug-in plugin: uri: http://apache-che.apps-crc.testing/plugin.yaml- Start the Dev Workspace from the OpenShift Dev Spaces dashboard.
Verification steps
Verify that the
telemetry-plug-incontainer is running in the Dev Workspace pod. Here, this is verified by checking the Workspace view within the editor.
- Edit files within the editor and observe their events in the example telemetry server’s logs.
3.6.1.6.13. Applying the telemetry plug-in for all Dev Workspaces
Set the telemetry plug-in as a default plug-in. Default plug-ins are applied on Dev Workspace startup for new and existing Dev Workspaces.
Configure the
CheClusterCustom Resource. See Section 3.1.2, “Using the CLI to configure the CheCluster Custom Resource”.spec: devEnvironments: defaultPlugins: - editor: eclipse/che-theia/next 1 plugins: 2 - 'http://apache-che.apps-crc.testing/plugin.yaml'
Additional resources
Verification steps
- Start a new or existing Dev Workspace from the Red Hat OpenShift Dev Spaces dashboard.
- Verify that the telemetry plug-in is working by following the verification steps for Section 3.6.1.6.12, “Specifying the telemetry plug-in in a Dev Workspace”.
3.6.2. Configuring server logging
It is possible to fine-tune the log levels of individual loggers available in the OpenShift Dev Spaces server.
The log level of the whole OpenShift Dev Spaces server is configured globally using the cheLogLevel configuration property of the Operator. See Section 3.1.3, “CheCluster Custom Resource fields reference”. To set the global log level in installations not managed by the Operator, specify the CHE_LOG_LEVEL environment variable in the che ConfigMap.
It is possible to configure the log levels of the individual loggers in the OpenShift Dev Spaces server using the CHE_LOGGER_CONFIG environment variable.
3.6.2.1. Configuring log levels
Procedure
Configure the
CheClusterCustom Resource. See Section 3.1.2, “Using the CLI to configure the CheCluster Custom Resource”.spec: components: cheServer: extraProperties: CHE_LOGGER_CONFIG: "<key1=value1,key2=value2>" 1- 1
- Comma-separated list of key-value pairs, where keys are the names of the loggers as seen in the OpenShift Dev Spaces server log output and values are the required log levels.
Example 3.29. Configuring debug mode for the
WorkspaceManagerspec: components: cheServer: extraProperties: CHE_LOGGER_CONFIG: "org.eclipse.che.api.workspace.server.WorkspaceManager=DEBUG"
3.6.2.2. Logger naming
The names of the loggers follow the class names of the internal server classes that use those loggers.
3.6.2.3. Logging HTTP traffic
Procedure
To log the HTTP traffic between the OpenShift Dev Spaces server and the API server of the Kubernetes or OpenShift cluster, configure the
CheClusterCustom Resource. See Section 3.1.2, “Using the CLI to configure the CheCluster Custom Resource”.spec: components: cheServer: extraProperties: CHE_LOGGER_CONFIG: "che.infra.request-logging=TRACE"
3.6.3. Collecting logs using dsc
An installation of Red Hat OpenShift Dev Spaces consists of several containers running in the OpenShift cluster. While it is possible to manually collect logs from each running container, dsc provides commands which automate the process.
Following commands are available to collect Red Hat OpenShift Dev Spaces logs from the OpenShift cluster using the dsc tool:
dsc server:logsCollects existing Red Hat OpenShift Dev Spaces server logs and stores them in a directory on the local machine. By default, logs are downloaded to a temporary directory on the machine. However, this can be overwritten by specifying the
-dparameter. For example, to download OpenShift Dev Spaces logs to the/home/user/che-logs/directory, use the commanddsc server:logs -d /home/user/che-logs/
When run,
dsc server:logsprints a message in the console specifying the directory that will store the log files:Red Hat OpenShift Dev Spaces logs will be available in '/tmp/chectl-logs/1648575098344'
If Red Hat OpenShift Dev Spaces is installed in a non-default project,
dsc server:logsrequires the-n <NAMESPACE>paremeter, where<NAMESPACE>is the OpenShift project in which Red Hat OpenShift Dev Spaces was installed. For example, to get logs from OpenShift Dev Spaces in themy-namespaceproject, use the commanddsc server:logs -n my-namespace
dsc server:deploy-
Logs are automatically collected during the OpenShift Dev Spaces installation when installed using
dsc. As withdsc server:logs, the directory logs are stored in can be specified using the-dparameter.
Additional resources
3.6.4. Monitoring with Prometheus and Grafana
You can collect and view the OpenShift Dev Spaces metrics with a running instance of Prometheus and Grafana on the cluster.
3.6.4.1. Installing Prometheus and Grafana
You can install Prometheus and Grafana by applying template.yaml. The template.yaml file in this example provides a monitoring stack of basic configuration, Deployments and Services to get started with Prometheus and Grafana.
Alternatively, you can use the Prometheus Operator and Grafana Operator.
Prerequisites
- oc
Procedure
To install Prometheus and Grafana by using template.yaml:
Create a new project,
monitoring, for Prometheus and Grafana:$ oc new-project monitoring
Apply
template.yamlin themonitoringproject:$ oc apply -f template.yaml -n monitoring
Example 3.30. template.yaml
---
apiVersion: v1
kind: Service
metadata:
  name: grafana
  labels:
    app: grafana
spec:
  ports:
  - name: 3000-tcp
    port: 3000
    protocol: TCP
    targetPort: 3000
  selector:
    app: grafana
---
apiVersion: v1
kind: Service
metadata:
  name: prometheus
  labels:
    app: prometheus
spec:
  ports:
  - name: 9090-tcp
    port: 9090
    protocol: TCP
    targetPort: 9090
  selector:
    app: prometheus
---
apiVersion: apps/v1
kind: Deployment
metadata:
  labels:
    app: grafana
  name: grafana
spec:
  selector:
    matchLabels:
      app: grafana
  template:
    metadata:
      labels:
        app: grafana
    spec:
      containers:
      - image: registry.redhat.io/rhel8/grafana:7
        name: grafana
        ports:
        - containerPort: 3000
          protocol: TCP
---
apiVersion: apps/v1
kind: Deployment
metadata:
  labels:
    app: prometheus
  name: prometheus
spec:
  selector:
    matchLabels:
      app: prometheus
  template:
    metadata:
      labels:
        app: prometheus
    spec:
      serviceAccountName: prometheus
      containers:
      - image: quay.io/prometheus/prometheus:v2.36.0
        name: prometheus
        ports:
        - containerPort: 9090
          protocol: TCP
        volumeMounts:
        - mountPath: /prometheus
          name: volume-data
        - mountPath: /etc/prometheus/prometheus.yml
          name: volume-config
          subPath: prometheus.yml
      volumes:
      - emptyDir: {}
        name: volume-data
      - configMap:
          defaultMode: 420
          name: prometheus-config
        name: volume-config
---
apiVersion: v1
kind: ConfigMap
metadata:
  name: prometheus-config
data:
  prometheus.yml: ""
---
apiVersion: v1
kind: ServiceAccount
metadata:
  name: prometheus
---
Additional resources
3.6.4.2. Monitoring the Dev Workspace Operator
You can configure an example monitoring stack to process metrics exposed by the Dev Workspace Operator.
3.6.4.2.1. Collecting Dev Workspace Operator metrics with Prometheus
To use Prometheus to collect, store, and query metrics about the Dev Workspace Operator:
Prerequisites
-
The
devworkspace-controller-metricsService is exposing metrics on port8443. This is preconfigured by default. -
The
devworkspace-webhookserverService is exposing metrics on port9443. This is preconfigured by default. -
Prometheus 2.26.0 or later is running. The Prometheus console is running on port
9090with a corresponding Service. See First steps with Prometheus.
Procedure
Create a ClusterRoleBinding to bind the ServiceAccount associated with Prometheus to the devworkspace-controller-metrics-reader ClusterRole. For the example monitoring stack, the name of the ServiceAccount to be used is
prometheus.NoteWithout the ClusterRoleBinding, you cannot access Dev Workspace metrics because access is protected with role-based access control (RBAC).
Example 3.31. ClusterRoleBinding
apiVersion: rbac.authorization.k8s.io/v1
kind: ClusterRoleBinding
metadata:
  name: devworkspace-controller-metrics-binding
subjects:
  - kind: ServiceAccount
    name: prometheus
    namespace: monitoring
roleRef:
  apiGroup: rbac.authorization.k8s.io
  kind: ClusterRole
  name: devworkspace-controller-metrics-reader
Configure Prometheus to scrape metrics from port
8443exposed by thedevworkspace-controller-metricsService and from port9443exposed by thedevworkspace-webhookserverService.NoteThe example monitoring stack already creates the
prometheus-configConfigMap with an empty configuration. To provide the Prometheus configuration details, edit thedatafield of the ConfigMap.Example 3.32. Prometheus configuration
apiVersion: v1 kind: ConfigMap metadata: name: prometheus-config namespace: monitoring data: prometheus.yml: |- global: scrape_interval: 5s 1 evaluation_interval: 5s 2 scrape_configs: 3 - job_name: 'DevWorkspace' scheme: https authorization: type: Bearer credentials_file: '/var/run/secrets/kubernetes.io/serviceaccount/token' tls_config: insecure_skip_verify: true static_configs: - targets: ['devworkspace-controller-metrics.<DWO_project>:8443'] 4 - job_name: 'DevWorkspace webhooks' scheme: https authorization: type: Bearer credentials_file: '/var/run/secrets/kubernetes.io/serviceaccount/token' tls_config: insecure_skip_verify: true static_configs: - targets: ['devworkspace-webhookserver.<DWO_project>:9443'] 5- 1
- The rate at which a target is scraped.
- 2
- The rate at which the recording and alerting rules are re-checked.
- 3
- The resources that Prometheus monitors. In the default configuration, two jobs,
DevWorkspaceandDevWorkspace webhooks, scrape the time series data exposed by thedevworkspace-controller-metricsanddevworkspace-webhookserverServices. - 4
- The scrape target for the metrics from port
8443. Replace<DWO_project>with the project where thedevworkspace-controller-metricsServiceis located. - 5
- The scrape target for the metrics from port
9443. Replace<DWO_project>with the project where thedevworkspace-webhookserverServiceis located.
Scale the
PrometheusDeployment down and up to read the updated ConfigMap from the previous step.$ oc scale --replicas=0 deployment/prometheus -n monitoring && oc scale --replicas=1 deployment/prometheus -n monitoring
Verification
Use port forwarding to access the
PrometheusService locally:$ oc port-forward svc/prometheus 9090:9090 -n monitoring
-
Verify that all targets are up by viewing the targets endpoint at
localhost:9090/targets. Use the Prometheus console to view and query metrics:
-
View metrics at
localhost:9090/metrics. Query metrics from
localhost:9090/graph.For more information, see Using the expression browser.
-
View metrics at
Additional resources
3.6.4.2.2. Dev Workspace-specific metrics
The following tables describe the Dev Workspace-specific metrics exposed by the devworkspace-controller-metrics Service.
Table 3.20. Metrics
| Name | Type | Description | Labels |
|---|---|---|---|
|
| Counter | Number of Dev Workspace starting events. |
|
|
| Counter |
Number of Dev Workspaces successfully entering the |
|
|
| Counter | Number of failed Dev Workspaces. |
|
|
| Histogram | Total time taken to start a Dev Workspace, in seconds. |
|
Table 3.21. Labels
| Name | Description | Values |
|---|---|---|
|
|
The |
|
|
|
The |
|
|
| The workspace startup failure reason. |
|
Table 3.22. Startup failure reasons
| Name | Description |
|---|---|
|
| Startup failure due to an invalid devfile used to create a Dev Workspace. |
|
|
Startup failure due to the following errors: |
|
| Unknown failure reason. |
3.6.4.2.3. Viewing Dev Workspace Operator metrics on Grafana dashboards
To view the Dev Workspace Operator metrics on Grafana with the example dashboard:
Prerequisites
- Prometheus is collecting metrics. See Section 3.6.4.2.1, “Collecting Dev Workspace Operator metrics with Prometheus”.
- Grafana version 7.5.3 or later.
-
Grafana is running on port
3000with a corresponding Service. See Installing Grafana.
Procedure
- Add the data source for the Prometheus instance. See Creating a Prometheus data source.
-
Import the example
grafana-dashboard.jsondashboard.
Verification steps
- Use the Grafana console to view the Dev Workspace Operator metrics dashboard. See Section 3.6.4.2.4, “Grafana dashboard for the Dev Workspace Operator”.
Additional resources
3.6.4.2.4. Grafana dashboard for the Dev Workspace Operator
The example Grafana dashboard based on grafana-dashboard.json displays the following metrics from the Dev Workspace Operator.
The Dev Workspace-specific metrics panel
Figure 3.1. The Dev Workspace-specific metrics panel
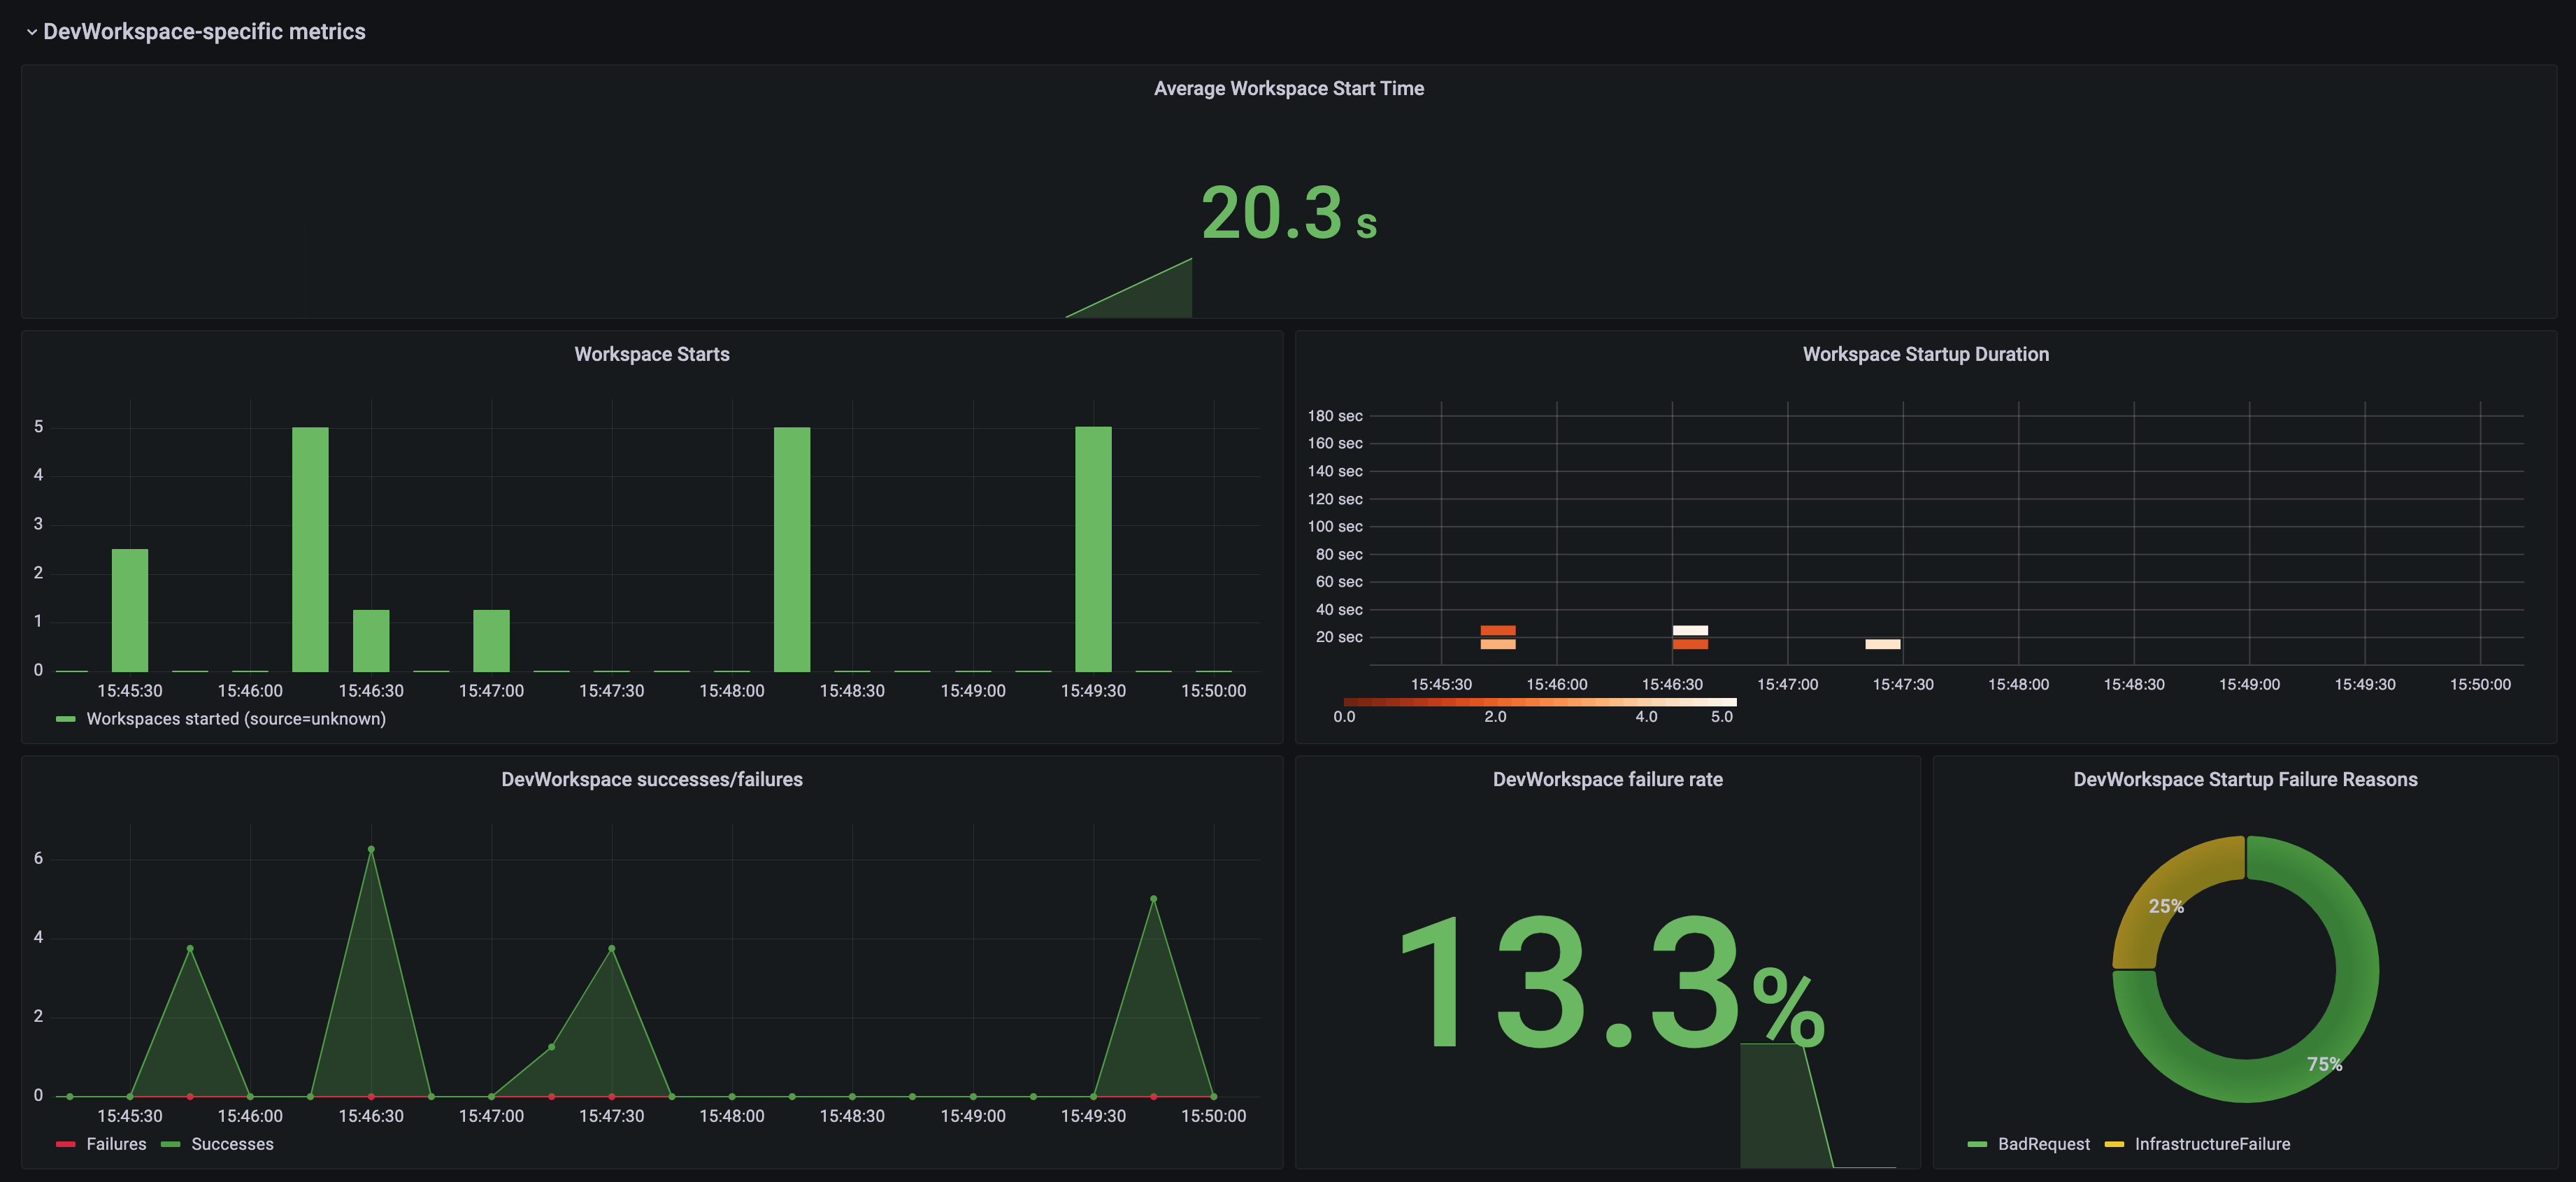
- Average workspace start time
- The average workspace startup duration.
- Workspace starts
- The number of successful and failed workspace startups.
- Workspace startup duration
- A heatmap that displays workspace startup duration.
- Dev Workspace successes / failures
- A comparison between successful and failed Dev Workspace startups.
- Dev Workspace failure rate
- The ratio between the number of failed workspace startups and the number of total workspace startups.
- Dev Workspace startup failure reasons
A pie chart that displays the distribution of workspace startup failures:
-
BadRequest -
InfrastructureFailure -
Unknown
-
The Operator metrics panel (part 1)
Figure 3.2. The Operator metrics panel (part 1)
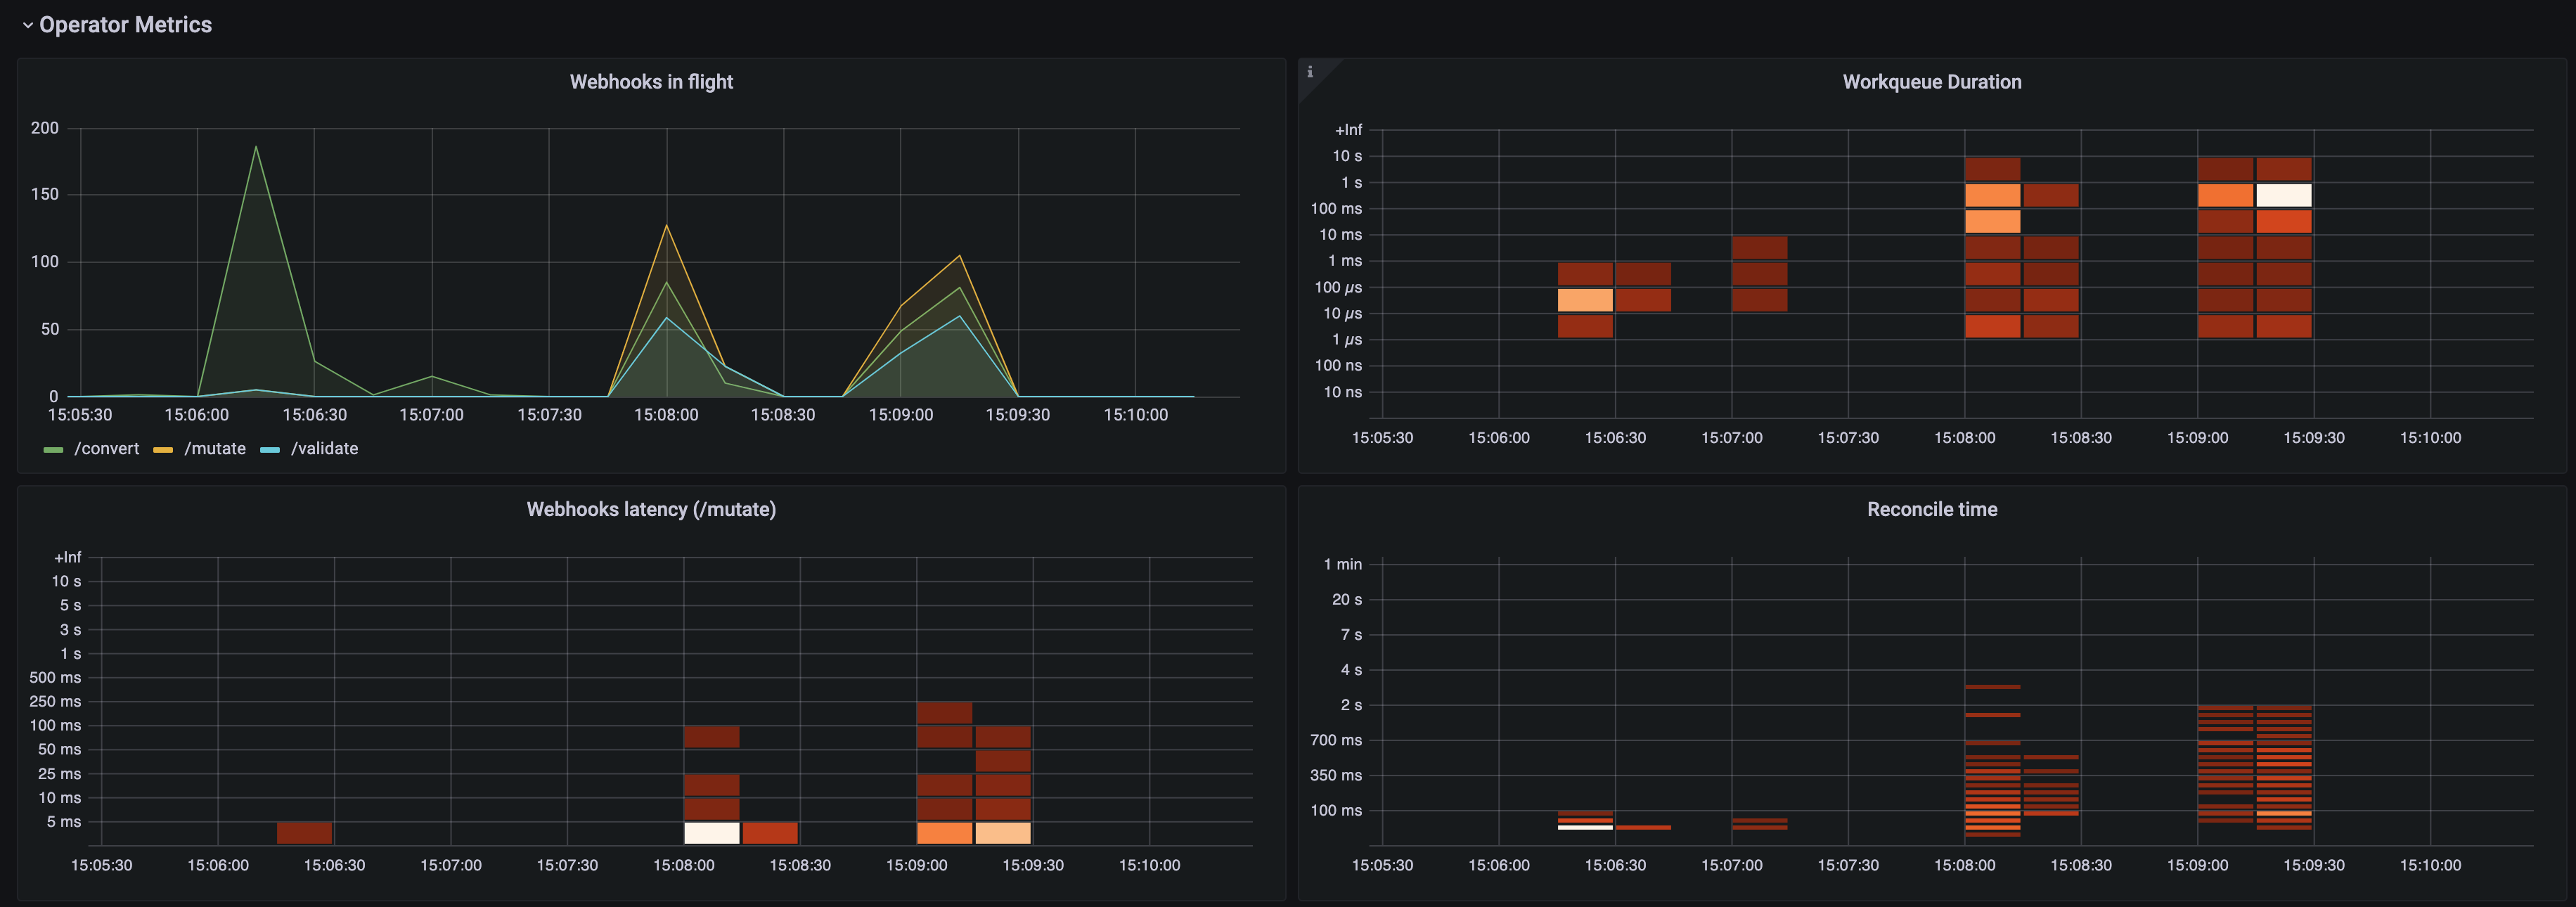
- Webhooks in flight
- A comparison between the number of different webhook requests.
- Work queue duration
- A heatmap that displays how long the reconcile requests stay in the work queue before they are handled.
- Webhooks latency (/mutate)
-
A heatmap that displays the
/mutatewebhook latency. - Reconcile time
- A heatmap that displays the reconcile duration.
The Operator metrics panel (part 2)
Figure 3.3. The Operator metrics panel (part 2)
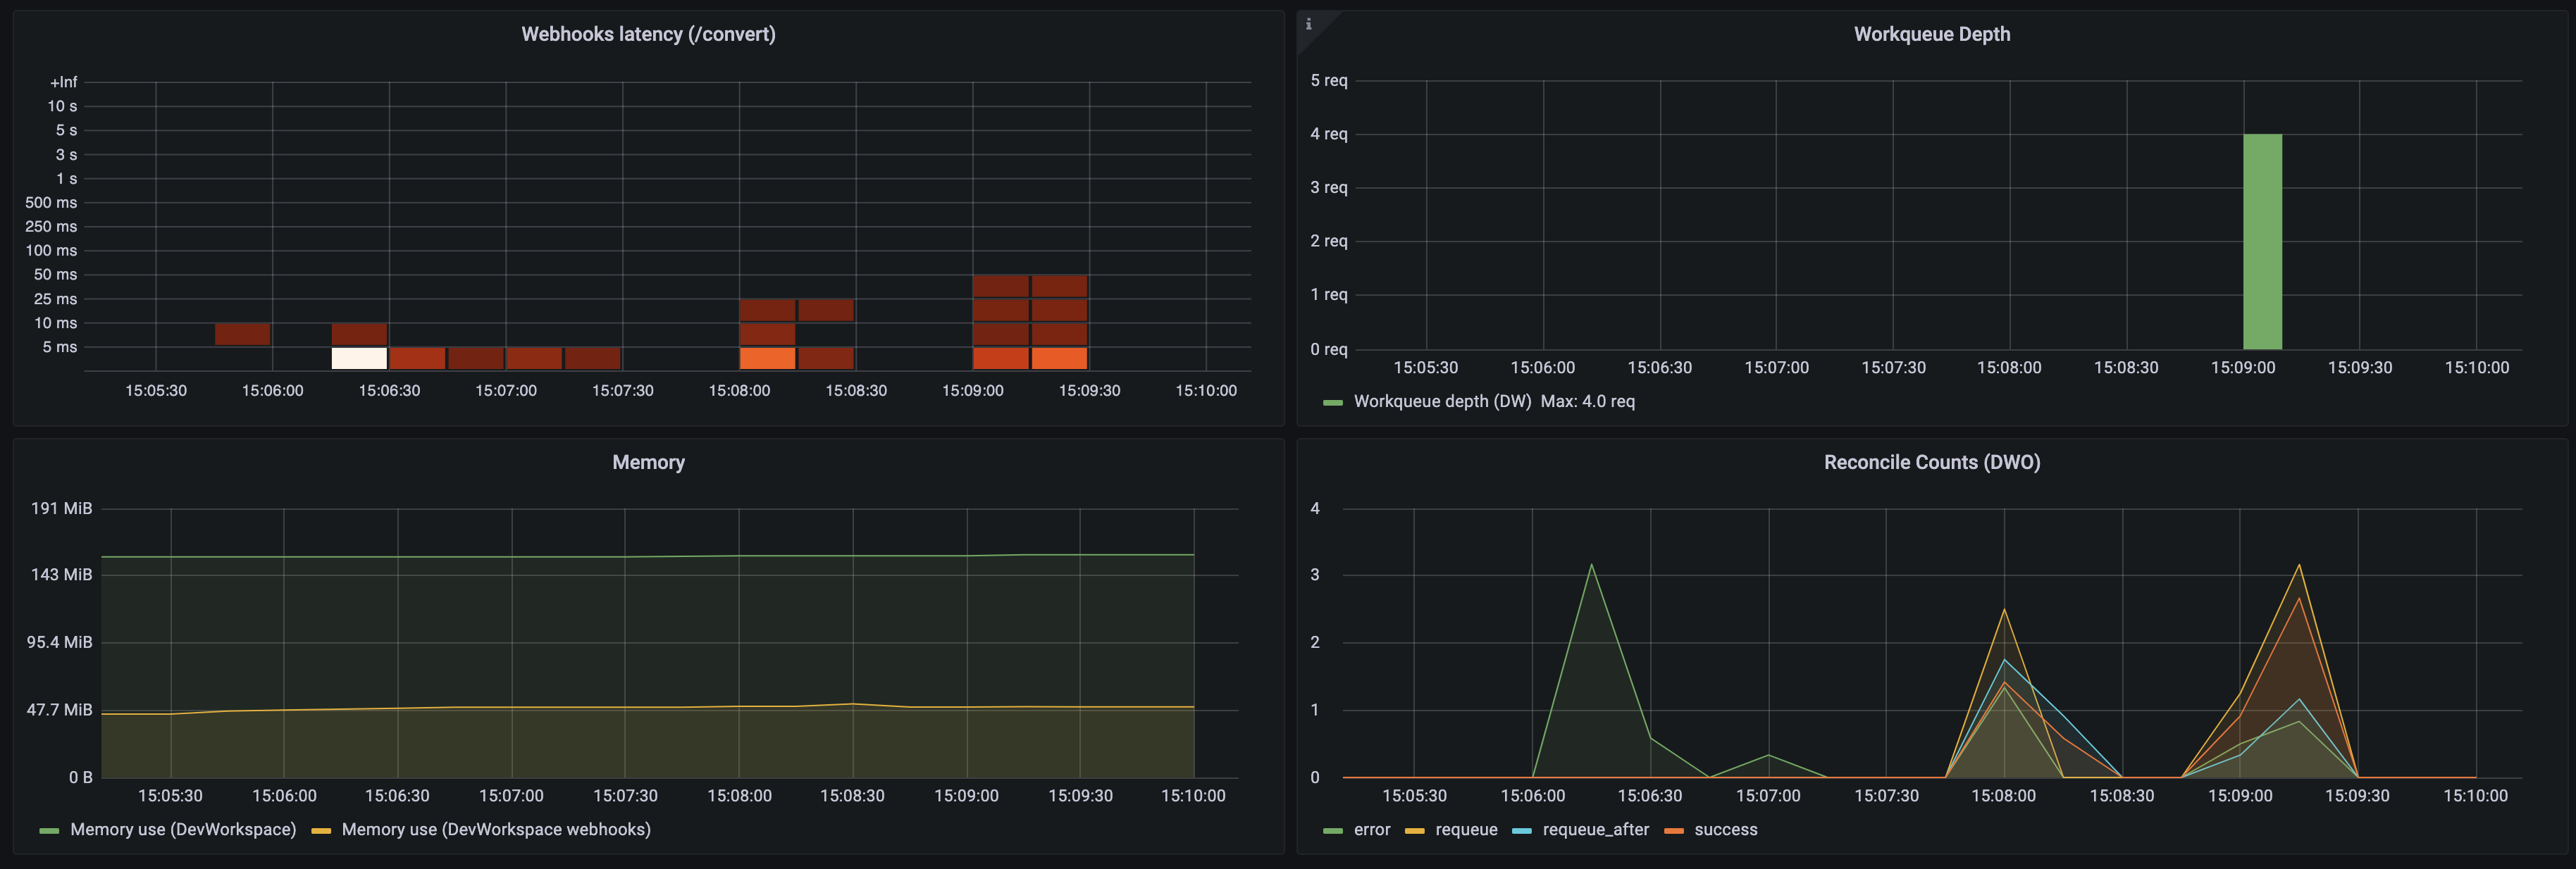
- Webhooks latency (/convert)
-
A heatmap that displays the
/convertwebhook latency. - Work queue depth
- The number of reconcile requests that are in the work queue.
- Memory
- Memory usage for the Dev Workspace controller and the Dev Workspace webhook server.
- Reconcile counts (DWO)
- The average per-second number of reconcile counts for the Dev Workspace controller.
3.6.4.3. Monitoring Dev Spaces Server
You can configure OpenShift Dev Spaces to expose JVM metrics such as JVM memory and class loading for OpenShift Dev Spaces Server.
3.6.4.3.1. Enabling and exposing OpenShift Dev Spaces Server metrics
OpenShift Dev Spaces exposes the JVM metrics on port 8087 of the che-host Service. You can configure this behaviour.
Procedure
Configure the
CheClusterCustom Resource. See Section 3.1.2, “Using the CLI to configure the CheCluster Custom Resource”.spec: components: metrics: enable: <boolean> 1- 1
trueto enable,falseto disable.
3.6.4.3.2. Collecting OpenShift Dev Spaces Server metrics with Prometheus
To use Prometheus to collect, store, and query JVM metrics for OpenShift Dev Spaces Server:
Prerequisites
-
OpenShift Dev Spaces is exposing metrics on port
8087. See Enabling and exposing OpenShift Dev Spaces server JVM metrics. -
Prometheus 2.26.0 or later is running. The Prometheus console is running on port
9090with a corresponding Service. See First steps with Prometheus.
Procedure
Configure Prometheus to scrape metrics from port
8087.NoteThe example monitoring stack already creates the
prometheus-configConfigMap with an empty configuration. To provide the Prometheus configuration details, edit thedatafield of the ConfigMap.Example 3.33. Prometheus configuration
apiVersion: v1 kind: ConfigMap metadata: name: prometheus-config data: prometheus.yml: |- global: scrape_interval: 5s 1 evaluation_interval: 5s 2 scrape_configs: 3 - job_name: 'OpenShift Dev Spaces Server' static_configs: - targets: ['che-host.<OpenShift Dev Spaces_project>:8087'] 4- 1
- The rate at which a target is scraped.
- 2
- The rate at which the recording and alerting rules are re-checked.
- 3
- The resources that Prometheus monitors. In the default configuration, a single job,
OpenShift Dev Spaces Server, scrapes the time series data exposed by OpenShift Dev Spaces Server. - 4
- The scrape target for the metrics from port
8087. Replace<OpenShift Dev Spaces_project>with the OpenShift Dev Spaces project. The default OpenShift Dev Spaces project isopenshift-devspaces.
Scale the
PrometheusDeployment down and up to read the updated ConfigMap from the previous step.$ oc scale --replicas=0 deployment/prometheus -n monitoring && oc scale --replicas=1 deployment/prometheus -n monitoring
Verification
Use port forwarding to access the
PrometheusService locally:$ oc port-forward svc/prometheus 9090:9090 -n monitoring
-
Verify that all targets are up by viewing the
targetsendpoint atlocalhost:9090/targets. Use the Prometheus console to view and query metrics:
-
View metrics at
localhost:9090/metrics. Query metrics from
localhost:9090/graph.For more information, see Using the expression browser.
-
View metrics at
Additional resources
3.6.4.3.3. Viewing OpenShift Dev Spaces Server metrics on Grafana dashboards
To view the OpenShift Dev Spaces Server metrics on Grafana:
Prerequisites
- Prometheus is collecting metrics on the OpenShift Dev Spaces cluster. See Section 3.6.4, “Monitoring with Prometheus and Grafana”.
-
Grafana 6.0 or later is running on port
3000with a corresponding Service. See Installing Grafana.
Procedure
- Add the data source for the Prometheus instance. See Creating a Prometheus data source.
- Import the example dashboard. See Import dashboard.
View the OpenShift Dev Spaces JVM metrics in the Grafana console:
Figure 3.4. OpenShift Dev Spaces server JVM dashboard
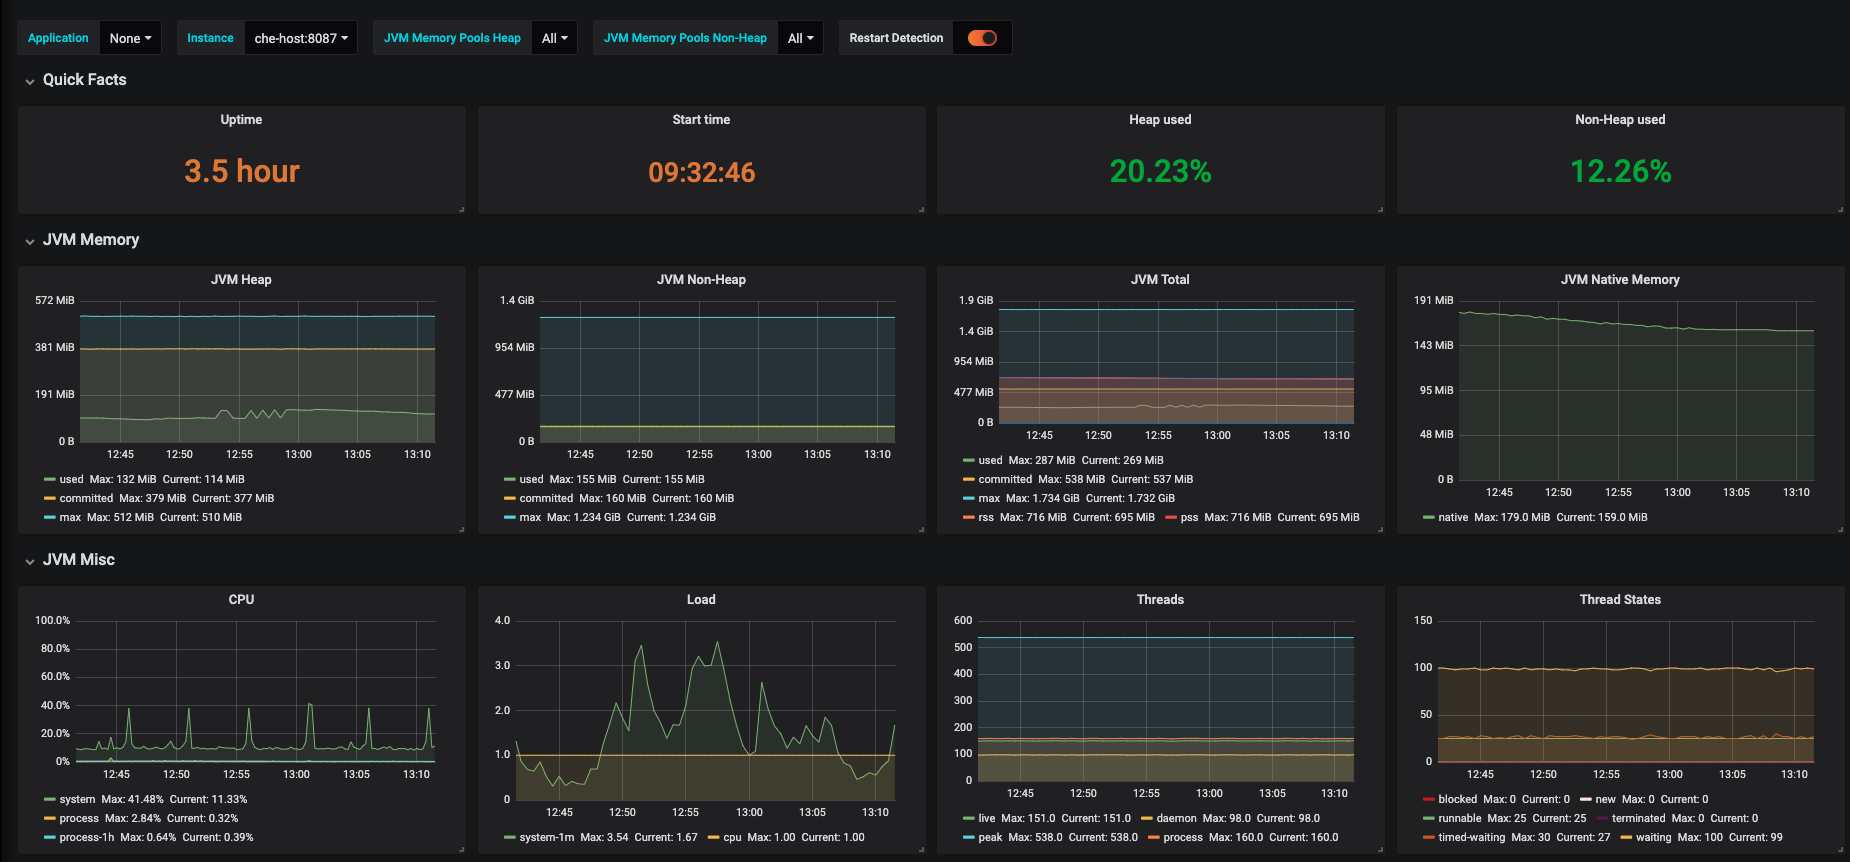
Figure 3.5. Quick Facts

Figure 3.6. JVM Memory
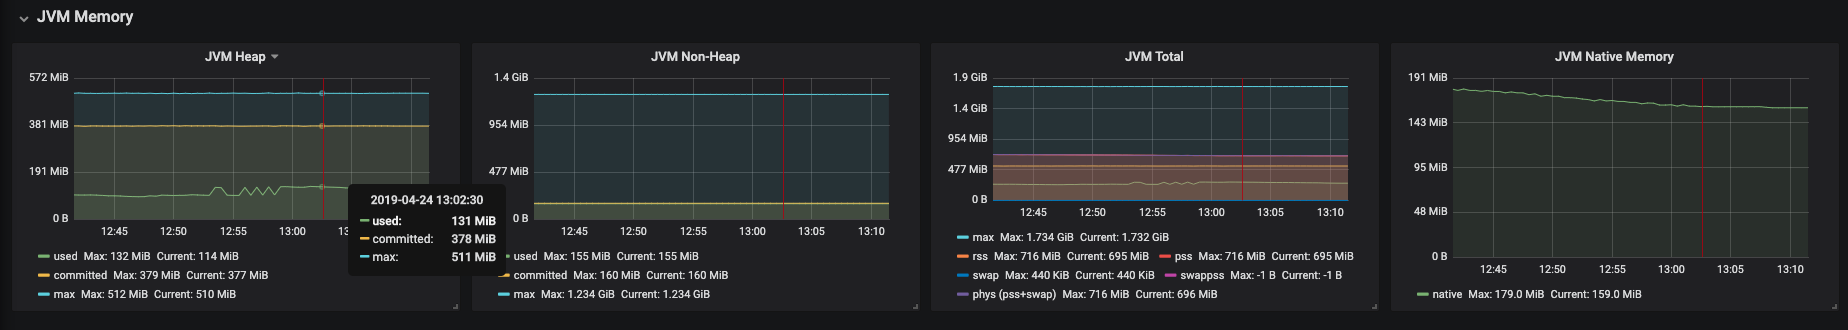
Figure 3.7. JVM Misc
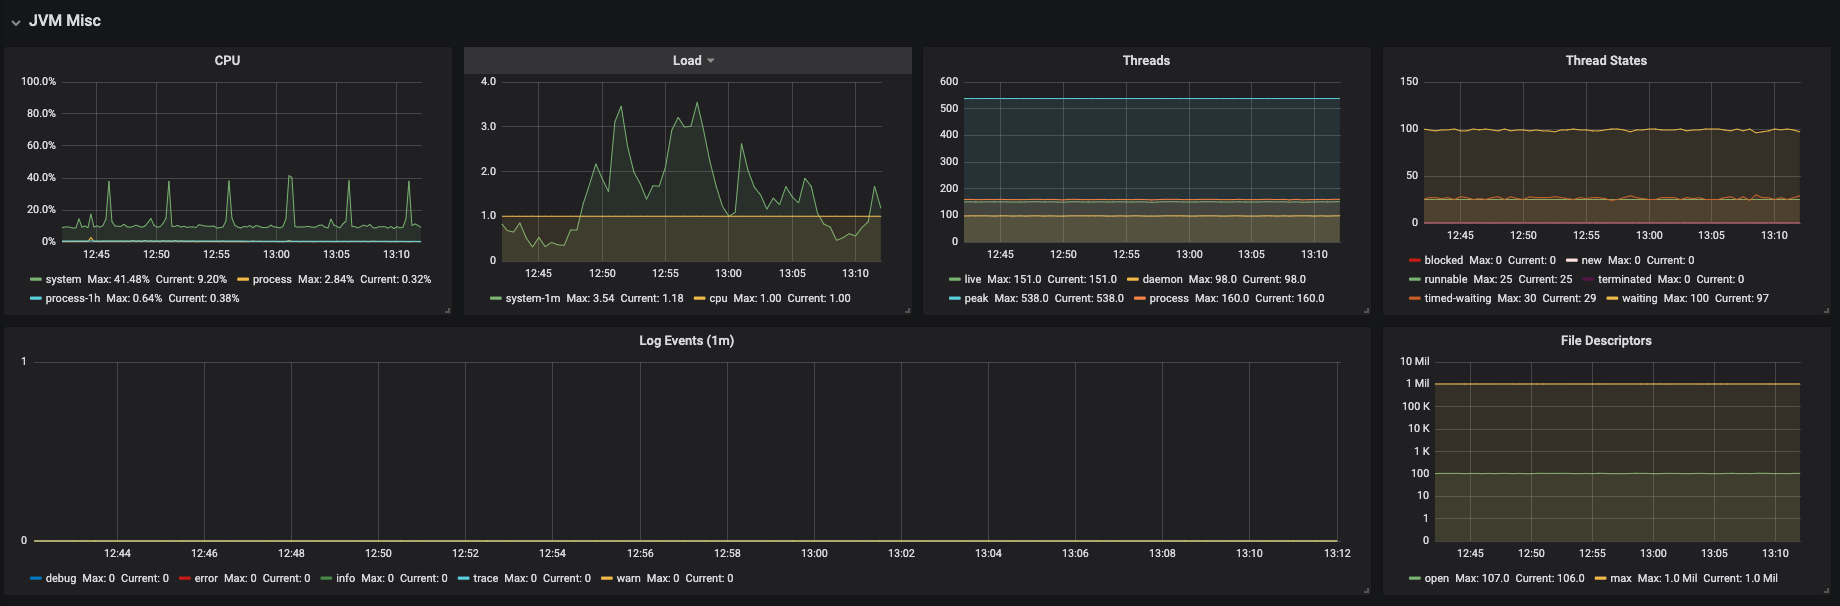
Figure 3.8. JVM Memory Pools (heap)
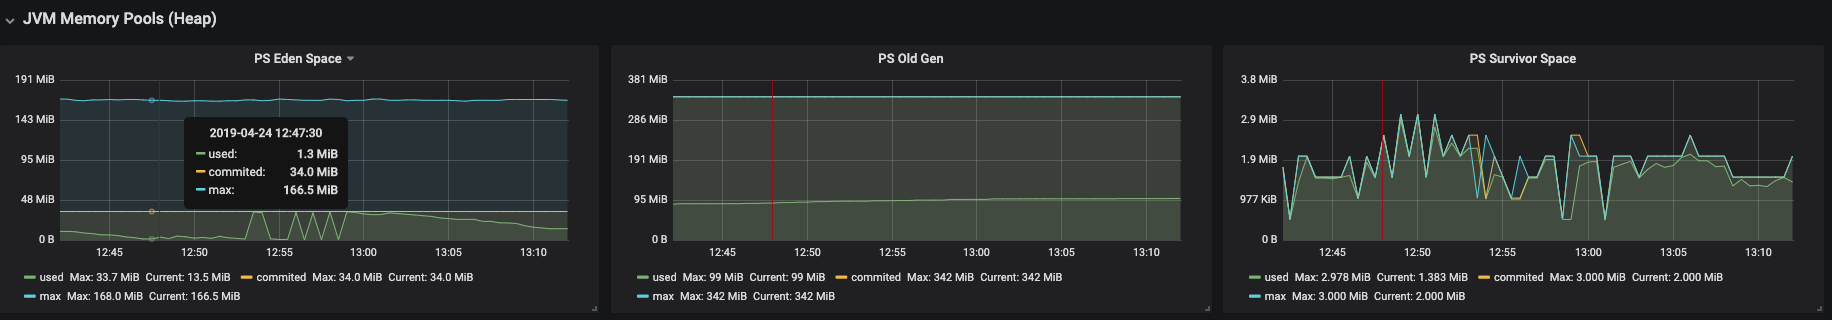
Figure 3.9. JVM Memory Pools (Non-Heap)
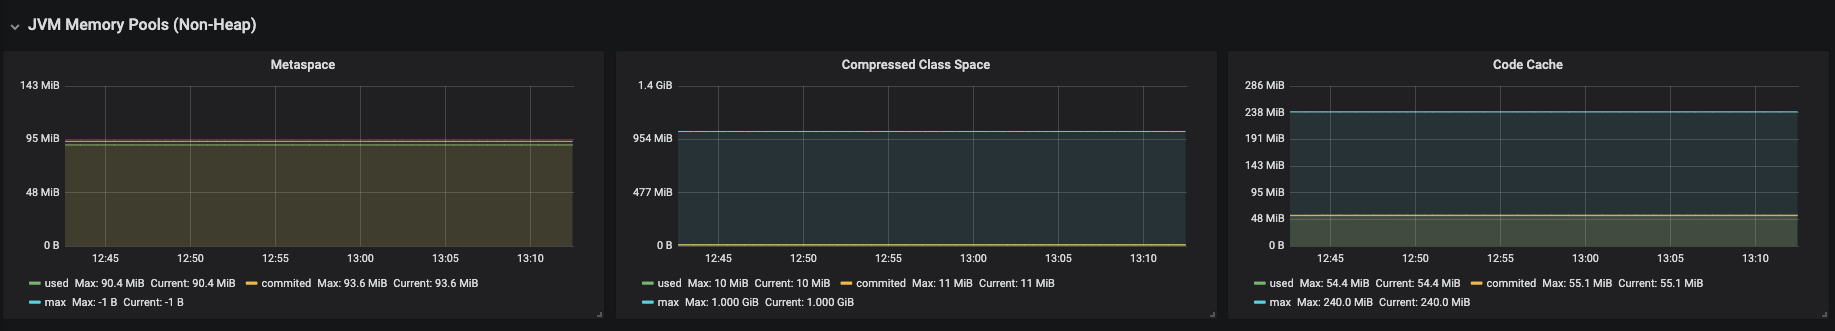
Figure 3.10. Garbage Collection

Figure 3.11. Class loading
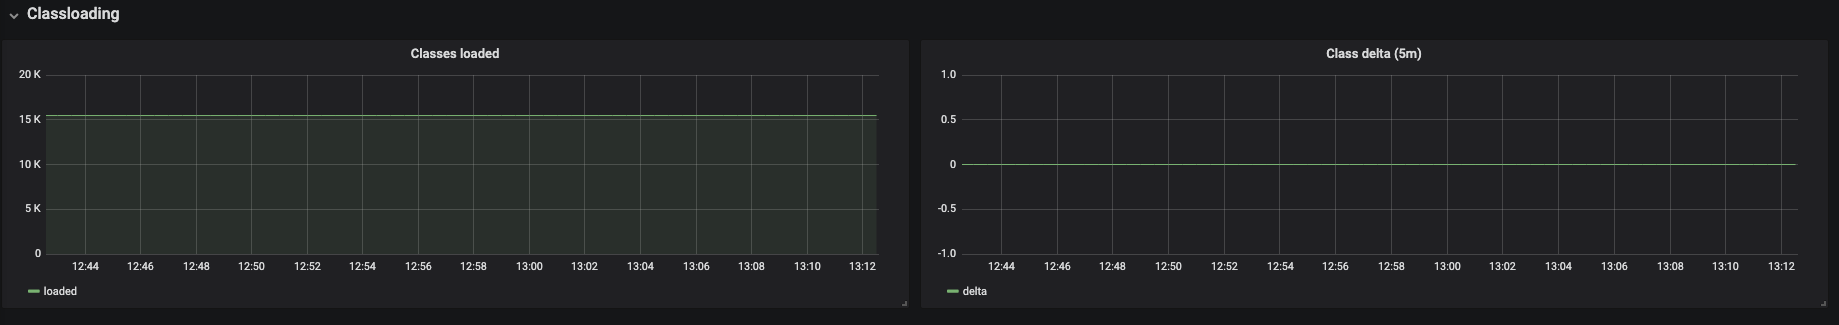
Figure 3.12. Buffer Pools
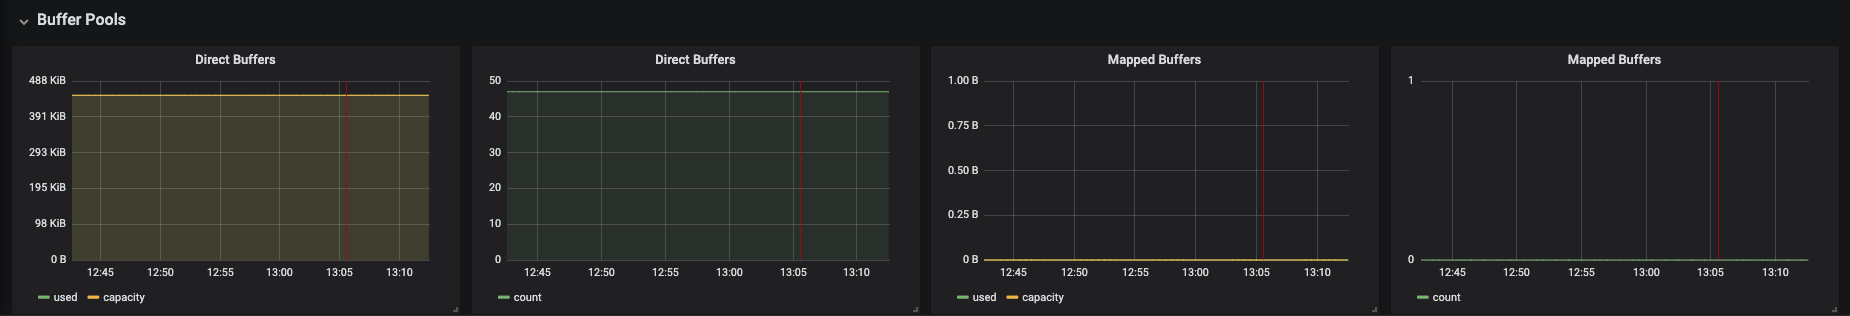
3.7. Configuring networking
3.7.1. Configuring network policies
By default, all Pods in a OpenShift cluster can communicate with each other even if they are in different namespaces. In the context of OpenShift Dev Spaces, this makes it possible for a workspace Pod in one user project to send traffic to another workspace Pod in a different user project.
For security, multitenant isolation could be configured by using NetworkPolicy objects to restrict all incoming communication to Pods in a user project. However, Pods in the OpenShift Dev Spaces project must be able to communicate with Pods in user projects.
Prerequisites
- The OpenShift cluster has network restrictions such as multitenant isolation.
Procedure
Apply the
allow-from-openshift-devspacesNetworkPolicy to each user project. Theallow-from-openshift-devspacesNetworkPolicy allows incoming traffic from the OpenShift Dev Spaces namespace to all Pods in the user project.Example 3.34.
allow-from-openshift-devspaces.yamlapiVersion: networking.k8s.io/v1 kind: NetworkPolicy metadata: name: allow-from-openshift-devspaces spec: ingress: - from: - namespaceSelector: matchLabels: kubernetes.io/metadata.name: openshift-devspaces 1 podSelector: {} 2 policyTypes: - Ingress
3.7.2. Configuring Dev Spaces hostname
This procedure describes how to configure OpenShift Dev Spaces to use custom hostname.
Prerequisites
-
An active
ocsession with administrative permissions to the destination OpenShift cluster. See Getting started with the CLI. - The certificate and the private key files are generated.
To generate the pair of a private key and certificate, the same certification authority (CA) must be used as for other OpenShift Dev Spaces hosts.
Ask a DNS provider to point the custom hostname to the cluster ingress.
Procedure
Pre-create a project for OpenShift Dev Spaces:
$ oc create project openshift-devspaces
Create a TLS secret:
$ oc create secret TLS <tls_secret_name> \ 1
--key <key_file> \ 2
--cert <cert_file> \ 3
-n openshift-devspaces
Add the required labels to the secret:
$ oc label secret <tls_secret_name> \ 1
app.kubernetes.io/part-of=che.eclipse.org -n openshift-devspaces
- 1
- The TLS secret name
Configure the
CheClusterCustom Resource. See Section 3.1.2, “Using the CLI to configure the CheCluster Custom Resource”.spec: networking: hostname: <hostname> 1 tlsSecretName: <secret> 2- If OpenShift Dev Spaces has been already deployed, wait until the rollout of all OpenShift Dev Spaces components finishes.
3.7.3. Importing untrusted TLS certificates to Dev Spaces
OpenShift Dev Spaces components communications with external services are encrypted with TLS. They require TLS certificates signed by trusted Certificate Authorities (CA). Therefore, you must import into OpenShift Dev Spaces all untrusted CA chains in use by an external service such as:
- A proxy
- An identity provider (OIDC)
- A source code repositories provider (Git)
OpenShift Dev Spaces uses labeled config maps in OpenShift Dev Spaces project as sources for TLS certificates. The config maps can have an arbitrary amount of keys with a random amount of certificates each.
When an OpenShift cluster contains cluster-wide trusted CA certificates added through the cluster-wide-proxy configuration, OpenShift Dev Spaces Operator detects them and automatically injects them into a config map with the config.openshift.io/inject-trusted-cabundle="true" label. Based on this annotation, OpenShift automatically injects the cluster-wide trusted CA certificates inside the ca-bundle.crt key of the config map.
Prerequisites
-
An active
ocsession with administrative permissions to the destination OpenShift cluster. See Getting started with the CLI. -
The
openshift-devspacesproject exists. -
For each CA chain to import: the root CA and intermediate certificates, in PEM format, in a
ca-cert-for-devspaces-<count>.pemfile.
Procedure
Concatenate all CA chains PEM files to import, into the
custom-ca-certificates.pemfile, and remove the return character that is incompatible with the Java trust store.$ cat ca-cert-for-{prod-id-short}-*.pem | tr -d '\r' > custom-ca-certificates.pemCreate the
custom-ca-certificatesconfig map with the required TLS certificates:$ oc create configmap custom-ca-certificates \ --from-file=custom-ca-certificates.pem \ --namespace=openshift-devspacesLabel the
custom-ca-certificatesconfig map:$ oc label configmap custom-ca-certificates \ app.kubernetes.io/component=ca-bundle \ app.kubernetes.io/part-of=che.eclipse.org \ --namespace=openshift-devspaces- Deploy OpenShift Dev Spaces if it hasn’t been deployed before. Otherwise, wait until the rollout of OpenShift Dev Spaces components finishes.
- Restart running workspaces for the changes to take effect.
Verification steps
Verify that the config map contains your custom CA certificates. This command returns your custom CA certificates in PEM format:
$ oc get configmap \
    --namespace=openshift-devspaces \
    --output='jsonpath={.items[0:].data.custom-ca-certificates\.pem}' \
    --selector=app.kubernetes.io/component=ca-bundle,app.kubernetes.io/part-of=che.eclipse.org
Verify OpenShift Dev Spaces pod contains a volume mounting the
ca-certs-mergedconfig map:$ oc get pod \ --selector=app.kubernetes.io/component=devspaces \ --output='jsonpath={.items[0].spec.volumes[0:].configMap.name}' \ --namespace=openshift-devspaces \ | grep ca-certs-mergedVerify the OpenShift Dev Spaces server container has your custom CA certificates. This command returns your custom CA certificates in PEM format:
$ oc exec -t deploy/devspaces \
    --namespace=openshift-devspaces \
    -- cat /public-certs/custom-ca-certificates.pem
Verify in the OpenShift Dev Spaces server logs that the imported certificates count is not null:
$ oc logs deploy/devspaces --namespace=openshift-devspaces \
    | grep custom-ca-certificates.pem
List the SHA256 fingerprints of your certificates:
$ for certificate in ca-cert*.pem ;
  do openssl x509 -in $certificate -digest -sha256 -fingerprint -noout | cut -d= -f2;
  done
Verify that OpenShift Dev Spaces server Java truststore contains certificates with the same fingerprint:
$ oc exec -t deploy/devspaces --namespace=openshift-devspaces -- \ keytool -list -keystore /home/user/cacerts \ | grep --after-context=1 custom-ca-certificates.pem- Start a workspace, get the project name in which it has been created: <workspace_namespace>, and wait for the workspace to be started.
Verify that the
che-trusted-ca-certsconfig map contains your custom CA certificates. This command returns your custom CA certificates in PEM format:$ oc get configmap che-trusted-ca-certs \ --namespace=<workspace_namespace> \ --output='jsonpath={.data.custom-ca-certificates\.custom-ca-certificates\.pem}'Verify that the workspace pod mounts the
che-trusted-ca-certsconfig map:$ oc get pod \ --namespace=<workspace_namespace> \ --selector='controller.devfile.io/devworkspace_name=<workspace_name>' \ --output='jsonpath={.items[0:].spec.volumes[0:].configMap.name}' \ | grep che-trusted-ca-certsVerify that the
universal-developer-imagecontainer (or the container defined in the workspace devfile) mounts theche-trusted-ca-certsvolume:$ oc get pod \ --namespace=<workspace_namespace> \ --selector='controller.devfile.io/devworkspace_name=<workspace_name>' \ --output='jsonpath={.items[0:].spec.containers[0:]}' \ | jq 'select (.volumeMounts[].name == "che-trusted-ca-certs") | .name'Get the workspace pod name <workspace_pod_name>:
$ oc get pod \
    --namespace=<workspace_namespace> \
    --selector='controller.devfile.io/devworkspace_name=<workspace_name>' \
    --output='jsonpath={.items[0:].metadata.name}' \
Verify that the workspace container has your custom CA certificates. This command returns your custom CA certificates in PEM format:
$ oc exec <workspace_pod_name> \
    --namespace=<workspace_namespace> \
    -- cat /public-certs/custom-ca-certificates.custom-ca-certificates.pem
Additional resources
3.7.4. Configuring OpenShift Route
You can configure OpenShift Route labels and annotations, if your organization requires them.
Prerequisites
-
An active
ocsession with administrative permissions to the destination OpenShift cluster. See Getting started with the CLI. - An instance of OpenShift Dev Spaces running in OpenShift.
Procedure
Configure the
CheClusterCustom Resource. See Section 3.1.2, “Using the CLI to configure the CheCluster Custom Resource”.spec: components: cheServer: extraProperties: CHE_INFRA_KUBERNETES_INGRESS_LABELS: <labels> 1 CHE_INFRA_KUBERNETES_INGRESS_ANNOTATIONS__JSON: "<annotations>" 2 networking: labels: <labels> 3 annotations: <annotations> 4
3.7.5. Configuring OpenShift Route
You can configure labels, annotations, and domains for OpenShift Route to work with Router Sharding.
Prerequisites
-
An active
ocsession with administrative permissions to the OpenShift cluster. See Getting started with the OpenShift CLI. -
dsc. See: Section 2.1, “Installing the dsc management tool”.
Procedure
Configure the
CheClusterCustom Resource. See Section 3.1.2, “Using the CLI to configure the CheCluster Custom Resource”.spec: components: cheServer: extraProperties: CHE_INFRA_OPENSHIFT_ROUTE_LABELS: <labels> 1 CHE_INFRA_OPENSHIFT_ROUTE_HOST_DOMAIN__SUFFIX: <domain> 2 networking: labels: <labels> 3 domain: <domain> 4 annotations: <annotations> 5
3.8. Configuring storage
3.8.1. Installing Dev Spaces using storage classes
To configure OpenShift Dev Spaces to use a configured infrastructure storage, install OpenShift Dev Spaces using storage classes. This is especially useful when a user wants to bind a persistent volume provided by a non-default provisioner. To do so, a user binds this storage for the OpenShift Dev Spaces data saving and sets the parameters for that storage. These parameters can determine the following:
- A special host path
- A storage capacity
- A volume mod
- Mount options
- A file system
- An access mode
- A storage type
- And many others
OpenShift Dev Spaces has two components that require persistent volumes to store data:
- A PostgreSQL database.
-
A OpenShift Dev Spaces workspaces. OpenShift Dev Spaces workspaces store source code using volumes, for example
/projectsvolume.
OpenShift Dev Spaces workspaces source code is stored in the persistent volume only if a workspace is not ephemeral.
Persistent volume claims facts:
- OpenShift Dev Spaces does not create persistent volumes in the infrastructure.
- OpenShift Dev Spaces uses persistent volume claims (PVC) to mount persistent volumes.
The OpenShift Dev Spaces server creates persistent volume claims.
A user defines a storage class name in the OpenShift Dev Spaces configuration to use the storage classes feature in the OpenShift Dev Spaces PVC. With storage classes, a user configures infrastructure storage in a flexible way with additional storage parameters. It is also possible to bind a static provisioned persistent volumes to the OpenShift Dev Spaces PVC using the class name.
Procedure
Use CheCluster Custom Resource definition to define storage classes:
Define storage class names: configure the
CheClusterCustom Resource, and install OpenShift Dev Spaces. See Section 3.1.1, “Using dsc to configure theCheClusterCustom Resource during installation”.spec: components: database: pvc: # keep blank unless you need to use a non default storage class for PostgreSQL PVC storageClass: 'postgres-storage' devEnvironments: storage: pvc: # keep blank unless you need to use a non default storage class for workspace PVC(s) storageClass: 'workspace-storage'Define the persistent volume for a PostgreSQL database in a
che-postgres-pv.yamlfile:che-postgres-pv.yamlfileapiVersion: v1 kind: PersistentVolume metadata: name: postgres-pv-volume labels: type: local spec: storageClassName: postgres-storage capacity: storage: 1Gi accessModes: - ReadWriteOnce hostPath: path: "/data/che/postgres"Define the persistent volume for a OpenShift Dev Spaces workspace in a
che-postgres-pv.yamlfile:che-workspace-pv.yamlfileapiVersion: v1 kind: PersistentVolume metadata: name: workspace-pv-volume labels: type: local spec: storageClassName: workspace-storage capacity: storage: 10Gi accessModes: - ReadWriteOnce hostPath: path: "/data/che/workspace"Bind the two persistent volumes:
$ kubectl apply -f che-workspace-pv.yaml -f che-postgres-pv.yaml
You must provide valid file permissions for volumes. You can do it using storage class configuration or manually. To manually define permissions, define storageClass#mountOptions uid and gid. PostgreSQL volume requires uid=26 and gid=26.
3.9. Managing identities and authorizations
This section describes different aspects of managing identities and authorizations of Red Hat OpenShift Dev Spaces.
3.9.1. OAuth for GitHub, GitLab, or Bitbucket
To enable users to work with remote Git repositories:
3.9.1.1. Configuring OAuth 2.0 for GitHub
To enable users to work with a remote Git repository that is hosted on GitHub:
- Set up the GitHub OAuth App (OAuth 2.0).
- Apply the GitHub OAuth App Secret.
3.9.1.1.1. Setting up the GitHub OAuth App
Set up a GitHub OAuth App using OAuth 2.0.
Prerequisites
- You are logged in to GitHub.
-
base64is installed in the operating system you are using.
Procedure
- Go to https://github.com/settings/applications/new.
Enter the following values:
-
Application name:
OpenShift Dev Spaces. -
Homepage URL:
"https://devspaces-<openshift_deployment_name>.<domain_name>"/ -
Authorization callback URL:
"https://devspaces-<openshift_deployment_name>.<domain_name>"/api/oauth/callback
-
Application name:
- Click Register application.
- Click Generate new client secret.
Copy the GitHub OAuth Client ID and encode it to Base64 for use when applying the GitHub OAuth App Secret:
$ echo -n '<github_oauth_client_id>' | base64Copy the GitHub OAuth Client Secret and encode it to Base64 for use when applying the GitHub OAuth App Secret:
$ echo -n '<github_oauth_client_secret>' | base64
Additional resources
3.9.1.1.2. Applying the GitHub OAuth App Secret
Prepare and apply the GitHub OAuth App Secret.
Prerequisites
- Setting up the GitHub OAuth App is completed.
The Base64-encoded values, which were generated when setting up the GitHub OAuth App, are prepared:
- GitHub OAuth Client ID
- GitHub OAuth Client Secret
-
An active
ocsession with administrative permissions to the destination OpenShift cluster. See Getting started with the CLI.
Procedure
Prepare the Secret:
kind: Secret
apiVersion: v1
metadata:
  name: github-oauth-config
  namespace: openshift-devspaces 1
  labels:
    app.kubernetes.io/part-of: che.eclipse.org
    app.kubernetes.io/component: oauth-scm-configuration
  annotations:
    che.eclipse.org/oauth-scm-server: github
    che.eclipse.org/scm-server-endpoint: <github_server_url> 2
type: Opaque
data:
  id: <Base64_GitHub_OAuth_Client_ID> 3
  secret: <Base64_GitHub_OAuth_Client_Secret> 4
Apply the Secret:
$ oc apply -f - <<EOF <Secret_prepared_in_the_previous_step> EOF- Verify in the output that the Secret is created.
3.9.1.2. Configuring OAuth 2.0 for GitLab
To enable users to work with a remote Git repository that is hosted using a GitLab instance:
- Set up the GitLab authorized application (OAuth 2.0).
- Apply the GitLab authorized application Secret.
3.9.1.2.1. Setting up the GitLab authorized application
Set up a GitLab authorized application using OAuth 2.0.
Prerequisites
- You are logged in to GitLab.
-
base64is installed in the operating system you are using.
Procedure
- Click your avatar and go to → .
- Enter OpenShift Dev Spaces as the Name.
-
Enter
"https://devspaces-<openshift_deployment_name>.<domain_name>"/api/oauth/callbackas the Redirect URI. - Check the Confidential and Expire access tokens checkboxes.
-
Under Scopes, check the
api,write_repository, andopenidcheckboxes. - Click Save application.
Copy the GitLab Application ID and encode it to Base64 for use when applying the GitLab-authorized application Secret:
$ echo -n '<gitlab_application_id>' | base64Copy the GitLab Client Secret and encode it to Base64 for use when applying the GitLab-authorized application Secret:
$ echo -n '<gitlab_client_secret>' | base64
Additional resources
3.9.1.2.2. Applying the GitLab-authorized application Secret
Prepare and apply the GitLab-authorized application Secret.
Prerequisites
- Setting up the GitLab authorized application is completed.
The Base64-encoded values, which were generated when setting up the GitLab authorized application, are prepared:
- GitLab Application ID
- GitLab Client Secret
-
An active
ocsession with administrative permissions to the destination OpenShift cluster. See Getting started with the CLI.
Procedure
Prepare the Secret:
kind: Secret
apiVersion: v1
metadata:
  name: gitlab-oauth-config
  namespace: openshift-devspaces 1
  labels:
    app.kubernetes.io/part-of: che.eclipse.org
    app.kubernetes.io/component: oauth-scm-configuration
  annotations:
    che.eclipse.org/oauth-scm-server: gitlab
    che.eclipse.org/scm-server-endpoint: <gitlab_server_url> 2
type: Opaque
data:
  id: <Base64_GitLab_Application_ID> 3
  secret: <Base64_GitLab_Client_Secret> 4
Apply the Secret:
$ oc apply -f - <<EOF <Secret_prepared_in_the_previous_step> EOF- Verify in the output that the Secret is created.
3.9.1.3. Configuring OAuth 1.0 for a Bitbucket Server
To enable users to work with a remote Git repository that is hosted on a Bitbucket Server:
- Set up an application link (OAuth 1.0) on the Bitbucket Server.
- Apply an application link Secret for the Bitbucket Server.
3.9.1.3.1. Setting up an application link on the Bitbucket Server
Set up an application link for OAuth 1.0 on the Bitbucket Server.
Prerequisites
Procedure
On a command line, run the commands to create the necessary files for the next steps and for use when applying the application link Secret:
$ openssl genrsa -out private.pem 2048 && \
openssl pkcs8 -topk8 -inform pem -outform pem -nocrypt -in private.pem -out privatepkcs8.pem && \
cat privatepkcs8.pem | sed 's/-----BEGIN PRIVATE KEY-----//g' | sed 's/-----END PRIVATE KEY-----//g' | tr -d '\n' | base64 | tr -d '\n' > privatepkcs8-stripped.pem && \
openssl rsa -in private.pem -pubout > public.pub && \
cat public.pub | sed 's/-----BEGIN PUBLIC KEY-----//g' | sed 's/-----END PUBLIC KEY-----//g' | tr -d '\n' > public-stripped.pub && \
openssl rand -base64 24 > bitbucket-consumer-key && \
openssl rand -base64 24 > bitbucket-shared-secret
- Go to → .
-
Enter
"https://devspaces-<openshift_deployment_name>.<domain_name>"/into the URL field and click Create new link. - Under The supplied Application URL has redirected once, check the Use this URL checkbox and click Continue.
- Enter OpenShift Dev Spaces as the Application Name.
- Select Generic Application as the Application Type.
- Enter OpenShift Dev Spaces as the Service Provider Name.
-
Paste the content of the
bitbucket-consumer-keyfile as the Consumer key. -
Paste the content of the
bitbucket-shared-secretfile as the Shared secret. -
Enter
<bitbucket_server_url>/plugins/servlet/oauth/request-tokenas the Request Token URL. -
Enter
<bitbucket_server_url>/plugins/servlet/oauth/access-tokenas the Access token URL. -
Enter
<bitbucket_server_url>/plugins/servlet/oauth/authorizeas the Authorize URL. - Check the Create incoming link checkbox and click Continue.
-
Paste the content of the
bitbucket_consumer_keyfile as the Consumer Key. - Enter OpenShift Dev Spaces as the Consumer name.
-
Paste the content of the
public-stripped.pubfile as the Public Key and click Continue.
Additional resources
3.9.1.3.2. Applying an application link Secret for the Bitbucket Server
Prepare and apply the application link Secret for the Bitbucket Server.
Prerequisites
- The application link is set up on the Bitbucket Server.
The following Base64-encoded files, which were created when setting up the application link, are prepared:
-
privatepkcs8-stripped.pem -
bitbucket_consumer_key -
bitbucket-shared-secret
-
-
An active
ocsession with administrative permissions to the destination OpenShift cluster. See Getting started with the CLI.
Procedure
Prepare the Secret:
kind: Secret
apiVersion: v1
metadata:
  name: bitbucket-oauth-config
  namespace: openshift-devspaces 1
  labels:
    app.kubernetes.io/component: oauth-scm-configuration
    app.kubernetes.io/part-of: che.eclipse.org
  annotations:
    che.eclipse.org/oauth-scm-server: bitbucket
    che.eclipse.org/scm-server-endpoint: <bitbucket_server_url> 2
type: Opaque
data:
  private.key: <Base64_content_of_privatepkcs8-stripped.pem> 3
  consumer.key: <Base64_content_of_bitbucket_server_consumer_key> 4
  shared_secret: <Base64_content_of_bitbucket-shared-secret> 5
- 1
- The OpenShift Dev Spaces namespace. The default is
openshift-devspaces. - 2
- The URL of the Bitbucket Server.
- 3
- The Base64-encoded content of the
privatepkcs8-stripped.pemfile. - 4
- The Base64-encoded content of the
bitbucket_consumer_keyfile. - 5
- The Base64-encoded content of the
bitbucket-shared-secretfile.
Apply the Secret:
$ oc apply -f - <<EOF <Secret_prepared_in_the_previous_step> EOF- Verify in the output that the Secret is created.
3.9.1.4. Configuring OAuth 2.0 for the Bitbucket Cloud
You can enable users to work with a remote Git repository that is hosted in the Bitbucket Cloud:
- Set up an OAuth consumer (OAuth 2.0) in the Bitbucket Cloud.
- Apply an OAuth consumer Secret for the Bitbucket Cloud.
3.9.1.4.1. Setting up an OAuth consumer in the Bitbucket Cloud
Set up an OAuth consumer for OAuth 2.0 in the Bitbucket Cloud.
Prerequisites
- You are logged in to the Bitbucket Cloud.
-
base64is installed in the operating system you are using.
Procedure
- Click your avatar and go to the All workspaces page.
- Select a workspace and click it.
- Go to → → .
- Enter OpenShift Dev Spaces as the Name.
-
Enter
"https://devspaces-<openshift_deployment_name>.<domain_name>"/api/oauth/callbackas the Callback URL. - Under Permissions, check all of the Account and Repositories checkboxes, and click Save.
Expand the added consumer and then copy the Key value and encode it to Base64 for use when applying the Bitbucket OAuth consumer Secret:
$ echo -n '<bitbucket_oauth_consumer_key>' | base64Copy the Secret value and encode it to Base64 for use when applying the Bitbucket OAuth consumer Secret:
$ echo -n '<bitbucket_oauth_consumer_secret>' | base64
Additional resources
3.9.1.4.2. Applying an OAuth consumer Secret for the Bitbucket Cloud
Prepare and apply an OAuth consumer Secret for the Bitbucket Cloud.
Prerequisites
- The OAuth consumer is set up in the Bitbucket Cloud.
The Base64-encoded values, which were generated when setting up the Bitbucket OAuth consumer, are prepared:
- Bitbucket OAuth consumer Key
- Bitbucket OAuth consumer Secret
-
An active
ocsession with administrative permissions to the destination OpenShift cluster. See Getting started with the CLI.
Procedure
Prepare the Secret:
kind: Secret
apiVersion: v1
metadata:
  name: bitbucket-oauth-config
  namespace: openshift-devspaces 1
  labels:
    app.kubernetes.io/part-of: che.eclipse.org
    app.kubernetes.io/component: oauth-scm-configuration
  annotations:
    che.eclipse.org/oauth-scm-server: bitbucket
type: Opaque
data:
  id: <Base64_Bitbucket_Oauth_Consumer_Key> 2
  secret: <Base64_Bitbucket_Oauth_Consumer_Secret> 3
Apply the Secret:
$ oc apply -f - <<EOF <Secret_prepared_in_the_previous_step> EOF- Verify in the output that the Secret is created.
3.9.2. Configuring the administrative user
To execute actions that require administrative privileges on OpenShift Dev Spaces server, such as deleting user data, activate a user with administrative privileges. The default installation enables the administrative privileges for the admin user, regardless of its existence on OpenShift.
Procedure
Configure the
CheClusterCustom Resource to set the <admin> user with administrative privileges. See Section 3.1.2, “Using the CLI to configure the CheCluster Custom Resource”.spec: components: cheServer: extraProperties: CHE_SYSTEM_ADMIN__NAME: '<admin>'
3.9.3. Removing user data
3.9.3.1. Removing user data according to GDPR
You can remove the OpenShift Dev Spaces user’s data using the OpenShift Dev Spaces API. Following this procedure makes the service compliant to EU General Data Protection Regulation (GDPR) that enforces the right for individuals to have personal data erased.
Prerequisites
- An active session with administrative permissions to OpenShift Dev Spaces. See Section 3.9.2, “Configuring the administrative user”.
-
An active
ocsession with administrative permissions to the OpenShift cluster. See Getting started with the OpenShift CLI.
Procedure
-
Get the <username> user <id>
id: navigate to https://<devspaces-<openshift_deployment_name>.<domain_name>>/swagger/#/user/find_1, click , set name: <username>, and click . Scroll down the Response body to find theidvalue. -
Remove the <id> user data that OpenShift Dev Spaces server manages, such as user preferences: navigate to https://<devspaces-<openshift_deployment_name>.<domain_name>>/swagger/#/user/remove, click , set id: <id>, and click . Expect a
204response code: Delete the user project to remove all OpenShift resources bound to the user, such as workspaces, secrets, and configmaps.
$ oc delete namespace <username>-devspaces
Additional resources
- Chapter 5, Using the Dev Spaces server API.
- Section 3.2.1, “Configuring project name”.
- To remove the data of all users, see Chapter 7, Uninstalling Dev Spaces.