
User guide
Using Red Hat OpenShift Dev Spaces 3.0
Abstract
Chapter 1. Adopting OpenShift Dev Spaces
To get started with adopting OpenShift Dev Spaces for your organization, you can read the following:
1.1. Developer workspaces
Red Hat OpenShift Dev Spaces provides developer workspaces with everything you need to code, build, test, run, and debug applications:
- Project source code
- Web-based integrated development environment (IDE)
- Tool dependencies needed by developers to work on a project
- Application runtime: a replica of the environment where the application runs in production
Pods manage each component of a OpenShift Dev Spaces workspace. Therefore, everything running in a OpenShift Dev Spaces workspace is running inside containers. This makes a OpenShift Dev Spaces workspace highly portable.
The embedded browser-based IDE is the point of access for everything running in a OpenShift Dev Spaces workspace. This makes a OpenShift Dev Spaces workspace easy to share.
1.2. Using a badge with a link to enable a first-time contributor to start a workspace
To enable a first-time contributor to start a workspace with a project, add a badge with a link to your OpenShift Dev Spaces instance.
Figure 1.1. Factory badge
Procedure
Substitute your OpenShift Dev Spaces URL (
https://devspaces-<openshift_deployment_name>.<domain_name>) and repository URL (<your-repository-url>), and add the link to your repository in the projectREADME.mdfile.[](https://devspaces-<openshift_deployment_name>.<domain_name>/#https://<your-repository-url>)
-
The
README.mdfile in your Git provider web interface displays the factory badge. Click the badge to open a workspace with your project in your OpenShift Dev Spaces instance.
1.3. Benefits of reviewing pull and merge requests in Red Hat OpenShift Dev Spaces
Red Hat OpenShift Dev Spaces workspace contains all tools you need to review pull and merge requests from start to finish. By clicking a OpenShift Dev Spaces link, you get access to Red Hat OpenShift Dev Spaces-supported web IDE with a ready-to-use workspace where you can run a linter, unit tests, the build and more.
Prerequisites
- You have access to the repository hosted by your Git provider.
- You use a Red Hat OpenShift Dev Spaces-supported browser: Google Chrome or Mozilla Firefox.
- You have access to a OpenShift Dev Spaces instance.
Procedure
- Open the feature branch to review in OpenShift Dev Spaces. A clone of the branch opens in a workspace with tools for debugging and testing.
- Check the pull or merge request changes.
Run your desired debugging and testing tools:
- Run a linter.
- Run unit tests.
- Run the build.
- Run the application to check for problems.
- Navigate to UI of your Git provider to leave comment and pull or merge your assigned request.
Verification
- (optional) Open a second workspace using the main branch of the repository to reproduce a problem.
1.4. Supported languages
- Java 11 with JBoss EAP 7.4
- Java stack with OpenJDK 11, Maven 3.6 and JBoss EAP 7.4
- Java 11 with JBoss EAP XP 3.0 Bootable Jar
- Java stack with OpenJDK 11, Maven 3.6 and JBoss EAP XP 3.0 Bootable Jar
- Java 11 with JBoss EAP XP 3.0 Microprofile
- Java stack with OpenJDK 11, Maven 3.6 and JBoss EAP XP 3.0
- Red Hat Fuse
- Red Hat Fuse stack with OpenJDK 11 and Maven 3.6.3
- Tooling for Apache Camel K
- Tooling to develop Integration projects with Apache Camel K
- Java 11 with Gradle
- Java stack with OpenJDK 11, Maven 3.6.3, and Gradle 6.1
- Java 11 with Lombok
- Java stack with OpenJDK 11, Maven 3.6.3 and Lombok 1.18.18
- Java 11 with Quarkus
- Java stack with OpenJDK 11, Maven 3.6.3, Gradle 6.1 and Quarkus Tools
- Java 11 with Vert.x
- Java stack with OpenJDK 11, Maven 3.6.3 and Vert.x booster
- Java 11 with Maven
- Java stack with OpenJDK 11, Maven 3.6.3 and Vert.x demo
- Java 8 with Spring Boot
- Java stack with OpenJDK 8, Maven 3.6.3 and Spring Boot Petclinic demo application
- NodeJS ConfigMap Express
- NodeJS stack with NPM 8, NodeJS 16 and ConfigMap Web Application
- NodeJS MongoDB
- NodeJS stack with NPM 8, NodeJS 16 and MongoDB 3.6
- NodeJS Express
- NodeJS stack with NPM 8, NodeJS 16 and Express Web Application
- Python
- Python Stack with Python 3.8 and pip 19.3
- C/C++
- C and C++ Developer Tools stack with GCC, cmake and make (Technology Preview)
- .NET
- .NET stack with .NET Core SDK 6 and 3.1, Runtime, C# Language Support and Debugger (Technology Preview)
- Go
- Stack with Go (Technology Preview)
- PHP CakePHP
- PHP Stack with PHP, Apache Web Server, Composer and a quickstart CakePHP application for OpenShift (Technology Preview)
- PHP-DI
- PHP Stack with PHP, Apache Web Server and Composer (Technology Preview)
Chapter 2. User onboarding
If your organization is already running a OpenShift Dev Spaces instance, you can get started as a new user by learning how to start a new workspace, manage your workspaces, and authenticate yourself to a Git server from a workspace:
2.1. Starting a new workspace with a clone of a Git repository
Working with OpenShift Dev Spaces in your browser involves multiple URLs:
- The URL of your organization’s OpenShift Dev Spaces instance, used as part of all the following URLs
- The URL of the Workspaces page of your OpenShift Dev Spaces dashboard with the workspace control panel
- The URLs for starting a new workspace
- The URLs of your workspaces in use
With OpenShift Dev Spaces, you can visit a URL in your browser to start a new workspace that contains a clone of a Git repository. This way, you can clone a Git repository that is hosted on GitHub, a GitLab instance, or a Bitbucket server.
You can also use the Git Repo URL * field on the Create Workspace page of your OpenShift Dev Spaces dashboard to enter the URL of a Git repository to start a new workspace.
Prerequisites
- Your organization has a running instance of OpenShift Dev Spaces.
-
You know the FQDN URL of your organization’s OpenShift Dev Spaces instance:
https://devspaces-<openshift_deployment_name>.<domain_name>. Your Git repository maintainer keeps the
devfile.yamlor.devfile.yamlfile in the root directory of the Git repository. (For alternative file names and file paths, see Section 2.2, “Optional parameters for the URLs for starting a new workspace”.)TipYou can also start a new workspace by supplying the URL of a Git repository that contains no devfile. Doing so results in a workspace with the Che-Theia IDE and the Universal Developer Image.
Procedure
To start a new workspace with a clone of a Git repository:
- Optional: Visit your OpenShift Dev Spaces dashboard pages to authenticate to your organization’s instance of OpenShift Dev Spaces.
Visit the URL to start a new workspace using the basic syntax:
https://devspaces-<openshift_deployment_name>.<domain_name>#<git_repository_url>
TipYou can extend this URL with optional parameters:
https://devspaces-<openshift_deployment_name>.<domain_name>#<git_repository_url>?<optional_parameters> 1
Example 2.1. A URL for starting a new workspace
https://devspaces-<openshift_deployment_name>.<domain_name>#https://github.com/che-samples/cpp-hello-worldExample 2.2. The URL syntax for starting a new workspace with a clone of a GitHub-hosted repository
With GitHub and GitLab, you can even use the URL of a specific branch of the repository to be cloned:
-
https://devspaces-<openshift_deployment_name>.<domain_name>#https://github.com/<user_or_org>/<repository>starts a new workspace with a clone of the default branch. -
https://devspaces-<openshift_deployment_name>.<domain_name>#https://github.com/<user_or_org>/<repository>/tree/<branch_name>starts a new workspace with a clone of the specified branch. -
https://devspaces-<openshift_deployment_name>.<domain_name>#https://github.com/<user_or_org>/<repository>/pull/<pull_request_id>starts a new workspace with a clone of the branch of the pull request.
After you enter the URL to start a new workspace in a browser tab, it renders the workspace-starting page.
When the new workspace is ready, the workspace IDE loads in the browser tab.
A clone of the Git repository is present in the filesystem of the new workspace.
The workspace has a unique URL:
https://devspaces-<openshift_deployment_name>.<domain_name>#workspace<unique_url>.-
Although this is not possible in the address bar, you can add a URL for starting a new workspace as a bookmark by using the browser bookmark manager:
- In Mozilla Firefox, go to ☰ > Bookmarks > Manage bookmarks Ctrl+Shift+O > Bookmarks Toolbar > Organize > Add bookmark.
- In Google Chrome, go to ⋮ > Bookmarks > Bookmark manager > Bookmarks bar > ⋮ > Add new bookmark.
2.2. Optional parameters for the URLs for starting a new workspace
When you start a new workspace, OpenShift Dev Spaces configures the workspace according to the instructions in the devfile. When you use a URL to start a new workspace, you can append optional parameters to the URL that further configure the workspace. You can use these parameters to specify a workspace IDE, start duplicate workspaces, and specify a devfile file name or path.
2.2.1. URL parameter concatenation
The URL for starting a new workspace supports concatenation of multiple optional URL parameters by using & with the following URL syntax:
https://devspaces-<openshift_deployment_name>.<domain_name>#<git_repository_url>?<url_parameter_1>&<url_parameter_2>&<url_parameter_3>
Example 2.3. A URL for starting a new workspace with the URL of a Git repository and optional URL parameters
The complete URL for the browser:
https://devspaces-<openshift_deployment_name>.<domain_name>#https://github.com/che-samples/cpp-hello-world?new&che-editor=che-incubator/intellij-community/latest&devfilePath=tests/testdevfile.yaml
Explanation of the parts of the URL:
https://devspaces-<openshift_deployment_name>.<domain_name> 1
#https://github.com/che-samples/cpp-hello-world 2
?new&che-editor=che-incubator/intellij-community/latest&devfilePath=tests/testdevfile.yaml 3
2.2.2. URL parameter for the workspace IDE
If the URL for starting a new workspace doesn’t contain a URL parameter specifying the integrated development environment (IDE), the workspace loads with the default IDE: Che Theia.
The URL parameter for specifying another supported IDE is che-editor=<editor_key>:
https://devspaces-<openshift_deployment_name>.<domain_name>#<git_repository_url>?che-editor=<editor_key>
Table 2.1. The URL parameter <editor_key> values for supported IDEs
| IDE | <editor_key> value | Note |
|---|---|---|
|
| This is the default IDE that loads in a new workspace without the URL parameter. | |
|
| Community Edition - stable version |
2.2.3. URL parameter for starting duplicate workspaces
Visiting a URL for starting a new workspace results in a new workspace according to the devfile and with a clone of the linked Git repository.
In some situations, you may need to have multiple workspaces that are duplicates in terms of the devfile and the linked Git repository. You can do this by visiting the same URL for starting a new workspace with a URL parameter.
The URL parameter for starting a duplicate workspace is new:
https://devspaces-<openshift_deployment_name>.<domain_name>#<git_repository_url>?new
If you currently have a workspace that you started using a URL, then visiting the URL again without the new URL parameter results in an error message.
2.2.4. URL parameter for the devfile file name
When you visit a URL for starting a new workspace, OpenShift Dev Spaces searches the linked Git repository for a devfile with the file name .devfile.yaml or devfile.yaml. The devfile in the linked Git repository must follow this file-naming convention.
In some situations, you may need to specify a different, unconventional file name for the devfile.
The URL parameter for specifying an unconventional file name of the devfile is df=<filename>.yaml:
https://devspaces-<openshift_deployment_name>.<domain_name>#<git_repository_url>?df=<filename>.yaml 1
- 1
<filename>.yamlis an unconventional file name of the devfile in the linked Git repository.
The df=<filename>.yaml parameter also has a long version: devfilePath=<filename>.yaml.
2.2.5. URL parameter for the devfile file path
When you visit a URL for starting a new workspace, OpenShift Dev Spaces searches the root directory of the linked Git repository for a devfile with the file name .devfile.yaml or devfile.yaml. The file path of the devfile in the linked Git repository must follow this path convention.
In some situations, you may need to specify a different, unconventional file path for the devfile in the linked Git repository.
The URL parameter for specifying an unconventional file path of the devfile is devfilePath=<relative_file_path>:
https://devspaces-<openshift_deployment_name>.<domain_name>#<git_repository_url>?devfilePath=<relative_file_path> 1
- 1
<relative_file_path>is an unconventional file path of the devfile in the linked Git repository.
2.3. Basic actions you can perform on a workspace
You manage your workspaces and verify their current states in the Workspaces page (https://devspaces-<openshift_deployment_name>.<domain_name>/dashboard/#/workspaces) of your OpenShift Dev Spaces dashboard.
After you start a new workspace, you can perform the following actions on it in the Workspaces page:
Table 2.2. Basic actions you can perform on a workspace
| Action | GUI steps in the Workspaces page |
|---|---|
| Reopen a running workspace | Click Open. |
| Restart a running workspace | Go to ⋮ > Restart Workspace. |
| Stop a running workspace | Go to ⋮ > Stop Workspace. |
| Start a stopped workspace | Click Open. |
| Delete a workspace | Go to ⋮ > Delete Workspace. |
2.4. Authenticating yourself to a Git server from a workspace
In a workspace, you can run Git commands that require user authentication like cloning a remote private Git repository or pushing to a remote public or private Git repository.
To configure user authentication to a Git server from a workspace, OpenShift Dev Spaces provides two options:
- Your administrator sets up an OAuth application on GitHub, GitLab, or Bitbucket for your organization’s Red Hat OpenShift Dev Spaces instance.
- You create your own, user Kubernetes Secret for a Git credentials store.
Chapter 3. Customizing workspace components
To customize workspace components:
- Choose a Git repository for your workspace.
- Use a devfile that meets the latest devfile 2 specification. See Devfile User Guide.
- Select and customize your in-browser IDE.
- Add OpenShift Dev Spaces specific attributes in addition to the generic devfile specification.
Chapter 4. Selecting a workspace IDE
The default in-browser IDE in a new workspace is Che Theia.
You can select another supported in-browser IDE by either method:
-
When you start a new workspace by visiting a URL, you can choose an IDE for that workspace by adding the
che-editorparameter to the URL. See Section 4.1, “Selecting an in-browser IDE for a new workspace by using a URL parameter”. -
You can specify an IDE in the
.che/che-editor.yamlfile of the Git repository for all new workspaces that will feature a clone of that repository. See Section 4.2, “Specifying an in-browser IDE for a Git repository by usingche-editor.yaml”.
Table 4.1. Supported in-browser IDEs
| IDE | id | Note |
|---|---|---|
|
| This is the default IDE that loads in a new workspace without the URL parameter. | |
|
| Community Edition - stable version |
4.1. Selecting an in-browser IDE for a new workspace by using a URL parameter
You can select your preferred in-browser IDE when starting a new workspace. This is the easiest way and it doesn’t affect your other workspaces or other users.
Procedure
- Include the URL parameter for the workspace IDE in the URL for starting a new workspace. See Section 2.2.2, “URL parameter for the workspace IDE”.
- Visit the URL in the browser. See Section 2.1, “Starting a new workspace with a clone of a Git repository”.
4.2. Specifying an in-browser IDE for a Git repository by using che-editor.yaml
4.2.1. Using the OpenShift Dev Spaces editor file to select an IDE
Use the che-editor.yaml file to define a default IDE for the project users. For a list of supported IDs, see Optional parameters for the URLs for starting a new workspace.
Procedure
-
Place the
che-editor.yamlfile in the.chefolder in the root directory of your project. In the
che-editor.yamlfile, specify the ID of the IDE you are selecting. For example:id: che-incubator/che-idea/latest
Additional resources
- Check the sample file sample here.
- Load experimental new IDEs from the default plug-in registry by using the IDs shown in che-editors.yaml.
4.2.2. Customizing IDE selection with the che-editor.yaml file
You can further customize your IDE selection to suit the specific needs of the project by adding various directives to the che-editor.yaml file. These customization options include following directives:
- Custom plug-in registry
- Web reference
- Embedded editor definition
4.2.3. Using a custom plug-in registry for your IDE
To include different IDEs than the default list in the OpenShift Dev Spaces plug-in registry, use an optional registryUrl directive.
Procedure
Set an optional
registryUrldirective in yourche-editor.yamlfile. For example:id: eclipse/che-theia/next # mandatory registryUrl: https://my-registry.com # optional override: # optional containers: - name: theia-ide memoryLimit: 1280Mi
4.2.4. Using a web reference for your IDE
Use a web reference for your IDE by pointing at a YAML file with the reference directive.
Procedure
Set a
referencedirective in yourche-editor.yamlfile. For example:reference: https://gist.github.com/.../che-editor.yaml # mandatory override: # optional containers: - name: theia-ide memoryLimit: 1280Mi
4.2.5. Using an embedded editor definition for your IDE
If you have specific requirements for your project that aren’t addressed by standard IDE behaviour, you can customize the project IDE by using the inline directive to put a complete IDE definition in the che-editor.yaml file.
Procedure
Set an
inlinedirective in yourche-editor.yamlfile. For example:inline: endpoints: - name: "theia" public: true targetPort: 3100 attributes: protocol: http type: ide secure: true cookiesAuthEnabled: true discoverable: false (...) containers: - name: theia-ide image: "quay.io/eclipse/che-theia:next" env: - name: THEIA_PLUGINS value: local-dir:///plugins volumeMounts: - name: plugins path: "/plugins" - name: theia-local path: "/home/theia/.theia" mountSources: true ports: - exposedPort: 3100 memoryLimit: "512M" cpuLimit: 1000m cpuRequest: 100m initContainers: - name: remote-runtime-injector image: "quay.io/eclipse/che-theia-endpoint-runtime-binary:next" volumeMounts: - name: remote-endpoint path: "/remote-endpoint" ephemeral: true env: - name: PLUGIN_REMOTE_ENDPOINT_EXECUTABLE value: /remote-endpoint/plugin-remote-endpoint - name: REMOTE_ENDPOINT_VOLUME_NAME value: remote-endpoint
Chapter 5. Using credentials and configurations in workspaces
You can use your credentials and configurations in your workspaces.
To do so, mount your credentials and configurations to the DevWorkspace containers in the OpenShift cluster of your organization’s OpenShift Dev Spaces instance:
- Mount your credentials and sensitive configurations as Kubernetes Secrets. One example is a Git credentials store.
- Mount your non-sensitve configurations as Kubernetes ConfigMaps.
If you need to allow the DevWorkspace Pods in the cluster to access container registries that require authentication, create an image pull Secret for the DevWorkspace Pods.
The mounting process uses the standard Kubernetes mounting mechanism and requires applying additional labels and annotations to your existing resources. Resources are mounted when starting a new workspace or restarting an existing one.
You can create permanent mount points for various components:
-
Maven configuration, such as the
settings.xmlfile - SSH key pairs
- AWS authorization tokens
- Configuration files
- Persistent storage
- Git credentials store files
Additional resources
5.1. Using a Git credentials store
As an alternative to the OAuth for GitHub, GitLab, or Bitbucket that is configured by the administrator of your organization’s OpenShift Dev Spaces instance, you can apply your Git credentials store as a Kubernetes Secret.
Apply the Kubernetes Secret in your user project of the OpenShift cluster of your organization’s OpenShift Dev Spaces instance.
When you apply the Secret, a Git configuration file with the path to the mounted Git credentials store is automatically configured and mounted to the DevWorkspace containers in the cluster at /etc/gitconfig. This makes your Git credentials store available in your workspaces.
Prerequisites
-
An active
ocsession with administrative permissions to the destination OpenShift cluster. See Getting started with the CLI. -
base64command line tools are installed in the operating system you are using.
Procedure
In your home directory, locate and open your
.git-credentialsfile if you already have it. Alternatively, if you do not have this file, save a new.git-credentialsfile, using the Git credentials storage format. Each credential is stored on its own line in the file:https://<username>:<token>@<git_server_hostname>
Example 5.1. A line in a
.git-credentialsfilehttps://trailblazer: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@github.com
Select credentials from your
.git-credentialsfile for the Secret. Encode the selected credentials to Base64 for the next step.TipTo encode all lines in the file:
$ cat .git-credentials | base64 | tr -d '\n'To encode a selected line:
$ echo -n '<copied_and_pasted_line_from_.git-credentials>' | base64
Create a new OpenShift Secret in your user project.
apiVersion: v1 kind: Secret metadata: name: git-credentials-secret labels: controller.devfile.io/git-credential: 'true' 1 controller.devfile.io/watch-secret: 'true' annotations: controller.devfile.io/mount-path: /etc/secret 2 data: credentials: <Base64_content_of_.git-credentials> 3- 1
- The
controller.devfile.io/git-credentiallabel marks the Secret as containing Git credentials. - 2
- A custom absolute path in the
DevWorkspacecontainers. The Secret is mounted as thecredentialsfile at this path. The default path is/. - 3
- The selected content from
.git-credentialsthat you encoded to Base64 in the previous step.
TipYou can create and apply multiple Git credentials Secrets in your user project. All of them will be copied into one Secret that will be mounted to the
DevWorkspacecontainers. For example, if you set the mount path to/etc/secret, then the one Secret with all of your Git credentials will be mounted at/etc/secret/credentials. You must set all Git credentials Secrets in your user project to the same mount path. You can set the mount path to an arbitrary path because the mount path will be automatically set in the Git configuration file configured at/etc/gitconfig.Apply the Secret:
$ oc apply -f - <<EOF
<Secret_prepared_in_the_previous_step>
EOF
5.2. Enabling artifact repositories in a restricted environment
By configuring technology stacks, you can work with artifacts from in-house repositories using self-signed certificates:
5.2.1. Enabling Maven artifact repositories
You can enable a Maven artifact repository in Maven workspaces that run in a restricted environment.
Prerequisites
- You are not running any Maven workspace.
Procedure
Apply the Secret for the TLS certificate:
kind: Secret apiVersion: v1 metadata: name: tls-cer annotations: controller.devfile.io/mount-path: /home/user/certs controller.devfile.io/mount-as: file labels: controller.devfile.io/mount-to-devworkspace: 'true' controller.devfile.io/watch-secret: 'true' data: tls.cer: >- <Base64_encoded_content_of_public_cert> 1- 1
- Base64 encoding with disabled line wrapping.
Apply the ConfigMap to create the
settings.xmlfile:kind: ConfigMap apiVersion: v1 metadata: name: settings-xml annotations: controller.devfile.io/mount-as: subpath controller.devfile.io/mount-path: /home/user/.m2 labels: controller.devfile.io/mount-to-devworkspace: 'true' controller.devfile.io/watch-configmap: 'true' data: settings.xml: | <settings xmlns="http://maven.apache.org/SETTINGS/1.0.0" xmlns:xsi="http://www.w3.org/2001/XMLSchema-instance" xsi:schemaLocation="http://maven.apache.org/SETTINGS/1.0.0 https://maven.apache.org/xsd/settings-1.0.0.xsd"> <localRepository/> <interactiveMode/> <offline/> <pluginGroups/> <servers/> <mirrors> <mirror> <id>redhat-ga-mirror</id> <name>Red Hat GA</name> <url>https://<maven_artifact_repository_route>/repository/redhat-ga/</url> <mirrorOf>redhat-ga</mirrorOf> </mirror> <mirror> <id>maven-central-mirror</id> <name>Maven Central</name> <url>https://<maven_artifact_repository_route>/repository/maven-central/</url> <mirrorOf>maven-central</mirrorOf> </mirror> <mirror> <id>jboss-public-repository-mirror</id> <name>JBoss Public Maven Repository</name> <url>https://<maven_artifact_repository_route>/repository/jboss-public/</url> <mirrorOf>jboss-public-repository</mirrorOf> </mirror> </mirrors> <proxies/> <profiles/> <activeProfiles/> </settings>Apply the ConfigMap for the TrustStore initialization script:
kind: ConfigMap apiVersion: v1 metadata: name: init-truststore annotations: controller.devfile.io/mount-as: subpath controller.devfile.io/mount-path: /home/user/ labels: controller.devfile.io/mount-to-devworkspace: 'true' controller.devfile.io/watch-configmap: 'true' data: init-truststore.sh: | #!/usr/bin/env bash keytool -importcert -noprompt -file /home/user/certs/tls.cer -cacerts -storepass changeit- Start a Maven workspace.
-
Open a new terminal in the
toolscontainer. -
Run
~/init-truststore.sh.
5.2.2. Enabling Gradle artifact repositories
You can enable a Gradle artifact repository in Gradle workspaces that run in a restricted environment.
Prerequisites
- You are not running any Gradle workspace.
Procedure
Apply the Secret for the TLS certificate:
kind: Secret apiVersion: v1 metadata: name: tls-cer annotations: controller.devfile.io/mount-path: /home/user/certs controller.devfile.io/mount-as: file labels: controller.devfile.io/mount-to-devworkspace: 'true' controller.devfile.io/watch-secret: 'true' data: tls.cer: >- <Base64_encoded_content_of_public_cert> 1- 1
- Base64 encoding with disabled line wrapping.
Apply the ConfigMap for the TrustStore initialization script:
kind: ConfigMap
apiVersion: v1
metadata:
  name: init-truststore
  annotations:
    controller.devfile.io/mount-as: subpath
    controller.devfile.io/mount-path: /home/user/
  labels:
    controller.devfile.io/mount-to-devworkspace: 'true'
    controller.devfile.io/watch-configmap: 'true'
data:
  init-truststore.sh: |
    #!/usr/bin/env bash

    keytool -importcert -noprompt -file /home/user/certs/tls.cer -cacerts -storepass changeit
Apply the ConfigMap for the Gradle init script:
kind: ConfigMap apiVersion: v1 metadata: name: init-gradle annotations: controller.devfile.io/mount-as: subpath controller.devfile.io/mount-path: /home/user/.gradle labels: controller.devfile.io/mount-to-devworkspace: 'true' controller.devfile.io/watch-configmap: 'true' data: init.gradle: | allprojects { repositories { mavenLocal () maven { url "https://<gradle_artifact_repository_route>/repository/maven-public/" credentials { username "admin" password "passwd" } } } }- Start a Gradle workspace.
-
Open a new terminal in the
toolscontainer. -
Run
~/init-truststore.sh.
5.2.3. Enabling npm artifact repositories
You can enable an npm artifact repository in npm workspaces that run in a restricted environment.
Prerequisites
- You are not running any npm workspace.
Applying a ConfigMap that sets environment variables might cause a workspace boot loop.
If you encounter this behavior, remove the ConfigMap and edit the devfile directly.
Procedure
Apply the Secret for the TLS certificate:
kind: Secret apiVersion: v1 metadata: name: tls-cer annotations: controller.devfile.io/mount-path: /home/user/certs controller.devfile.io/mount-as: file labels: controller.devfile.io/mount-to-devworkspace: 'true' controller.devfile.io/watch-secret: 'true' data: tls.cer: >- <Base64_encoded_content_of_public_cert> 1- 1
- Base64 encoding with disabled line wrapping.
Apply the ConfigMap to set the following environment variables in the
toolscontainer:kind: ConfigMap apiVersion: v1 metadata: name: disconnected-env annotations: controller.devfile.io/mount-as: env labels: controller.devfile.io/mount-to-devworkspace: 'true' controller.devfile.io/watch-configmap: 'true' data: NODE_EXTRA_CA_CERTS: /home/user/certs/tls.cer NPM_CONFIG_REGISTRY: >- https://<npm_artifact_repository_route>/repository/npm-all/
5.2.4. Enabling Python artifact repositories
You can enable a Python artifact repository in Python workspaces that run in a restricted environment.
Prerequisites
- You are not running any Python workspace.
Applying a ConfigMap that sets environment variables might cause a workspace boot loop.
If you encounter this behavior, remove the ConfigMap and edit the devfile directly.
Procedure
Apply the Secret for the TLS certificate:
kind: Secret apiVersion: v1 metadata: name: tls-cer annotations: controller.devfile.io/mount-path: /home/user/certs controller.devfile.io/mount-as: file labels: controller.devfile.io/mount-to-devworkspace: 'true' controller.devfile.io/watch-secret: 'true' data: tls.cer: >- <Base64_encoded_content_of_public_cert> 1- 1
- Base64 encoding with disabled line wrapping.
Apply the ConfigMap to set the following environment variables in the
toolscontainer:kind: ConfigMap apiVersion: v1 metadata: name: disconnected-env annotations: controller.devfile.io/mount-as: env labels: controller.devfile.io/mount-to-devworkspace: 'true' controller.devfile.io/watch-configmap: 'true' data: PIP_INDEX_URL: >- https://<python_artifact_repository_route>/repository/pypi-all/ PIP_CERT: /home/user/certs/tls.cer
5.2.5. Enabling Go artifact repositories
You can enable a Go artifact repository in Go workspaces that run in a restricted environment.
Prerequisites
- You are not running any Go workspace.
Applying a ConfigMap that sets environment variables might cause a workspace boot loop.
If you encounter this behavior, remove the ConfigMap and edit the devfile directly.
Procedure
Apply the Secret for the TLS certificate:
kind: Secret apiVersion: v1 metadata: name: tls-cer annotations: controller.devfile.io/mount-path: /home/user/certs controller.devfile.io/mount-as: file labels: controller.devfile.io/mount-to-devworkspace: 'true' controller.devfile.io/watch-secret: 'true' data: tls.cer: >- <Base64_encoded_content_of_public_cert> 1- 1
- Base64 encoding with disabled line wrapping.
Apply the ConfigMap to set the following environment variables in the
toolscontainer:kind: ConfigMap apiVersion: v1 metadata: name: disconnected-env annotations: controller.devfile.io/mount-as: env labels: controller.devfile.io/mount-to-devworkspace: 'true' controller.devfile.io/watch-configmap: 'true' data: GOPROXY: >- http://<athens_proxy_route> SSL_CERT_FILE: /home/user/certs/tls.cer
5.2.6. Enabling NuGet artifact repositories
You can enable a NuGet artifact repository in NuGet workspaces that run in a restricted environment.
Prerequisites
- You are not running any NuGet workspace.
Applying a ConfigMap that sets environment variables might cause a workspace boot loop.
If you encounter this behavior, remove the ConfigMap and edit the devfile directly.
Procedure
Apply the Secret for the TLS certificate:
kind: Secret apiVersion: v1 metadata: name: tls-cer annotations: controller.devfile.io/mount-path: /home/user/certs controller.devfile.io/mount-as: file labels: controller.devfile.io/mount-to-devworkspace: 'true' controller.devfile.io/watch-secret: 'true' data: tls.cer: >- <Base64_encoded_content_of_public_cert> 1- 1
- Base64 encoding with disabled line wrapping.
Apply the ConfigMap to set the environment variable for the path of the TLS certificate file in the
toolscontainer:kind: ConfigMap apiVersion: v1 metadata: name: disconnected-env annotations: controller.devfile.io/mount-as: env labels: controller.devfile.io/mount-to-devworkspace: 'true' controller.devfile.io/watch-configmap: 'true' data: SSL_CERT_FILE: /home/user/certs/tls.cerApply the ConfigMap to create the
nuget.configfile:kind: ConfigMap apiVersion: v1 metadata: name: init-nuget annotations: controller.devfile.io/mount-as: subpath controller.devfile.io/mount-path: /projects labels: controller.devfile.io/mount-to-devworkspace: 'true' controller.devfile.io/watch-configmap: 'true' data: nuget.config: | <?xml version="1.0" encoding="UTF-8"?> <configuration> <packageSources> <add key="nexus2" value="https://<nuget_artifact_repository_route>/repository/nuget-group/"/> </packageSources> <packageSourceCredentials> <nexus2> <add key="Username" value="admin" /> <add key="Password" value="passwd" /> </nexus2> </packageSourceCredentials> </configuration>
5.3. Creating image pull Secrets
To allow the DevWorkspace Pods in the OpenShift cluster of your organization’s OpenShift Dev Spaces instance to access container registries that require authentication, create an image pull Secret.
You can create image pull Secrets by using oc or a .dockercfg file or a config.json file.
5.3.1. Creating an image pull Secret with oc
Prerequisites
-
An active
ocsession with administrative permissions to the destination OpenShift cluster. See Getting started with the CLI.
Procedure
In your user project, create an image pull Secret with your private container registry details and credentials:
$ oc create secret docker-registry <Secret_name> \
    --docker-server=<registry_server> \
    --docker-username=<username> \
    --docker-password=<password> \
    --docker-email=<email_address>
Add the following label to the image pull Secret:
$ oc label secret <Secret_name> controller.devfile.io/devworkspace_pullsecret=true controller.devfile.io/watch-secret=true
5.3.2. Creating an image pull Secret from a .dockercfg file
If you already store the credentials for the private container registry in a .dockercfg file, you can use that file to create an image pull Secret.
Prerequisites
-
An active
ocsession with administrative permissions to the destination OpenShift cluster. See Getting started with the CLI. -
base64command line tools are installed in the operating system you are using.
Procedure
Encode the
.dockercfgfile to Base64:$ cat .dockercfg | base64 | tr -d '\n'
Create a new OpenShift Secret in your user project:
apiVersion: v1
kind: Secret
metadata:
  name: <Secret_name>
  labels:
    controller.devfile.io/devworkspace_pullsecret: 'true'
    controller.devfile.io/watch-secret: 'true'
data:
  .dockercfg: <Base64_content_of_.dockercfg>
type: kubernetes.io/dockercfg
Apply the Secret:
$ oc apply -f - <<EOF
<Secret_prepared_in_the_previous_step>
EOF
5.3.3. Creating an image pull Secret from a config.json file
If you already store the credentials for the private container registry in a $HOME/.docker/config.json file, you can use that file to create an image pull Secret.
Prerequisites
-
An active
ocsession with administrative permissions to the destination OpenShift cluster. See Getting started with the CLI. -
base64command line tools are installed in the operating system you are using.
Procedure
Encode the
$HOME/.docker/config.jsonfile to Base64.$ cat config.json | base64 | tr -d '\n'
Create a new OpenShift Secret in your user project:
apiVersion: v1
kind: Secret
metadata:
  name: <Secret_name>
  labels:
    controller.devfile.io/devworkspace_pullsecret: 'true'
    controller.devfile.io/watch-secret: 'true'
data:
  .dockerconfigjson: <Base64_content_of_config.json>
type: kubernetes.io/dockerconfigjson
Apply the Secret:
$ oc apply -f - <<EOF
<Secret_prepared_in_the_previous_step>
EOF
5.4. Mounting Secrets
To mount confidential data into your workspaces, use Kubernetes Secrets.
Using Kubernetes Secrets, you can mount usernames, passwords, SSH key pairs, authentication tokens (for example, for AWS), and sensitive configurations.
Mount Kubernetes Secrets to the DevWorkspace containers in the OpenShift cluster of your organization’s OpenShift Dev Spaces instance.
Prerequisites
-
An active
ocsession with administrative permissions to the destination OpenShift cluster. See Getting started with the CLI. -
You have created a new Secret or determined an existing one in your user project to mount to all
DevWorkspacecontainers.
Procedure
- Determine an existing ConfigMap or Secret in your user project to mount to all workspace containers.
Set the required labels for mounting.
$ oc label secret <Secret_name> \
        controller.devfile.io/mount-to-devworkspace=true \
        controller.devfile.io/watch-secret=true
Optional: Use the annotations to configure how the Secret is mounted.
Table 5.1. Optional annotations
Annotation Description controller.devfile.io/mount-path:Specifies the mount path.
Defaults to
/etc/secret/<Secret_name>.controller.devfile.io/mount-as:Specifies how the resource should be mounted:
file,subpath, orenv.Defaults to
file.mount-as: filemounts the keys and values as files within the mount path.mount-as: subpathmounts the keys and values within the mount path using subpath volume mounts.mount-as: envmounts the keys and values as environment variables in allDevWorkspacecontainers.
Example 5.2. Mounting a Secret as a file
apiVersion: v1
kind: Secret
metadata:
  name: mvn-settings-secret
  labels:
    controller.devfile.io/mount-to-devworkspace: 'true'
    controller.devfile.io/watch-secret: 'true'
  annotations:
    controller.devfile.io/mount-path: '/home/user/.m2'
data:
  settings.xml: <Base64_encoded_content>
When you start a workspace, the /home/user/.m2/settings.xml file will be available in the DevWorkspace containers.
With Maven, you can set a custom path for the settings.xml file. For example:
$ mvn --settings /home/user/.m2/settings.xml clean install
5.5. Mounting ConfigMaps
To mount non-confidential configuration data into your workspaces, use Kubernetes ConfigMaps.
Using Kubernetes ConfigMaps, you can mount non-sensitive data such as configuration values for an application.
Mount Kubernetes ConfigMaps to the DevWorkspace containers in the OpenShift cluster of your organization’s OpenShift Dev Spaces instance.
Prerequisites
-
An active
ocsession with administrative permissions to the destination OpenShift cluster. See Getting started with the CLI. -
You have created a new ConfigMap or determined an existing one in your user project to mount to all
DevWorkspacecontainers.
Procedure
- Determine an existing ConfigMap in your user project to mount to all workspace containers.
Set the required labels for mounting.
$ oc label configmap <ConfigMap_name> \
        controller.devfile.io/mount-to-devworkspace=true \
        controller.devfile.io/watch-configmap=true
Optional: Use the annotations to configure how the ConfigMap is mounted.
Table 5.2. Optional annotations
Annotation Description controller.devfile.io/mount-path:Specifies the mount path.
Defaults to
/etc/config/<ConfigMap_name>.controller.devfile.io/mount-as:Specifies how the resource should be mounted:
file,subpath, orenv.Defaults to
file.mount-as:filemounts the keys and values as files within the mount path.mount-as:subpathmounts the keys and values within the mount path using subpath volume mounts.mount-as:envmounts the keys and values as environment variables in allDevWorkspacecontainers.
Example 5.3. Mounting a ConfigMap as environment variables
kind: ConfigMap
apiVersion: v1
metadata:
  name: my-settings
  labels:
    controller.devfile.io/mount-to-devworkspace: 'true'
    controller.devfile.io/watch-configmap: 'true'
  annotations:
    controller.devfile.io/mount-as: env
data:
  <env_var_1>: <value_1>
  <env_var_2>: <value_2>
When you start a workspace, the <env_var_1> and <env_var_2> environment variables will be available in the DevWorkspace containers.
Chapter 6. Requesting persistent storage for workspaces
OpenShift Dev Spaces workspaces and workspace data are ephemeral and are lost when the workspace stops.
To preserve the workspace state in persistent storage while the workspace is stopped, request a Kubernetes PersistentVolume (PV) for the DevWorkspace containers in the OpenShift cluster of your organization’s OpenShift Dev Spaces instance.
You can request a PV by using the devfile or a Kubernetes PersistentVolumeClaim (PVC).
An example of a PV is the /projects/ directory of a workspace, which is mounted by default for non-ephemeral workspaces.
Persistent Volumes come at a cost: attaching a persistent volume slows workspace startup.
Starting another, concurrently running workspace with a ReadWriteOnce PV may fail.
Additional resources
6.1. Requesting persistent storage in a devfile
When a workspace requires its own persistent storage, request a PersistentVolume (PV) in the devfile, and OpenShift Dev Spaces will automatically manage the necessary PersistentVolumeClaims.
Prerequisites
- You have not started the workspace.
Procedure
Add a
volumecomponent in the devfile:... components: ... - name: <chosen_volume_name> volume: size: <requested_volume_size>G ...
Add a
volumeMountfor the relevantcontainerin the devfile:... components: - name: ... container: ... volumeMounts: - name: <chosen_volume_name_from_previous_step> path: <path_where_to_mount_the_PV> ...
Example 6.1. A devfile that provisions a PV for a workspace to a container
When a workspace is started with the following devfile, the cache PV is provisioned to the golang container in the ./cache container path:
schemaVersion: 2.1.0
metadata:
  name: mydevfile
components:
  - name: golang
    container:
      image: golang
      memoryLimit: 512Mi
      mountSources: true
      command: ['sleep', 'infinity']
      volumeMounts:
        - name: cache
          path: /.cache
  - name: cache
    volume:
      size: 2Gi
6.2. Requesting persistent storage in a PVC
You may opt to apply a PersistentVolumeClaim (PVC) to request a PersistentVolume (PV) for your workspaces in the following cases:
- Not all developers of the project need the PV.
- The PV lifecycle goes beyond the lifecycle of a single workspace.
- The data included in the PV are shared across workspaces.
You can apply a PVC to the DevWorkspace containers even if the workspace is ephemeral and its devfile contains the controller.devfile.io/storage-type: ephemeral attribute.
Prerequisites
- You have not started the workspace.
-
An active
ocsession with administrative permissions to the destination OpenShift cluster. See Getting started with the CLI. -
A PVC is created in your user project to mount to all
DevWorkspacecontainers.
Procedure
Add the
controller.devfile.io/mount-to-devworkspace: truelabel to the PVC.$ oc label persistentvolumeclaim <PVC_name> \ controller.devfile.io/mount-to-devworkspace=trueOptional: Use the annotations to configure how the PVC is mounted:
Table 6.1. Optional annotations
Annotation Description controller.devfile.io/mount-path:The mount path for the PVC.
Defaults to
/tmp/<PVC_name>.controller.devfile.io/read-only:Set to
'true'or'false'to specify whether the PVC is to be mounted as read-only.Defaults to
'false', resulting in the PVC mounted as read-write.
Example 6.2. Mounting a read-only PVC
apiVersion: v1
kind: PersistentVolumeClaim
metadata:
  name: <pvc_name>
  labels:
    controller.devfile.io/mount-to-devworkspace: 'true'
  annotations:
    controller.devfile.io/mount-path: </example/directory> 1
spec:
  accessModes:
    - ReadWriteOnce
  resources:
    requests:
      storage: 3Gi 2
  volumeName: <pv_name>
  storageClassName: manual
  volumeMode: Filesystem
Chapter 7. Integrating with OpenShift
7.1. Automatic OpenShift token injection
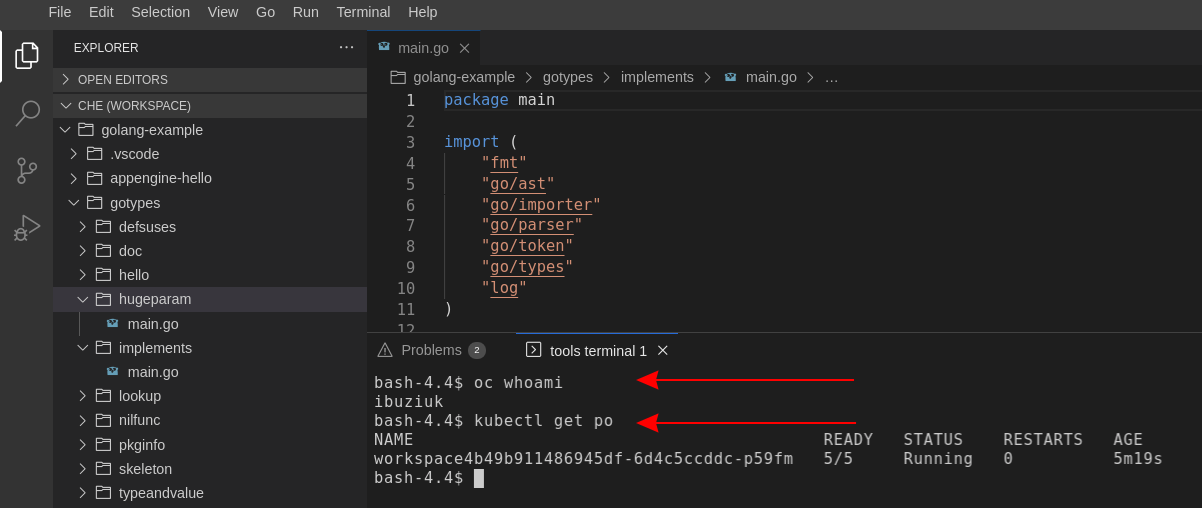
This section describes how to use the OpenShift user token that is automatically injected into workspace containers which allows running OpenShift Dev Spaces CLI commands against OpenShift cluster.
Procedure
- Open the OpenShift Dev Spaces dashboard and start a workspace.
- Once the workspace is started, open a terminal in the container that contains the OpenShift Dev Spaces CLI.
Execute OpenShift Dev Spaces CLI commands which allow you to run commands against OpenShift cluster. CLI can be used for deploying applications, inspecting and managing cluster resources, and viewing logs. OpenShift user token will be used during the execution of the commands.
The automatic token injection currently works only on the OpenShift infrastructure.
7.2. Navigating OpenShift Dev Spaces from OpenShift Developer Perspective
The OpenShift Container Platform web console provides two perspectives; the Administrator perspective and the Developer perspective.
The Developer perspective provides workflows specific to developer use cases, such as the ability to:
- Create and deploy applications on the OpenShift Container Platform by importing existing codebases, images, and Dockerfiles.
- Visually interact with applications, components, and services associated with them within a project and monitor their deployment and build status.
- Group components within an application and connect the components within and across applications.
- Integrate serverless capabilities (Technology Preview).
- Create workspaces to edit your application code using OpenShift Dev Spaces.
7.2.1. OpenShift Developer Perspective integration with OpenShift Dev Spaces
This section provides information about OpenShift Developer Perspective support for OpenShift Dev Spaces.
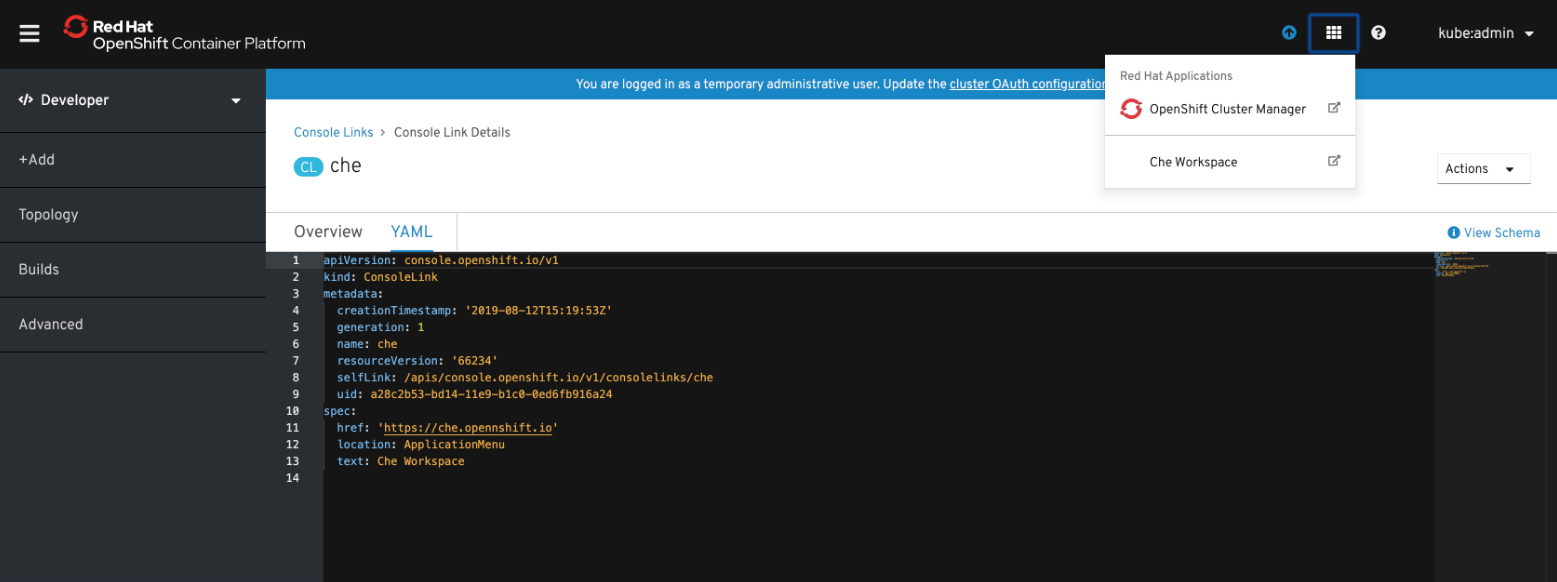
When the OpenShift Dev Spaces Operator is deployed into OpenShift Container Platform 4.2 and later, it creates a ConsoleLink Custom Resource (CR). This adds an interactive link to the Red Hat Applications menu for accessing the OpenShift Dev Spaces installation using the OpenShift Developer Perspective console.
To access the Red Hat Applications menu, click the three-by-three matrix icon on the main screen of the OpenShift web console. The OpenShift Dev Spaces Console Link, displayed in the drop-down menu, creates a new workspace or redirects the user to an existing one.
OpenShift Container Platform console links are not created when OpenShift Dev Spaces is used with HTTP resources
When installing OpenShift Dev Spaces with the From Git option, the OpenShift Developer Perspective console link is only created if OpenShift Dev Spaces is deployed with HTTPS. The console link will not be created if an HTTP resource is used.
7.2.2. Editing the code of applications running in OpenShift Container Platform using OpenShift Dev Spaces
This section describes how to start editing the source code of applications running on OpenShift using OpenShift Dev Spaces.
Prerequisites
- OpenShift Dev Spaces is deployed on the same OpenShift 4 cluster.
Procedure
- Open the Topology view to list all projects.
-
In the Select an Application search field, type
workspaceto list all workspaces. Click the workspace to edit.
The deployments are displayed as graphical circles surrounded by circular buttons. One of these buttons is Edit Source Code.
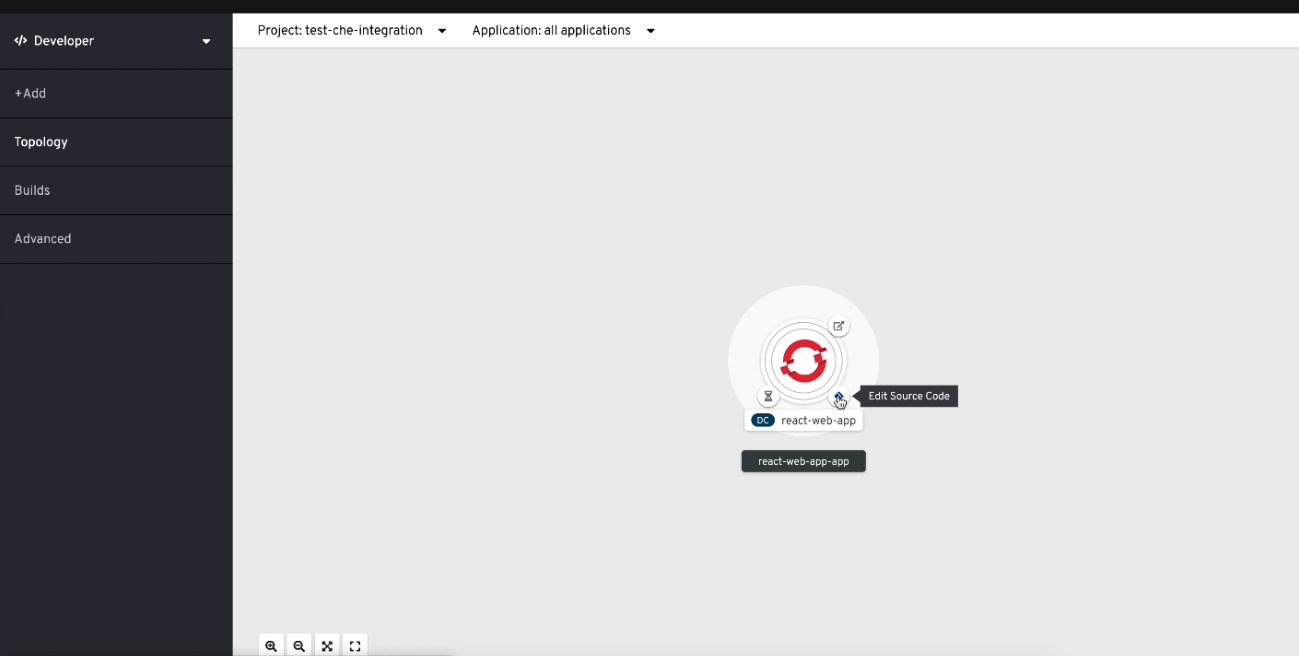
- To edit the code of an application using OpenShift Dev Spaces, click the Edit Source Code button. This redirects to a workspace with the cloned source code of the application component.
7.2.3. Accessing OpenShift Dev Spaces from Red Hat Applications menu
This section describes how to access OpenShift Dev Spaces workspaces from the Red Hat Applications menu on the OpenShift Container Platform.
Prerequisites
- The OpenShift Dev Spaces Operator is available in OpenShift 4.
Procedure
Open the Red Hat Applications menu by using the three-by-three matrix icon in the upper right corner of the main screen.
The drop-down menu displays the available applications.
- Click the OpenShift Dev Spaces link to open the Dev Spaces Dashboard.
7.3. Navigating OpenShift web console from OpenShift Dev Spaces
This section describes how to access OpenShift web console from OpenShift Dev Spaces.
Prerequisites
- The OpenShift Dev Spaces Operator is available in OpenShift 4.
Procedure
Open the OpenShift Dev Spaces dashboard and click the three-by-three matrix icon in the upper right corner of the main screen.
The drop-down menu displays the available applications.
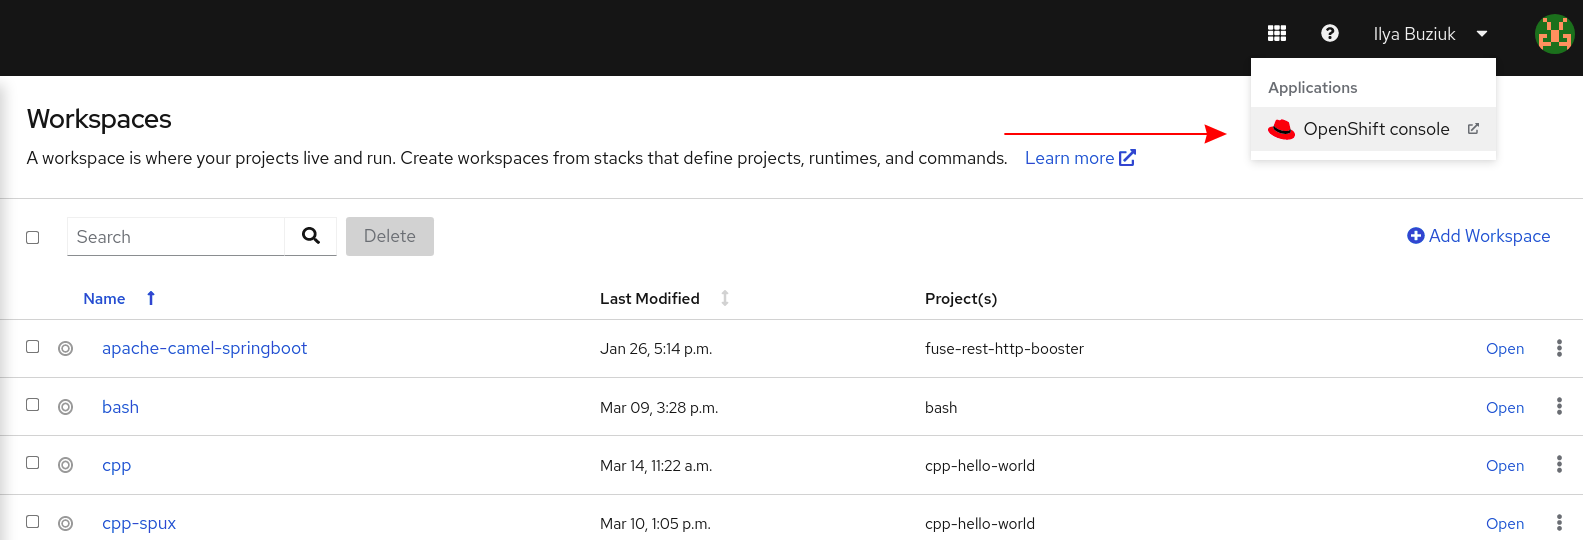
- Click the OpenShift console link to open the OpenShift web console.
Chapter 8. Troubleshooting OpenShift Dev Spaces
This section provides troubleshooting procedures for the most frequent issues a user can come in conflict with.
Additional resources
8.1. Viewing OpenShift Dev Spaces workspaces logs
This section describes how to view OpenShift Dev Spaces workspaces logs.
8.1.1. Viewing logs from language servers and debug adapters
8.1.1.1. Checking important logs
This section describes how to check important logs.
Procedure
- In the OpenShift web console, click Applications → Pods to see a list of all the active workspaces.
- Click on the name of the running Pod where the workspace is running. The Pod screen contains the list of all containers with additional information.
Choose a container and click the container name.
NoteThe most important logs are the
theia-idecontainer and the plug-ins container logs.- On the container screen, navigate to the Logs section.
8.1.1.2. Detecting memory problems
This section describes how to detect memory problems related to a plug-in running out of memory. The following are the two most common problems related to a plug-in running out of memory:
- The plug-in container runs out of memory
-
This can happen during plug-in initialization when the container does not have enough RAM to execute the entrypoint of the image. The user can detect this in the logs of the plug-in container. In this case, the logs contain
OOMKilled, which implies that the processes in the container requested more memory than is available in the container. - A process inside the container runs out of memory without the container noticing this
For example, the Java language server (Eclipse JDT Language Server, started by the
vscode-javaextension) throws an OutOfMemoryException. This can happen any time after the container is initialized, for example, when a plug-in starts a language server or when a process runs out of memory because of the size of the project it has to handle.To detect this problem, check the logs of the primary process running in the container. For example, to check the log file of Eclipse JDT Language Server for details, see the relevant plug-in-specific sections.
8.1.1.3. Logging the client-server traffic for debug adapters
This section describes how to log the exchange between Che-Theia and a debug adapter into the Output view.
Prerequisites
- A debug session must be started for the Debug adapters option to appear in the list.
Procedure
- Click File → Settings and then open Preferences.
- Expand the Debug section in the Preferences view.
Set the trace preference value to
true(default isfalse).All the communication events are logged.
- To watch these events, click View → Output and select Debug adapters from the drop-down list at the upper right corner of the Output view.
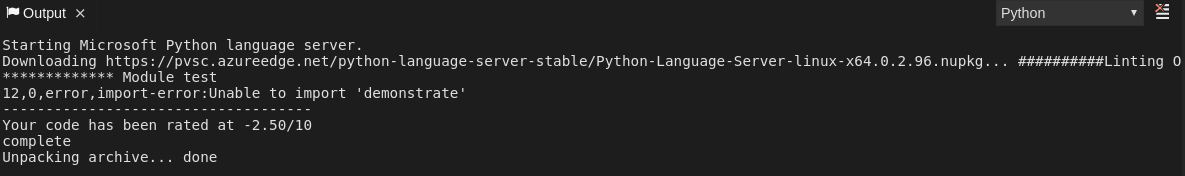
8.1.1.4. Viewing logs for Python
This section describes how to view logs for the Python language server.
Procedure
Navigate to the Output view and select Python in the drop-down list.
8.1.1.5. Viewing logs for Go
This section describes how to view logs for the Go language server.
8.1.1.5.1. Finding the Go path
This section describes how to find where the GOPATH variable points to.
Procedure
Execute the
Go: Current GOPATHcommand.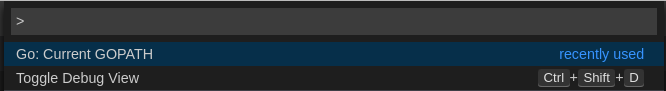

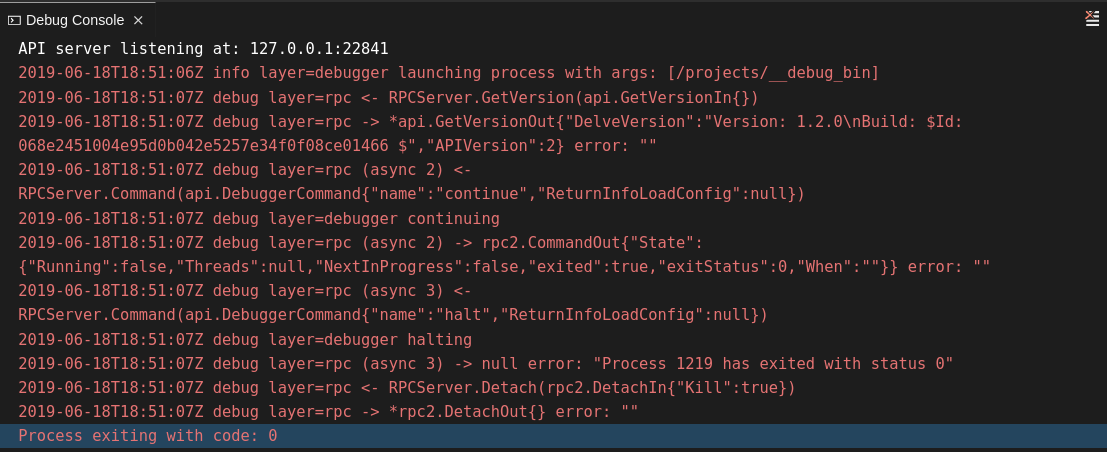
8.1.1.5.2. Viewing the Debug Console log for Go
This section describes how to view the log output from the Go debugger.
Procedure
Set the
showLogattribute totruein the debug configuration.{ "version": "0.2.0", "configurations": [ { "type": "go", "showLog": true .... } ] }To enable debugging output for a component, add the package to the comma-separated list value of the
logOutputattribute:{ "version": "0.2.0", "configurations": [ { "type": "go", "showLog": true, "logOutput": "debugger,rpc,gdbwire,lldbout,debuglineerr" .... } ] }The debug console prints the additional information in the debug console.
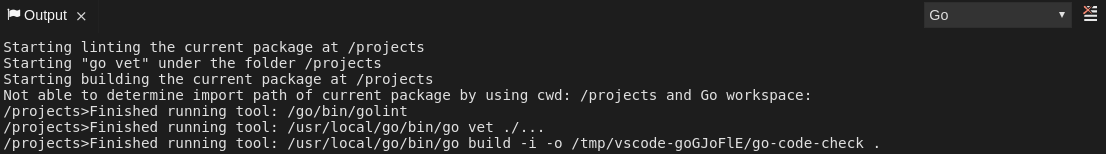
8.1.1.5.3. Viewing the Go logs output in the Output panel
This section describes how to view the Go logs output in the Output panel.
Procedure
- Navigate to the Output view.
Select Go in the drop-down list.
8.1.1.6. Viewing logs for the NodeDebug NodeDebug2 adapter
No specific diagnostics exist other than the general ones.
8.1.1.7. Viewing logs for Typescript
8.1.1.7.1. Enabling the label switched protocol (LSP) tracing
Procedure
-
To enable the tracing of messages sent to the Typescript (TS) server, in the Preferences view, set the
typescript.tsserver.traceattribute toverbose. Use this to diagnose the TS server issues. -
To enable logging of the TS server to a file, set the
typescript.tsserver.logattribute toverbose. Use this log to diagnose the TS server issues. The log contains the file paths.
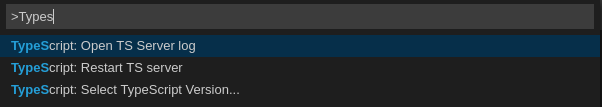
8.1.1.7.2. Viewing the Typescript language server log
This section describes how to view the Typescript language server log.
Procedure
To get the path to the log file, see the Typescript Output console:

To open log file, use the Open TS Server log command.
8.1.1.7.3. Viewing the Typescript logs output in the Output panel
This section describes how to view the Typescript logs output in the Output panel.
Procedure
- Navigate to the Output view
Select TypeScript in the drop-down list.

8.1.1.8. Viewing logs for Java
Other than the general diagnostics, there are Language Support for Java (Eclipse JDT Language Server) plug-in actions that the user can perform.
8.1.1.8.1. Verifying the state of the Eclipse JDT Language Server
Procedure
Check if the container that is running the Eclipse JDT Language Server plug-in is running the Eclipse JDT Language Server main process.
-
Open a terminal in the container that is running the Eclipse JDT Language Server plug-in (an example name for the container:
vscode-javaxxx). Inside the terminal, run the
ps aux | grep jdtcommand to check if the Eclipse JDT Language Server process is running in the container. If the process is running, the output is:usr/lib/jvm/default-jvm/bin/java --add-modules=ALL-SYSTEM --add-opens java.base/java.util
This message also shows the Visual Studio Code Java extension used. If it is not running, the language server has not been started inside the container.
- Check all logs described in Section 8.1, “Viewing OpenShift Dev Spaces workspaces logs”.
8.1.1.8.2. Verifying the Eclipse JDT Language Server features
Procedure
If the Eclipse JDT Language Server process is running, check if the language server features are working:
- Open a Java file and use the hover or autocomplete functionality. In case of an erroneous file, the user sees Java in the Outline view or in the Problems view.
8.1.1.8.3. Viewing the Java language server log
Procedure
The Eclipse JDT Language Server has its own workspace where it logs errors, information about executed commands, and events.
- To open this log file, open a terminal in the container that is running the Eclipse JDT Language Server plug-in. You can also view the log file by running the Java: Open Java Language Server log file command.
-
Run
cat <PATH_TO_LOG_FILE>wherePATH_TO_LOG_FILEis/home/theia/.theia/workspace-storage/<workspace_name>/redhat.java/jdt_ws/.metadata/.log.
8.1.1.8.4. Logging the Java language server protocol (LSP) messages
Procedure
To log the LSP messages to the Visual Studio Code Output view, enable tracing by setting the java.trace.server attribute to verbose.
Additional resources
For troubleshooting instructions, see the Visual Studio Code Java GitHub repository.
8.1.1.9. Viewing logs for Intelephense
8.1.1.9.1. Logging the Intelephense client-server communication
Procedure
To configure the PHP Intelephense language support to log the client-server communication in the Output view:
- Click File → Settings.
- Open the Preferences view.
-
Expand the Intelephense section and set the
trace.server.verbosepreference value toverboseto see all the communication events (the default value isoff).
8.1.1.9.2. Viewing Intelephense events in the Output panel
This procedure describes how to view Intelephense events in the Output panel.
Procedure
- Click View → Output
- Select Intelephense in the drop-down list for the Output view.
8.1.1.10. Viewing logs for PHP-Debug
This procedure describes how to configure the PHP Debug plug-in to log the PHP Debug plug-in diagnostic messages into the Debug Console view. Configure this before the start of the debug session.
Procedure
-
In the
launch.jsonfile, add the"log": trueattribute to thephpconfiguration. - Start the debug session.
- The diagnostic messages are printed into the Debug Console view along with the application output.
8.1.1.11. Viewing logs for XML
Other than the general diagnostics, there are XML plug-in specific actions that the user can perform.
8.1.1.11.1. Verifying the state of the XML language server
Procedure
-
Open a terminal in the container named
vscode-xml-<xxx>. Run
ps aux | grep javato verify that the XML language server has started. If the process is running, the output is:java ***/org.eclipse.ls4xml-uber.jar`
If is not, see the Section 8.1, “Viewing OpenShift Dev Spaces workspaces logs” chapter.
8.1.1.11.2. Checking XML language server feature flags
Procedure
Check if the features are enabled. The XML plug-in provides multiple settings that can enable and disable features:
-
xml.format.enabled: Enable the formatter -
xml.validation.enabled: Enable the validation -
xml.documentSymbols.enabled: Enable the document symbols
-
-
To diagnose whether the XML language server is working, create a simple XML element, such as
<hello></hello>, and confirm that it appears in the Outline panel on the right. -
If the document symbols do not show, ensure that the
xml.documentSymbols.enabledattribute is set totrue. If it istrue, and there are no symbols, the language server may not be hooked to the editor. If there are document symbols, then the language server is connected to the editor. -
Ensure that the features that the user needs, are set to
truein the settings (they are set totrueby default). If any of the features are not working, or not working as expected, file an issue against the Language Server.
8.1.1.11.3. Enabling XML Language Server Protocol (LSP) tracing
Procedure
To log LSP messages to the Visual Studio Code Output view, enable tracing by setting the xml.trace.server attribute to verbose.
8.1.1.11.4. Viewing the XML language server log
Procedure
The log from the language server can be found in the plug-in sidecar at /home/theia/.theia/workspace-storage/<workspace_name>/redhat.vscode-xml/lsp4xml.log.
8.1.1.12. Viewing logs for YAML
This section describes the YAML plug-in specific actions that the user can perform, in addition to the general diagnostics ones.
8.1.1.12.1. Verifying the state of the YAML language server
This section describes how to verify the state of the YAML language server.
Procedure
Check if the container running the YAML plug-in is running the YAML language server.
-
In the editor, open a terminal in the container that is running the YAML plug-in (an example name of the container:
vscode-yaml-<xxx>). -
In the terminal, run the
ps aux | grep nodecommand. This command searches all the node processes running in the current container. Verify that a command
node **/server.jsis running.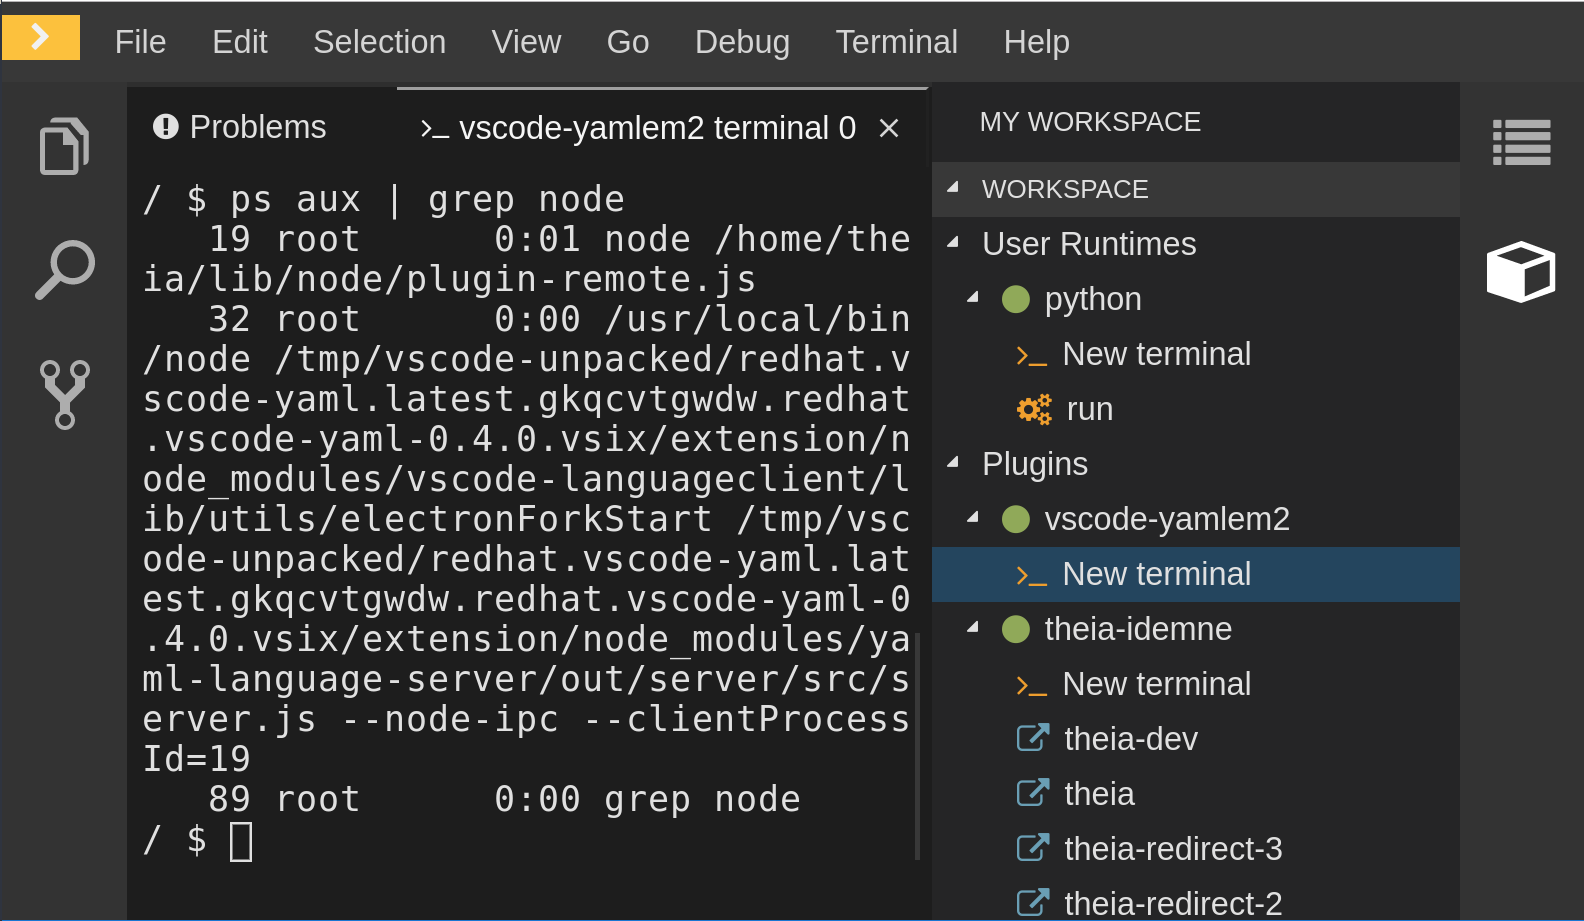
The node **/server.js running in the container indicates that the language server is running. If it is not running, the language server has not started inside the container. In this case, see Section 8.1, “Viewing OpenShift Dev Spaces workspaces logs”.
8.1.1.12.2. Checking the YAML language server feature flags
Procedure
To check the feature flags:
Check if the features are enabled. The YAML plug-in provides multiple settings that can enable and disable features, such as:
-
yaml.format.enable: Enables the formatter -
yaml.validate: Enables validation -
yaml.hover: Enables the hover function -
yaml.completion: Enables the completion function
-
-
To check if the plug-in is working, type the simplest YAML, such as
hello: world, and then open the Outline panel on the right side of the editor. - Verify if there are any document symbols. If yes, the language server is connected to the editor.
-
If any feature is not working, verify that the settings listed above are set to
true(they are set totrueby default). If a feature is not working, file an issue against the Language Server.
8.1.1.12.3. Enabling YAML Language Server Protocol (LSP) tracing
Procedure
To log LSP messages to the Visual Studio Code Output view, enable tracing by setting the yaml.trace.server attribute to verbose.
8.1.1.13. Viewing logs for .NET with OmniSharp-Theia plug-in
8.1.1.13.1. OmniSharp-Theia plug-in
OpenShift Dev Spaces uses the OmniSharp-Theia plug-in as a remote plug-in. It is located at github.com/redhat-developer/omnisharp-theia-plugin. In case of an issue, report it, or contribute your fix in the repository.
This plug-in registers omnisharp-roslyn as a language server and provides project dependencies and language syntax for C# applications.
The language server runs on .NET SDK 2.2.105.
8.1.1.13.2. Verifying the state of the OmniSharp-Theia plug-in language server
Procedure
To check if the container running the OmniSharp-Theia plug-in is running OmniSharp, execute the ps aux | grep OmniSharp.exe command. If the process is running, the following is an example output:
/tmp/theia-unpacked/redhat-developer.che-omnisharp-plugin.0.0.1.zcpaqpczwb.omnisharp_theia_plugin.theia/server/bin/mono
/tmp/theia-unpacked/redhat-developer.che-omnisharp-plugin.0.0.1.zcpaqpczwb.omnisharp_theia_plugin.theia/server/omnisharp/OmniSharp.exe
If the output is different, the language server has not started inside the container. Check the logs described in Section 8.1, “Viewing OpenShift Dev Spaces workspaces logs”.
8.1.1.13.3. Checking OmniSharp Che-Theia plug-in language server features
Procedure
-
If the OmniSharp.exe process is running, check if the language server features are working by opening a
.csfile and trying the hover or completion features, or opening the Problems or Outline view.
8.1.1.13.4. Viewing OmniSharp-Theia plug-in logs in the Output panel
Procedure
If OmniSharp.exe is running, it logs all information in the Output panel. To view the logs, open the Output view and select C# from the drop-down list.
8.1.1.14. Viewing logs for .NET with NetcoredebugOutput plug-in
8.1.1.14.1. NetcoredebugOutput plug-in
The NetcoredebugOutput plug-in provides the netcoredbg tool. This tool implements the Visual Studio Code Debug Adapter protocol and allows users to debug .NET applications under the .NET Core runtime.
The container where the NetcoredebugOutput plug-in is running contains .NET SDK v.2.2.105.
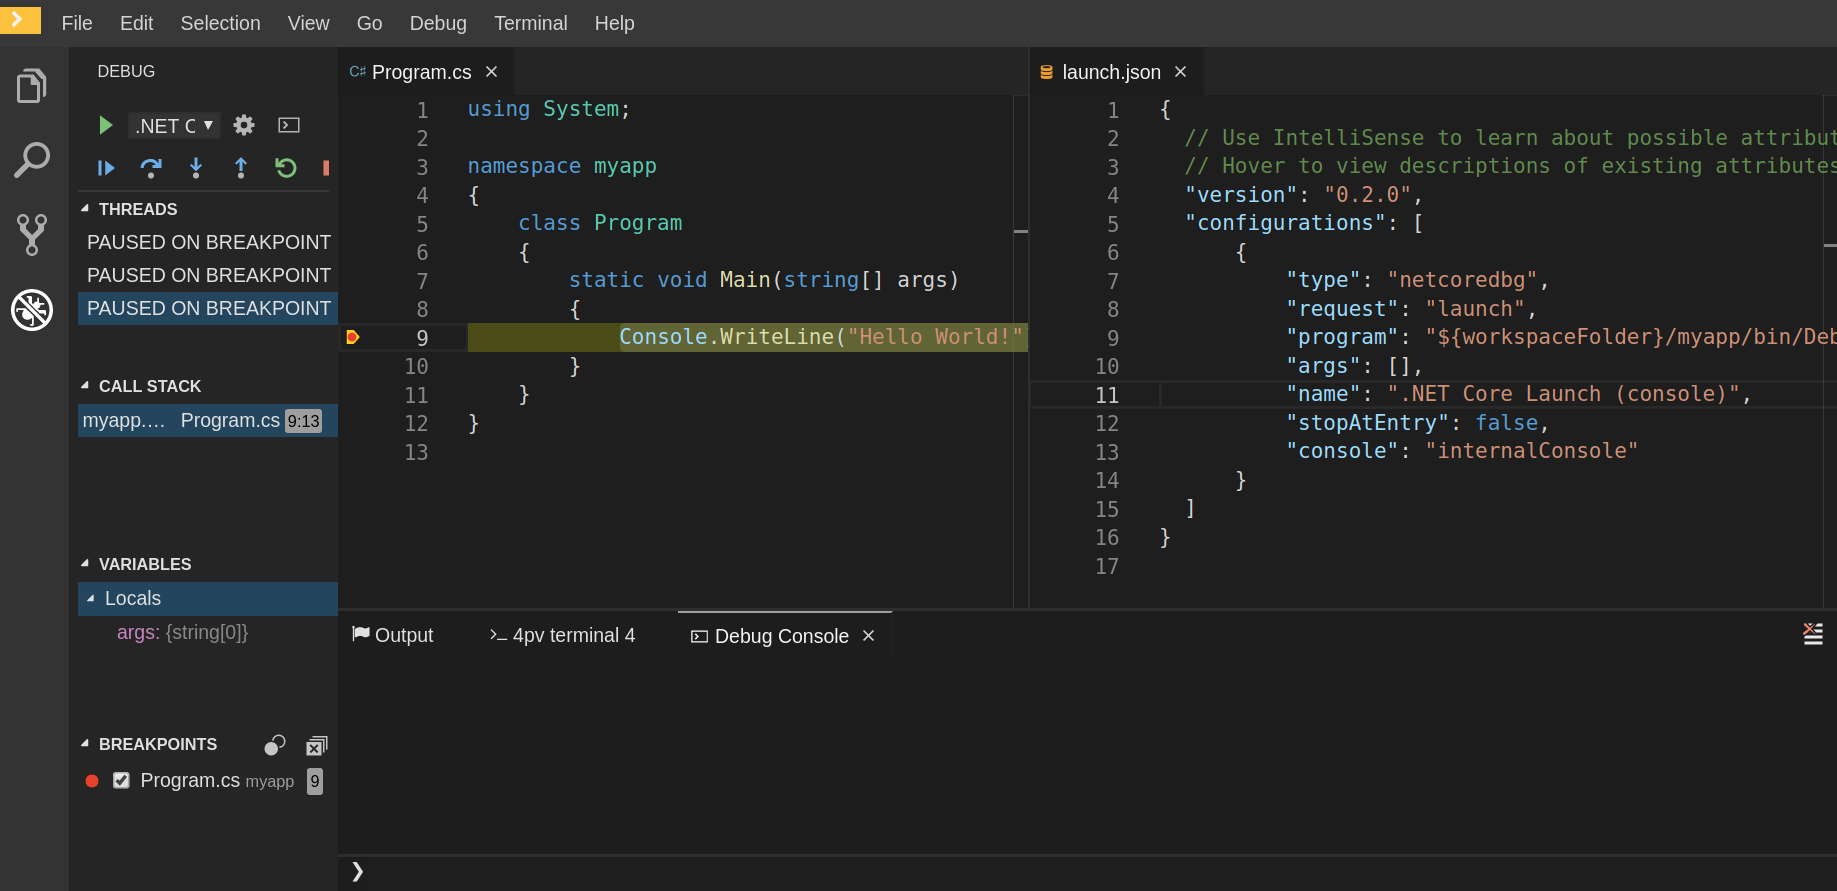
8.1.1.14.2. Verifying the state of the NetcoredebugOutput plug-in
Procedure
Search for a
netcoredbgdebug configuration in thelaunch.jsonfile.Example 8.1. Sample debug configuration
{ "type": "netcoredbg", "request": "launch", "program": "${workspaceFolder}/bin/Debug/<target-framework>/<project-name.dll>", "args": [], "name": ".NET Core Launch (console)", "stopAtEntry": false, "console": "internalConsole" }-
Test the autocompletion feature within the braces of the
configurationsection of thelaunch.jsonfile. If you can findnetcoredbg, the Che-Theia plug-in is correctly initialized. If not, see Section 8.1, “Viewing OpenShift Dev Spaces workspaces logs”.
8.1.1.14.3. Viewing NetcoredebugOutput plug-in logs in the Output panel
This section describes how to view NetcoredebugOutput plug-in logs in the Output panel.
Procedure
Open the Debug console.
8.1.1.15. Viewing logs for Camel
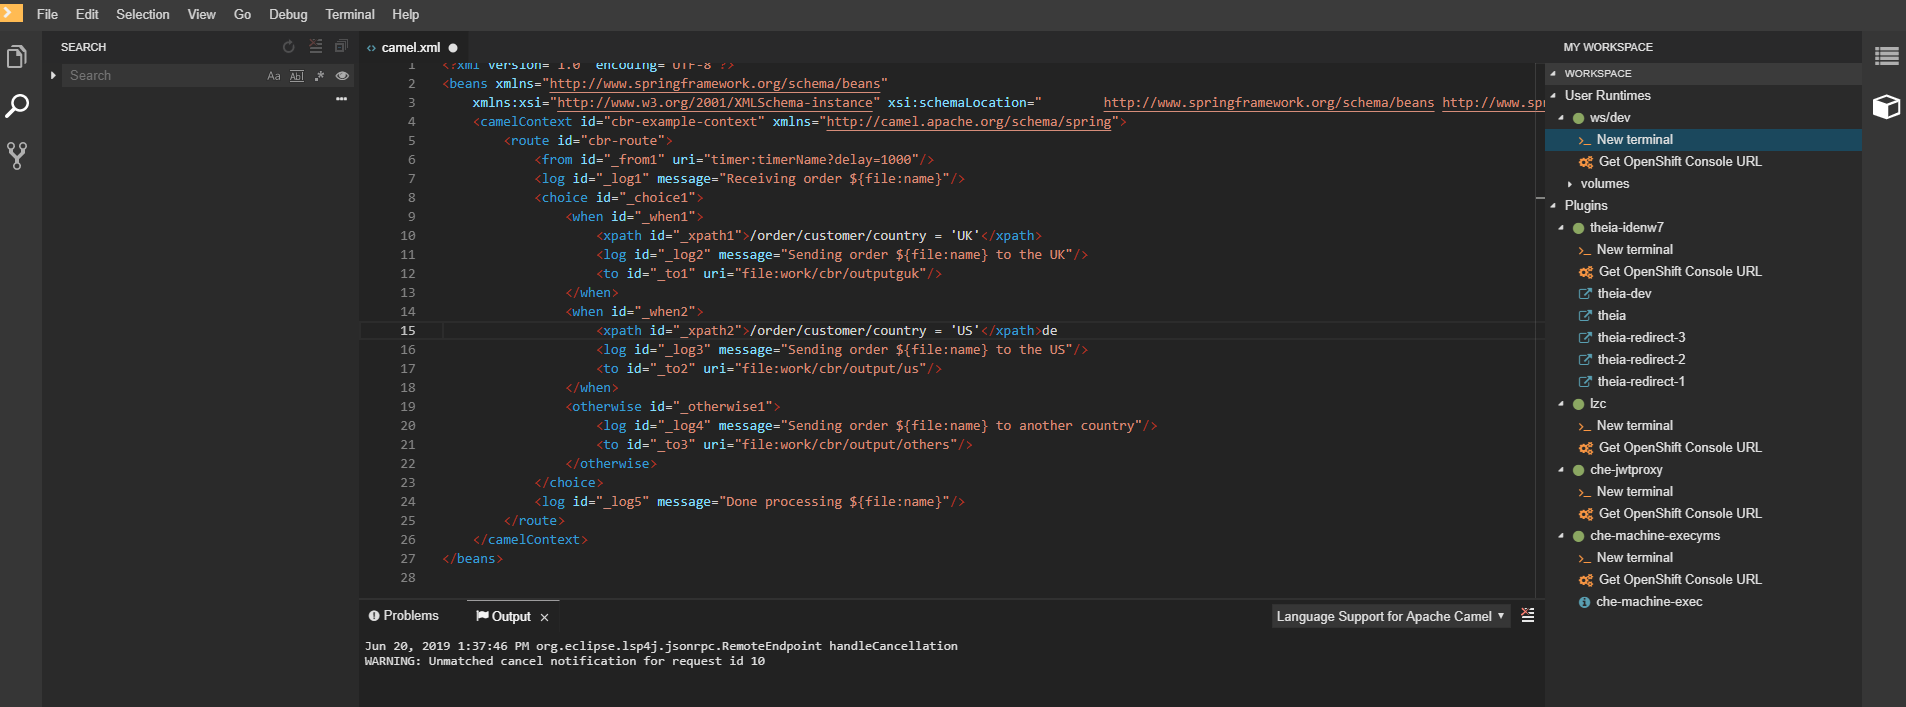
8.1.1.15.1. Verifying the state of the Camel language server
Procedure
The user can inspect the log output of the sidecar container using the Camel language tools that are stored in the vscode-apache-camel<xxx> Camel container.
To verify the state of the language server:
-
Open a terminal inside the
vscode-apache-camel<xxx>container. Run the
ps aux | grep javacommand. The following is an example language server process:java -jar /tmp/vscode-unpacked/camel-tooling.vscode-apache-camel.latest.euqhbmepxd.camel-tooling.vscode-apache-camel-0.0.14.vsix/extension/jars/language-server.jar
- If you cannot find it, see Section 8.1, “Viewing OpenShift Dev Spaces workspaces logs”.
8.1.1.15.2. Viewing Camel logs in the Output panel
The Camel language server is a SpringBoot application that writes its log to the $\{java.io.tmpdir}/log-camel-lsp.out file. Typically, $\{java.io.tmpdir} points to the /tmp directory, so the filename is /tmp/log-camel-lsp.out.
Procedure
The Camel language server logs are printed in the Output channel named Language Support for Apache Camel.
The output channel is created only at the first created log entry on the client side. It may be absent when everything is going well.
8.1.2. Viewing Che-Theia IDE logs
This section describes how to view Che-Theia IDE logs.
8.1.2.1. Viewing Che-Theia editor logs using the OpenShift CLI
Observing Che-Theia editor logs helps to get a better understanding and insight over the plug-ins loaded by the editor. This section describes how to access the Che-Theia editor logs using the OpenShift CLI (command-line interface).
Prerequisites
- OpenShift Dev Spaces is deployed in an OpenShift cluster.
- A workspace is created.
- User is located in a OpenShift Dev Spaces installation project.
Procedure
Obtain the list of the available Pods:
$ oc get pods
Example
$ oc get pods
NAME                                              READY  STATUS   RESTARTS  AGE
devspaces-9-xz6g8                                 1/1    Running  1         15h
workspace0zqb2ew3py4srthh.go-cli-549cdcf69-9n4w2  4/4    Running  0         1h
Obtain the list of the available containers in the particular Pod:
$ oc get pods <name-of-pod> --output jsonpath='\{.spec.containers[*].name}'Example:
$ oc get pods workspace0zqb2ew3py4srthh.go-cli-549cdcf69-9n4w2 -o
jsonpath='\{.spec.containers[*].name}'
> go-cli che-machine-exechr7 theia-idexzb vscode-gox3r
Get logs from the
theia/idecontainer:$ oc logs --follow <name-of-pod> --container <name-of-container>
Example:
$ oc logs --follow workspace0zqb2ew3py4srthh.go-cli-549cdcf69-9n4w2 -container
theia-idexzb
>root INFO unzipping the plug-in 'task_plugin.theia' to directory: /tmp/theia-unpacked/task_plugin.theia
root INFO unzipping the plug-in 'theia_yeoman_plugin.theia' to directory: /tmp/theia-unpacked/theia_yeoman_plugin.theia
root WARN A handler with prefix term  is already registered.
root INFO [nsfw-watcher: 75] Started watching: /home/theia/.theia
root WARN e.onStart is slow, took: 367.4600000013015 ms
root INFO [nsfw-watcher: 75] Started watching: /projects
root INFO [nsfw-watcher: 75] Started watching: /projects/.theia/tasks.json
root INFO [4f9590c5-e1c5-40d1-b9f8-ec31ec3bdac5] Sync of 9 plugins took: 62.26000000242493 ms
root INFO [nsfw-watcher: 75] Started watching: /projects
root INFO [hosted-plugin: 88] PLUGIN_HOST(88) starting instance
8.2. Investigating failures at a workspace start using the Verbose mode
Verbose mode allows users to reach an enlarged log output, investigating failures at a workspace start.
In addition to usual log entries, the Verbose mode also lists the container logs of each workspace.
8.2.1. Restarting a OpenShift Dev Spaces workspace in Verbose mode after start failure
This section describes how to restart a OpenShift Dev Spaces workspace in the Verbose mode after a failure during the workspace start. Dashboard proposes the restart of a workspace in the Verbose mode once the workspace fails at its start.
Prerequisites
- A running instance of OpenShift Dev Spaces.
- An existing workspace that fails to start.
Procedure
- Using Dashboard, try to start a workspace.
- When it fails to start, click on the displayed Open in Verbose mode link.
- Check the Logs tab to find a reason for the workspace failure.
8.2.2. Starting a OpenShift Dev Spaces workspace in Verbose mode
This section describes how to start the Red Hat OpenShift Dev Spaces workspace in Verbose mode.
Prerequisites
- A running instance of Red Hat OpenShift Dev Spaces.
- An existing workspace defined on this instance of OpenShift Dev Spaces.
Procedure
- Open the Workspaces tab.
- On the left side of a row dedicated to the workspace, access the drop-down menu displayed as three horizontal dots and select the Open in Verbose mode option. Alternatively, this option is also available in the workspace details, under the Actions drop-down menu.
- Check the Logs tab to find a reason for the workspace failure.
8.3. Troubleshooting slow workspaces
Sometimes, workspaces can take a long time to start. Tuning can reduce this start time. Depending on the options, administrators or users can do the tuning.
This section includes several tuning options for starting workspaces faster or improving workspace runtime performance.
8.3.1. Improving workspace start time
- Caching images with Image Puller
Role: Administrator
When starting a workspace, OpenShift pulls the images from the registry. A workspace can include many containers meaning that OpenShift pulls Pod’s images (one per container). Depending on the size of the image and the bandwidth, it can take a long time.
Image Puller is a tool that can cache images on each of OpenShift nodes. As such, pre-pulling images can improve start times. See https://access.redhat.com/documentation/en-us/red_hat_openshift_dev_spaces/3.0/html-single/administration_guide/index#caching-images-for-faster-workspace-start.
- Choosing better storage type
Role: Administrator and user
Every workspace has a shared volume attached. This volume stores the project files, so that when restarting a workspace, changes are still available. Depending on the storage, attach time can take up to a few minutes, and I/O can be slow.
- Installing offline
Role: Administrator
Components of OpenShift Dev Spaces are OCI images. Set up Red Hat OpenShift Dev Spaces in offline mode (air-gap scenario) to reduce any extra download at runtime because everything needs to be available from the beginning. See https://access.redhat.com/documentation/en-us/red_hat_openshift_dev_spaces/3.0/html-single/administration_guide/index#installing-devspaces-in-a-restricted-environment-on-openshift.
- Optimizing workspace plug-ins
Role: User
When selecting various plug-ins, each plug-in can bring its own sidecar container, which is an OCI image. OpenShift pulls the images of these sidecar containers.
Reduce the number of plug-ins, or disable them to see if start time is faster. See also https://access.redhat.com/documentation/en-us/red_hat_openshift_dev_spaces/3.0/html-single/administration_guide/index#caching-images-for-faster-workspace-start.
- Reducing the number of public endpoints
Role: Administrator
For each endpoint, OpenShift is creating OpenShift Route objects. Depending on the underlying configuration, this creation can be slow.
To avoid this problem, reduce the exposure. For example, to automatically detect a new port listening inside containers and redirect traffic for the processes using a local IP address (
127.0.0.1), the Che-Theia IDE plug-in has three optional routes.By reducing the number of endpoints and checking endpoints of all plug-ins, workspace start can be faster.
- CDN configuration
The IDE editor uses a CDN (Content Delivery Network) to serve content. Check that the content uses a CDN to the client (or a local route for offline setup).
To check that, open Developer Tools in the browser and check for
vendorsin the Network tab.vendors.<random-id>.jsoreditor.main.*should come from CDN URLs.
8.3.2. Improving workspace runtime performance
- Providing enough CPU resources
Plug-ins consume CPU resources. For example, when a plug-in provides IntelliSense features, adding more CPU resources may lead to better performance.
Ensure the CPU settings in the devfile definition,
devfile.yaml, are correct:apiVersion: 1.0.0 components: - type: chePlugin id: id/of/plug-in cpuLimit: 1360Mi 1 cpuRequest: 100m 2- Providing enough memory
Plug-ins consume CPU and memory resources. For example, when a plug-in provides IntelliSense features, collecting data can consume all the memory allocated to the container.
Providing more memory to the plug-in can increase performance. Ensure about the correctness of memory settings:
-
in the plug-in definition -
meta.yamlfile in the devfile definition -
devfile.yamlfileapiVersion: v2 spec: containers: - image: "quay.io/my-image" name: "vscode-plugin" memoryLimit: "512Mi" 1 extensions: - https://link.to/vsix- 1
- Specifies the memory limit for the plug-in.
In the devfile definition (
devfile.yaml):apiVersion: 1.0.0 components: - type: chePlugin id: id/of/plug-in memoryLimit: 1048M 1 memoryRequest: 256M- 1
- Specifies the memory limit for this plug-in.
-
in the plug-in definition -
8.4. Troubleshooting network problems
This section describes how to prevent or resolve issues related to network policies. OpenShift Dev Spaces requires the availability of the WebSocket Secure (WSS) connections. Secure WebSocket connections improve confidentiality and also reliability because they reduce the risk of interference by bad proxies.
Prerequisites
- The WebSocket Secure (WSS) connections on port 443 must be available on the network. Firewall and proxy may need additional configuration.
Use a supported web browser:
- Google Chrome
- Mozilla Firefox
Procedure
- Verify the browser supports the WebSocket protocol. See: Searching a websocket test.
- Verify firewalls settings: WebSocket Secure (WSS) connections on port 443 must be available.
- Verify proxy servers settings: The proxy transmits and intercepts WebSocket Secure (WSS) connections on port 443.
Chapter 9. Adding a Visual Studio Code extension to a workspace
Previously, with the devfiles v1 format, you used the devfile to specify IDE-specific plug-ins and Visual Studio Code extensions. Now, with devfiles v2, you use a specific meta-folder rather than the devfile to specify the plug-ins and extensions.
9.1. OpenShift Dev Spaces plug-in registries overview
Every OpenShift Dev Spaces instance has a registry of default plug-ins and extensions. The Che-Theia IDE gets information about these plug-ins and extensions from the registry and installs them.
Check this OpenShift Dev Spaces registry project for an overview of the default plug-ins, extensions, and source code. An online instance that refreshes after every commit to the main branch, is located here. You can use a different plug-in or extension registry for Che-Theia if you don’t work in air-gapped environment: only the default registry is available there.
The plug-in and extension overview for Che-Code Visual Studio Code editor is located in the OpenVSX instance. Air gap is not yet supported for this editor.
9.2. Adding an extension to .vscode/extensions.json
The easiest way to add a Visual Studio Code extension to a workspace is to add it to the .vscode/extensions.json file. The main advantage of this method is that it works with all supported OpenShift Dev Spaces IDEs.
If you use the Che-Theia IDE, the extension is installed and configured automatically. If you use a different supported IDE with the Che-Code Visual Studio Code fork, the IDE displays a pop-up with a recommendation to install the extension.
Prerequisites
-
You have the
.vscode/extensions.jsonfile in the root of the GitHub repository.
Procedure
Add the extension ID to the
.vscode/extensions.jsonfile. Use a.sign to separate the publisher and extension. The following example uses the IDs of Red Hat Visual Studio Code Java extension:{ "recommendations": [ "redhat.java" ] }
If the specified set of extension IDs isn’t available in the OpenShift Dev Spaces registry, the workspace starts without the extension.
9.3. Adding plug-in parameters to .che/che-theia-plugins.yaml
You can add extra parameters to a plug-in by modifying the .che/che-theia-plugins.yaml file. These modifications include:
- Defining the plug-ins for workspace installation.
- Changing the default memory limit.
- Overriding default preferences.
9.3.1. Defining the plug-ins for workspace installation
Define the plug-ins to be installed in the workspace.
Prerequisites
-
You have the
.che/che-theia-plugins.yamlfile in the root of the GitHub repository.
Procedure
Add the ID of the plug-in to the
.che/che-theia-plugins.yamlfile. Use the/sign to separate the publisher and plug-in name. The following example uses the IDs of Red Hat Visual Studio Code Java extension:- id: redhat/java/latest
9.3.2. Changing the default memory limit
Override container settings such as the memory limit.
Prerequisites
-
You have the
.che/che-theia-plugins.yamlfile in the root of the GitHub repository.
Procedure
-
Add an
overridesection to the.che/che-theia-plugins.yamlfile under theidof the plug-in. Specify the memory limit for the extension. In the following example, OpenShift Dev Spaces automatically installs the Red Hat Visual Studio Code Java extension in the OpenShift Dev Spaces workspace and increases the memory of the workspace by two gigabytes:
  - id: redhat/java/latest
    override:
      sidecar:
        memoryLimit: 2Gi
9.3.3. Overriding default preferences
Override the default preferences of the Visual Studio Code extension for the workspace.
Prerequisites
-
You have the
.che/che-theia-plugins.yamlfile in the root of the GitHub repository.
Procedure
-
Add an
overridesection to the.che/che-theia-plugins.yamlfile under theidof the extension. Specify the preferences in the
Preferencessection. In the following example, OpenShift Dev Spaces automatically installs Red Hat Visual Studio Code Java extension in the OpenShift Dev Spaces workspace and sets thejava.server.launchModepreference toLightWeight:- id: redhat/java/latest override: preferences: java.server.launchMode: LightWeight
You can also define the preferences in the .vscode/settings.json file, either by changing the preferences in the UI of your IDE or by adding them to the .vscode/settings.json file:
{
"my.preferences": "my-value"
}
9.4. Defining Visual Studio Code extension attributes in the devfile
If it’s not possible to add extra files in the GitHub repository, you can define some of the plug-in or extension attributes by inlining them in the devfile. You can use this procedure with both .vscode/extensions.json and .che/che-theia-plugins.yaml file contents.
9.4.1. Inlining .vscode/extensions.json file
Use .vscode/extensions.json file contents to inline the extension attributes in the devfile.
Procedure
-
Add an
attributessection to yourdevfile.yamlfile. -
Add
.vscode/extensions.jsonto theatributessection. Add a|sign after the colon separator. Paste the contents of the
.vscode/extensions.jsonfile after the|sign. The following example uses Red Hat Visual Studio Code Java extension attributes:schemaVersion: 2.2.0 metadata: name: my-example attributes: .vscode/extensions.json: | { "recommendations": [ "redhat.java" ] }
9.4.2. Inlining .che/che-theia-plugins.yaml file
Use .che/che-theia-plugins.yaml file contents to inline the plug-in attributes in the devfile.
Procedure
-
Add an
attributessection to yourdevfile.yamlfile. -
Add
.vscode/extensions.jsonto theatributessection. Add a|sign after the colon separator. Paste the content of the
.che/che-theia-plugins.yamlfile after the|sign. The following example uses Red Hat Visual Studio Code Java extension attributes:schemaVersion: 2.2.0 metadata: name: my-example attributes: .che/che-theia-plugins.yaml: | - id: redhat/java/latest