
Chapter 2. Metrics
2.1. Viewing metrics in persistent storage dashboard
To view the persistent storage dashboard, click Home → Overview → Persistent Storage in OpenShift Web Console.
Figure 2.1. Example of Persistent Storage Overview Dashboard for internal mode

The following cards on Persistent Storage dashboard provides the metrics based on deployment mode (internal or external):
- Details card
The Details card shows the following:
- Service Name
- Cluster name
- The name of the Provider on which the system runs (example: AWS, VSphere, ‘None’ for Bare metal)
- Mode (deployment mode as either Internal or External)
- OpenShift Container Storage operator version.
- Inventory card
- The Inventory card shows the number of active nodes, PVCs and PVs backed by OpenShift Container Storage provisioner. On the left hand side of the card, total number of storage nodes, PVCs and PVs are displayed. While on the corresponding right hand side of the card, number of storage nodes in Not Ready state, count of PVCs in Pending state and PVs in Released state are shown.
For external mode, the number of nodes will be 0 by default, since there are no dedicated nodes for OpenShift Container Storage.
- Status card
This card shows whether the cluster is up and running without any errors or is experiencing some issues.
For internal mode, Data Resiliency indicates the status of data re-balancing in Ceph across the replicas. When the internal mode cluster is in a warning or error state, the Alerts section is shown along with the relevant alerts.
For external mode, Data Resiliency and alerts will not be displayed
- Capacity breakdown card
In this card, you can view graphic breakdown of capacity per project, storage classes and pods. You can choose between Projects, Storage Classes and Pods from the drop down menu on the top of the card. These options are for filtering the data shown in the graph.
Option Display Projects
The aggregated capacity of each project which is using the OpenShift Container storage and how much is being used.
Storage Classes
Will show aggregate capacity based on OpenShift Container Storage based storage classes.
Pods
All the pods trying to use the PVC backed by OpenShift Container Storage provisioner.
For external mode, this graph shows only the used capacity details.
- Utilization card
The card shows Used Capacity, input/output operations per second, latency, throughput, and recovery information for the internal mode cluster.
For external mode, this card shows only the used and requested capacity details for that cluster.
2.2. Viewing metrics in object service dashboard
To view the object service dashboard, click Home → Overview → Object Service in OpenShift Web Console.
Figure 2.2. Example of Object Service Overview Dashboard
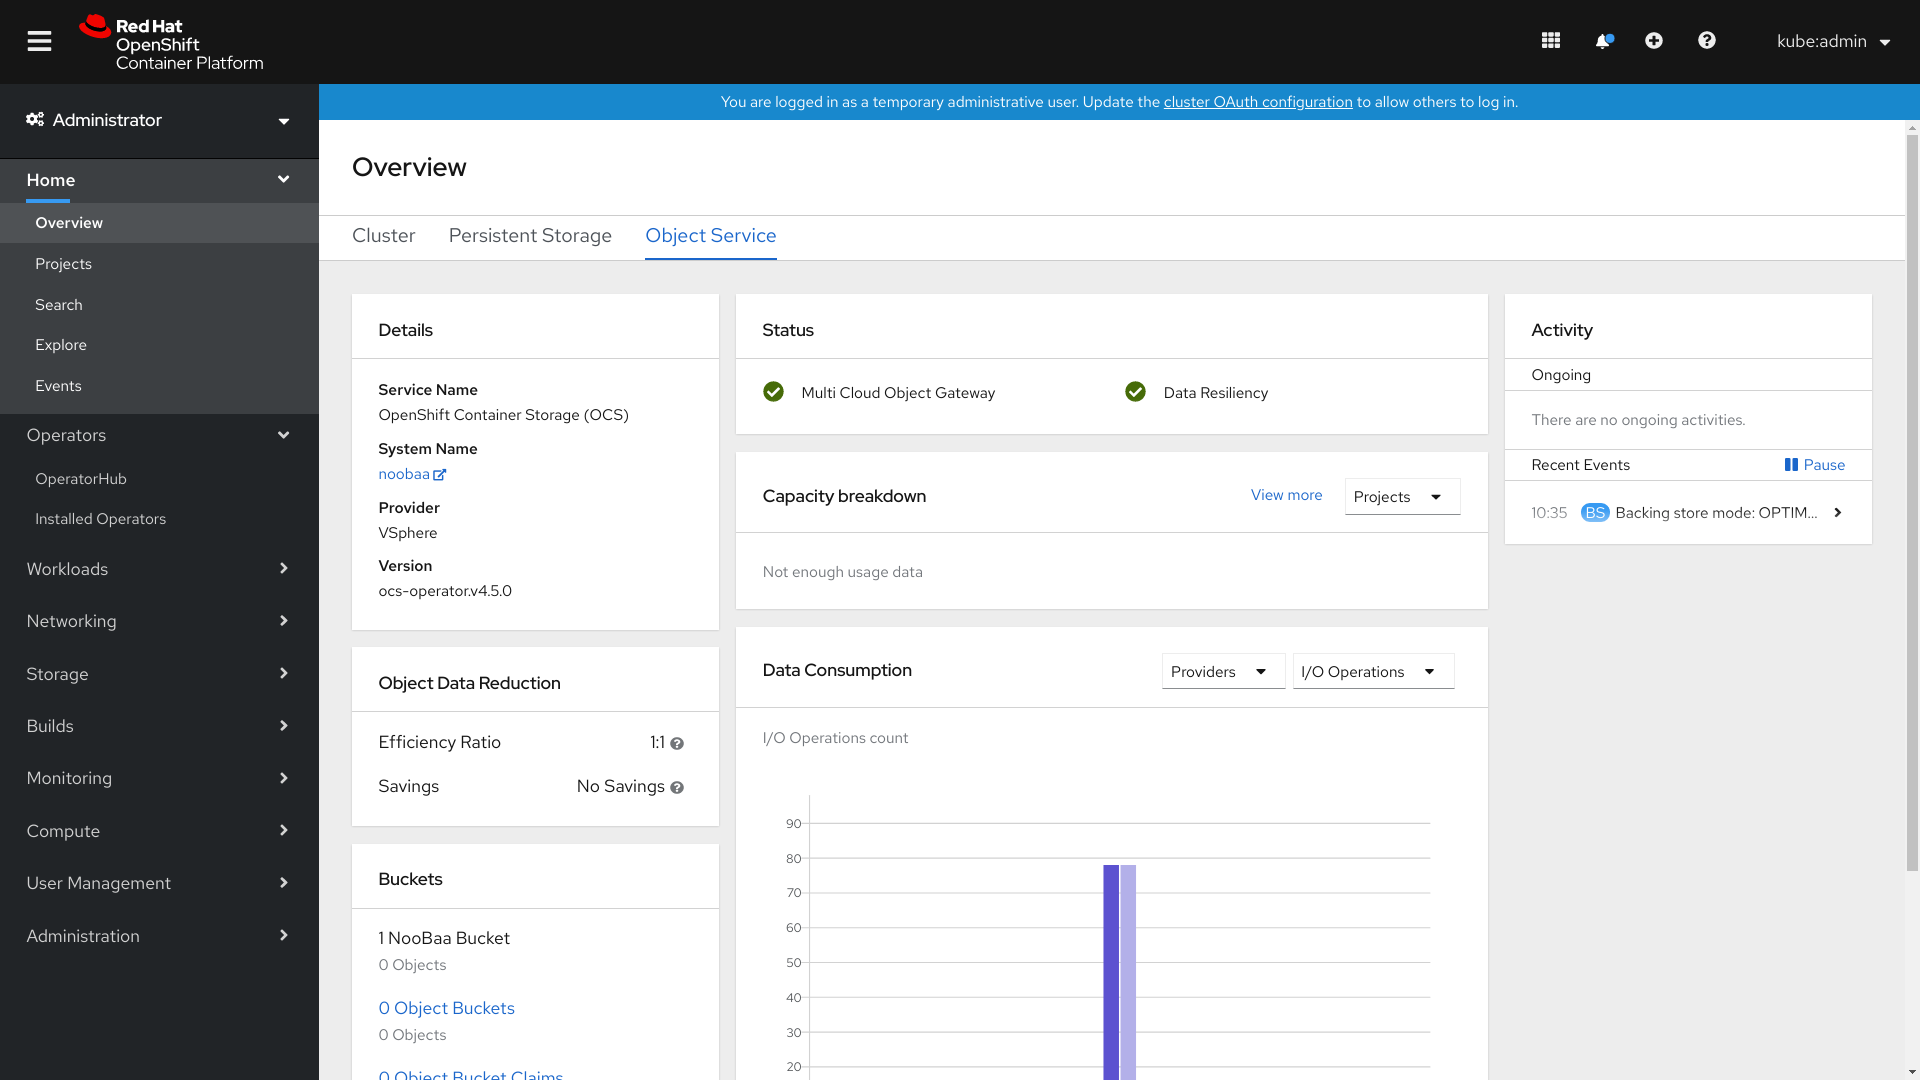
The following metrics are available in Object Service dashboard:
- Details card
This card shows the following information:
- The Multicloud Object Gateway (MCG) service name.
- The system name, which is also a hyperlink to the MCG management user interface.
- The name of the provider on which the system runs (example: AWS, VSphere, ‘None’ for Baremetal)
- OpenShift Container Storage operator version.
- Object Data Reduction card
- In this card you can view how the MCG optimizes the consumption of the storage backend resources through deduplication and compression and provides you with a calculated efficiency ratio (application data vs logical data) and an estimated savings figure (how many bytes the MCG did not send to the storage provider).
- Buckets card
Buckets are containers maintained by the MCG to store data on behalf of the applications. These buckets are created and accessed through object bucket claims (OBCs). A specific policy can be applied to bucket to customize data placement, data spill-over, data resiliency, capacity quotas, and so on.
In this card, information about object buckets (OB) and object bucket claims (OBCs) is shown separately. OB includes all the buckets that are created using S3 or the user interface(UI) and OBC includes all the buckets created using YAMLs or the command line interface (CLI). The number displayed on the left of the bucket type is the total count of OBs or OBCs. The number displayed on the right shows the error count and is visible only when the error count is greater that zero. You can click on the number to see the list of buckets that has the warning or error status.
- Resource Providers card
- This card displays a list of all Multicloud gateway(MCG) resources that are currently in use. Those resources are used to store data according to the buckets policies and can be a cloud-based resource or a bare metal resource.
- Status card
This card shows if the system is up and running without any issues. When the system is in a warning or error state, the alerts section is shown and the relevant alerts are displayed there. You can click on the links on the right of the alerts to get more information about the issue. For information about health checks, see Cluster health.
Data resiliency in the status card, indicates if there is any resiliency issue regarding the data stored through MCG.
- Capacity breakdown card
- In this card you can visualize how applications consume the object storage through the MCG. The card, through its drop-down box, offers graphic breakdowns per project and bucket class. You can choose between Projects and Bucket Class options from the drop down menu on the top of the card. These options are the filtering options that change the data shown in the graph.
Savings are two fold: Capacity savings (applies to bare metal and cloud based storage providers) and egress traffic savings (applies to storage cloud based providers).
- Data Consumption card
In this card, you can view physical usage (raw storage), logical usage (usable storage), I/O, and egress traffic per provider and MCG account.
For MCG accounts, you can view the I/O operations and logical used capacity. For providers, you can view I/O operation, physical and logical usage, and egress.
The following table provides the different key performance indicators (KPIs) that you can view based on your selection from the drop down menus on the top of the card:
Consumer types KPIs Chart Display Accounts
I/O operations
Displays read and write I/O operations for the top five consumers. The total reads and writes of all the consumers is displayed at the bottom. This information helps you monitor the throughput demand (IOPS) per application or account.
Accounts
Logical Used Capacity
Displays total logical usage of each account for the top five consumers. This helps you monitor the throughput demand per application or account.
Providers
I/O operations
Displays the count of I/O operations generated by the MCG when accessing the storage backend hosted by the provider. This helps you understand the traffic in the cloud so that you can improve resource allocation according to the I/O pattern, thereby optimizing the cost.
Providers
Physical vs Logical usage
Displays the data consumption in the system by comparing the physical usage with the logical usage per provider. This helps you control the storage resources and devise a placement strategy in line with your usage characteristics and your performance requirements while potentially optimizing your costs.
Providers
Egress
The amount of data the MCG retrieves from each provider (read bandwidth originated with the applications). This helps you understand the traffic in the cloud to improve resource allocation according to the egress pattern, thereby optimizing the cost.