
Red Hat Training
A Red Hat training course is available for Red Hat JBoss Operations Network
5. Events
Metric data are collected according to a schedule. However, some actions occur on a resource sporadically, such as sudden system shutdowns. These are events. Since event data can be generated randomly, events are sent to agents immediately when they are detected.
5.1. Events, Logs, and Resources
Operating and some server types keep their own log files and register a steady stream of information about incidents for that resource, from simple debug information to critical errors. Metrics are collected on a (more or less) set schedule. Events are entirely random, because they are based on real actions as they occur. Events, then, give a different perspective on resource performance.
Events monitoring tracks those streaming log file messages. In a sense, JBoss ON event monitoring is a filtered log viewer. When events are enabled, all of the log messages flow through JBoss ON's event viewer. However, the types of messages that JBoss ON records and displays can be limited in the event configuration so that only certain types of messages or messages matching certain strings are included in the events view.
Three resource types record and display events:
- Windows (Windows event logs)
- Apache server (log files)
- JBoss AS server (log files)
Note
Events must be enabled before they become active.
Default events are taken from standard log files. Custom resource types can identify event sources in logs or in asynchronous messaging systems such as a JMX notification or a JMS messaging system.
5.2. Event Date Formatting
JBoss ON expects log messages to follow the log4j log pattern, over all.
date severity [class] message
The date format is configurable when event monitoring is enabled. For custom logs, a custom pattern can be added. If no date format is given, then the three standard formats used by log4j are tried.
YYYY-mm-dd HH:mm:ss,SSS
HH:mm:ss,SSS
dd MM yyyy HH:mm:ss,SSS
The severity must be next. It can be plain, surrounded by brackets, or surrounded by parentheses.
date SEVERITY [org.foo.bar] my message
date [SEVERITY] [org.foo.bar] my message
date ( SEVERITY ) [org.foo.bar] my message
After the severity, there are no real constraints on the format of the log entry. If classes or other identifiers are passed, they are properly displayed.
5.3. Defining a New Event
Events are only recognized by the monitoring service if events logging is properly enabled for the specific service being logged. This requires creating a log event for the log or system service, specifying a log path on the resource, and setting a date format which matches the format for the log.
- Click the Inventory tab in the top menu.
- Select the resource type in the Resources menu table on the left, and then browse or search for the resource.

- Click the Inventory tab on the resource entry.
- Select the Connection Settings subtab.
- Click green plus icon under the Events Log section.

- Set the path to the log file, enable the event entry, and set the date format. Other properties about the log file, such as whether it is a file or listener and a message parser, can also be configured.

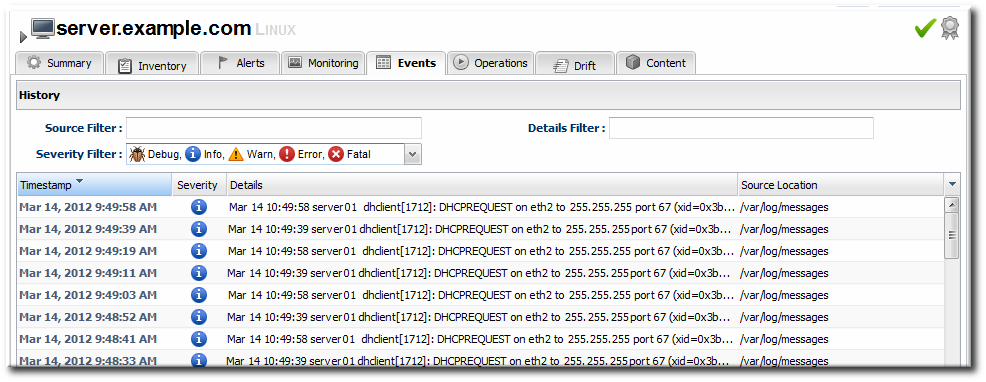
5.4. Viewing Events
- Click the Inventory tab in the top menu.
- Select the resource type in the Resources menu table on the left, and then browse or search for the resource.
- Click the Events tab on the resource entry. Events can be filtered by severity (debug, info, warn, error, and fatal).
- Click the specific event for further details.
5.5. Detailed Discussion: Event Correlation
There are a lot of moving pieces in IT infrastructure, and one change can cause a cascade of results. One factor in being able to respond to events and manage infrastructure is the ability to correlate an event with its cause.
While there is not an exact way to pinpoint what change caused what event or alert, there is a way to help visualize how unrelated JBoss ON elements — alerts, configuration changes, event logs, drift detection, or inventory changes — might be related. Each resource has a Timeline area on its Summary tab. This collects all of the major operations that have occurred on that resource, either through JBoss ON or as detected by JBoss ON.
The thing to look for is clusters. For example, in this case, there was a configuration change on the JBoss server, and shortly after there was a critical alert and a simultaneous error in the JBoss server's logs. That is a reasonable indication that the configuration change caused a performance problem.
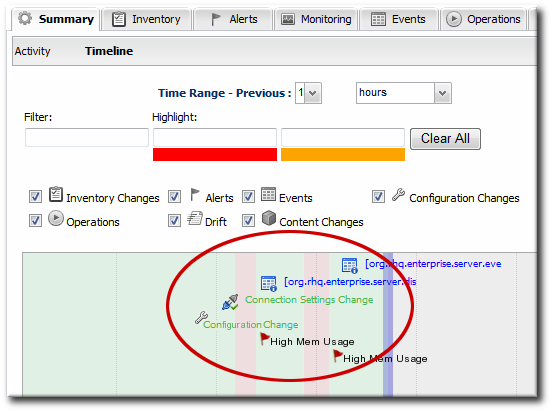
Figure 13. Resource Timeline Cluster